 Caterina Negulescu
 Agathe Roullé
94% of researchers rate our articles as excellent or good
Learn more about the work of our research integrity team to safeguard the quality of each article we publish.
Find out more
ORIGINAL RESEARCH article
Front. Built Environ., 30 March 2022
Sec. Earthquake Engineering
Volume 8 - 2022 | https://doi.org/10.3389/fbuil.2022.850300
This article is part of the Research TopicEnergy-Based Seismic EngineeringView all 8 articles
Mayotte seismic crisis started on 10 May 2018, with a first felt earthquake, quickly followed by many others, that surprised inhabitants. Before 10 May 2018, Mayotte Island, part of the volcanic Comoros archipelago in the North Mozambique Channel of the Indian Ocean was not considered as a significantly seismically active area, and hence the structures were designed without or very recently with a low seismic code. In this study, we pay particular attention to existing seismic records of earthquakes with a magnitude greater than 5, and we try to establish their dangerousness for existing buildings. As the magnitude is not very large, it is difficult to observe and classify the slight to moderate damages using the drift parameter. It is for this reason that in this study we try to consider the shift of the inelastic period and the dissipated energy, estimated using wavelet transform, in order to estimate the damage. We have modeled a target building and calculated its dynamic response using the recordings of the 46 strongest earthquakes of the current crisis as the input. The dynamic calculations were performed using open source finite element software, Opensees © Berkeley. We analyzed the dynamic response at the top of the building in terms of the period of vibration, energy dissipated, and drift. We used the aforementioned 46 recordings from two different seismological stations in terms of site effects: YTMZ station, considered as rock, and MILA station, which shows strong site effects and therefore the strongest recordings in terms of acceleration. We try to find a correlation between the wavelet energy dissipation and the observational damage degree or drift-based damage degrees. We found out that about 25% of the 46 earthquakes selected on soils with site effects (MILA station) have building response parameters corresponding to degrees of damage D1 and D2 of the EMS-98 scale: negligible to light damage (no structural damage and slight non-structural damage) and moderate damage (light structural damage and moderate non-structural damage). This damage can appear for relatively low peak ground acceleration values (e.g., about 0.3 m/s2 for some earthquakes). Furthermore, the damage assessment results from the three damage parameters for the target gravity design building are compared and discussed.
The improved methodology to quantify seismic risk and loss assessment in reinforced concrete buildings is still an important and actual issue either by improving large-scale methods as the vulnerability index framework (Kassem and Ozturk, 2021; Kassem et al., 2022) or by assessing new damage identification parameters. There are many studies on damage identification and health monitoring of structural and mechanical systems from changes in their vibration characteristics. Doebling et al. (1996) did one of the first literature reviews. Attempts to detect seismic damage in buildings from the shift of the (inelastic) period is a challenging and very complicated problem that has been also investigated in several studies (e.g., Trevlopoulos and Guéguen 2016; Goulet et al., 2015; Di Trapani and Malavisi, 2019). Using wavelet transform to evaluate seismic damage is an idea that has also been examined in the recent past (Bayissa et al., 2008; Li et al., 2009; Hanteh and Rezaifar, 2021; Quiñones et al., 2015; Kaloop and Hu, 2016; He et al., 2021). In this study, the aim is not the presentation of the wavelet based approach but applying it to a simple yet realistic case-study occurred during the Mayotte seismic crisis. Its application to one numerical model subjected to real recorded earthquakes on rock and soft soil during the Mayotte crisis brings us information about the reliability of this parameter with respect to the response of building. Currently, we have several ways of estimating the damage which are related, in one way or another, by using two different approaches: on the one hand, by doing numerical analyzes, we use the drift or a numerical parameter, and on the other hand, by making observations of damage to buildings after the earthquake, we used the damage classes EMS-98 (Grunthal, 1998). It is a challenge to find a correlation or correspondence between the description of damage from physical and numerical parameters and the observational damage. Buildings have their own dynamic characteristics (vibration periods and vibration modes) which depend on the shape, mass, and stiffness of the building. This is an intrinsic characteristic that does not change as long as the building is not damaged. These building characteristics can be calculated by measuring the vibrations in the building with at least two sensors installed at the bottom and top of the building. Vibration measurements can be made during an earthquake or outside the earthquake period (under an ambient vibration). These characteristics can also be calculated by utilizing numerical simulation via dynamic analysis: this is presented here using the real signals, described in Section 3, as the input acceleration. In order to correlate the methods based on numerical calculations and methods based on observational studies, European Macroseismic Scale (EMS-98), the RISK-UE project proposes displacement thresholds on the capacity curve, which could be assimilated to the damage levels of the Macroseismic European Scale (EMS-98). The damage levels of RISK-UE, Sd1, Sd2, Sd3, and Sd4 would correspond to the damage D1, D2, D3, and respectively, D4 and D5 of the European Macroseismic Scale (EMS-98). RISK-UE proposes mathematical relations, based on the yielding and ultimate displacements, to find the limits of the displacements of the capacity curve, which would correspond to a change of degrees of damage. In order to correlate the methods based on the measurement of physical parameters after the earthquake and the methods based on observational studies (EMS-98), several studies have focused on this subject (e.g., Dunand et al., 2004; Todorovska and Trifunac, 2007; Trevlopoulos and Guéguen, 2016). Goulet et al. (2015) carried out an important work of gathering and homogenization of the studies that potentially are very useful when one aims at connecting vibration-based SHM (structural health monitoring) to EMS-98. In this article, we focus our research on period modification and wavelet-based energy calculation during an earthquake. Wavelet-based energy is estimated on the earthquake record on the top of the structure, and the ambition in the future is to make this parameter online with the energy dissipated by the structure during the damage. If so, this parameter can be a useful tool in the establishment of the energy-based seismic-engineering approach.
The method used is divided into two phases:
➢ Phase 1: calculation of the building response for each accelerogram (raw results), and
➢ Phase 2: correlation between the building response and the damage estimate.
The method used consists, in Phase 1, in applying real seismic recordings at the ground level to a typical building (geometrically representative of individual housing in Mayotte) in order to estimate its dynamic response. The work was carried out as follows (Figure 1):
1) Selecting the input accelerograms according to the following criteria:
a) signals corresponding to an earthquake of magnitude greater than five (46 earthquakes), and
b) signals recorded by two seismic stations with different site conditions: YTMZ (rock) and MILA (site effect).
2) To study differentially the accelerograms recorded at the rock (YTMZ station) and the accelerograms recorded at a site effect station (MILA station).
3) To create a numerical model of a two-storey building to which the recorded accelerograms are applied as input seismic excitations.
4) To study the dynamic response of the building to seismic stress in terms of (i) period of vibration, (ii) energy dissipated during the earthquake, and (iii) maximum displacement at the top of the building during the earthquake.
5) Compare the building responses from one group to another and from one station to another.
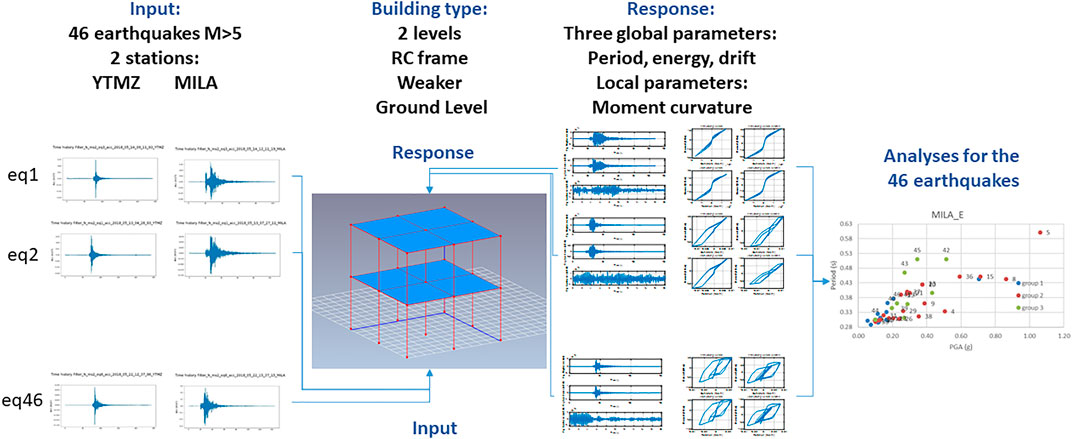
FIGURE 1. Method applied for the estimation of the dynamic response of the building to 46 earthquakes recorded on two seismological stations YTMZ and MILA in Mayotte.
Phase 2 of the method consists of relating the response of the building in terms of the vibration period and energy, to a degree of damage (EMS-98). Generally, there are two ways of doing this:
- relating the damage levels to the results of numerical analyses (e.g., the building capacity curve) expressed in terms of the vibration period or energy, and
- using existing studies that have compared the period of vibration of a damaged building with the degree of damage of the building after an earthquake; these studies are very interesting and have a comparative value. However, at the present, there are two biases in the use of these studies: (i) it is very rare, in past earthquakes, that a building already damaged has been previously measured (often to establish its “initial period”, buildings of the same typology that are not damaged are measured), and (ii) these studies are very dependent on the type of building but also on the construction mode applied locally.
In this study, we used dynamic building response of 46 earthquakes of magnitude greater than five recorded in Mayotte during the seismo-volcanic crisis initiated in May 2018 as the input data for our numerical simulations (Supplementary Table S1 from Supplementary Material). The earthquake of 15 May 2018, of magnitude Ml = 5.8, is the most important earthquake of the current crisis. It was very strongly felt by the population. In addition, several property owners reported damage to their buildings following this earthquake. A mission of the Groupe d'Intervention Macrosismique (Sira et al., 2018) intervened in June 2018 to establish a system for classification of earthquakes according to the EMS 98. However, due to the characteristics of the swarming seismic sequence that was observed during the first few months of the crisis, it is not possible to establish with certainty whether the damage observed was due solely because of the earthquake of May 15 or whether it was also the result of the accumulation of tremors. The report also indicates the difficulty in some cases of differentiating between seismic and non-seismic causes, such as foundation movements due to landslides. We have processed the signals of these 46 earthquakes recorded on two different stations YTMZ and MILA considering the N and E components of each recording. The YTMZ station is considered to be positioned on rocky soil, while the MILA station is considered to be positioned on site effect conditions. The YTMZ station, located on recent volcaniclastic formations with little alteration, is considered as the reference station since the beginning of the seismic-volcanic crisis. The H/V noise spectral ratio shows a value close to one for most of the frequency range and a slight amplification around 2.5 Hz. The MILA station, located on a hill of about 50 m height made of isalterites, presents two close peaks at 1.6 and 2.2 Hz on the H/V ratios, both for the noise and earthquake spectra. Measurements made at the site yield an S-wave velocity of approximately 290 m/s between 0 and 15 m depth. The VS.30 valuewas estimated at about 350 m/s Figure 2 and compared the peak ground acceleration (PGA) values for the 46 earthquakes, for the N and E components, recorded at the YTMZ (considered to be at rock) and MILA (with site effects) stations. We observe that some earthquakes have much higher peak ground acceleration (PGA) values recorded at MILA than at YTMZ, but this is not systematic despite the difference in the soil type (with and without site effects). This reflects a large variability in the observed seismic motion, depending particularly on the source and propagation parameters.
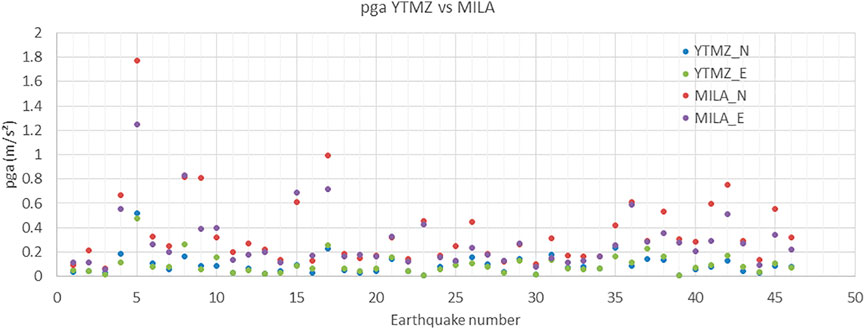
FIGURE 2. Comparison of PGA between YTMZ (approximated to rock) and MILA (considered to be on site effects) for 46 earthquakes and the N and E components.
In Section 5, the earthquakes Eq5, Eq17, and Eq42 are used for the IDA. Figure 3 shows the waves by showing the acceleration time-histories and the frequency characteristics of earthquakes by showing acceleration response spectra and energy spectrum for the recordings at the MILA station.
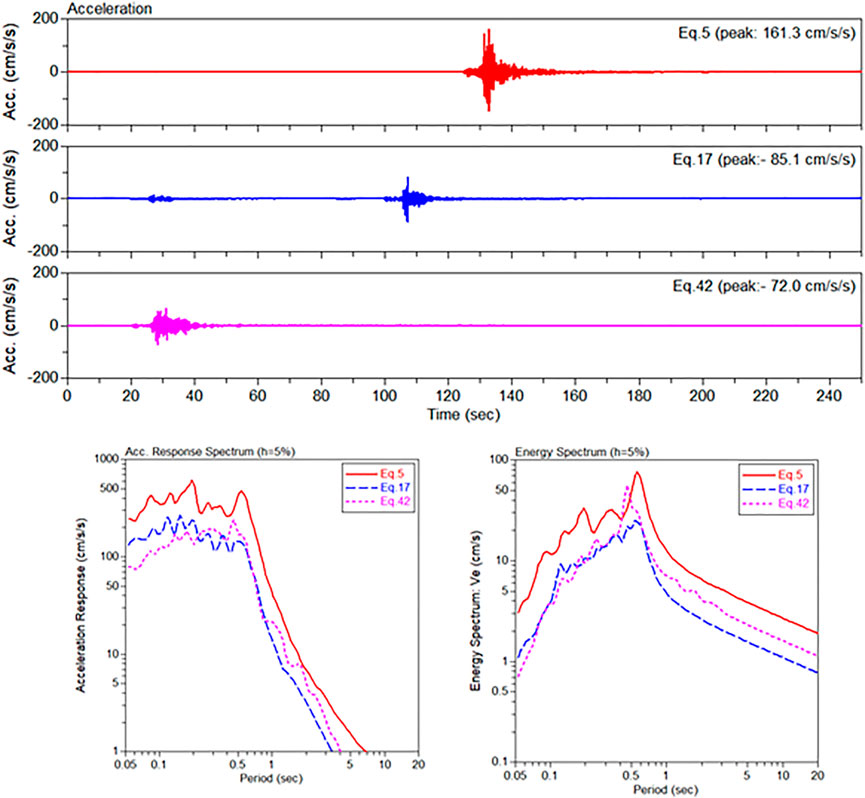
FIGURE 3. Acceleration time-histories, acceleration response spectra, and energy spectrum for the earthquakes 5, 17, and 42 recorded at the MILA station.
For the numerical modelling of the building, we used the open-source software OpenSees (Open System For Earthquake Engineering Simulation (c) Copyright 1999–2016 The Regents of the University of California) developed by the Pacific Earthquake Engineering Research (PEER, 2006) OpenSees to calculate the dynamic response of a building. We chose a simple RC frame building with a light reinforcement. The building has two levels, two bays in the longitudinal direction, and two bays in the transverse direction (Figure 4). The geometry of this building was chosen in order to represent, as well as a possible, a typology of residential buildings common in Mayotte. In addition, in order to take into account certain constructional problems present in Mayotte and likely to increase the vulnerability of the building, we have introduced several structural details: (i) weakly reinforced columns and beams (corresponding to a calculation under own weight) in order to represent a building designed without a seismic code, (ii) the first floor is slightly less rigid than the second to represent transparency and the presence of piles, and (iii) addition of a small torsion effect to represent a non-symmetrical wall distribution. To model the structural elements, we used fiber sections of the beams and columns available in the OpenSees software (Figure 4). All elements that compose the building resistance (beams and columns) are inelastic elements available in the OpenSees software. They are based on force formulation. The non-linearity of the concrete material is represented by a uni-axial material model (Kent and Park, 1971) made of concrete with degraded linear unloading/reloading stiffness according to the work of Karsan-Jirsa and no tensile strength. Since it is assumed that there is no adequate shear reinforcement in the columns and beams of the buildings, the confining effect of the core concrete is minimized. The first three periods of the vibration of the building are 0.28, 0.28, and 0.26 s, respectively. The first two periods of the vibration are the periods responding to two horizontal directions (the first named “longitudinal” and the second one named “transversal” direction). The third one is corresponding to a torsional mode.
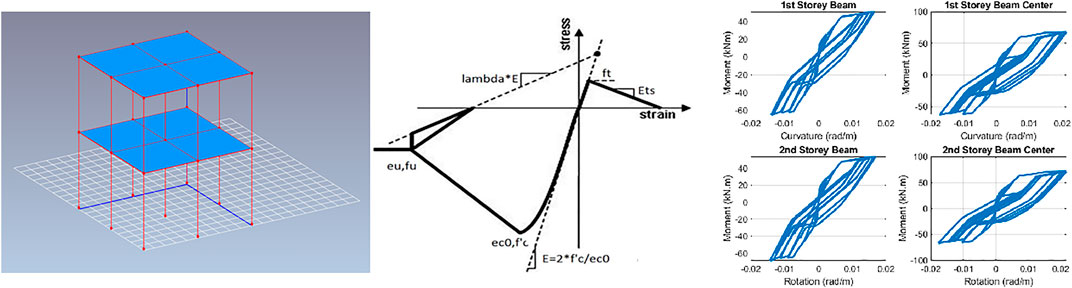
FIGURE 4. 3D view of the model, uni-axial material model, and element response (using software OpenSees).
This section introduces a brief description of the wavelet transform. However, authors strongly recommend to readers to refer the key references to understand the theoretical background of the method (Chui, 1992). CWT can be used to decompose a function x(t) into frequency–time domain with respect to the mother wavelet function ψ(t), as defined in the following form:
where W(a,b) are the CWT coefficients that represent the measure of the similitude between the function x(t) and the wavelet at the time b that localizes the wavelet function in the time domain and the scale a; ψ*(t) represents the complex conjugate of the mother wavelet function ψ(t).
The complex Morlet wavelet, which is commonly used for continuous wave transform as a basic function, can be expressed as in Eq. 2, and its Fourier transform can be expressed as in Eq. 3. The band with parameter Fb is selected in order to optimize the time and frequency resolution.
where f and fc are Fourier frequency and central wavelet frequency.
Furthermore, using the CWT method, which decomposes the signal x(t) into time–frequency resolution, wavelet energy for each scale ai can be estimated as (Minh-Nghi and Lardiés, 2006)
where
WT has scaling factors. The scalogram of WT (similar to the spectrogram for the Fourier transform) is a measure of the energy distributed over the time shift bj and scaling factor ai of the signal (Kaloop and Hu, 2016). In other words, E(ai) is the summation of the square modulus of wavelet coefficients over the number of translations j for a given value of scale ai. As a consequence, the total wavelet energy can be obtained as given in
where Et is the total wavelet energy associated with the acceleration response at the top storey of a structure during seismic excitation, and it is estimated using Eqs 4, 5. It is important to note that the top storey response is selected to take into account the effects of the maximum applied response to the damage index.
We performed dynamic analysis for the 46 strongest earthquakes recorded on two different stations with different site conditions. For each earthquake, the component E and the component N were used as input for dynamic analysis. For the calculation of the inelastic vibration period and the dissipated energy, we applied the wavelet method (Wijesundara et al., 2015; Negulescu and Wijesundara, 2019) on the acceleration time history response at the top of the building. The dynamic response of the building makes it possible to study the following three global parameters [(Figure 5) for the N component and (Figure 6) for the E component]:
• The inelastic vibration period calculated by wavelet transform,
• The dissipated energy calculated by wavelet transform,
• The maximum displacement of the building (and/or the displacement between the top and the bottom of the building, hereinafter called the drift in %).
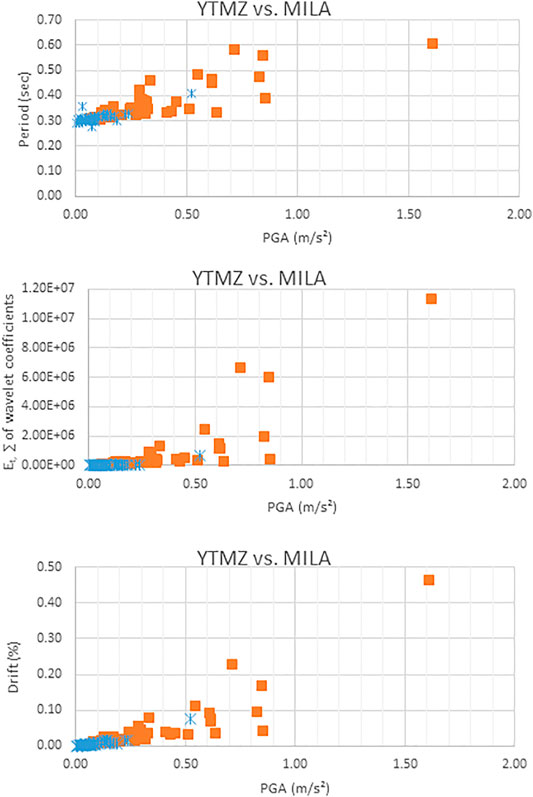
FIGURE 5. Comparisons between the building’s response (in period, wavelet energy, and drift) for the 46 earthquakes recorded at the YTMZ station and at the MILA station (for the N component); blue circle = YTMZ and orange square = MILA.
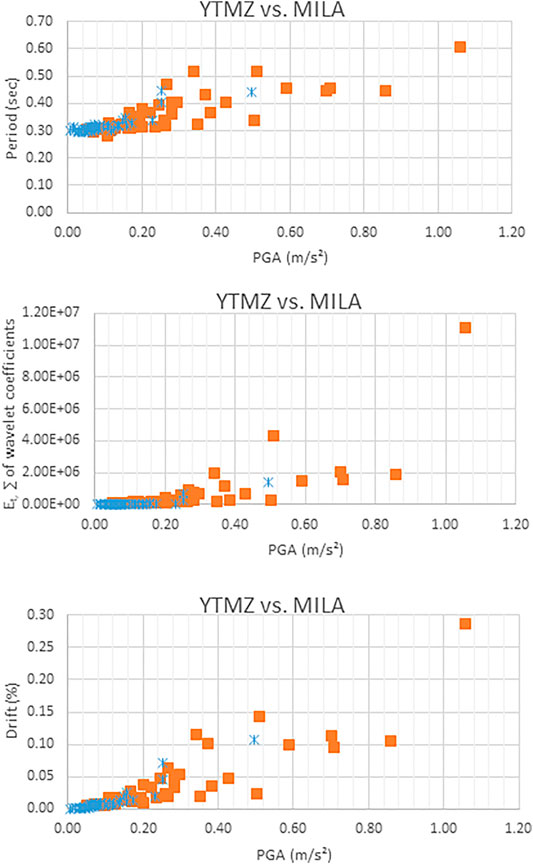
FIGURE 6. Comparisons between the building’s response (in period, energy, and drift) for the 46 earthquakes recorded at the YTMZ station and at the MILA station (for the E component); blue circle = YTMZ and orange square = MILA.
In addition to the global parameters, we also look to the reaction in the sections of structural elements:
• Two columns on the first floor and two columns on the second floor
• Two beams on the first floor and two beams on the second floor.
In general, we can observe that the responses for the earthquakes recorded at the MILA station are much greater than those of the YTMZ station. Of course, this observation goes hand in hand with the fact that the PGA values recorded at the MILA station are greater than those of the YTMZ station for the same earthquakes. As mentioned previously, this is due to the ground conditions below the station: for YTMZ, the PGA are lower than 0.25 m/s2 (with the exception of the strongest earthquake for which the PGA is of the order of 0.5 m/s2) while for MILA, the values of PGA can exceed 1 m/s2. We observe that the greater the PGA, the greater the variability of the response parameters, being valid for all the three response parameters of the building studied. Regarding the vibration period, we observe for YTMZ a slight increase in this period with values less than 0.35 s (the initial period of the building being at 0.28 s). The response is much greater for earthquakes recorded at the MILA station, for which the period increases to 0.6 s. The energy dissipated is straightforwardly linear until a PGA of 0.2 m/s2, becoming variable after this value.
The method N2, introduced initially by Fajfar (1999), which compares the resistance of the building to the imposed load, is presented in the appendix of design rules (Eurocode 8 (EC8), 2005). The capacity curve makes it possible to determine the performance point (which represents the intersection between the capacity curve and the response spectrum) of the building for a given seismic movement. The response spectrum is represented in the acceleration–displacement (Sd, Sa) graph, and the capacity curve is also represented in the same graph for comparison purposes. Depending on the displacement position in the capacity curve, we can deduce the expected state of damage (RISK-UE, 2003). In order to correlate the methods based on numerical calculations and the methods based on empirical studies, the RISK-UE project proposes displacement thresholds on the capacity curve which could be assimilated to the damage levels of the EMS-98. The damage levels of RISK-UE, Sd1, Sd2, Sd3, and Sd4 would correspond to the damage D1, D2, D3, and respectively, D4 and D5 of the European Macroseismic Scale (EMS-98).
First, we calculate the capacity curve of our target building (which is a system with several degrees of freedom, MDDL) following a nonlinear static analysis (push-over analysis). The capacity curve, therefore, relates the displacement at the top of the building which is a system with several degrees of freedom (MDDL) with the shear force generated at the base of the building by the applied horizontal force. We, therefore, obtained a capacity curve for a system with several degrees of freedom (MDDL) expressed in the force–displacement graph. In order to be able to compare the capacity of the building to the seismic aggression expressed in the form of a response spectrum (spectral acceleration - spectral displacement: Sa-Sd), we applied the following transformations to the capacity curve: (i) conversion of the response to multiple degrees of freedom (MDDL) to a response to a degree of freedom (1DDL), (ii) conversion of the axes of the capacity curve, (iii) bi-linearization of the real curve, and (iv) determine the periods corresponding to the key points of the capacity curve. We obtain the capacity curve presented in Figure 7. The horizontal axis is the displacement corresponding to an equivalent one degree of the freedom system.
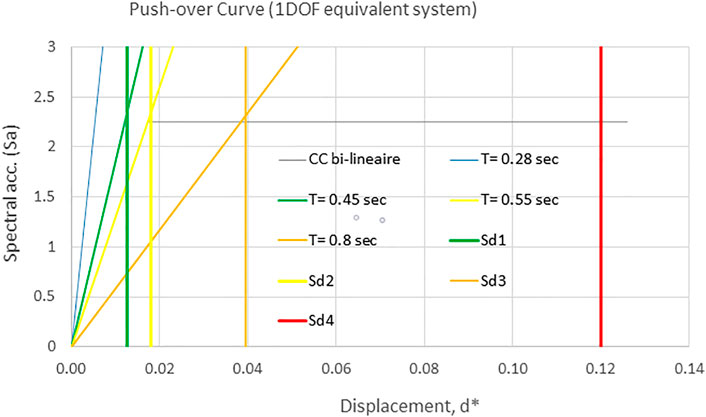
FIGURE 7. Capacity curve of a 1DOF equivalent system–indication of the different damage states from © RISK-UE and the different vibration periods corresponding to different damage states.
We devote this section to more detailed investigations of accelerograms for which the building response parameters (displacement, period, and energy) are either stronger or smaller than earthquakes with comparable PGA values. For that, we carried out incremental dynamic analyzes (IDA) starting from the accelerograms “Eq5, Eq17, and Eq42” which present particular values for the parameter period and dissipated energy (the number of earthquake in Supplementary Material, Supplementary Table S1).
Figure 8 compares the response in IDA for these three earthquakes: Eq5, Eq17 and Eq42. We observe a variability of the building response for the same PGA values; this is the inter-signal variability (“record-to-record variability”). For Eq42, we have a response in period by “steps,” with a sudden break in behavior at 0.58 m/s2, while for Eq17 earthquake, we have a smoother response with a change in the response of the building practically correlated at each change of the PGA value.
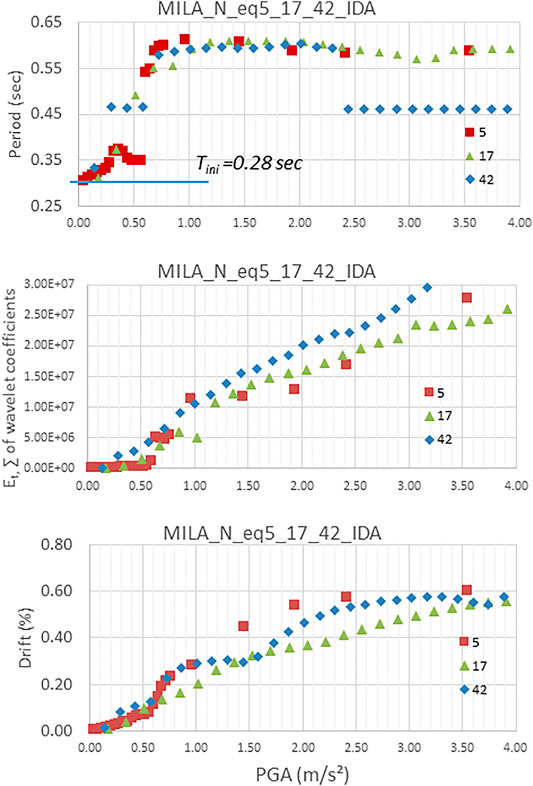
FIGURE 8. Comparison of periods, wavelet energy, and drift for IDA analyzes for earthquakes Eq5, Eq17, and Eq42 (component N).
Figure 8 (bottom) shows a greater displacement at the top of the building for Eq5 than for Eq17. This difference is very important from PGA values above 0.7 m/s2. Eq42 follows the values of Eq5 but with a stepwise response. If we look on Figure 8, for the energy response (middle), we observe that the energy dissipated by the building for Eq42 is much greater than for the other two earthquakes.
The IDA curves confirm, with small differences, the values of the periods of the limit states established from the capacity curve (i.e., the period of 0.45 for the limit Sd1 and 0.55 for the limit Sd2). In Figure 8 (top), we observe an elastic behavior for a period of less than 0.4 s. We, then, observe a change of behavior (with leveling off or continuously) between 0.40–0.45 and 0.55. From the 0.55 period, there is a rise to about 0.6 s after which we have no further increases in the period. Figure 8 (bottom) shows much lower drift values than those given by the building capacity curve (Figure 7) which shows larger values of displacement, corresponding to drift up to 2.5% as opposed to a maximum of 0.6% observed in IDA analyzes. It is possible to define the limit states of the building from the IDA curves. According to the study of Vamvatsikos and Cornell (2002), the ultimate limit state point on an IDA curve is defined as a point where the IDA slope is equal to 20% of the elastic while it also belongs to a descending branch. However, in this study, we integrated the performances of the element (beam and column) to define the point of ultimate limit state of the structure on the IDA curve. From the numerical model, it is estimated that the overall building collapse follows the collapse of the first story column–beam elements in bending due to the formation of the plastic mechanism. This occurs at PGA values between 2 and 2.5 m/s2 depending on the earthquake. However, as indicated for the capacity curve, the numerical model used here has a limit of validity in the final part of the non-linear branch. We will, therefore, not use the values corresponding to the ultimate state thereafter. Nevertheless, by assessing the performance of the element (beam and column), we evaluate the elastic and intermediate limit state of the structure on the IDA curve. The values of the energy dissipation correspondent to our interpretation of the attainment of these limits are approximatively 1.00E+06 for Sd1, 6.00E+06 for Sd2, and 1.15E+07 for Sd3. Figure 9 presents these values as a function of the period values.
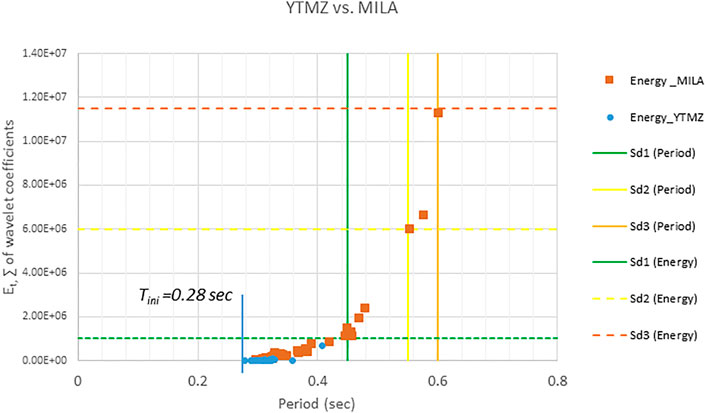
FIGURE 9. Estimated values of the threshold of energy and period for each damage degree.
Figure 10 shows the moment–curvature relationship (measure of member bending) in structural members during IDA analysis. Four graphs at the top of the figure show an almost linear relationship, and this corresponds to a characteristic response for a period of less than 0.4–0.45 s. The last two graphs represent a response in structural elements for a period of around 0.6 s and beyond. The vertical axis in Figure 10 increases with increasing moment values that are plotted.
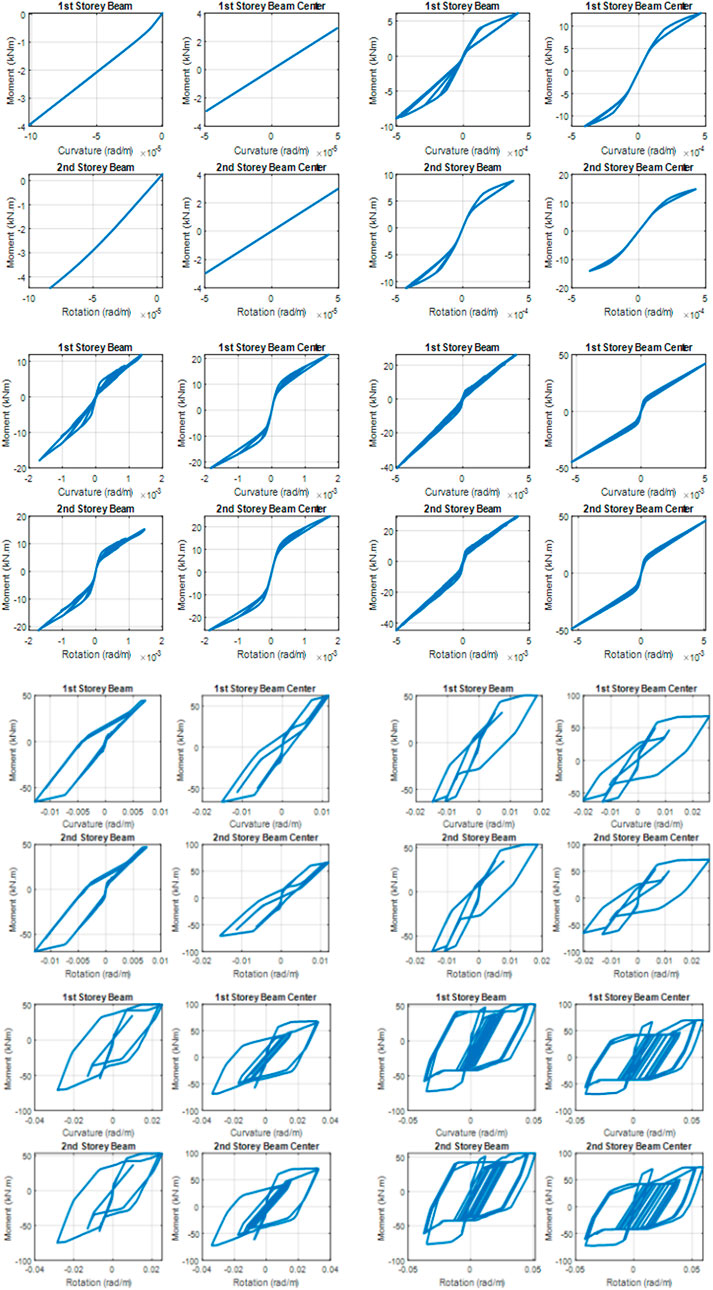
FIGURE 10. Evolution of the bending of the element (moment–curvature) for the earthquake Eq5 (for an acceleration scaled at 0.3 m/s2 for the first set of four images, 0.7 m/s2 for the second set of four images, 1.45 m/s2 for the third set of four images, and 2.4 m/s2 for the fourth set of four images).
Figure 7 makes it possible to have a correspondence between the results of the numerical analyses obtained for the 46 earthquakes and the degrees of damage RISK-UE. The capacity curve of the 1DDL system is converted into a bilinear curve. For the bilinear curve, the displacement that corresponds to the limit of the elastic behaviour is of 0.018 m. According to the formulation given in RISK-UE, the displacement, which separates the undamaged building from the building in state Sd1, is 0.7 x displacement corresponding to the elastic limit (0.012 m). For the ultimate displacement, the parameters of the model do not allow it to be established from the capacity curve. However, looking at the results of the incremental dynamic analyses (IDA, Section 5.3.2), we can estimate it to be around 0.12 m. This allows us to calculate the displacement corresponding to Sd3, according to the formulas of RISK-UE, and that was found to be 0.039 m. Using these hypotheses, we can associate the limit displacements of the damage states with the corresponding periods. Figure 7 shows the values of the corresponding periods: 0.28 s is the initial period of the building, 0.45 s for the Sd1 limit, 0.55 for the Sd2 limit, and around 0.8 s for Sd3. As the model could not simulate the collapse, the final limit, which corresponds to a collapse, could not be determined in this study. Taking into account the results of the push over analyses represented by the capacity curve and the IDA analyses, we can finally establish estimated values of the changes in the period and correlate them with a change in the degree of damage. This will allow us to classify the raw results of the dynamic analyses into damage classes as shown in Figure 11. Considering Figure 9 and the assumptions explained in Section 5.2, we could make a first approach that correlates the wavelet energy dissipation and the observational degree of damage. Figure 12 presents this correlation in terms of wavelet-based energy values and PGA values.
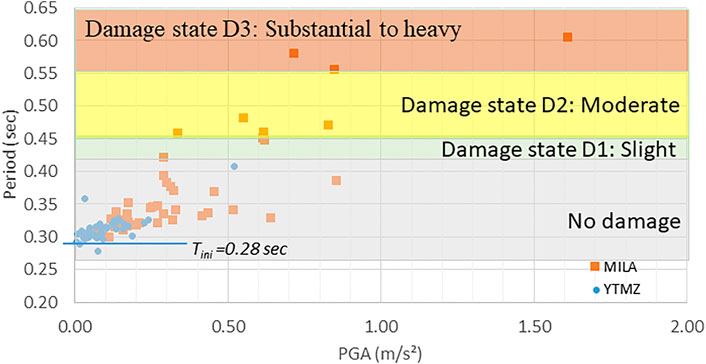
FIGURE 11. Representation of the degree of damage (RISK-UE) for the period responses of the target building after solicitation by the seismic signals recorded in Mayotte.
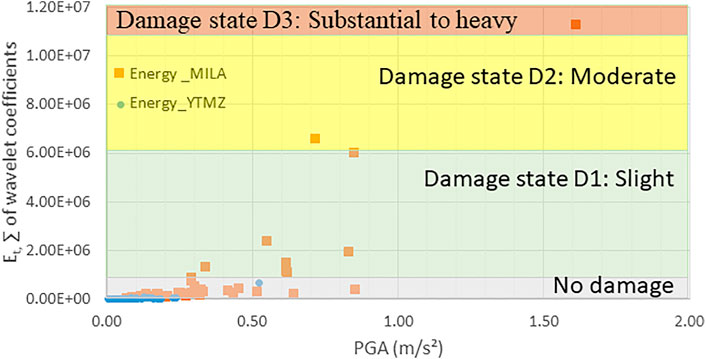
FIGURE 12. Representation of the degree of damage (RISK-UE) for the energy responses of the target building after solicitation by the seismic signals recorded in Mayotte.
We can notice that the responses to the earthquake that are on bedrock and the huge majority of the responses to the earthquake that are on site effects are classed, either by a period or energy as “no damage” for the structures, which is in accordance with the scenario simulations (Taillefer et al., 2019) and filed observations (Sira et al., 2018). However, some records on the site effect produce slight or event moderate to substantial damages. The wavelet-based energy parameter classes more records in a slight damage state and less in moderate damage state, while the period-based parameter class more records in moderate damage state. We can notice that the evolution of the period-based parameter follows a linear dispersion with respect to the PGA values, until the value of 1 m/s2. This is not the case for the wavelet-based energy parameter which makes a jump between the responses until 2E06 and the others around 6E06. This can be related to the fact that the energy parameter is more sensitive to the evolution of the resistance of the structure. An important issue, which has not been treated in this article, is the comparison of the conventional dissipated energy in a structure and the wavelet-based energy parameter. Zitto et al. (2015) compared the cumulative acoustic emission energy (CAE) obtained by reconstructing the acoustic emission signals in this scale (frequency) band with the cumulative dissipated energy (CDE) of the tested structure. They inferred from the graphs that concrete cracking is prevalent over the occurrence of plastic deformations in the steel columns; this would explain the good overall correlation seen between CAE and CDE. Notwithstanding, some noteworthy differences can be attributed to the energy dissipated by the steel columns through plastic deformations, captured by the CDE but not by the CAE.
The energy-based seismic engineering approach needs further investigation and development for use in the framework of performance based earthquake engineering (PBEE). This research is a small brick on the reflections that can be checked in the framework of energy-based approaches, in which we need a description of energy-based intensity measures and an energy-based design methodology. The wavelet-based energy parameter could be investigated as it could be in line with the estimation of the energy that contributes to damaging the structure. Making some hypothesis and assumptions, we propose here a first correlation between the wavelet-based energy values and the EMS-98 damage scale for this prototype building and for the records of the Mayotte seismic crisis. It can be seen that this parameter, as far as the PGA is concerned, behaves quite differently from more conventionally used parameters, for example, the modification of the period. Even if both parameters classify the response of the structure for the large majority of the records in slight and moderate damage states, we can observe that the energy-based parameter has a less linear response and makes a distinct difference between slight and moderate damage states, contrary to the period-based parameter. Furthermore, it can be investigated whether this wavelet-based energy parameter can be a useful parameter in the energy-based earthquake engineering approach since this parameter is clearly related to earthquake aggression and can probably be related to the structure damage.
The raw data supporting the conclusions of this article will be made available by the authors, without undue reservation.
AR selected all the earthquake records and prepared them to be used for the OpenSees dynamic analysis. CN performed the dynamics analysis with OpenSees and the Matlab code for wavelet analysis. Both authors participated in the discussion, reflexion, and conclusions.
The French Ministry of Environment (research program DGPR-BRGM 2020) funded the technical work of this article.
The authors declare that the research was conducted in the absence of any commercial or financial relationships that could be construed as a potential conflict of interest.
All claims expressed in this article are solely those of the authors and do not necessarily represent those of their affiliated organizations, or those of the publisher, the editors, and the reviewers. Any product that may be evaluated in this article, or claim that may be made by its manufacturer, is not guaranteed or endorsed by the publisher.
We thank Pierre Gehl and Nicolas Taillefer for proofreading the BRGM report, which is at the base of this article. We thank the reviewers for their comments on an earlier version of this article.
The Supplementary Material for this article can be found online at: https://www.frontiersin.org/articles/10.3389/fbuil.2022.850300/full#supplementary-material
Supplementary Table S1 | Seismological parameters of earthquakes used in the study after Lemoine et al. (2020). The identifier corresponds to the one in the catalog and is uniquely generated by the SeisComP software used for the detection and location of earthquakes during crisis monitoring.
Bayissa, W. L., Haritos, N., and Thelandersson, S. (2008). Vibration-based Structural Damage Identification Using Wavelet Transform. Mech. Syst. Signal Process. 22 (Issue 5), 1194–1215. ISSN 0888-3270. doi:10.1016/j.ymssp.2007.11.001
Di Trapani, F., and Malavisi, M. (2019). Seismic Fragility Assessment of Infilled Frames Subject to Mainshock/aftershock Sequences Using a Double Incremental Dynamic Analysis Approach. Bull. Earthquake Eng. 17, 211–235. Vol.:(0123456789). doi:10.1007/s10518-018-0445-21
Doebling, S. W., Farrar, C. L., Prime, M. B., and Shevitz, D. W. (1996). Damage Identification and Health Monitoring of Structural and Mechanical Systems from Changes in Their Vibration Characteristics: a Literature Review. Report, LA-13070-MS. New Mexico: Los Alamos National Laboratory.
Dunand, F., Ait Meziane, Y., Guéguen, P., Chatelain, J.-L., Guillier, B., Ben Salem, R., et al. (2004). Utilisation du bruit de fond pour l’analyse des dommages des bâtiments de Boumerdes suite au séisme du 21 mai 2003. Mémoires du Serv. Géologique de L’Algérie 12, 177–191.
Eurocode 8 (EC8) (2005). EN 1998-1: Design Provisions for Earthquake Resistance of Structures, Part 1: General Rules, Seismic Actions and Rules for Buildings. Brussels: European Committee for Standardisation.
Fajfar, P. (1999). Capacity Spectrum Method Based on Inelastic Demand Spectra. Earthquake Engng. Struct. Dyn. 28 (9), 979–993. doi:10.1002/(sici)1096-9845(199909)28:9<979::aid-eqe850>3.0.co;2-1
Goulet, J. A., Michel, C., and Kiureghian, A. D. (2015). Data-driven post-earthquake Rapid Structural Safety Assessment. Earthquake Engng Struct. Dyn. 44 (4), 549–562. doi:10.1002/eqe.2541
Grunthal, G. (1998). EMS-98 European Macroseismic Scale, 15. Luxembourg: Centre Européen de Géodynamique et de Séismologie.
Hanteh, M., and Rezaifar, O. (2021). Damage Detection in Precast Full Panel Building by Continuous Wavelet Analysis Analytical Method. Structures 29, 701–713. ISSN 2352-0124. doi:10.1016/j.istruc.2020.12.002
He, H., Chen, Y., and Lan, B. (2021). Damage Assessment for Structure Subjected to Earthquake Using Wavelet Packet Decomposition and Time-Varying Frequency. Structures 34, 449–461. ISSN 2352-0124. doi:10.1016/j.istruc.2021.07.087
Kaloop, M. R., and Hu, J. W. (2016). Damage Identification and Performance Assessment of Regular and Irregular Buildings Using Wavelet Transform Energy. Adv. Mater. Sci. Eng. 2016, 6027812. doi:10.1155/2016/6027812
Karsan, I. D., and Jirsa, J. O. (1969). Behavior of Concrete under Compressive Loadings. J. Struct. Div. 95, 2543–2564. doi:10.1061/jsdeag.0002424
Kassem, M. M., Nazri, F. M., Farsangi, E. N., and Ozturk, B. (2022). Development of a Uniform Seismic Vulnerability index Framework for Reinforced concrete Building Typology. J. Building Eng. 47, 103838. ISSN 2352-7102. doi:10.1016/j.jobe.2021.103838
Kassem, M. M., Nazri, F. M., Farsangi, E. N., and Ozturk, B. (2021). Improved Vulnerability Index Methodology to Quantify Seismic Risk and Loss Assessment in Reinforced Concrete Buildings. J. Earthquake Eng. doi:10.1080/13632469.2021.1911888
Kent, D. C., and Park, R. (1971). Flexural Members with Confined concrete. J. Struct. Division. Proc. Am. Soc. Civil Eng. 97 (ST7), 1969–1990. doi:10.1061/jsdeag.0002957
Lemoine, A., Briole, P., Bertil, D., Roullé, A., Foumelis, M., Thinon, I., .., , Raucoules, D., de Michele, M., Valty, P., and Hoste Colomer, R. (2020). The 2018-2019 Seismo-Volcanic Crisis East of Mayotte, Comoros Islands: Seismicity and Ground Deformation Markers of an Exceptional Submarine Eruption. Geophys. J. Int. 223 (1), 22–44. doi:10.1093/gji/ggaa273
Li, H., Yi, T., Gu, M., and Huo, L. (2009). Evaluation of Earthquake-Induced Structural Damages by Wavelet Transform. Prog. Nat. Sci. 19 (Issue 4), 461–470. ISSN 1002-0071. doi:10.1016/j.pnsc.2008.09.002
Minh-Nghi, T., and Lardiès, J. (2006). Identification of Weak Nonlinearities on Damping and Stiffness by the Continuous Wavelet Transform. J. Sound Vibration 293, 16–37. doi:10.1016/j.jsv.2005.09.021
Negulescu, C., and Wijesundara, K. K. (2019). “Energy-based Seismic Design: Needs of Energy Damage Index Values for Serviceability and Ultimate Limit States for Gravity Design Buildings?,” in Proceedings of the 7th International Conference on Computational Methods in Structural Dynamics and Earthquake Engineering, Crete, Greece, 24-26 June 2019. doi:10.7712/120119.7079.19379
PEER (2006). OpenSees: Open System for Earthquake Engineering SimulationPacific Earthquake Engineering Research Center. Berkeley, CA: University of California.
Quiñones, M. M., Montejo, L. A., and Jang, S. (2015). Experimental and Numerical Evaluation of Wavelet Based Damage Detection Methodologies. Int. J. Adv. Struct. Eng. 7, 69–80. doi:10.1007/s40091-015-0084-7
Sira, C., Schlupp, A., Bontemps, M., Regis, E., and Van der Woerd – Essaim Sismique à l’est de Mayotte, J. (2018). Analyse Pour la Période du 10 mai au 15 Juin 2018. Note Macrosismique Préliminaire du BCSF-RENASS, BCSF-RENASS2018-R4, 62. 4 Tableaux, 47 Fig., 5 Annexes. Available at: https://www.franceseisme.fr/donnees/intensites/2018/180515_1548/Note_macro-BCSF-RENASS-Mayotte-13-07-2018-BD.pdf
Taillefer, N., Negulescu, C., Iasio, C., Bertil, D., and Roullé, A. (2019). Scénarios de Dommages Sismiques Pour Mayotte-Rapport Final. BRGM/RP-69518-FR, 63. 3 Ann.. Available at: http://infoterre.brgm.fr/rapports/RP-69518-FR.pdf.
Todorovska, M. I., and Trifunac, M. (2007). Earthquake Damage Detection in the Imperial County Services Building I: The Data and Time-Frequency Analysis. Soil Dyn. Earthquake Eng. 27, 564–576. doi:10.1016/j.soildyn.2006.10.005
Trevlopoulos, K., and Guéguen, P. (2016). Period Elongation-Based Framework for Operative Assessment of the Variation of Seismic Vulnerability of Reinforced concrete Buildings during Aftershock Sequences. Soil Dyn. Earthquake Eng. 84, 224–237. ISSN 0267-7261. doi:10.1016/j.soildyn.2016.02.009
Vamvatsikos, D., and Cornell, C. A. (2002). Incremental Dynamic Analysis. Earthquake Engng. Struct. Dyn. 31, 491–514. doi:10.1002/eqe.141
Wijesundara, K. K., Negulescu, C., and Foerster, E. (2015). Estimation of Modal Properties of Low-Rise Buildings Using Ambient Excitation Measurements. Shock and Vibration 2015, 173450. doi:10.1155/2015/173450
Zitto, M. E., Piotrkowski, R., Gallego, A., Sagasta, F., and Benavent-Climent, A. (2015). Damage Assessed by Wavelet Scale Bands and B-Value in Dynamical Tests of a Reinforced concrete Slab Monitored with Acoustic Emission. Mech. Syst. Signal Process. 60-61, 75–89. ISSN 0888-3270. doi:10.1016/j.ymssp.2015.02.006
RISK-UE (20032003). “An Advanced Approach to Earthquake Risk Scenarios with Applications to Different European Towns,” in WP4 Handbook. Vulnerability of Current Buildings. Editors Z. V. Milutinovic, and G. S. Trendafiloski (Skopje, North Macedonia: Institute of Earthquake Engineering and Engineering Seismology).
Keywords: wavelet energy, inter-story drift, dominant inelastic period, Mayotte earthquakes, EMS98
Citation: Negulescu C and Roullé A (2022) Correlation Between Wavelet-Based Energy Parameter and Observational Damage Degrees for Gravity Design Building During the May 2018 Mayotte Seismic Crisis. Front. Built Environ. 8:850300. doi: 10.3389/fbuil.2022.850300
Received: 07 January 2022; Accepted: 02 March 2022;
Published: 30 March 2022.
Edited by:
Izuru Takewaki, Kyoto University, JapanCopyright © 2022 Negulescu and Roullé. This is an open-access article distributed under the terms of the Creative Commons Attribution License (CC BY). The use, distribution or reproduction in other forums is permitted, provided the original author(s) and the copyright owner(s) are credited and that the original publication in this journal is cited, in accordance with accepted academic practice. No use, distribution or reproduction is permitted which does not comply with these terms.
*Correspondence: Caterina Negulescu, Yy5uZWd1bGVzY3VAYnJnbS5mcg==
Disclaimer: All claims expressed in this article are solely those of the authors and do not necessarily represent those of their affiliated organizations, or those of the publisher, the editors and the reviewers. Any product that may be evaluated in this article or claim that may be made by its manufacturer is not guaranteed or endorsed by the publisher.
Research integrity at Frontiers
Learn more about the work of our research integrity team to safeguard the quality of each article we publish.