 Hala Nassereddine
 Dharmaraj Veeramani2
94% of researchers rate our articles as excellent or good
Learn more about the work of our research integrity team to safeguard the quality of each article we publish.
Find out more
ORIGINAL RESEARCH article
Front. Built Environ., 04 February 2022
Sec. Construction Management
Volume 8 - 2022 | https://doi.org/10.3389/fbuil.2022.730098
This article is part of the Research TopicDigital Technologies for Construction ManagementView all 5 articles
The Production Strategy Process (PSP) is an integral part of production planning and control as it defines how production processes are structured and designed and outlines how production will be executed. PSP involves massive information transfer and communication among project participants. While BIM can improve the flow of information, the paradox of designing 3D models in 2D space remains. This paradox indicates that new visualization technologies are needed to leverage the use of information in the PSP. As Industry 4.0, the fourth industrial revolution, continues to evolve, it is imperative that construction firms seek, find, and adopt new technologies. This research employed Augmented Reality (AR) as a new user interface in the PSP. The current state of practice of PSP was investigated and current challenges are identified. The opportunities to integrate AR were defined, and an AR-enabled future state was proposed. Next, an AR-enabled PSP prototype using the Microsoft HoloLens was implemented and validated on a real-world healthcare project. Usability testing was then conducted using a one-on-one protocol to validate the prototype with 20 participants. Surveys were the deployed to qualitatively assess the impact of integrating AR into PSP. The difference between the traditional PSP and the AR-enabled PSP was tested through a series of hypotheses comparing both processes. The results demonstrate that the AR-enabled PSP offers significant benefits over the Traditional PSP: improved collaboration, reduced miscommunication, increased quality and detection of errors, enhanced decision-making, better documentation, better information access, improved information flow, increased input accuracy, and increased integration of safety considerations. Additionally, the technology, software, and hardware were also evaluated, and, on average, the findings demonstrated the potential of AR in production planning.
The construction industry is anticipated to growth globally post-COVID-19 pandemic (Francis and McKeown 2021; GlobalData 2021). While the construction industry is a major contributor to the prosperity of nations, it is fraught with expensive waste and inefficiencies that arise due to a variety of factors such as out-of-sequence work, inadequate control of labor, materials and logistics, gaps in communication and coordination, and unreliable lead times (Howell and Lichtig 2008; Modular Building Institute (MBI) 2010; Forbes and Ahmed 2011; Oakland and Marosszeky 2017; CII 2018; Ratajczak et al., 2019; Bajjou and Chafi 2021).
It is noteworthy that these challenges all occur during execution, which depends on the effectiveness of production planning and control systems. Production planning and control are considered among the top potential areas that need improvements in the construction industry (Sriprasert and Dawood 2002; Maraqa et al., 2021). Construction researchers agree that major issues in production planning and control are caused by the 1) inadequacy of traditional project management theory and 2) improper applications of information technologies (IT) (Koskela 1992; Ballard 2000; Koskela 2000; Sriprasert and Dawood 2002; Dave et al., 2010; Maraqa et al., 2021; Muñoz-La Rivera et al., 2021).
The first major issue concerns the traditional project management concept in construction which is based on the transformation concept that considers construction as a set of activities aimed at a certain output—i.e., conversions (Koskela 1992). The conversion model is exemplified by the heavy emphasis on the use of the Critical Path Method (CPM) sequencing technique as the beginning and end of the planning process (Howell and Ballard 1997). Site operations are driven by a top-down push system, and look-ahead and weekly plans are filtered from the detailed baseline schedule, ignoring the actual status of work on-site (Tommelein 2015).
Although the construction industry has been governed by the traditional conversion model, this transformation model has been widely criticized as the focus on activities alone results in a significant amount of waste, loss of value, and non-value-adding activities (Koskela 1992; Koskela 1999; Abdelhamid et al., 2010). In response to the deficiencies of the traditional production view, and inspired from the manufacturing experience and specifically from the Toyota Production System (TPS), new production planning and control systems were put forth to reduce uncertainty, improve flow, improve predictability, increase transparency, and reduce waste (Koskela 1999; Koskela 2000; Seppänen et al., 2015).
One of these systems is the Last Planner® System (LPS), a new production planning and control system that complements CPM by addressing its shortcomings at the production level (Ballard and Howell 1994a). LPS fosters collaborative planning by bringing “Last Planners” forward in the process (Ballard 2000). The “Last Planner” is the last person in a chain of planners and the output of their planning process is not a directive for a lower planning process, but it results in production (Ballard and Howell 1994b). LPS consists of four phases: master scheduling, phase scheduling, look-ahead planning, and weekly planning (Hamzeh et al., 2012). Production Planning includes master scheduling and phase scheduling whereas Production Control covers look-ahead planning and weekly planning (Seppänen et al., 2015).
However, as noted by Ballard and Tommelein (2016), LPS does not presuppose any specific work structure. The authors indicated that work structuring must happen before project control—i.e., before look-ahead planning could occur. Work structuring must ensure continuous process flow, and one core parameter to achieve such flow is Takt-Time.
Within Lean Construction, “Takt-Time” is the unit of time in which a product must be produced (i.e., supply rate) to match the rate at which the product is needed (i.e., demand rate) (Frandson et al., 2013). Takt-Time planning breaks the work down into individual, manageable, chunks and determines their demand and supply rates (Tommelein 2017). While the use of Takt-Time Planning in construction has been investigated by many researchers through case studies, Frandson et al. (2014) demonstrated the complementary nature of Takt-Time and LPS. The authors noted that Takt-Time introduces a standard, continuous flow of work which is also supported and maintained by the LPS which allows the flow of work to remain when obstacles emerge. Ebrahim et al. (2017) added the concepts Takt-Time Planning as a new stage to the LPS and named it Production Strategy Process (PSP). According to (Ebrahim et al., 2017), the three objectives of this stage are: 1) implementing sequence and flow analyses, 2) defining production areas, and 3) designing production using Takt-Time principles to achieve stable and predictable construction flows.
PSP is an integral part of production planning and control and is essential to developing a reliable and balanced production plan (dos Santos 1999). An analogy can be drawn between Film Production Management and Construction where PSP could be thought of as the read-through where the actors are brought together to read the script. Read-through is an important milestone in the production of a film. It provides an opportunity for everyone involved in the production to get insights into how the actors will approach their roles. Moreover, read-through is a powerful tool for identifying problem areas in the script. Issues that have not been addressed in the script development process often come to the surface and become apparent during the read-through. Using this analogy, the PSP is the read-through process, the project set of drawings and/or BIM model are the script, and the last planners are the actors. PSP provides an environment to practice the execution of construction operations and identify potential problem areas before the execution phase begins.
The second major cause of inefficiencies in production planning and control is the improper application of IT. Production planning and control involve massive information transfer and communication needs among the project team (Leinonen et al., 2003). Researchers noted that the flow of information in construction affects all other resource flows and is therefore important to manage (Dave et al., 2014). The site team needs resource information about their construction tasks to effectively execute the work and conduct effective look-ahead and weekly planning activities (Dave et al., 2010; Dave et al., 2014). Consequently, the information that transcends from the planning process affects the construction. Thus, the reliability of the planning process affects the efficiency of the overall production system (Dave et al., 2014). Researchers stated that the implementation of IT can improve information flow and integration within construction (Dave et al., 2010).
Froese has divided the innovations in IT into three eras (Froese 2005; Froese 2010). The first era is comprised of stand-alone tools that improve specific work tasks, such as Computer Aided Design (CAD), Structural Analysis, Estimating, Scheduling, which are all individual programs that each works on a single facet of the construction process. The second era includes computer-supported communications, such as email and web-based messaging, and document management systems. The third era is where construction currently sits—reconciling the first two eras into a unified platform wherein project teams can collaborate to produce a virtual model of all aspects of the construction project. One of the problems with the early iterations of CAD was that while it could represent geometric objects and show the relationship between them in space, it was lacking a precise understanding of how the relationship functioned. More modern iterations of CAD have included this process, commonly known as Building Information Modeling (BIM). BIM serves as a shared knowledge resource for information about a facility, forming a reliable basis for decisions during its lifecycle from inception to commissioning and beyond (Rossini et al., 2017). Li and Yang (2017) defined BIM as a technology that describes an engineering project consisting of intelligent facilities with their own data properties and parameter rules, in which each object’s appearance and its internal components and features can be displayed in the form of three-dimensional figures.
Although the concepts of Lean and the advances in IT are different initiatives and can be applied individually, researchers have indicated that integrating them together results in greater benefits (Sacks et al., 2010a). Additionally, Cheng et al. (2010) claimed that the use of IT is beneficial to Lean processes, especially when IT is applied to improve the information flow. Sriprasert and Dawood (2002) developed a porotype called LEWIS that explores the next generation production planning and control system through a synergy of 1) innovative construction project management paradigm namely Lean Construction and 2) advanced information technology named web-based information management and 4D visualization. Sacks et al. (2009) implemented two prototypes to facilitate process flow within the context of BIM systems. Their work demonstrated aspects of the synergy between BIM and Lean Construction and highlighted the importance of BIM-based visualization interfaces for providing process transparency. Sacks et al. (2010a) analyzed possible interactions between 24 principles of Lean Construction and 18 BIM functionalities. They identified 54 points of direct interaction, 50 positive and only 4 negative. They found that the following three Lean principles had the most interactions with BIM functions: 1) get quality right the first time (reduce product variability), 2) focus on improving upstream flow variability (reduce production variability), and 3) reduce production cycle durations. The first two principles are grouped under the “Reduce Variability” principle and the third principle is categorized under “Reduce Cycle Time”. The three Lean principles belong to the “Flow Process” area. The authors concluded that implementing BIM and Lean alongside each other was optimal, as the functionality of BIM improved Lean processes significantly. Oskouie et al. (2012) built upon the work of (Sacks et al., 2010a) and explored new interactions between BIM and Lean. The authors investigated two new Lean principles (increase relatedness and collaboration and tightly coupling of learning with action) and three new BIM functionalities (support the make ready process, facilitating real-time construction tracking and reporting, and support AR). The latter BIM functionality enhances the understanding of construction progress, increases the precision and accuracy of constructed elements by superimposing as-built and as-planned models. Integrating BIM with AR allows project managers to better detect defects and enables them to effectively make control decisions (Oskouie et al., 2012). The results of this study showed that integrating BIM with AR has a positive interaction with the following lean principles: reduce variability, verify and validate, and go and see for yourself. Sacks et al. (2010b) developed KanBIM, a BIM-enabled system to support production planning and day-to-day production control on construction sites. The software was developed based on seven areas: 1) process visualization, 2) product and method visualization, 3) computation and display of work package and task maturity, 4) support for planning, negotiation, commitment, and status feedback, 5) implementation of pull flow control, 6) establishment and maintenance of workflow and plan reliability, and 7) formalization of experimentation for continuous improvement. The key contribution of KanBan is the visualization of the production process. The software builds upon LPS and provides the information structure to reduce the granularity of planning coordination from weekly to daily. KanBan also fosters negotiation between parties and provide real-time updates of any changes. Lagos et al. (2017) explored the improvement of the level of implementation of LPS with the use of IT. The authors identified 16 LPS criteria, each containing n sub-criteria. The level of implementation of each sub-criterion of each of the 16 criteria was evaluated on a four-point Likert scale and the level of implementation of a criterion was obtained as the average of the sub-criteria. Data was collected from 18 projects, 10 of which had IT support. The results showed that when IT systems are integrated on a project to support LPS, a greater level of implementation is achieved for the following five criteria: standardization of the planning and control process; use of indicators to assess compliance with planning; critical analysis of information; using an easy-to-understand and transparent master plan; and analysis and systematic removal of constraints. Tezel and Aziz (2017) recognized the important efforts of Lean construction and construction automation to improve the performance of the construction industry. The authors explored how emerging ICT can replace or facilitate existing conventional visual management systems and Lean tools in construction. Varags and Formoso (2019) suggested a Location-Based Planning and Control method supported by BIM and explored the interface between the new method and LPS. Dave and Sacks (2020) described three case studies on the integration of BIM with LPS and demonstrated how software tools that incorporate BIM models with process flow functionality that are is based Lean principles can support more effective communication. Additionally, Schimanski et al. (2020) proposed a new BIM-based production management system, which is characterized by a theoretical integration model for BIM and existing construction management techniques, and a methodology for applying these concepts in practice.
While the construction industry had made great strides in changing its status quo and embracing Lean Construction and BIM, it has recently been undergoing a new transformation. Influenced by the gains that resulted from the fourth industrial revolution, researchers in construction began investigating the potential of integrating Industry 4.0 into construction and more attention has been thus placed on Construction 4.0, the counterpart of Industry 4.0 in the construction industry (El Jazzar et al., 2020). Construction 4.0 can be defined as “the digitization and industrialization of the industry that 1) enable real-time, horizontal, and vertical integration and connectivity of stakeholders across the construction project lifecycle, 2) promote the advancement of construction processes by employing mechanization and automation, and 3) bridge the gap between the physical and cyber environments” (El Jazzar et al., 2021). Among the technologies encompassed under the umbrella of Construction 4.0, augmented reality (AR) is an emerging technology that has great potential to transform the construction industry (Rüßmann et al., 2015; Schranz et al., 2021). In the context of the construction industry, Nassereddine et al. (2019) defined AR both as an information aggregator and a data publishing platform that allows the user to 1) passively view displayed information, 2) actively engage and interact with published content, and 3) collaborate with others in real-time from remote locations.
The use of AR in the construction industry can be traced back to 1996 when (Webster et al., 1996) developed two AR systems that employ a see-through head-worn display to provide users with visual information that is tied to the physical world. The purpose of these two systems was to improve methods for construction, inspection and renovation of architectural structures. The first AR system, called “Architectural Anatomy,” enabled users to see portions of a building that are hidden behind architectural or structural finishes and allow them to display additional information about the hidden objects. The second AR system addressed spaceframe construction and it was designed to guide construction workers through the assembly of a spaceframe structure to ensure every member is properly placed and fastened. Following this first AR application, construction researchers continued to investigate and develop AR applications for the entire project lifecycle, from design to demolition such as real-time visualization of conceptual projects, augmented mock-ups, virtual planning and sequencing, remote site inspection, virtual training, and remodeling visualization (Nassereddine 2019; Nassereddine et al., 2020).
Recent studies have investigated the integration of AR with Lean and BIM. For instance, Antunes and Poshdar (2018) developed a theoretical framework for an information integration system for construction and indicated that BIM and AR can support project planning. (Calderon-Hernandez and Brioso 2018). noted that AR can supplement BIM to support Lean Construction. A study conducted by Oskouie et al. (2012) revealed the interactions between BIM, AR, and Lean Principles and reported that the integration of AR with BIM can achieve a continuous workflow and reduce variability. Ratajczak et al. (2019) developed a framework and a mobile application, AR4Construction, that integrated BIM and AR with Lean Construction methods, particularly Location-Based Management System to support the efficient management of construction works on site. Rathnasinghe et al. (2020) explored the potential of AR to improve information management and successfully complete a construction project. Schranz et al. (2021) investigated an application of AR into the BIM submission process where the process plan check and approval can be accelerated when combining BIM with the visualization capability of AR.
Lately, the term “Lean Construction 4.0” emerged to represent the future vision for the construction industry and place more emphasis on the synergies between production management theory (i.e., Lean Construction) and digital and smart technologies (i.e., Construction 4.0) (Hamzeh et al., 2021). The authors added that AR is among the technology trends that will provide construction designers, planners, and practitioners with a new environment that will take the human-to-system interactions into unprecedented levels of data integration and people useability. Moreover, Bou Hatoum et al. (2021) noted that existing processes need to be re-engineered in order to integrated Construction 4.0 technologies. The authors proposed a Lean-based Construction 4.0 process reengineering framework to assist construction companies in adopting Construction 4.0 technologies and re-engineering their processes. Among the Construction 4.0 technologies, Dallasega et al. (2020) stated that AR has not been fully exploited in the construction industry and more research is needed to investigate how this technology can empower the different phases of LPS.
Building on the research gap, the objective of this research is to investigate how AR can be employed as a new user interface technology to enable PSP (the LPS stage that connects planning to execution). This paper aims to develop an AR-enabled PSP prototype to explore the impact AR can have on this process. The paper is structured as follows: the next section presents the methodology employed to achieve the research objective. The current state of PSP is then described. The envisioned future AR-enabled PSP, the development, implementation, and validation of an AR-enabled PSP prototype are outlined next. Finally, conclusions, limitations, and recommendations for future research are provided.
The objective of this research is to investigate how AR can leverage the use of BIM and build upon the existing PSP Lean practice by developing an AR-enabled PSP prototype. The methodology employed is inspired by Davenport (1993) that defines a five-step framework for process innovation: 1) identifying processes for innovation, 2) identifying change enablers, 3) developing a business vision and process objectives, 4) understanding and measuring existing processes, and 5) designing and building a prototype of the new process.
The overarching objective comprises four main phases: “Understanding” phase, “Conceptualizing and Designing” phase, “Developing and Implementing” phase, and “Validating” phase. Each of these phases is broken down into tasks as outlined in Table 1.
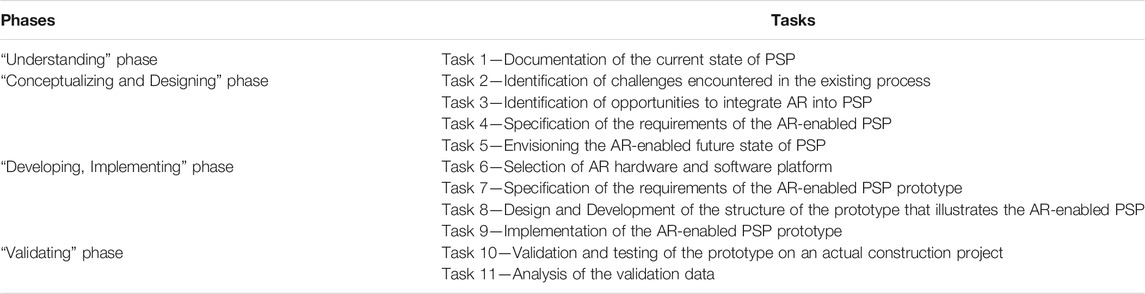
TABLE 1. Tasks compromising the four-phase research plan.
Before embarking on any process re-engineering effort, it is important to gain a sound understanding of the current state of practice in order to allow those involved in the innovation initiative to develop a shared basis for further improvement (Sheperis et al., 2010). Nassereddine et al. (2019) investigated via literature review and interviews with PSP subject matter experts the current state of practice of PSP and developed a flowchart that outlines PSP. Nassereddine et al. (2019) explained that PSP consists of a prerequisite step and five other principal steps.
Collaboration between the project team (i.e., the General Contractor and Trade Partners or Subcontractors) is a core requirement for implementing PSP, and therefore, the example of an Integrated Project Delivery (IPD) project was used to chalk out the structure of PSP. Production Strategy is the third level in the Production Planning and Control stream (Figure 1) and is implemented after the project team has set the expectations for the project in Master Schedule levels and has broken down the project into phases (such as overhead, exterior) and identified the activities to be carried out in each phase in the phase Scheduling level. The Production Strategy level is where the project teams collectively develop a production plan for each phase.
The project team reviews the 2D construction drawings of each phase, identifies repeatable and non-repeatable work, and determines the flow and non-flow areas. Once these steps are completed, the team agrees on the linear sequence of construction activities of the flow areas of the corresponding phase, and finally determines the direction of the flow.
The General Contractor conducts one-on-one interviews with the trades’ last planner. For each activity within the corresponding phase, the General Contractor provides the last planner of the corresponding Trade Partner with the 2D construction drawings. The last planner is then asked to use color markers to highlight the 2D drawings and show how much work they can complete in 1 day based on their ideal crew size. This is referred to as “daily production”. As a result, a 2D color-up construction drawing is created for each activity within this step. Then, the General Contractor asks the last planner from each trade to use the color-up drawings and divide their floor plan into production areas. The production area, also referred to as the Takt area, is a collection of individual daily productions.
The General Contractor collects the individual 2D production areas drawings, overlays them, and attempts to identify common areas. The objective is to develop common areas wherein the scopes of work of all the different activities are balanced.
Once the common areas are determined, the General Contractor analyzes the scope of work of each activity and identifies which activity(ies) are the bottleneck. The objective of this step is to balance the workflow across all activities so that all Trade Partners can finish their work in a production area within the specified Takt-Time. The General Contractor balances the workflow by either adjusting the crew size, the work hours, or the boundaries of the production area. The result of this step is a first-pass production plan that outlines the production areas and the scope of work of each activity.
The General Contractor meets with all the last planners to collectively review the first-pass production plan. The feedback of the last planners is collected to revise and update the first-pass production plan. Once the production plan is agreed upon by the project team, the General Contractor documents it in a spreadsheet.
Prior to investigating how AR can be integrated into the PSP, it is important to explore how and where the technology could be used. Therefore, challenges encountered in the current state of the PSP are identified, and opportunities to integrate AR are subsequently introduced.
Challenges in the existing PSP were identified by reviewing the current state process and by interviewing five subject matter experts. The identified challenges were grouped into 11 categories: Collaboration, Communication, Decision-Making, Detection of Errors, Documentation, Efficiency, Information Access, Information Flow (Navigation), Input Accuracy, Interpretation of Plans (Spatial Cognition), and Safety. Table 2 outlines the 11 challenges and their description. A detailed discussion of the 11 challenges can be found in Nassereddine et al. (2021).
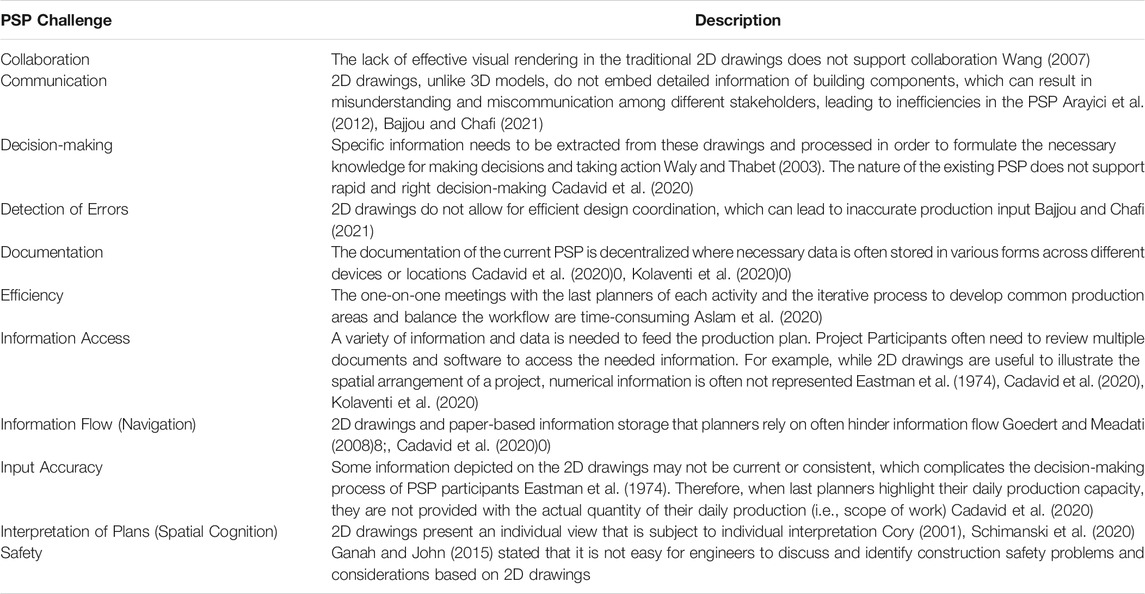
TABLE 2. Challenges associated with the Current State PSP.
This section investigates how AR might be used to leverage the existing PSP by identifying opportunities to integrate the technology and address the challenges encountered in the existing PSP.
In order to identify the opportunities that AR has the potential to offer, it is important to study the impact AR can have. Using the nine impact categories, identified by Davenport (1993), in which IT can impact an existing process, the impact of AR in each of the nine categories was identified and is discussed below:
Data analytics and AR build off one another. AR can provide real-time in-situ information visualization of multi-dimensional data (ElSayed et al., 2015). AR brings a new dimension to present and visualize and interact with big data. The technology also offers a new medium that supports users in analyzing data (Luboschik et al., 2016). AR enhances the perception of the user which leads to better cognition and an enhanced understanding of the environment. Better cognition results in more processed information, wider understanding, and more effective learning leading to more successful and accurate decisions. AR supports the decision-making process by displaying the needed information and enhancing collaboration between those involved in the process (Székely 2015).
AR systems allow the automation of processes. Information can be automatically generated in real-time and displayed in the real environment (Verlinden et al., 2009).
With the transition to the digital era, technologies such as AR have the potential to disrupt industries and intermediate and disintermediate processes (Miller and Custis 2017). With advances in Internet of Things devices, AR applications are perceived to leverage data by overcoming big hurdles of data capture, storage, processing, and integration and therefore creating a new kind of disintermediation (Yusuf et al., 2021).
One of the greatest potentials of AR is the development of new types of collaborative interfaces. AR can be employed to enhance face-to-face and remote collaboration where remote participants can be added to the real world. AR enables a more natural co-located collaboration by blending the physical and virtual worlds to increase shared understanding. Researchers identified five key features of collaborative AR environments: 1) Virtuality—objects that do not exist in the real world can be viewed and examined; 2) Augmentation—real objects can be augmented by virtual annotations; 3) Cooperation—multiple users can see each other and cooperate in a natural way; 4) Interdependence—each user controls their own independent viewpoints; and 5) Individuality—Displayed data can be different for each viewer (Billinghurst and Kato 2002).
AR overlays digital content and contextual information onto real scenes which increases the perception the user has of reality. Furthermore, information can be captured from the user and saved for later analysis (Diaz et al., 2015).
AR is a new source of context-rich data that allows the user to connect the dots between cross-functional teams (Biron and Lang 2018).
AR supports tacit knowledge exchange. A remote expert can transfer their tacit knowledge through AR via demonstration. Graphics, audio, and video could be used to effectively transfer tacit expert knowledge through AR (Aromaa et al., 2015).
AR systems support the performance of activities/tasks in parallel. This is also enabled with the remote collaboration feature that AR provides (Verlinden et al., 2009).
AR can visualize BIM data along with the real world of each construction activity and therefore, the status of the activity (complete, in progress, delayed) can be monitored and tracked, allowing the generation of an automatic report to check the progress of an activity (Wang and Love 2012).
Once the capabilities of AR have been identified, ways of integrating AR to overcome the challenges of the current PSP listed in the previous section were discussed with the five subject matter experts through a series of phone calls and in-person and online meetings. The nine impact areas laid the foundation for exploring opportunities to address the challenges encountered in the current process. The corresponding author presented the AR capabilities to the experts and asked them to envision how each of the challenges they have identified earlier can be addressed using AR by considering the nine impact areas of the technologies. A matrix was then created to identify how each challenge will be addressed using the AR impact areas (as shown in Table 3). While the matrix is developed based on the PSP experts and is specific to the integration of AR with PSP, some of the interactions can be observed in previous research work where authors developed applications to illustrate the use of AR in the construction industry. For instance, the research of (Chalhoub and Ayer 2017) demonstrated that the ability of AR to remove intermediary steps to look through 2D drawings and manuals to find needed data enables better communication between project professionals and more efficiency to assemble prefabricated electrical conduit.
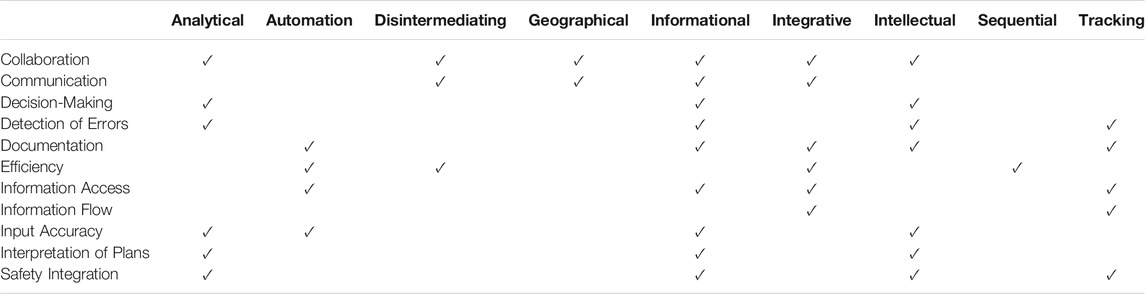
TABLE 3. Matrix of AR impact areas and PSP challenges.
Requirements analysis is the activity of determining and specifying the requirements of the customers. In this study, the customers are the parties involved in the PSP (Maciaszek 2007). Requirement determination provides a narrative definition of functional and non-functional requirements which the customers expect to have in the newly developed and implemented system.
The requirements were defined through interviews with PSP subject matter experts. Eight different types of requirements were identified, namely Visualization, Processing, Data Storage and Retrieval, Data Cataloging, Interaction, Collaboration, Communication, and Production Control. Each of these eight categories contains multiple sub-requirements that provide details about the user requirements. A total of 58 sub-requirements were identified. Each of these categories and sub-requirements is further explained below.
PSP is based on location-based planning, namely Takt-Time Planning, and therefore, it is important for the users (i.e., the Last planner and/or project engineer) to visualize the space and understand their scope of work. The viewpoint of the user through the glasses of the AR headset is part of both the model and the real world. The users can visualize all the activities of a certain phase and identify repeatable work and thus break down the floor into the flow and non-flow areas. The visualization of the flow areas then allows the parties involved in the PSP to agree on the direction of the flow. Individual Last Planners can then choose to visualize a specific activity of a particular phase (for example visualize Duct Mains of the Overhead phase). As the Trade Partners work interdependently and share the same space, it is important for each user to visualize the scope of work of other trades. This process increases coordination, validates the sequence, increases transparency between trades, and creates a common understanding. Additionally, providing the user with the capabilities to visualize their scope of work in 3D, whether at full or adjustable scale, allows them to better understand their work and how it relates to the surroundings and other trades. The visualization of the highlighted daily production along with its measurements (i.e., linear foot measurement) allows the user to better understand the work they are committing to and to keep track of the number of days they have created thus far. By walking through the model, users are able to detect any classes and errors in the model. They can also invoke pre-defined viewpoints and visualize the model from different angles. As 2D drawings are the most used medium of communication and users are familiar with reading them, the new system should allow the user to overlay imported 2D drawings on top of the 3D model. For example, if a user is looking at the 3D model of the first floor of a building, the user can have the option to overlay the needed 2D drawings of the first floor below or above the 3D model. Moreover, allowing the user to physically visualize production areas provides them with a deeper understanding of the scope of work within the selected boundaries. The visualization of the space also allows the user to spot any clashes, constraints, and safety issues. The visualization of 4D animations of the sequence of activities of a phase will allow the user to validate their sequence. The visualization of flow will thus enhance the users’ understanding of the flow of resources (such as materials, equipment, and workers).
Data processing represents the thinking performed by the computer to analyze and represent the data. The AR system needs to provide the user with the measure of the created daily production by calculating the distance between the start and endpoint of selected daily production. This feature provides the user with additional information to develop a more accurate production plan. Additionally, when a production area is created, the total scope of work should be quantified. This will allow the user to input their production information accordingly. The square footage of the area can be also calculated to give the users an understanding of the space, which will allow them to accurately select the number of workers to perform work in the selected production area. Moreover, the users should be provided with the total number of days (i.e., daily productions) within the created production areas. This feature will enhance the decisions made by the user on whether the workflow is balanced or not within production areas. Furthermore, the quantification of the scope of work and number of days within each production area of a phase need to be graphically represented to the users.
In order for the AR system to be valuable, the user should be able to save any digital changes (created objects, annotations, information) made to the model and load them at any other time. Such functionality allows the user to perform the PSP in multiple sessions without losing previous work. Furthermore, the outputs of the PSP need to be documented and made available to users for future use.
The 3D model is an information-rich repository that contains information related to each component in the system. The user can access this data through data cataloging. This feature provides a query-able interface where information is stored, allowing the user to access the required information when needed.
To perform the PSP, the user needs to identify and select repeatable work, create flow and non-flow areas, highlight their daily productions of an activity and create 3D production areas. The user needs to be able to adjust and delete the digital content that they created. Additionally, the 3D model and all associated contents need to be scalable to allow the user to configure their own preference settings. The user should be also able to rotate the model and visualize it from different angles. The AR interface should also capture input from the user, such as allowing the user to enter production information for a production area. The AR system should not only display digital content to the user, but it should also allow the user to create in-situ information by annotating digital objects, highlighting constraints, and marking safety hazards. Furthermore, the user should be able to create new user-defined viewpoints and take screenshots of the displayed content. Furthermore, the user needs to be able to specify the sequence of the work and create 4D simulations that simulate this sequence.
The AR system should foster both local and remote collaboration. Face-to-face experience can be augmented with AR while having multiple users be virtually present in the model, improving collaboration. Co-located users can see shared 3D virtual objects and interact with or a remote user can annotate the live video view of a remote user, enabling multiple users to collaborate at a distance.
PSP participants should be able to visualize what the AR user is seeing. Streamlining and broadcasting of the live video of the user’s view provide a new communication medium.
The AR system should be also flexible to be used not only for planning but also for production control. The user needs to be able to bring the 3D model and associated digital content to the site and overlay them onto the real environment at full scale. In addition, the user needs to be able to track the completion of their work.
In order to integrate AR into the PSP, the relationship between the aforementioned sub-requirements and the different AR opportunities were investigated. Similar to the approach undertaken to develop the matrix of the AR impact areas and PSP challenges, the five PSP experts were asked to elaborate on each identified sub-requirement and discuss how AR can help achieve it. For example, under the “visualization” requirement category, experts noted that in an AR-enabled PSP should allow the user to automate the selection of a set of activities within a certain production area while displaying relevant information about the activities and production areas. This sub-requirement of the experts was labeled as “visualize activities within selected production areas” and it interacts with two AR impact areas: automation and informational. The various discussions held with the experts resulted in a Requirement Matrix (RM) that displays the relationships between sub-requirements (rows) and AR impact areas (columns). An excerpt of the RM is illustrated in Table 4 for the visualization category.
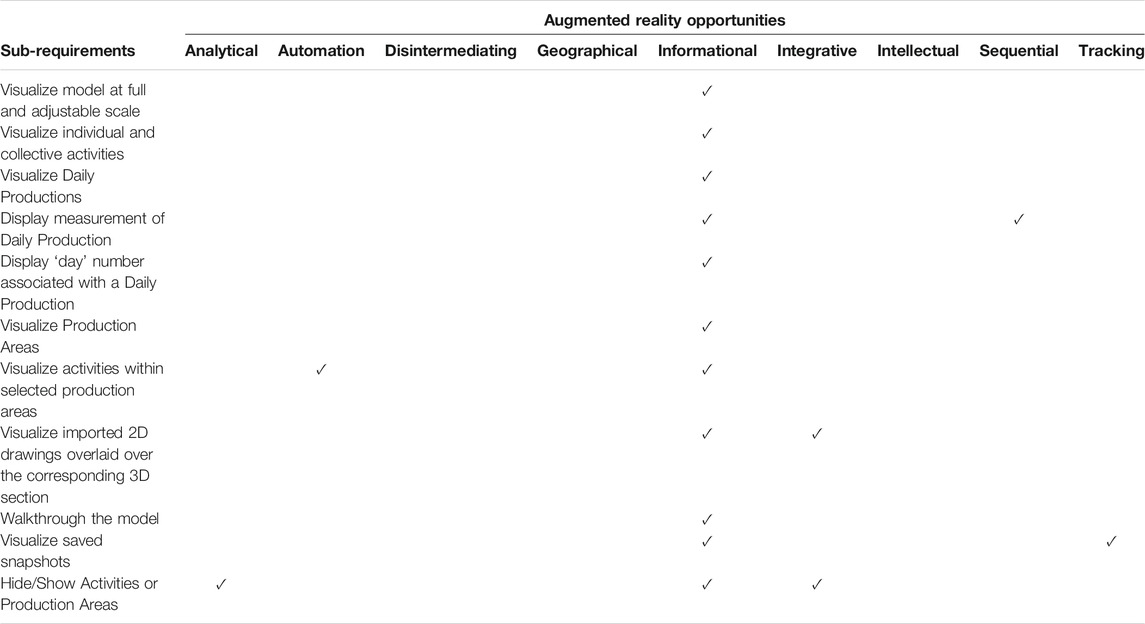
TABLE 4. Requirement matrix—visualization sample.
After identifying the challenges encountered in the current PSP and exploring opportunities for integrating AR, an AR-enabled PSP is envisioned in which the BIM model is used as the guide and chief reference for production strategy development. BIM is thus a precursor to implementing AR-enabled PSP and AR allows the last planners not only to see the BIM model from different perspectives but also to become a participant in the process of virtual production. The envisioned AR-enabled PSP was developed based on the input received from the PSP subject matter experts on the currents state, challenges, and AR opportunities. The authors developed a flowchart (Figure 1) to convey the vision of the PSP subject matter experts of an AR-enabled PSP. The flowchart was then reviewed with the subject matter experts. Figure 1 outlines the five steps for PSP and the different actions or tasks that are constitute each step. The prerequisite step (i.e., Step 0) is not included in the flowchart because it acts as a step to prepare the team to initiate PSP. Additionally, it should be noted that, based on the requirements matrix, opportunities to integrate AR can be seen with many of the actions illustrated in the flowchart, however, compared to the Traditional PSP, the subject matter experts introduced additional opportunities (highlighted in grey) that do not currently exist in the Traditional PSP but can be enabled in an AR environment. The prerequisite step and the five PSP steps as envisioned in an AR environment are described next.
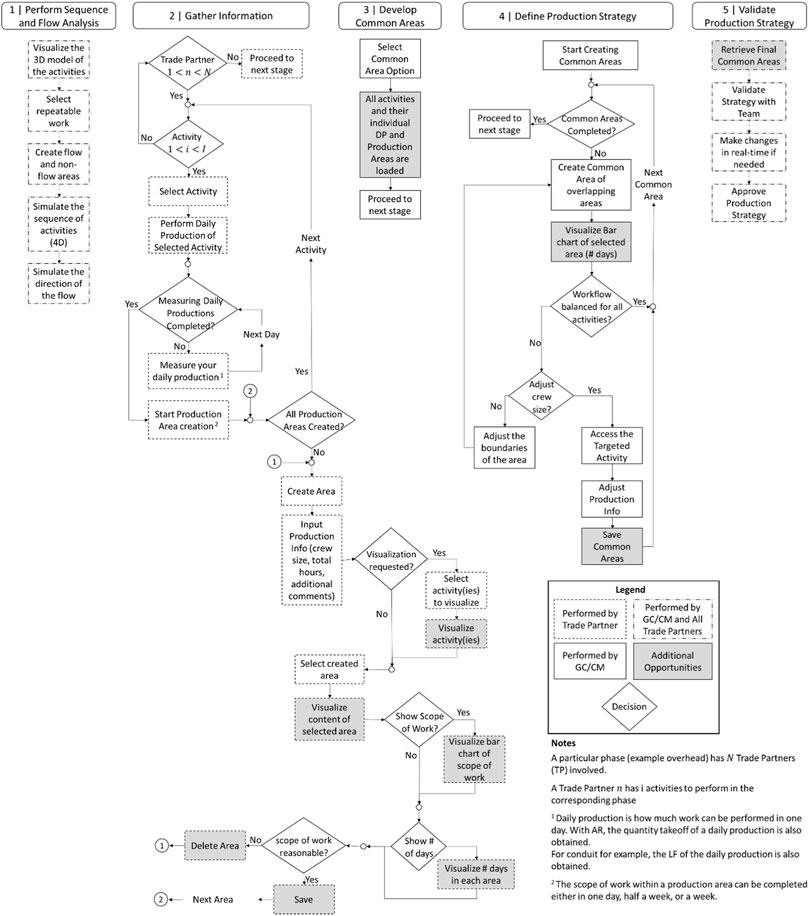
FIGURE 1. Flowchart of the AR-enabled future state of the production strategy process.
In addition to the prerequisite of the Traditional PSP, the AR-enabled PSP integrates AR with BIM and projects the 3D-designed model (as well as other non-geometric data) into the user’s view. As BIM is a prerequisite for the AR-enabled PSP, it is important that the designed BIM includes the information needed to perform the Production Strategy. When discussing the use and reliance of the BIM information, it is important to discuss the Level of Development (LOD) of the model.
LOD Specification is “a reference that enables practitioners in the construction industry to specify and articulate with a high degree of clarity the content and reliability of Building Information Models at various stages in the design and construction process” (BIMForum 2018). In other terms, LOD is the degree to which the geometry of the element and attached information has been thought through, representing the degree to which project team members can rely on the information provided by the model. Level of Detail, on the other hand, represents how much detail is included in the model element and is thought of as input to the element.
The Fundamental LOD definitions are as follows (BIMForum 2018):
• LOD 100: the model element may be graphically represented in the Model with a symbol or other generic representation, but does not satisfy the requirements for LOD 200.
• LOD 200: The Model Element is graphically represented within the Model as a generic system, object, or assembly with approximate quantities, size, shape, location, and orientation. Non-graphic information may also be attached to the Model Element.
• LOD 300: The Model Element is graphically represented within the Model as a specific system, object, or assembly in terms of quantity, size, shape, location, and orientation. Non-graphic information may also be attached to the Model Element.
• LOD 350: The Model Element is graphically represented within the Model as a specific system, object, or assembly in terms of quantity, size, shape, location, orientation, and interfaces with other building systems. Non-graphic information may also be attached to the Model Element.
• LOD 400: The Model Element is graphically represented within the Model as a specific system, object, or assembly in terms of size, shape, location, quantity, and orientation with detailing, fabrication, assembly, and installation information. Non-graphic information may also be attached to the Model Element.
• LOD 500: The Model Element is a field verified representation in terms of size, shape, location, quantity, and orientation. Non-graphic information may also be attached to the Model Elements. This LOD represents the as-built model and is used by the owner and facility managers after the construction is completed.
The PSP requires an analysis of sequence and low, and therefore, a LOD 350 at least is needed. This level provides the necessary information and detail for cross-trade coordination and construction layout (Yoders 2017). Unlike the conventional practice where the model is based on no particular construction sequence, means, or methods, the model developed in an IPD environment needs to be designed using the most efficient construction sequence (Luth et al., 2013). It is important to have the sequence of the different activities established prior to modeling the project. This practice is specifically possible and promoted on IPD projects where the construction team provides constructability feedback to the design team. As a result, the BIM model is designed for production optimization.
Luth et al. (2013) evaluated and analyzed the modeling effort and impact of different Level of Details in BIM and found that more details in a model do not necessarily mean more modeling work. The authors added that additional effort in modeling can lead to higher precision, and thus, supports decisions made during design and construction. The results of their study are reported to support the feasibility of using BIM LOD 350 during PSP.
The project team:
1. collectively uses the 3D model as a guide and reference to visualize the corresponding construction phase(s) and the relevant activities
2. interacts with the 3D model and selects repeatable work
3. interacts with the 3D model and collectively develops the sequence of activities and identifies potential safety hazards, thus improving the decision-making process in a collaborative environment
4. interacts with the 3D model and collectively discuss flow and non-flow areas
5. interacts with the 3D model and collectively assesses the project and determines the direction of flow.
AR helps project participants from diverse trades better understand each other’s scope and flow of work, facilitating better collaborative decision-making. The output of this step is saved within the 3D model and accessible at any later point by the project team. This central information repository is more efficient than traditional methods and provides additional transparency—all participants are provided with the same information.
Last planners will be among the project team participants with access to the information generated in Step 1. Integration of BIM and AR allows 3D visualization of the scope of work and improves visual understanding by providing an interactive solid model of the whole project. Within the augmented environment, the last planner:
1. selects to only visualize their scope of work
2. performs their daily production for the entire phase in a virtual environment, which in addition to generating 3D color-up drawings, will also create quantity takeoffs. The last planner can also investigate the space for any safety problems and adjust their daily production accordingly
3. creates production areas virtually. This allows the last planner to automatically visualize the scope of work within each area, obtain the total quantity of work to be installed, and input production information (such as labor hours, crew size, working days, constraints, etc.). This information can be easily retrieved by the last planner.
Each last planner can create their production areas and save them to the same source, allowing project managers to coordinate and check for trade clashes.
The General Contractor retrieves the results of the last planner’s work from step 2. Their production areas are overlaid, allowing visual creation of common areas.
The General Contractor, once common areas are developed, retrieves the production information that was input pertinent to each scope of work. This information facilitates the performance of workflow balancing in an environment that updates in real-time, which improves its efficiency. AR thus acts as a decision support tool for the General Contractor as they create the production strategy plan draft.
Once the first-pass production strategy is complete, the team meets in the augmented environment to review it. This greatly enhances collaboration, as it facilitates meetings that do not require co-location of participants, as well as changes that are visible in real-time to all parties. The production plan created in AR can be used during project execution to visualize the work to be installed and to track performed work. Project Percent Complete could be then calculated more accurately and effectively.
In summary, AR has the potential to transform the current state of the PSP. It provides a common source of truth which enables a higher level of collaboration among the participants of the PSP when working in the same space or from remote locations. The AR-enabled PSP is a centralized reference that encompasses the different types of information used during the PSP. AR enables the users to interact with the built product in real-time, thereby enhancing visualization, space perception, and decision-making. The technology also allows last planners to identify potential safety hazards during planning and integrate safety more effectively into the production strategy.
Once the future state was envisioned and the concept of AR-PSP was discussed, a prototype was built. Developing a prototype is a way to simulate and test the operations of the new process (Davenport 1993). Muñoz and Miller-Jacobs (1992) noted in their study that “prototyping is externalizing and making concrete a design idea for the purpose of evaluation”. A prototype was developed in this research as a proof-of-concept to showcase and validate the impact of AR on the PSP. Throughout the development of the prototype, feedback from the construction industry, specifically from PSP subject matter experts was incorporated into the design to continuously furnish usability insights and to ensure the effectiveness of the software.
At the time the study was conducted, the HoloLens 1 headset from Microsoft has a see-through holographic display and is the only AR head-mounted display (HMD) commercial system that is available with potential for applications for the construction industry (Agarwal, 2016). A study conducted by Nassereddine et al. (2021) reported that the HoloLens headset is the device that is most commonly used in construction. Chalhoub and Ayer (2017) used the Microsoft HoloLens to examine the use of Mixed Reality as a new visualization tool for electrical prefabrication where virtual elements where anchored into the real environment. Therefore, the AR-enabled PSP prototype was developed for the HoloLens.
The cross-platform Unity 3D game engine was used to build a proof-of-concept of the AR-enabled PSP. Developing an AR application for the HoloLens requires the use of the Universal Windows Platforms (UWP) to create 3D (holographic) applications. Such applications use Windows Holographic Application Program Interface (API). Therefore, Microsoft recommends the use of Unity to create 3D applications for the HoloLens (Newnham 2017; Ong 2017).
As prototyping is a visualization of the requirements, the 58 sub-requirements identified to envision and design the future AR-enabled state of PSP were discussed and prioritized with subject matter experts and end-users. As a result, and based on the programing knowledge and current maturity of the technology, 25 sub-requirements out of the 58 were selected to be included in the AR-enabled PSP prototype.
The prototype development consists of two steps: 1) paper prototype and 2) class diagram.
Paper prototyping is an interactive technique that consists of a paper mockup of the desired user interface (Arnowitz et al., 2010). It is a well-established and widely used technique in traditional user interface design that supports the design team in early development phases to brainstorm, design, create, test, communicate and discuss ideas and concept variations (Snyder 2003). Paper prototyping also allows the design team to receive early feedback from the users and adjust and refine the design accordingly (Lauber et al., 2014). The paper prototyping technique was employed to turn abstract ideas more concrete, brainstorm, design, and create the user interface of the AR-enabled PSP prototype and communicate the design to industry practitioners and received their feedback. Figure 2 presents an example of a segment of the paper prototype created and reviewed with the end-users. The 3D environment (i.e., the space), the user, and the virtual content are depicted in Figure 2. This exercise enabled the researchers to plan for the prototype. Once the paper prototype was created, usability tests were conducted with PSP subject matter experts to iterate, improve, and refine the design based on input from real users.
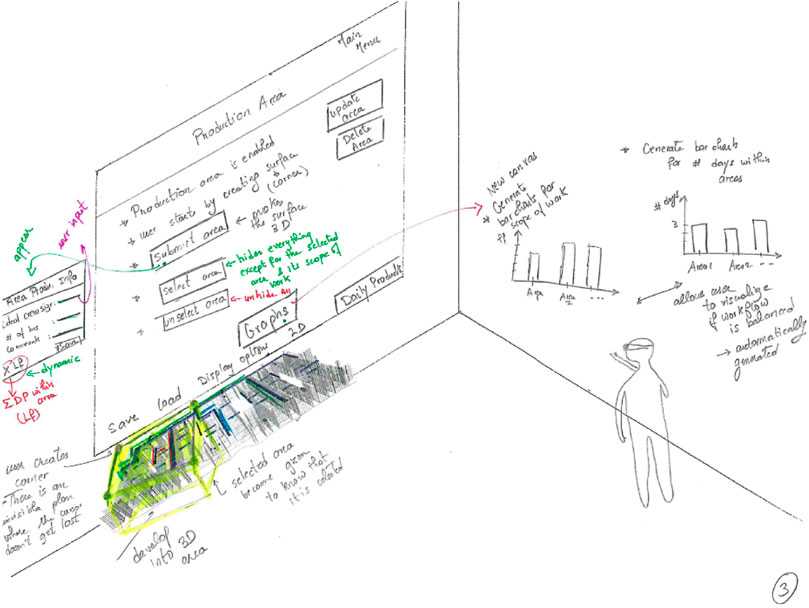
FIGURE 2. Example of the Paper Prototype created for the AR-enabled PSP Prototype.
Once the paper prototype is, and prior to coding the prototype, it is important to visualize the design of the software and model the static structure of the system. Class diagrams are one of the most commonly used Unified Modeling Language (UML) diagrams that encapsulate details about the entities that make up the system (software) and the static relationships between them (Pilone and Pitman 2005). A class diagram is developed to model the system of the application and translate the model (paper prototype) into programming code. UML class diagrams are an important step that lays out the foundation for the implementation of the prototype (Glover 2018).
The coded prototype was developed in the Unity Gaming engine. Holographic Remoting was used to stream the application to the HoloLens. This technique allows running the application on the device while skipping the time-consuming build and deployment processes.
The BIM model (LOD350) of an ongoing healthcare project was provided. From the moment the 3D model was acquired to the time when the validation phase would take place, it was anticipated that the construction team would be developing the production strategy of the overhead to the third floor of the project. Therefore, a series of selection sets were created in Navisworks to only show the overhead work of the third floor. Including all of the overhead activities and systems resulted in a very large file size that couldn’t be exported into FBX (Filmbox) format. In an attempt to reduce the size of the model, it was decided to only include four overhead activities: Duct Mains, Duct Low Pressure, Hot Mechanical Water, and Domestic Water and Medical Gas. In addition, walls (including studs and the top and bottom track) were also kept visible in order to allow the user to position themselves in the building. The modeled elements were exported from Navisworks into FBX format (size 98 MB) and imported into the Unity gaming engine, where it was optimized to run smoothly on the HoloLens. It should be noted that discussion on the size of the model is beyond the scope of this paper as the focus is on understanding the capabilities of the technology rather than addressing technical challenges that are being tackled by technology solutions providers.
The following series of figures are screenshots of the prototype (Figures 3–8). Figure 3 depicts the first view that is displayed for the user when wearing the HoloLens headset and using the AR-enabled PSP prototype. The pre-loaded 3D model of the project is displayed along with a canvas that the user can interact with. The canvas includes instructions for the user to navigate the application. Users can walk through the model and interact with its elements to perform sequence and flow analysis (step 1). Figure 4 provides an example of how the user can perform virtual takeoffs in an AR environment to specify daily production for a particular type of work (e.g., duct work as illustrated in Figure 4). Figure 5 presents an example of virtual production areas that user can create in order to begin developing production areas of their corresponding scope of work that are in alignment with the specified Takt time. Figure 6 shows how the user can input and record production and productivity data related to the created production area. To ensure balanced work, the prototype has a feature to enable to user to examine a bar chart of the scope of work as well as number of days across the different production areas, as depicted in Figures 7, 8. Figures 4–8 present an example of the second PSP step where information is being gather from every trade.
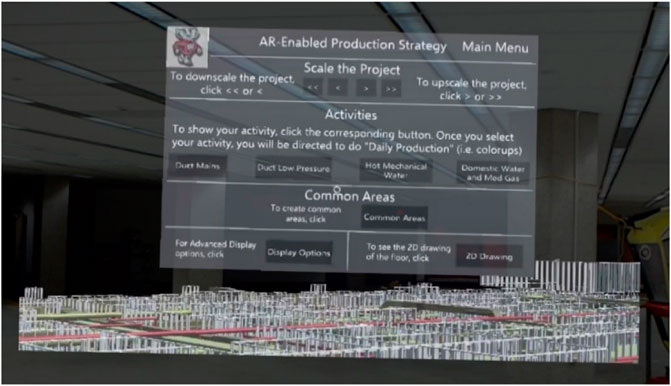
FIGURE 3. User’s First View of the menu and the 3D model.
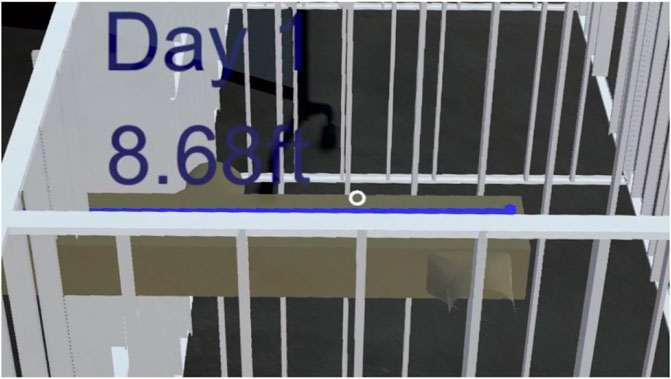
FIGURE 4. Quantity takeoff of a daily production—day 1.
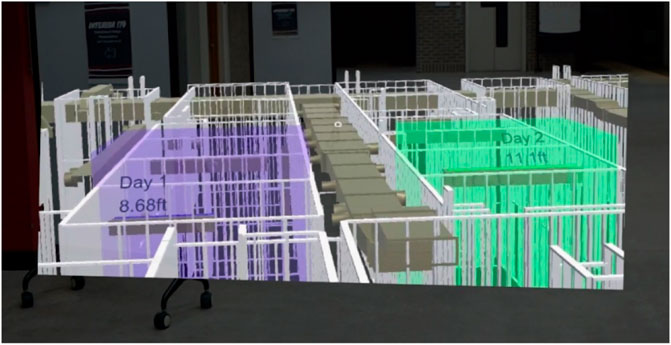
FIGURE 5. Production areas.
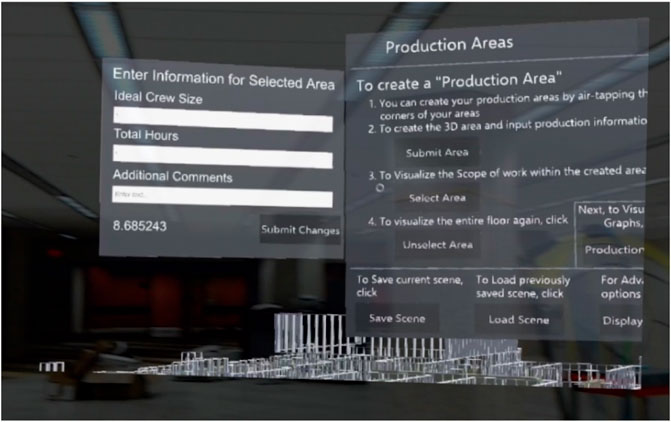
FIGURE 6. Input production information related to the created production area.
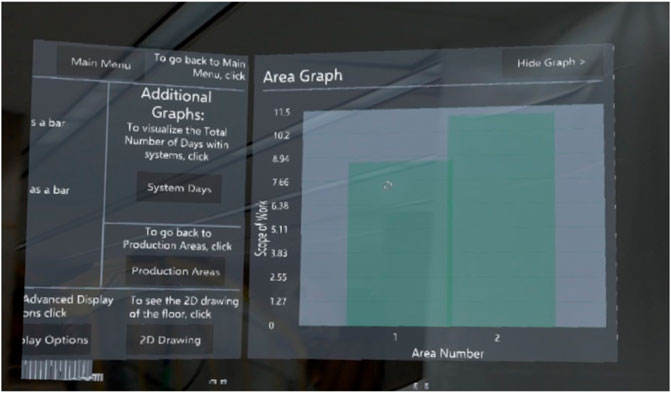
FIGURE 7. Automated bar chart of scope of work within the different production areas of the selected activity.
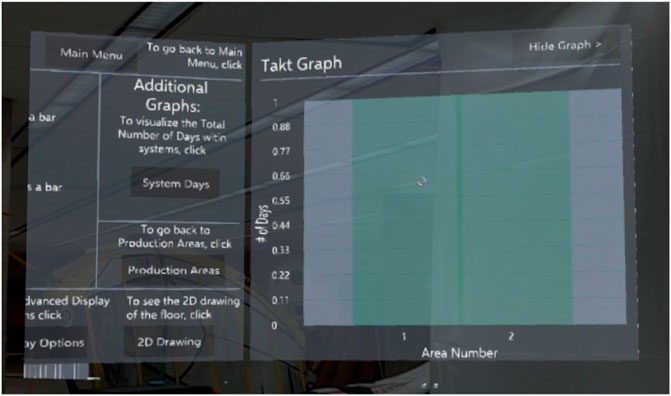
FIGURE 8. Automated bar chart of number of days within the different production areas of the selected activity.
Once the prototype was fully developed, it needed to be reviewed and validated by external stakeholders i.e., PSP subject matter expert, in this case. Multiple evaluation methods can be used to assess and validate the coded prototype. The two methods that are used to validate the AR-enabled PSP are 1) usability testing and 2) survey. Arnowitz et al. (2010) indicated that these two evaluation methods are very appropriate to validate coded prototypes. Usability testing is conducted using a one-on-one protocol to validate the usability of the design with selected participants via direct review and interaction with a simulation of the design. Surveys, on the other hand, allow for a more formal evaluation of the software (Arnowitz et al., 2010). Macefield (2009) noted that while there is no “one size fits all” figure for the optimal group size for usability studies, most studies range between 3 and 20 participants. This study also noted that generating statistical evidence is enabled when the sample size is greater than eight (Macefield 2009). For instance, Chalhoub and Ayer (2017) included 18 participants in their usability study to test their HoloLens supported prefabrication task.
The prototype was validated on an ongoing construction project with 20 participants with experience using PSP. Participants had to have PSP experience because the validation of the prototype asked participants to reflect on their experience using the Traditional PSP and compare it to their experience using the AR-enabled PSP through the usability test. A short presentation was first delivered to participants to introduce them to the research topic, review the steps of the PSP, explain the technology (AR), outline the research hypotheses, and provide an overview of the demonstration software. Participants were also provided with short tutorial videos that demonstrated the functionalities of the prototypes and asked to familiarize themselves with the software and its capabilities. In addition, the means of interacting with the prototype (gaze and air-tap and tap and hold gestures) were explained and demonstrated to the participants.
Once participants were informed about the objective and process of the study, they were first asked to test the prototype (i.e., gain experience using the AR-enabled PSP) and were then asked to complete a survey to capture their feedback (i.e., to compare their experience using the Traditional PSP to that using the AR-enabled PSP). Physical and digital copies of the survey were distributed and a total of 20 surveys were obtained from the 20 participants.
Participants were asked to select their age category. Forty five percent of participants were between 18 and 34 years, 35% between 35 and 44 years, 15% between 45 and 54, and the remaining 5% between 55 and 64. Participants were also asked to specify their current job title. Five out of the 20 participants are Project Managers, and three participants are Field Engineer. Single responses were collected from participants with the following titles: Project Engineer, Project Technology, VDC Specialist, Project Manager/BIM Manager, Steamfitter Foreman, Foreman, MEP Coordinator, Senior Project Manager, Director of Production Planning and Innovation, Production Engineer, BIM Coordinator, Member of the Performance and Innovation Resources Team.
The respondents’ expertise in construction ranged from 2 to 27 years, with average expertise of over 13 years. During their years of experience in the construction industry, the number of projects that the participants worked on ranged from 2 to over 100 projects. Out of these projects, participants were asked to identify the number of projects on which they have been involved in PSP. The respondents’ experience with PSP ranged from 1 project to over 20 projects.
The subsequent survey sections asked respondents to provide feedback and perspectives on the following:
a. Traditional PSP vs. AR-enabled PSP
b. AR-enabled PSP software and hardware
c. AR as a technology
The results collected from each survey section are discussed next.
The second section of the survey consisted of 11 questions that compared between the traditional and AR-enabled processes in 11 areas: Collaboration, Communication, Decision-Making, Detection of Errors, Documentation, Efficiency, Information Access, Information Flow (Navigation), Input Accuracy, Interpretation of Plans (Spatial Cognition), and Safety. These questions were extracted from the challenges identified in an earlier section. Drawing on previous experience using the Traditional PSP and experience with the AR-enabled PSP gained through the usability test of the prototype, each participant was asked to compare each of the 11 areas for the two PSP types (i.e., Traditional vs AR-enabled). The researchers hypothesized that the AR-enabled PSP prototype overcomes the shortcomings of the Traditional PSP. For instance, as collaboration has been identified as a challenge associated with the Traditional PSP, it is hypothesized that the AR-enabled PSP prototype promotes collaboration better than the Traditional PSP. Therefore, 11 hypotheses were formulated which are discussed in the following sections. Since there are two groups under comparison (Traditional PSP and AR-enabled PSP Prototype) and due to the qualitative nature of the collected data, the non-parametric Mann-Whitney Wilcoxon (MWW) test was used to test the hypotheses and determine any statistical significance between the two processes. The test returned a p-value for each hypothesis. If that p-value is less than 0.05, then there is a statistically significant difference between the compared groups. If it is greater than 0.05, then there is no statistically significant difference.
To test the level of collaboration in the Traditional and AR-enabled processes, participants were asked to rate how successfully collaboration was promoted in each of the Traditional PSP and AR-enabled PSP. Collaboration was measured on a five-point Likert scale of marginally (1), somewhat (2), moderately (3), significantly (4), and extremely 5) as shown the Table 5.
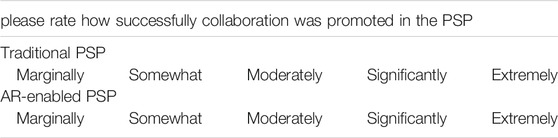
TABLE 5. Example of a question to compare the collaboration between the traditional and AR-enabled PSP.
Figure 9 presents comparative boxplots of the level of collaboration in each of the traditional and AR-enabled processes. As can be seen, the AR-enabled PSP promoted collaboration more than the traditional process.
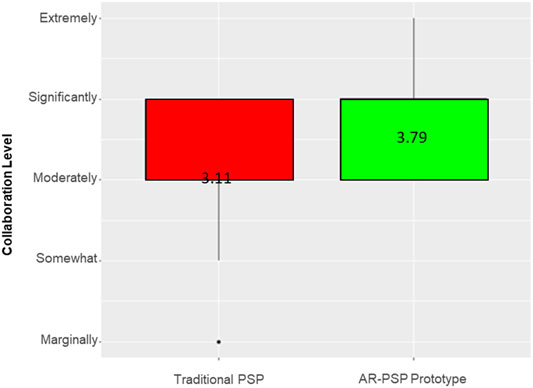
FIGURE 9. Collaboration—Traditional PSP vs AR-PSP.
In order to test whether this difference is significant, the non-parametric MWW test was conducted to statistically compare the level of collaboration in the two processes. The low p-value resulting from the MWW test (0.016) provides statistical evidence at the 95% confidence level indicating that, on average, the AR-enabled PSP promotes collaboration more than the Traditional process. The average scores for all areas of comparison are presented in Table 6 and a similar analysis was conducted for the other 10 challenges and the results of MWW tests are reported in Table 7.
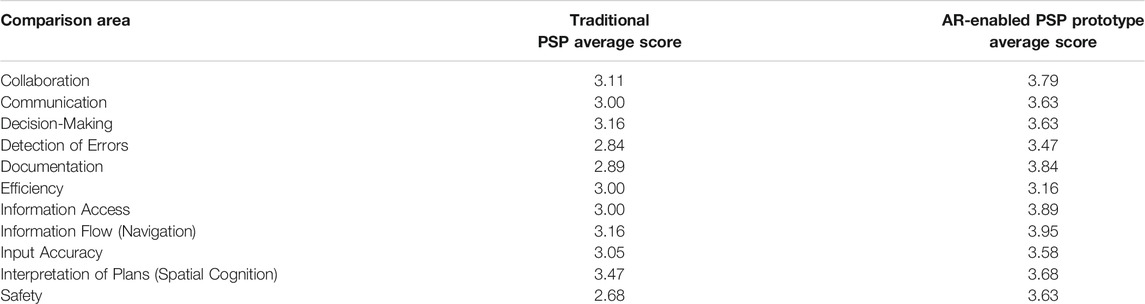
TABLE 6. Average scores for the 11 areas of comparison.
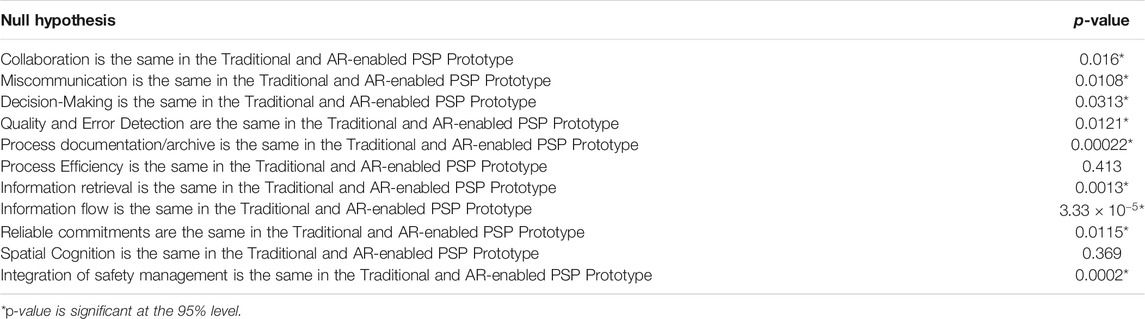
TABLE 7. Hypotheses to compare the traditional PSP and the AR-enabled PSP prototype.
The results from the MWW tests showed, on average, significance at 95% confidence level for the following conclusions:
• The AR-enabled PSP promotes collaboration more than the Traditional process (with a p-value of 0.016).
• The AR-enabled PSP reduces miscommunication more than the Traditional process (with a p-value of 0.0108).
• The AR-enabled PSP facilitates decision-making more than the Traditional process (with a p-value of 0.0313).
• It is easier to detect errors in the AR-PSP than it is in the Traditional PSP (with a p-value of 0.0121).
• The AR-enabled PSP improves the efficiency of the documenting and archiving of the process (with a p-value of 0.00022).
• The AR-enabled PSP eases information access and retrieval than the Traditional process (with a p-value of 0.0013).
• The AR-enabled PSP supports information flow more than the traditional PSP (with a p-value of
• The AR-enabled PSP produces more reliable commitments than the Traditional process (with a p-value of 0.0115).
• The AR-enabled PSP allows and facilitates the integration of safety management more than the Traditional process (with a p-value of 0.0002).
No significant difference was, however, found between the Traditional and AR-enabled PSP in terms of spatial cognition and time efficiency of the process (with p-values of 0.413 and 0.369 respectively). The results of spatial cognition can be supported by the fact that participants have on average 13 years of experience in construction and reading 2D drawings, and therefore, the mental workload between the two mediums (2D drawings and 3D projected model) is similar. The small sample size did not allow for a comparison of participants’ responses based on their age category. The non-significance result of process efficiency is supported by the participants indicating that it takes time and practice to get used to the AR environment which makes the AR-enabled PSP seem slower.
The third section of the survey concerned the participants’ opinion and experience with the AR-enabled PSP prototype. The questions included in this section were mainly focused on evaluating the software itself. Respondents were asked to rate the following software evaluation criteria: 1) level of satisfaction with the prototype, 2) quality of the prototype, and 3) level of precision of the prototype. Each criterion was measured on a five-point Likert scale of very low (1), to low (2), moderate (3), high (4), very high (5). On average, respondents were moderately to highly satisfied with the prototype (3.63) and were moderately satisfied with the quality and level of precision of the prototype (3.26 and 3.16, respectively).
In addition to investigating their level of satisfaction with the prototype, participants were asked about their potential future use of the AR-enabled PSP. Participants were asked about:
1. their likelihood to use the AR-enabled PSP over the Traditional PSP, and
2. their likelihood to recommend the AR-enabled PSP to others.
This likelihood was measured on a five-point Likert scale of not at all (1), slightly (2), moderately (3), very likely (4), and extremely (5). On average, participants were moderately likely to use the AR-enabled PSP over the Traditional PSP (3.05) and to recommend the use of the AR-enabled PSP to others (3.16).
In addition to evaluating the software, it was important to evaluate the hardware as well. This fourth section of the survey concerned the participant experience and opinion with the HoloLens HMD. Participants were asked to rate four hardware evaluation criteria using the following five-point Likert scale: very low (1), to low (2), moderate (3), high (4), very high (5). The results showed that participants were on average moderately to highly comfortable wearing the device (3.63), moderately satisfied with the rate of adaptation to using the device (3.37) and with the device itself (3.16), and moderately comfortable while operating the device (3.11).
The fifth section of the survey included two sets of questions to solicit participants’ opinions and feedback regarding the capabilities of AR as a promising technology in PSP. The first set of questions asked participants about their level of agreement with four AR capabilities using a five-point scale of strongly disagree (1), disagree (2), undecided (3), agree (4), and strongly agree (5). The results indicated that on average, respondents agree that AR enhances their cognitive understanding of the process, facilitates the decision-making process (these results also support those of the fifth null hypothesis), provides the user with the needed and desired type of information, and allows for a natural way to interact with the displayed information.
The second set of questions asked participants to rate the impact of AR on PSP in nine different areas or categories using a five-point Likert scale of very low (1), low (2), moderate (3), high (4), and very high (5). The results are reported in Table 8.
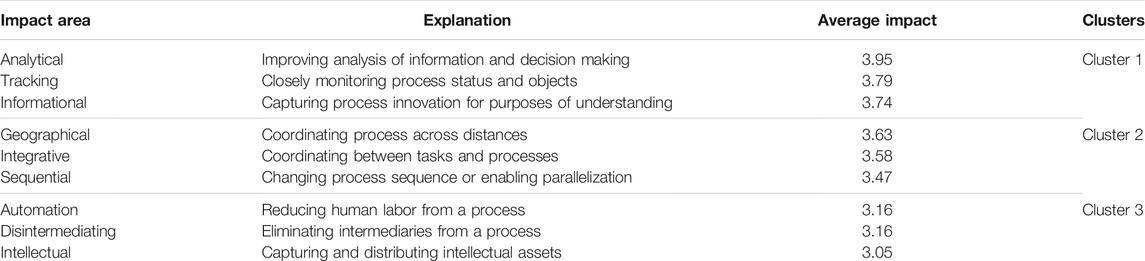
TABLE 8. Clustered table of the impact areas of AR on PSP.
The nine impact areas were divided into clusters to gain a better understanding of the areas in which AR has the highest impact on PSP. The cluster analysis grouped the nine areas into three clusters based on the participants’ average impact with each cluster encompassing three areas. The three areas of Cluster 1 are the areas where AR has the highest impact on PSP and are as follows: Analytical (3.95), Tracking (3.79), and Informational (3.74).
While most of the reviewed literature focused on the avenues to integrate AR into site operations (visualizing blueprints, safety, etc.), this research effort focuses on integrating AR into the Production Strategy Process (PSP). A process map was presented to illustrate the current state of the practice of PSP based on previous research and industry expertise. Challenges encountered in the existing PSP were identified, and opportunities to address them via AR were explored. A conceptual future state of the PSP was designed. A prototype of the AR-enabled PSP was then developed and implemented. Using a BIM model from a real-world construction project, the prototype was then validated on an ongoing construction project. The results of the validation phase (usability testing and surveys) showed that the AR-enabled PSP has the following benefits over the Traditional PSP:
• improved collaboration,
• reduced miscommunication,
• increased quality and detection of errors,
• enhanced decision-making,
• better documentation,
• better information access,
• improved information flow,
• increased input accuracy, and
• increased integration of safety considerations.
These benefits were tested through a series of hypotheses comparing both processes. No significant difference was found, however, between the Traditional and AR-enabled PSP in terms of spatial cognition and time efficiency of the process.
While research showcased the benefits of integrating AR with PSP, the type of data collected from the surveys was qualitative and, thus, provided measures of the perception of the participants rather than specific percentages that show how superior the AR-enabled PSP is compared to the Traditional PSP. Moreover, the impact of the AR-enabled PSP on the entire project was not assessed. Future work can evaluate the impact of integrating AR into production strategy on the entire project. Additionally, the AR-enabled PSP explored in this research covered only the production planning part of Production Planning and Control, the application of the AR-enabled process can be extended to control, reinforcing the view of AR-enabled PSP as a single point-of-truth that centralized information. Further studies can build upon this work to study the integration of AR throughout the entire production planning and control system. The implementation of AR could be also extended to the design phase of the construction project lifecycle.
The raw data supporting the conclusions of this article will be made available by the authors, without undue reservation.
All authors listed have made a substantial, direct, and intellectual contribution to the work and approved it for publication.
The authors would like to thank The Boldt Company for their continuous support throughout this research effort and for partially funding this project.
The authors declare that the research was conducted in the absence of any commercial or financial relationships that could be construed as a potential conflict of interest.
All claims expressed in this article are solely those of the authors and do not necessarily represent those of their affiliated organizations, or those of the publisher, the editors and the reviewers. Any product that may be evaluated in this article, or claim that may be made by its manufacturer, is not guaranteed or endorsed by the publisher.
The authors would also like to thank Parker Schroeder for helping in implementing the AR-enabled PSP.
Abdelhamid, T., Jain, S., and Mrozowski, T. (2010). “Analysing the Relationship between Production Constraints and Construction Work Flow Reliability: An SEM Approach,” in Proc. 18th Ann. Conf. of the Int’l Group for Lean Construction, 14–16.
Agarwal, S. (2016). “Review on Application of Augmented Reality in Civil Engineering,” in International Conference on Inter Disciplinary Research in Engineering and Technology, New Delhi, India, 71.
Ahmad, I. U., Russell, J. S., and Abou-Zeid, A. (1995). Information Technology (IT) and Integration in the Construction Industry. Construction Manage. Econ. 13 (2), 163–171. doi:10.1080/01446199500000018
Antunes, R., and Poshdar, M. (2018). “Envision of an Integrated Information System for Project-Driven Production in Construction,” in Proc. 26th Annual Conference of the International Group for Lean Construction (IGLC) (Chennai, India: IGLC), 134–143. doi:10.24928/2018/0511
Arayici, Y., Coates, P., Koskela, L., Kagioglou, M., Usher, C., and O'Reilly, K. (2011). Technology Adoption in the BIM Implementation for Lean Architectural Practice. Automation in Construction 20 (2), 189–195. doi:10.1016/j.autcon.2010.09.016
Arayici, Y., Egbu, C., and Coates, S. (2012). Building Information Modelling (BIM) Implementation and Remote Construction Projects: Issues, Challenges, and Critiques. J. Inf. Technol. Construction 17, 75–92.
Arnowitz, J., Arent, M., and Berger, N. (2010). Effective Prototyping for Software Makers. Amsterdam, Netherlands: Elsevier.
Aromaa, S., Väätänen, A., Aaltonen, I., and Heimonen, T. (2015). “A Model for Gathering and Sharing Knowledge in Maintenance Work,” in Proceedings of the European Conference on Cognitive Ergonomics 2015, ACM, 28. doi:10.1145/2788412.2788442
Aslam, M. S., Huang, B., and Cui, L. (2020). Review of Construction and Demolition Waste Management in China and USA. J. Environ. Manag. 264, 110445. doi:10.1016/j.jenvman.2020.110445
Bajjou, M. S., and Chafi, A. (2021). Exploring the Critical Waste Factors Affecting Construction Projects. Engineering, Construction and Architectural Management.
Ballard, G., and Howell, G. (1994a). “Implementing Lean Construction - Improving Downstream Performance,” in 2nd Annual Conference on Lean Construction, Santiago, Chile, 101–110.
Ballard, G., and Howell, G. (1994b). Implementing Lean Construction: Stabilizing Work Flow. Lean construction, 101–110.
Ballard, G., and Howell, G. (1998). “What Kind of Production Is Construction?” in Proc. 6 th Ann. Conf. of the Int’l Annual Conference International Group for Lean Construction, 7.
Ballard, G., and Tommelein, I. (2016). Current Process Benchmark for the Last Planner System. Lean Construction J. 89, 42.
Ballard, H. G. (2000). “The Last Planner System of Production Control,”. PhD Thesis (Birmingham: University of Birmingham).
Billinghurst, M., and Kato, H. (2002). Collaborative Augmented Reality. Commun. ACM 45 (7), 64–70. doi:10.1145/514236.514265
BIM Alliance (2018). BIM Alliance on BIM. BIM Alliance. Available at: https://www.bimalliance.se/vad-aer-bim/bim-alliance-om-bim (Accessed Dec 19, 2018)./
Biron, J., and Lang, J. (2018). Unlocking the Value of Augmented Reality Data. MIT Sloan Manage. Rev.
Calderon-Hernandez, C., and Brioso, X. (2018). Lean, BIM and Augmented Reality Applied in the Design and Construction Phase: A Literature Review. Int. J. Innovation, Manage. Technol. 9 (1), 60–63. doi:10.18178/ijimt.2018.9.1.788
Chalhoub, J., and Ayer, S. K. (2017). Mixed Reality for Electrical Prefabrication Tasks. Comput. Civil Eng. 2017, 76–83. doi:10.1061/9780784480847.010
Cheng, J. C. P., Law, K. H., Bjornsson, H., Jones, A., and Sriram, R. (2010). A Service Oriented Framework for Construction Supply Chain Integration. Automation in construction 19 (2), 245–260. doi:10.1016/j.autcon.2009.10.003
Construction Industry Institute (CII) (2018). RT-334 Best Practices for Preventing Out-Of-Sequence Construction Activities and Minimizing Their Impacts. Austin, Texas, United States: Construction Industry Institute.
Dallasega, P., Revolti, A., Sauer, P. C., Schulze, F., and Rauch, E. (2020). BIM, Augmented and Virtual Reality Empowering Lean Construction Management: a Project Simulation Game. Proced. manufacturing 45, 49–54. doi:10.1016/j.promfg.2020.04.059
Dave, B., Boddy, S., and Koskela, L. (2010). “Improving Information Flow within the Production Management System with Web Services,” in Proceedings of the 18th Annual Conference of the International Group for Lean Construction (Haifa, Israel: National Building Research Institute, Technion-Israel Institute of Technology), 445–455.
Dave, B., Kubler, S., Främling, K., and Koskela, L. (2014). Addressing Information Flow in Lean Production Management and Control in Construction. Int. Group Lean Construction.
Dave, B., and Sacks, R. (2020). “Production Control Systems for Construction at the Nexus of Lean and BIM,” in Lean Construction (Oxfordshire, England, UK: Routledge), 54–84. doi:10.1201/9780429203732-4
Davenport, T. H. (1993). Process Innovation: Reengineering Work through Information Technology. Boston, MA, USA: Harvard Business Press.
Diaz, C., Hincapié, M., and Moreno, G. (2015). How the Type of Content in Educative Augmented Reality Application Affects the Learning Experience. Proced. Comput. Sci. 75, 205–212. doi:10.1016/j.procs.2015.12.239
dos Santos, A. (1999). “Application of Flow Principles in the Production Management of Construction Sites,”. PhD Thesis (Salford: University of Salford).
Eastman, C., Fisher, D., Lafue, G., Lividini, J., Stoker, D., and Yessios, C. (1974). An Outline of the Building Description System. Research Report No. 50.
Ebrahim, M., Berghede, K., Thomack, D., Lampsas, P., Kievet, D., and Hanna, A. (2017). “A Framework of Five-Stream Production System for Megaprojects,” in 25th Annual Conference of the International Group for Lean Construction (IGLC), Heraklion, Greece, 9-12 July 2017, 729–736.
El Jazzar, M., Schranz, C., Urban, H., and Nassereddine, H. (2021). Integrating Construction 4.0 Technologies: A Four-Layer Implementation Plan. Front. Built Environ. doi:10.3389/fbuil.2021.671408
El Jazzar, M., Urban, H., Schranz, C., and Nassereddine, H. (2020). “Construction 4.0: A Roadmap to Shaping the Future of Construction,” in ISARC. Proceedings of the International Symposium on Automation and Robotics in Construction (Lyon, France: IAARC Publications), Vol. 37, 1314–1321. doi:10.22260/isarc2020/0180
ElSayed, N. A., Thomas, B. H., Smith, R. T., Marriott, K., and Piantadosi, J. (2015). “Using Augmented Reality to Support Situated Analytics,” in 2015 IEEE Virtual Reality (VR) (Arles, France: IEEE), 175–176.
Forbes, L. H., and Ahmed, S. M. (2011). Modern Construction: Lean Project Delivery and Integrated Practices. Industrial Innovation Series. Boca Raton, FL: CRC Press.
Forcada Matheu, N. (2005). “Information Technologies Applications for Construction,” in Life Cycle Document Management System for Construction (Barcelona, Spain: Universitat Politècnica de Catalunya).
Frances, N., and Mckeown, M. (2021). Double-digit Growth Forecast for Construction in 2021, but with Major Supply and Demand Risks Ahead. Available at: https://www.constructionproducts.org.uk/news-media-events/news/2021/april/double-digit-growth-forecast-for-construction-in-2021-but-with-major-supply-and-demand-risks-ahead/(Accessed Aug10, 2021).
Frandson, A., Berghede, K., and Tommelein, I. D. (2013). “Takt Time Planning for Construction of Exterior Cladding,” in 21st Annual Conference of the International Group for Lean Construction, Fortaleza, Brazil.
Frandson, A., Berghede, K., and Tommelein, I. D. (2014). “Takt-time Planning and the Last Planner.” in Proc. 22nd Ann. Conf. of the Int’l Group for Lean Construction (Boston, Massachusetts, USA: Group for Lean Const), 23–27.
Froese, T. M. (2005). Impact of Emerging Information Technology on Information Management. Comput. Civil Eng. 2005, 1–10. doi:10.1061/40794(179)162
Froese, T. M. (2010). The Impact of Emerging Information Technology on Project Management for Construction. Automation in construction 19 (5), 531–538. doi:10.1016/j.autcon.2009.11.004
Ganah, A., and John, G. A. (2015). Integrating Building Information Modeling and Health and Safety for Onsite Construction. Saf. Health work 6 (1), 39–45. doi:10.1016/j.shaw.2014.10.002
GlobalData (2021). Global Construction Industry Set to Grow by 5.2% in 2021, According to GlobalData. New York, NY, USA: GlobalData.
Glover, J. (2018). Unity 2018 Augmented Reality Projects: Build Four Immersive and Fun AR Applications Using ARKit, ARCore, and Vuforia. Birmingham, UK: Packt Publishing Ltd.
Goedert, J. D., and Meadati, P. (2008). Integrating Construction Process Documentation into Building Information Modeling. J. Constr. Eng. Manage. 134 (7), 509–516. doi:10.1061/(asce)0733-9364(2008)134:7(509)
Gurevich, U., and Sacks, R. (2014). Examination of the Effects of a KanBIM Production Control System on Subcontractors' Task Selections in interior Works. Automation in construction 37, 81–87. doi:10.1016/j.autcon.2013.10.003
Haghsheno, S., Binninger, M., Dlouhy, J., and Sterlike, S. (2016). “History and Theoretical Foundations of Takt Planning and Takt Control,” in Proceedings of the 24th Annual Conference of the International Group for Lean Construction (IGLC 24), Boston, MA, USA, 20–22.
Hamzeh, F., Ballard, G., and Tommelein, I. D. (2012). Rethinking Lookahead Planning to Optimize Construction Workflow. Lean Construction J. 20.
Hamzeh, F., González, V. A., Alarcon, L. F., and Khalife, S. (2021). “Lean Construction 4.0: Exploring the Challenges of Development in the AEC Industry,” in Proc. 29th Annual Conference of the International Group for Lean Construction (IGLC29), Lima, Peru. Editors L. F. Alarcon, and V. A. González, 207–216. online at iglc.net. doi:10.24928/2021/0181
Hatoum, M. B., Nassereddine, H., and Badurdeen, F. (2021). “Reengineering Construction Processes in the Era of Construction 4.0: A Lean-Based Framework,” in Proc. 29th Annual Conference of the International Group for Lean Construction (IGLC29), Lima, Peru. Editors L. F. Alarcon, and V. A. González, 403–412. online at iglc.net. doi:10.24928/2021/0126
Howell, G., and Ballard, G. (1997). Lean Production Theory: Moving beyond ‘Can-Do. Lean construction 1997, 17–23.
Howell, G., and Lichtig, W. (2008). “Lean Construction Opportunities Ideas Practices,” in Speech presented to the Cascadia LCI “Introduction to Lean Design” Workshop, Seattle, Washington, 10.
Kolaventi, S. S., Momand, H., Tadepalli, T., and Siva Kumar, M. V. N. (2020). Construction Waste in India: a Structural Equation Model for Identification of Causes. Proc. Inst. Civil Eng. - Eng. Sustainability 173 (6), 303–314. doi:10.1680/jensu.19.00047
Koskela, L. (2000). An Exploration towards a Production Theory and its Application to Construction. Espoo: Technical Research Centre of Finland.
Koskela, L. (1992). Application of the New Production Philosophy to Construction. Stanford, California: Stanford University.
Koskela, L., Howell, G., Ballard, G., and Tommelein, I. (2002). The Foundations of Lean Construction. Des. construction: Building value 291, 211–226.
Koskela, L. (1999). “Management of Production in Construction: a Theoretical View,” in Proceedings of the 7th Annual Conference of the International Group for Lean Construction, Berkeley, California, USA.
Lagos, C., Herrera, R., and Alarcón, L. F. (2017). “Contributions of Information Technologies to Last Planner System Implementation,” in Proc. Lean & Computing in Construction Congress (LC3) (Vol. 1). doi:10.24928/2017/0255
Lauber, F., Böttcher, C., and Butz, A. (2014). “Papar: Paper Prototyping for Augmented Reality,” in Adjunct Proceedings of the 6th International Conference on Automotive User Interfaces and Interactive Vehicular Applications, ACM, 1–6.
Lean Construction Institute (2016). Last Planner® System. Business Process Standard and Guidelines. Arlington, VA, USA: Lean Construction Institute.
Leinonen, J., Kähkönen, K., Retik, A., Flood, R., William, I., and O’brien, J. (2003). “New Construction Management Practice Based on the Virtual Reality Technology,” in 4D CAD and Visualization in Construction: Developments and Applications, 75–100.
Liker, J. K. (2004). The Toyota Way: 14 Management Principles from the World’s Greatest Manufacturer. New York: McGraw-Hill.
Linnik, M., Berghede, K., and Ballard, G. (2013). “An Experiment in Takt Time Planning Applied to Non-repetitive Work,” in 21th Annual Conference of the International Group for Lean Construction, Fortaleza, Brazil.
Luboschik, M., Berger, P., and Staadt, O. (2016). “On Spatial Perception Issues in Augmented Reality Based Immersive Analytics,” in Proceedings of the 2016 ACM Companion on Interactive Surfaces and Spaces, ACM, 47–53. doi:10.1145/3009939.3009947
Luth, G. P., Schorer, A., and Turkan, Y. (2013). Lessons from Using BIM to Increase Design-Construction Integration. Pract. periodical Struct. Des. construction 19 (1), 103–110.
Macefield, R. (2009). How to Specify the Participant Group Size for Usability Studies: a Practitioner's Guide. J. Usability Stud. 5 (1), 34–45.
Maraqa, M. J., Sacks, R., and Spatari, S. (2021). Quantitative Assessment of the Impacts of BIM and Lean on Process and Operations Flow in Construction Projects. Eng. Construction Architectural Manage. 28 (8), 2176–2198. doi:10.1108/ECAM-12-2020-1068
Miller, R., and Custis, K. (2017). Disruption. Digitalization. Disintermediation. Transportation and Logistics in the Coming Decade.
Modular Building Institute (MBI) (2010). Improving Construction Efficiency & Productivity with Modular Construction. Charlottesville, VA, USA: Modular Building Institute Charlottesville.
Muñoz, R., and Miller-Jacobs, H. H. (1992). “In Search of the Ideal Prototype,” in Proceedings of the SIGCHI conference on Human factors in computing systems, ACM, 577–579.
Muñoz-La Rivera, F., Mora-Serrano, J., Valero, I., and Oñate, E. (2021). Methodological-technological Framework for Construction 4.0. Arch. Computat Methods Eng. 28 (2), 689–711. doi:10.1007/s11831-020-09455-9
Nassereddine, H. M. (2019). Design, Development and Validation of an Augmented Reality-Enabled Production Strategy Process for the Construction Industry. Madison, Wisconsin: The University of Wisconsin-Madison.
Nassereddine, H., Schranz, C., Bou Hatoum, M., and Urban, H. (2020b). “A Comprehensive Map for Integrating Augmented Reality during the Construction Phase,” in Creative Construction e-Conference 2020 (Budapest, Hungary: Budapest University of Technology and Economics), 56–64.
Nassereddine, H., Veeramani, A., and Veeramani, D. (2021). “Exploring the Current and Future States of Augmented Reality in the Construction Industry,” in Collaboration and Integration in Construction, Engineering, Management and Technology (Cham: Springer), 185–189. doi:10.1007/978-3-030-48465-1_31
Nassereddine, H., Veeramani, D., and Hanna, A. (2019). “Augmented Reality-Enabled Production Strategy Process,” in ISARC. Proceedings of the International Symposium on Automation and Robotics in Construction (Lyon, France: IAARC Publications), 297–305. doi:10.22260/isarc2019/0040
Newnham, J. (2017). Microsoft Hololens by Example: Create Immersive Augmented Reality Applications. Birmingham, UK: Packt Publishing Ltd.
Oakland, J., and Marosszeky, M. (2017). Total Construction Management: Lean Quality in Construction Project Delivery. Oxfordshire, England, UK: Routledge.
Ong, S. (2017). Beginning Windows Mixed Reality Programming. Berkeley, CA: Apress 10, 978. doi:10.1007/978-1-4842-2769-5
Oskouie, P., Gerber, D. J., Alves, T., and Becerik-Gerber, B. (2012). “Extending the Interaction of Building Information Modeling and Lean Construction,” in IGLC 2012-20th Conference of the International Group for Lean Construction (Boston, MA, USA: The International Group for Lean Construction).
PricewaterhouseCoopers (2018). Global Construction 2030: A Global Forecast for the Construction Industry to 2030. PwC. Available at: https://www.pwc.com/vn/en/industries/engineering-and-construction/pwc-global-construction-2030.html (Accessed Dec 19, 2018).
Rajaratnam, D., Weerasinghe, D. M. L. P., Abeynayake, M., Perera, B. A. K. S., and Ochoa, J. J. (2021). Potential Use of Augmented Reality in Pre-contract Design Communication in Construction Projects. Intell. Buildings Int. 2021, 1–18. doi:10.1080/17508975.2021.1911776
Ratajczak, J., Schweigkofler, A., Riedl, M., and Matt, D. T. (2019). “Augmented Reality Combined with Location-Based Management System to Improve the Construction Process, Quality Control and Information Flow,” in Advances in Informatics and Computing in Civil and Construction Engineering (Cham: Springer), 289–296.
Rathnasinghe, A., Weerasinghe, L., Abeynayake, M., and Kulatunga, U. (2020). The Evolution of Information Flows in Construction Projects: A Contemporary Study on the Embracing of Augmented Reality 54th International Conference of the Architectural Science Association 2020 Auckland, New Zealand: Architectural Science Association.
Rossini, F. L., Novembri, G., and Fioravanti, A. (2017). “BIM and Agent-Based Model Integration for Construction Management Optimization,” in 25th Annual Conference of the International Group for Lean Construction (IGLC), 9–12. doi:10.24928/2017/0267
Rüßmann, M., Lorenz, M., Gerbert, P., Waldner, M., Justus, J., Engel, P., et al. (2015). Industry 4.0: The Future of Productivity and Growth in Manufacturing Industries. Boston Consulting Group 9 (1), 54–89.
Sacks, R., Korb, S., and Barak, R. (2017). Building Lean, Building BIM: Improving Construction the Tidhar Way. Oxfordshire, England, UK: Routledge.
Sacks, R., Koskela, L., Dave, B. A., and Owen, R. (2010a). Interaction of Lean and Building Information Modeling in Construction. J. Constr. Eng. Manage. 136 (9), 968–980. doi:10.1061/(asce)co.1943-7862.0000203
Sacks, R., Radosavljevic, M., and Barak, R. (2010b). Requirements for Building Information Modeling Based Lean Production Management Systems for Construction. Automation in Construction 19 (5), 641–655. doi:10.1016/j.autcon.2010.02.010
Sacks, R., Treckmann, M., and Rozenfeld, O. (2009). Visualization of Work Flow to Support Lean Construction. J. Constr. Eng. Manage. 135 (12), 1307–1315. doi:10.1061/(asce)co.1943-7862.0000102
Salem, O., and Mohanty, S. (2008). Project Management Practices and Information Technology Research. J. Constr. Eng. Manage. 134 (7), 501–508. doi:10.1061/(asce)0733-9364(2008)134:7(501)
Schimanski, C. P., Monizza, G. P., Marcher, C., and Matt, D. T. (2020). Development of a BIM-Based Production Planning and Control System for Lean Construction through Advancement and Integration of Existing Management Techniques. Front. Eng. Manag. 2020, 1–13. doi:10.1007/s42524-020-0105-5
Schranz, C., Urban, H., and Gerger, A. (2021). Potentials of Augmented Reality in a BIM Based Building Submission Process. ITcon 26 (24), 441–457. doi:10.36680/j.itcon.2021.024
Seppänen, O., Modrich, R., and Ballard, G. (2015). “Integration of Last Planner System and Location-Based Management System,” in 23rd Annual Conference of the International Group for Lean Construction, 123–132.
Sheperis, C., Young, J. S., and Daniels, M. H. (2010). Counseling Research: Quantitative, Qualitative, and Mixed Methods. Boston, MA, USA: Pearson Boston.
Snyder, C. (2003). Paper Prototyping: The Fast and Easy Way to Design and Refine User Interfaces. Burlington, MA, USA: Morgan Kaufmann.
Sriprasert, E., and Dawood, N. (2002). “Next Generation of Construction Planning and Control System: the LEWIS Approach,” in Z. Turk, & R. Scherer, eWork and eBusiness in Architecture, Engineering and Construction, 175–182.
Tezel, B. A., and Aziz, Z. U. H. (2017). From Conventional to IT Based Visual Management: a Conceptual Discussion for Lean Construction. J. Inf. Technol. construction 22, 220–246.
Tommelein, I. D. (2017). Collaborative Takt Time Planning of Non-repetitive Work. Heraklion, Greece: IGLC, 745–752.
Tommelein, I. D. (2015). Journey toward Lean Construction: Pursuing a Paradigm Shift in the AEC Industry. J. Constr. Eng. Manage. 141 (6), 04015005. doi:10.1061/(asce)co.1943-7862.0000926
Usuga Cadavid, J. P., Grabot, B., Lamouri, S., Pellerin, R., and Fortin, A. (2020). Valuing Free-form Text Data from Maintenance Logs through Transfer Learning with CamemBERT. Enterprise Inf. Syst. 2020, 1–29. doi:10.1080/17517575.2020.1790043
Vargas, F. B. D., and Formoso, C. T. (2019). Method for Location-Based Production Planning and Control Supported by BIM. Ambiente Construído 20, 129–151.
Verlinden, J., Horváth, I., and Nam, T.-J. (2009). Recording Augmented Reality Experiences to Capture Design Reviews. Int. J. Interact Des. Manuf 3 (3), 189–200. doi:10.1007/s12008-009-0074-8
Waly, A. F., and Thabet, W. Y. (2003). A Virtual Construction Environment for Preconstruction Planning. Automation in construction 12 (2), 139–154. doi:10.1016/s0926-5805(02)00047-x
Wang, X., and Love, P. E. (2012). “BIM+ AR: Onsite Information Sharing and Communication via Advanced Visualization,” in Proceedings of the 2012 IEEE 16th International Conference on Computer Supported Cooperative Work in Design (CSCWD) (Wuhan, China: IEEE), 850–855.
Wang, X. (2007). Using Augmented Reality to Plan Virtual Construction Worksite. Int. J. Adv. Robotic Syst. 4 (4), 42. doi:10.5772/5677
Webster, A., Feiner, S., MacIntyre, B., Massie, W., and Krueger, T. (1996). Augmented Reality in Architectural Construction, Inspection and Renovation. Third Congr. Comput. Civ. Eng. Proc. 996.
Ying, H., and Lee, S. (2016). “Survey of the Research of ICT Applications in the AEC Industry: a View from Two Mainstream Journals,” in Proceedings of the 16th International Conference on Construction Applications of Virtual Reality (Hong Kong: The Hong Kong University of Science and Technology).
Yoders, J. (2017). “Defining Level of Development for BIM and IPD Projects,” in Civil + Structural Engineer Magazine.
Yusuf, Z., Lukic, V., Heppelmann, J., Melrose, C., Ravi, N., Gill, U., et al. (2021). Unleashing the Power of Data with IoT and Augmented Reality. BCG Glob. Available at: https://www.bcg.com/publications/2020/unleashing-the-power-of-data-with-iot-and-augmented-reality (Accessed Aug 8, 2021).
Keywords: augmented reality, production strategy process, takt-time planning, last planner system, process re-engineering
Citation: Nassereddine H, Veeramani D and Hanna AS (2022) Design, Development, and Validation of an Augmented Reality-Enabled Production Strategy Process. Front. Built Environ. 8:730098. doi: 10.3389/fbuil.2022.730098
Received: 24 June 2021; Accepted: 13 January 2022;
Published: 04 February 2022.
Edited by:
Hung-Lin Chi, Hong Kong Polytechnic University, Hong Kong SAR, ChinaReviewed by:
Pshtiwan Shakor, University of Technology Sydney, AustraliaCopyright © 2022 Nassereddine, Veeramani and Hanna. This is an open-access article distributed under the terms of the Creative Commons Attribution License (CC BY). The use, distribution or reproduction in other forums is permitted, provided the original author(s) and the copyright owner(s) are credited and that the original publication in this journal is cited, in accordance with accepted academic practice. No use, distribution or reproduction is permitted which does not comply with these terms.
*Correspondence: Hala Nassereddine, aGFsYS5uYXNzZXJlZGRpbmVAdWt5LmVkdQ==
Disclaimer: All claims expressed in this article are solely those of the authors and do not necessarily represent those of their affiliated organizations, or those of the publisher, the editors and the reviewers. Any product that may be evaluated in this article or claim that may be made by its manufacturer is not guaranteed or endorsed by the publisher.
Research integrity at Frontiers
Learn more about the work of our research integrity team to safeguard the quality of each article we publish.