 Hala Nassereddine
 Awad S. Hanna2
94% of researchers rate our articles as excellent or good
Learn more about the work of our research integrity team to safeguard the quality of each article we publish.
Find out more
ORIGINAL RESEARCH article
Front. Built Environ., 11 April 2022
Sec. Construction Management
Volume 8 - 2022 | https://doi.org/10.3389/fbuil.2022.730094
This article is part of the Research TopicDigital Technologies for Construction ManagementView all 5 articles
Information is the lifeblood of modern construction. Advances in Information and Communication Technology have been and are continuing to progress at rapid rates. Construction companies that are successfully able to adopt and integrate new technologies will gain a competitive edge. One emerging technology that has great potential to transform the construction industry is Augmented Reality (AR). While AR has been of interest to researchers for some time, no single research effort has yet comprehensively investigated the opportunities, benefits, challenges, and future paths toward implementing AR in modern construction. The main objective of this research is to investigate the potential of AR throughout the lifecycle of a construction project from the perspective of the construction industry. Responses from 93 industry practitioners were collected to investigate use-cases of AR throughout the project lifecycle, highlight potential benefits, and identify obstacles to entry that have slowed the implementation of AR thus far. Cluster analysis was employed to determine AR use-cases with the highest usage potential and identify the highest perceived benefits and obstacles of AR. Finally, the future of AR in construction is forecast through a series of statements that describe potential trends of AR in the construction industry. This study contributes to the existing body of knowledge by exploring the potential of AR as perceived by construction practitioners.
Construction is a highly information-dense industry, requiring by nature extensive exchanges of information between various project stakeholders throughout the project lifecycle (Dave and Koskela 2009). Construction is also an industry that is growing at a rapid rate, which projections placing global construction expenditure at $15.5 trillion by 2030 (PricewaterhouseCoopers, 2017). Alongside this volume growth, industries worldwide are currently in the midst of the fourth wave of technological advancement, or Industry 4.0 (Rüßmann et al., 2015). This wave of advancement includes the development and integration of innovative Information and Communication Technology (ICT) into the industry (Barreto et al., 2017).
As a result of the expansion of the construction industry as a whole, the increasing level of complexity and sophistication of construction projects, and advancing ICT, companies active along the construction supply chain—including owners, owner’s representatives, designers, contractors, and specialty contractors—have turned to innovative techniques to gain a competitive advantage (Berisha-Shaqiri et al., 2012; Renz et al., 2016).
ICT has led to a radical evolution in information documentation and exchange. Construction design began with the drafting board, moved through the age of Computer-Aided-Design (CAD), and now has embraced Building Information Modeling (BIM). With each step forward, the construction industry has become more efficient, increased performance, and created more information-rich models (Miettinen and Paavola 2014). While BIM has certainly assisted in the growth and innovation of construction, the paradox of designing a 3D structure in 2D space remains. (Rossini et al., 2016) noted that the lack of dynamicity in information flow from the field to BIM software is a significant limitation of the software. As part of the continuing evolution of the construction industry as a whole, the nine pillars of Industry 4.0 have attracted increasing attention from researchers and practitioners (Amor et al., 2002). Augmented Reality (AR) is one of these nine pillars, and in and of itself is an industry anticipated to grow from $11.14 billion in 2018 to $60.55 billion in 2023 (Rüßmann et al., 2015; MarketsandMarketsTM INC 2018). AR is applied across sectors including gaming, medicine, entertainment, military, aerospace, manufacturing, automotive, and engineering (Behzadan and Kamat 2011). AR has the potential to transform the construction industry and provide companies with a new Frontier for gaining competitive advantage (Kivrak and Arslan 2019). Noghabaei et al. (2020) concluded through their study that older generations in construction have great confidence in the future of AR and recognize the benefits of this technology. In recognition of this potential, industry researchers have conducted several reviews of AR and AR-related efforts in the Architectural, Engineering and Construction (AEC) industry and its potential future avenues of expansion (Chi et al., 2013; Dong and Kamat 2013; Rankohi and Waugh 2013; Agarwal 2016; Ahmed 2018; Bademosi and Issa 2019; Chandarana et al., 2019; Tabrizi and Sanguinetti 2019; Chen and Xue 2020; Schranz et al., 2021; Sidani et al., 2021; Song et al., 2021). Other research endeavors have identified obstacles for implementing AR as well as potential benefits that could have a transformative impact on construction (Dias et al., 2003; Heinzel et al., 2017; Bademosi and Issa 2019).
Although these efforts represent a crucial step in mapping out the potential of AR, they do not fully capture the potential of AR as a transformative technology from the perspective of the construction industry specifically. Research conducted on AR in the construction industry has focused on investigating the potential of the technology through either a literature review (Rankohi and Waugh 2013; Bademosi and Issa 2019; Chen and Xue 2020; Nassereddine et al., 2020) or the development of specific AR applications (Nassereddine et al., 2019b; Rajaratnam et al., 2021; Schranz et al., 2021). On the other hand, and from a holistic viewpoint, Danker and Jones (2014) studied AR from the perspective of the United Kingdom construction industry. The authors investigated current and potential applications of combining BIM and AR. Danker and Jones surveyed 43 experts in United Kingdom construction and identified nine key areas of application for AR integration with BIM. However, their research did not provide a comprehensive investigation of AR throughout the lifecycle of a construction project. More recently, Oke and Arowoiya (2021) identified nine application areas of AR in the construction industry and collected the input of 166 construction professionals in Nigeria via a survey regarding the potential of each application area. The results of this study have shown that visualization and simulation of construction works, project documentation, project planning, project monitoring, and project modification are the five most applied areas of Augmented Reality. This paper expands the scope of inquiry and explores potential AR use-cases throughout the project lifecycle, AR benefits, and AR obstacles using industry data. The potential future of AR in construction is also discussed.
The term “Augmented Reality” dates from the 1990s, where it was defined as the technology that augments the visual field of the user with information that is necessary to perform a task (Caudell and Mizell 1992; Ramos et al., 2018). Unlike Virtual Reality (VR), which creates a virtual environment that replaces the real one, AR amplifies the real world with virtual information (Wang 2009). In the context of the construction industry, many of the researchers who have written on the subject have provided their own definitions, as follows:
Wang and Dunston (2007) defined AR as a technology or an environment where the additional information generated by a computer is inserted into the user’s view of a real-world scene. They also noted that AR involves the use of special display and tracking technology that is capable of seamlessly merging digital or virtual contents into real environments. Helmholt et al. (2009) defined AR as the act of adding an extra layer of information to the real physical works to provide the right information in situ at the right time. Cleveland. (2010) considered AR the child of virtual reality and provided a simpler definition of AR as augmenting the real world with information from the virtual world. Wang et al. (2013) deemed AR to be an “information aggregator” that can collect and consolidate information from individual tools such as BIM, and context-aware sensors. Thus, AR could enable users to define and work with the inter-relationships between products, processes, resources, and time to determine and analyze relevant information. Gartner defines AR as part of the reality-virtuality continuum, in which the user experiences information in real-time, in the form of text, graphics, audio, and other virtual enhancements integrated with real-world objects (Gartner 2017).
This study describes AR both as an information aggregator and a data publishing platform that allows the user to 1) passively view displayed information, 2) actively engage and interact with published content, and 3) collaborate with others in real-time from remote locations (Nassereddine et al., 2019a).
Researchers have investigated a diverse range of AR use-cases for the construction industry. Several research studies have demonstrated the potential of AR in different context of the construction industry. To name a few, Shin and Dunston (2008) developed a map that comprehensively identified AR application areas in industrial construction based on the suitability of AR technologies. They assessed 17 classified work tasks in AEC, and their conclusions reflected that only 8 of these tasks were poised to benefit from AR. Helmholt et al. (2009) identified three major categories of AR applications, namely “in-situ experience”, “in-situ verification”, and “in-situ warning”. Wang et al. (2013) investigated the potential of BIM and AR and proposed a conceptual framework that integrates BIM and AR for construction use. They identified seven areas where BIM and AR can be integrated and used on-site. Park et al. (2013) presented a conceptual system framework, the AR-based Defect Inspection System, for construction defect management that integrates ontology and AR with BIM.
At the same time, numerous researchers have also developed AR applications with an eye to improving construction processes and methods. For example, Webster et al. (1996) developed two AR systems that employ a see-through head-worn display to provide users with visual information that is tied to the physical world. The purpose of these two systems is to improve methods for construction, inspection, and renovation of architectural structures. Similarly, Thomas and Tyerman (1997) expanded the application of AR to outdoor environments and focused on investigating the use of a Wearable Computer with Augmented Realities in an Outdoor Environment (WCAROE) to facilitate collaboration. Later, Thomas et al. (1998) developed a wearable computer system with a see-through display to be used as a visual navigation aid and was called the “map-in-the-hat” application. In the 2000s, Dunston et al. (2000) designed an experimental AR CAD tool to support design activities for mechanical contractors. Golparvar-Fard et al. (2009) proposed the D4AR model, an alternative image-based approach for progress monitoring using unsorted daily progress photograph logs taken from a construction site. Chalhoub and Ayer (2017) examined the feasibility of using Mixed Reality (MR) as a visualization tool for electrical prefabrication. Park and Kim (2013) developed a safety management and visualization system (SMVS) that integrates AR, location tracking, building information modeling (BIM), and gaming technologies to improve construction safety management practices. Rathnasinghe et al. (2020) explored the potential of AR to improve information management and successfully complete a construction project. Schranz et al. (2021) investigated an application of AR into the BIM submission process where the process plan check and approval can be accelerated when combining BIM with the visualization capability of AR. Song et al. (2021) analyzed the potential of AR in architectural design fabrication. These research efforts discussed here are but the tip of the AR iceberg. Table 1 presents a list of major research efforts by use-case. Other researchers have taken a user-centric approach and focused on assessing the user acceptance of AR for specific applications. Papakostas et al., 2022, for instance, investigated the factors that impact the user’s acceptance of the AR welding training and developed a Technology Acceptance Model that consists of six categories to help AR developers understand how AR applications can be enhanced to improve the users’ experience and their behavioral intention to use AR. Other researchers investigating the acceptance of integrating AR and BIM in the construction industry using Technology Acceptance Models (Elshafey et al., 2020).
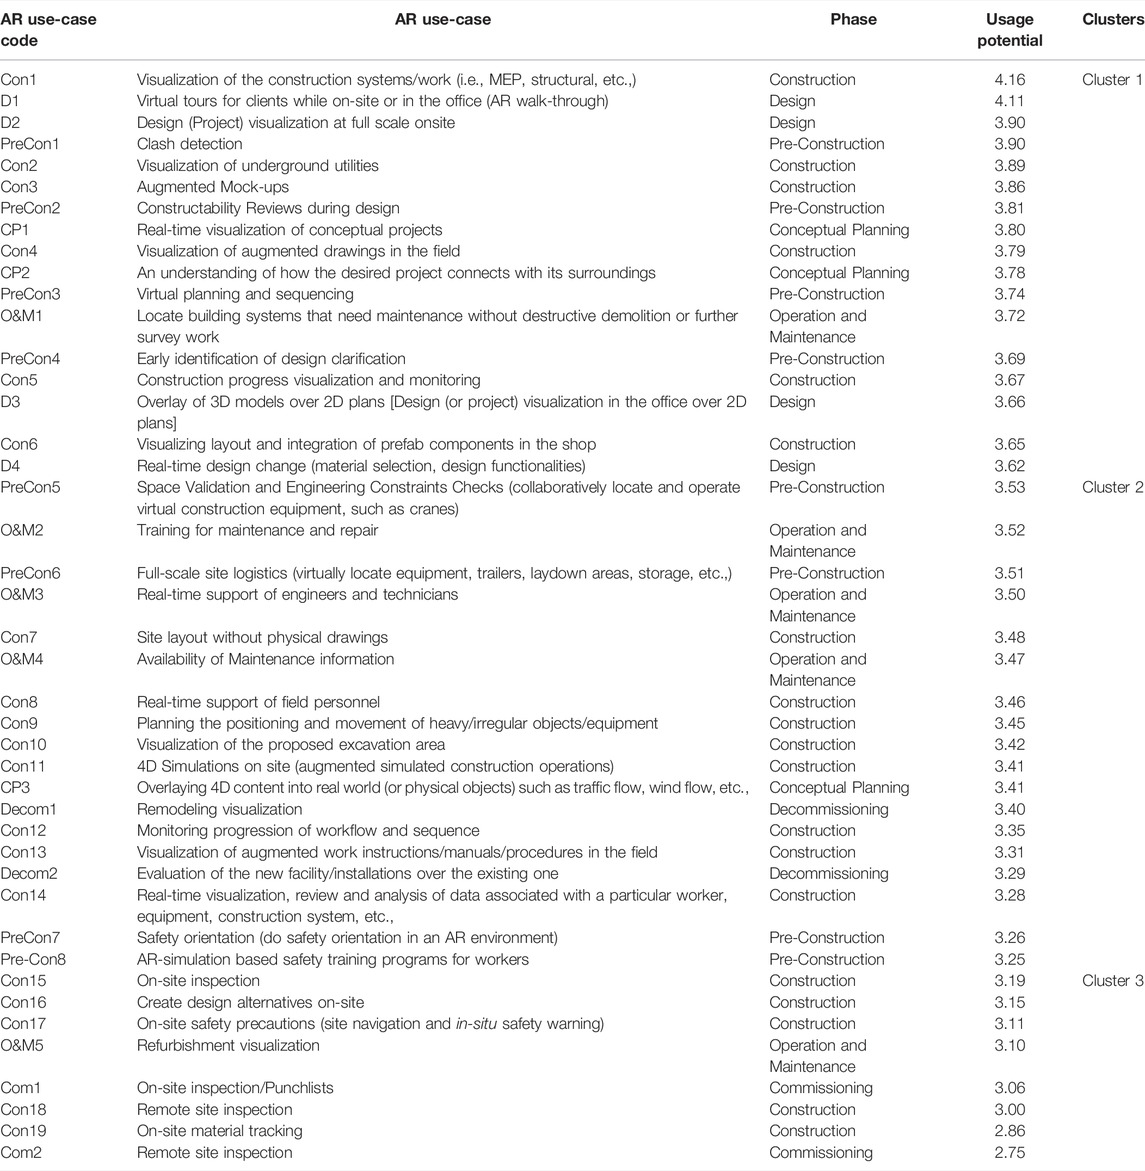
TABLE 1. Clustered table of AR use-cases.
The immense range of AR use-cases identified by researchers highlights the potential this technology has to be transformative, while also ushering in a new era in the industry (Kivrak and Arslan 2019). For example, Dong and Kamat (2013) suggested that AR can benefit the Architecture, Engineering, and Construction (AEC) industry in at least three aspects: visualization, information retrieval, and interaction. The integration of the real world can significantly mitigate the efforts to create and render contextual models for virtual scenes and can provide a better perception of the surroundings than virtual reality alone (Visualization). AR also supplements a user’s normal vision with context-related or georeferenced virtual objects (Information Retrieval). Furthermore, authentic virtual models can be deployed to evaluate the physical condition of real objects (Interaction). Li et al. (2018) focused on the implementation of AR to enhance construction safety. Noghabaei et al. (2020) noted that the use of AR technologies can result in cost and time savings in design, construction, and operations.
However, researchers have also stated that there are obstacles that need to be overcome before reaping the benefits of AR. Numerous researchers have highlighted the technical and technological challenges encountered when building and integrating AR systems into the existing practices of the construction industry. Heinzel et al. (2017) interviewed two general contractors and a software developer about their use of AR. The data analyzed from the interviews showed that the cost of implementation, immaturity of the technology, the lack of standard in-field AR applications, and uncertainty about the technology’s value and benefits are among the challenges that the three companies reported as obstacles for implementing AR in construction. Viljakainen (2020) identified various barriers to implementing AR in the construction industry, including technical issues, lack of needed skills, lack of standards and handbooks, and high maintenance costs.
The methodology consisted of three main phases: literature review, survey, and analysis.
To identify the applications, benefits, and obstacles of AR across the lifecycle phases of the construction project, a literature review was completed in two phases. The first phase involved a comprehensive search of the literature using the Google Scholar search engine. Various keywords were used such as Augmented Reality, AR, Mixed Reality, MR, use-cases, applications, benefits, obstacles, literature review, construction phases, construction project lifecycle, design, construction, and operations and maintenance to name a few. This search resulted in 308 articles, collected from journals and conferences between 1996 and mid-2020. The second phase involved screening out articles that were not relevant to this research after reviewing the scope of the articles. As a result, 98 articles were selected to be included in the research and were thoroughly reviewed to extract the needed information.
From the literature review, 43 AR use-cases were identified (variable 1), along with 16 potential benefits (variable 2) and 22 obstacles (variable 3). To better understand the potential of AR over the project lifecycle, the 43 collected use-cases were grouped into the seven phases of a project lifecycle: Conceptual Planning, Design, Pre-Construction Planning, Construction, Commissioning, Operation and Maintenance, and Decommissioning. The 22 AR obstacles were also grouped into five categories: Financial, Human, Organizational, Technological, and Others.
In order to capture the potential of AR in the construction industry, a survey was developed, tested, and distributed to the industry. The survey was designed to gather qualitative data regarding the respondent’s perception of the technology. In one section of the survey, respondents were asked to provide some general information (location, age, and company type) and to identify their level of familiarity and usage of AR in the context of the construction industry. In another section of the survey, respondents were provided the 43 AR use-cases and asked to assess their potential for use in construction Respondents who indicated that an AR use-case has the potential to be used in construction were asked to evaluate their perceived level of usage on a five-point Likert scale, from very low 1), to low 2), moderate 3), high 4) and very high 5). The 43 AR use-cases were provided in seven tables (corresponding to the seven phases of the construction project lifecycle) and a sample survey question read as follows: Please rate the following AR applications in terms of the probability that the construction industry will use them in the Planning Phase. The survey also contained the 16 AR potential benefits and 17 obstacles and respondents were asked to indicate their perceived level of impact using the same five-point Likert scale. The benefit-related questions asked respondents the following: Please rate the level of impact you believe AR will have in the following areas, and the 16 AR benefits were provided in one table. The AR obstacles were provided in five tables (corresponding to the five categories) and as an example, respondents were asked the following: Please rate the financial barriers or obstacles for implementing Augmented Reality.
Another section of the survey included eight statements (variable 4) describing the future of AR in the construction industry to which respondents reported their level of agreement with each statement using a five-point scale from strongly disagree 1), to disagree 2), undecided 3), agree 4), and strongly agree 5). The four statements were listed in a table and the following question was asked to respondents: How much do you agree with the following statements? It is important to mention that the order of the answer options (AR use-cases, AR potential benefits, AR obstacles, and AR statements) was randomized to avoid survey bias.
The survey was distributed to a total of 300 respondents who were asked to share the survey with others within their network. The list of recipients was acquired from various sources including previous research projects performed by the first and third authors, direct connections with construction stakeholders, and a search on LinkedIn. Contacts for Architects/Engineers (A/E), General Contractors/Construction Managers (GC/CM), and Mechanical/Electrical/Plumbing (MEP) Trades were targeted. The authors selected to send the survey to specific individuals within the organization such as designers, project managers, project engineers, and IT managers rather than sending it to Human Resources. The identified 300 points of contact represented a balanced distribution of the three types of stakeholders and of the different sizes of companies in the construction industry.
A total of 96 responses were collected throughout the survey. The bulk of the respondents (∼96%) were located in the United States, but some respondents were located in Canada, United Kingdom, and Netherlands. The points of contact to whom the survey was initially sent to were all based in the United States. Survey recipients were asked to share the survey with others within their network, and as a result, a few responses were collected from outside the United States. To keep the scope of the research within the United States, the responses from Canada, United Kingdom, and the Netherlands were not included in the analysis, resulting in a total of 93 responses. Within the United States, the majority of responses were collected from Wisconsin, California, Illinois, and Minnesota. Respondents were equally distributed among the following four age groups: (25–34), (35–44), (45–54), and (55–64). Respondents were also asked to identify the type of their company. The results showed that 48% of respondents work for GC/CM, 36% for MEP Trades, and 16% for A/E.
The main objective of this study is to identify the top AR use-cases have the highest potential to be used in construction, explore the top perceived benefits of AR, investigate the obstacles that have the highest impact on the implementation of AR, and provide insights into the future potential of AR in construction. Researchers indicated that the perception of users of a technology is influenced by the users’ familiarity and degree of usage of the technology (Madadi et al., 2011; BrckaLorenz et al., 2013). Therefore, before investigating the research objective, the relationship between:
1 The respondents’ perception of each of the four variables and respondents’ familiarity with AR and,
2 The respondents’ perception of each of the four variables and respondents’ usage of AR
was evaluated using Kruskal–Wallis H test and Kendall’s Tau-b.
The example below illustrates how this analysis was performed. Figure 1 shows the relationship between the respondents’ perceived usage of Virtual Planning and Sequencing, one of the 43 use-cases of variable 1, and respondents’ usage of AR in the construction industry. Using the Kruskal–Wallis H test, the relationship between respondents’ perceived usage of Virtual Planning and Sequencing and respondents’ usage of AR in the construction industry resulted in a significant p-value (
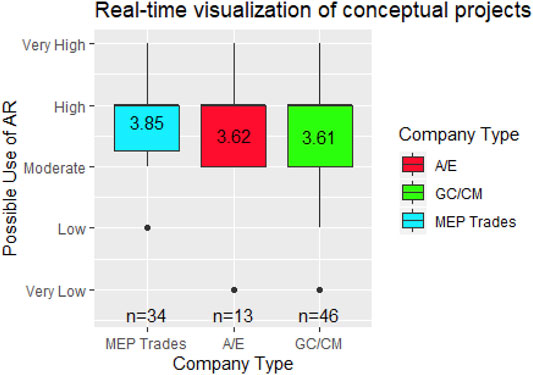
FIGURE 1. Boxplot of the relationship between the Respondents’ Perceived Usage of Virtual Planning and Sequencing and Respondents’ Usage of AR in the Construction Industry. Notes: 0—respondents have not experienced AR before and are not interested in the technology; 1—respondents have not experienced AR before but are interested in the technology; 2—responders explored/are exploring AR applications; 3—respondents tested/are testing AR applications; 4—respondents have used AR on at least one construction project. n—represents the sample size within each group.
Kendall’s tau-b correlation coefficient was used to statistically test the relationship between moving from “no experience using AR” (0) and “used AR on a construction project” (4), and respondents’ perceived usage of Virtual Planning and Sequencing. Kendall’s tau-b correlation coefficient resulted in a low p-value (
The same analysis was performed for all four variables and the results indicated that the respondents’ perception of each of the four variables depends on their level of familiarity and usage of AR in the context of the construction industry. Therefore, a mathematical model was developed and validated for each variable to adjust the original respondents’ perception by accounting for respondents’ familiarity and usage of the technology. The model is described in detail for the AR use-cases.
Once the original respondents’ answers for each of the four variables were adjusted using the corresponding mathematical model, k-means cluster analysis was performed on the first three variables to identify the AR use-cases that have the highest usage potential, the AR benefits that have the highest potential, and the obstacles that have the highest impact. Ranking the use-cases, benefits, and obstacles according to their scores does not necessarily mean that the first score is statistically higher or lower than the second. Thus, cluster analysis was employed to organize the data into categories or levels. Cluster analysis is a statistical method used to group data by comparing each candidate AR use-case for example to the other AR use-cases already in the cluster. If the difference between the candidate AR use-case and the other AR use-cases already in the cluster is significant, then the candidate AR use-case is assigned to a different cluster.
Respondents were asked about their level of familiarity with AR in their professional lives. Ten percent of the respondents indicated that they are not at all familiar with AR, 25% said that they are slightly familiar with AR, 18% reported that they are somehow familiar, 25% are moderately familiar with the technology, and 22% mentioned that they are extremely familiar with AR.
Respondents were asked to specify their level of usage of AR in their professional lives, i.e., in the context of the construction industry as opposed to personal use. Only 3% of the respondents indicated that they have not used AR and they are not interested in the technology, 46% have not experienced AR before, but are interested in the technology, 19% explored or are exploring AR applications, 15% have tested or are testing AR applications for future use, and 17% have used AR on at least one project.
The research included 43 AR use-cases, 17 AR benefits, 22 AR obstacles, and 8 AR statements. Each use-case, benefit, obstacle, and statement were compared among the different types of companies surveyed. For instance, Figure 2 illustrates the breakdown of the average possible use of the AR use-case entitled Real-Time Visualization of Conceptual Projects by types of companies. Kruskal–Wallis test was then performed to test if the perceived use of this particular AR use-case is statistically different among the various types of companies. The high p-value resulting from this test (0.779) indicates that, at the 95% confidence level, the different types of companies have a similar perception of the usage of AR for Real-Time Visualization of Conceptual Projects. The Kruskal–Wallis was performed for each of the 43 AR use-cases and all of the resulting p-values were non-significant at the 95% level. It is important to note here that since multiple Kruskal–Wallis tests were conducted for the same variable (i.e., 43 tests for the AR use-cases variables), the Bonferroni correction was used to counteract the problem of type II error. The use of the Bonferroni correction lowers the threshold for significance at the 95% level from 0.05 to 0.0012 (obtained by dividing 0.05 by the number of tests, here 43). Knowing that all the p-values resulting from the 43 Kruskal–Wallis tests were not significant when compared to the 0.05 threshold, it follows then that the p-values will not be significant when the threshold is adjusted using the Bonferroni correction.
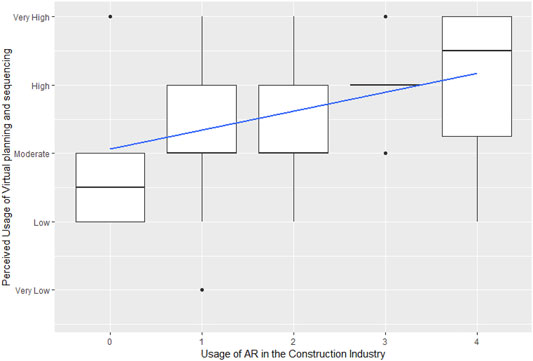
FIGURE 2. Breakdown of the average possible use of Real-Time Visualization of Conceptual Projects among the various types of construction companies. Notes: n—represents the sample size within each group the numbers displayed on each boxplot represent means.
A similar analysis was conducted for each of the three remaining variables: benefits, obstacles, and statements and the statistical tests resulted in non-significant p-values. Therefore, giving that the results are not different among the different types of companies, the findings of this paper reflect the perception of the construction industry as a whole rather than the perception of individual types of companies.
The 43 AR use-cases collected from literature and grouped into the seven phases of the lifecycle of a construction project (planning, design, pre-construction planning, construction, commissioning, operation and maintenance, and decommissioning) were included in the survey. Respondents were asked to specify their perceived level of usage of each AR use-case in the construction industry. Between 2 and 8% of respondents felt that these use-cases are not applicable, while the rest believed that the AR use-cases are relevant to the construction industry. Respondents who indicated that an AR use-cases has a potential rated their perceived level of usage of the AR use-case on a scale from very low 1) to very high 5). However, this variable is subjective by nature and differs among respondents.
Performing Kruskal–Wallis and Kendall’s Tau-b between 1) each AR use-case and respondent’s level of familiarity with AR on a professional level and 2) each AR user-case and respondent’s level of usage of AR on a professional level resulted in significant p-values, indicating that a respondent’s rating of the perceived level of usage of an AR use-case depends on the respondent’s level of familiarity and usage of the technology. Therefore, to reduce the influence of this subjectivity, the perceived possible use of an AR use-case
The following section introduces the mathematical model developed to adjust the original respondent’s perceived level of usage of an AR use-case.
The model computes for each AR use-case
The Usage Potential of AR of use-case
where:
These two variables were found to be positively correlated (0.82) indicating that the level of familiarity with AR of a respondent aligns with their level of usage of the technology. It is important to account for the input of each respondent
The variables
As shown in Figure 3 the geometric mean (right) gives smaller weight to respondents with lower expertise in comparison to the arithmetic mean (left).
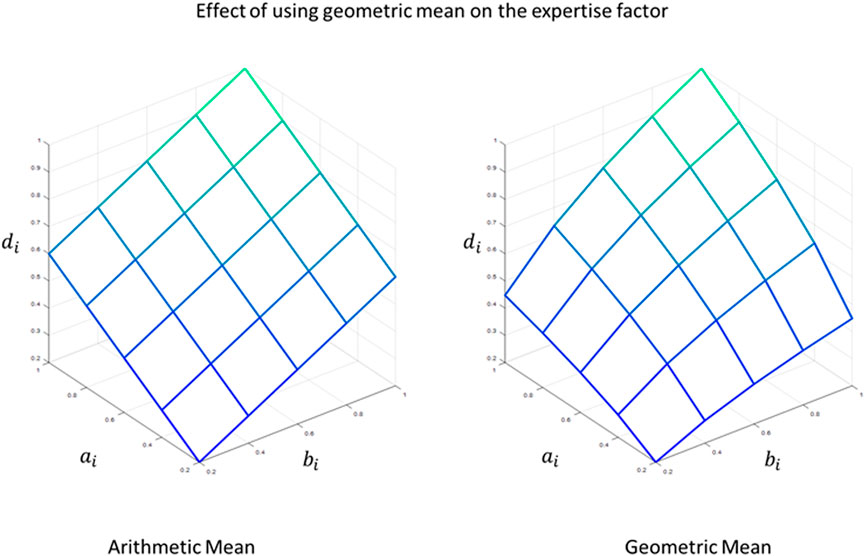
FIGURE 3. Effect of Using geometric mean on the expertise factor,
For each respondent
Thus,
and,
Consequently,
A flowchart illustrating the mathematical model is outlined in Figure 4.
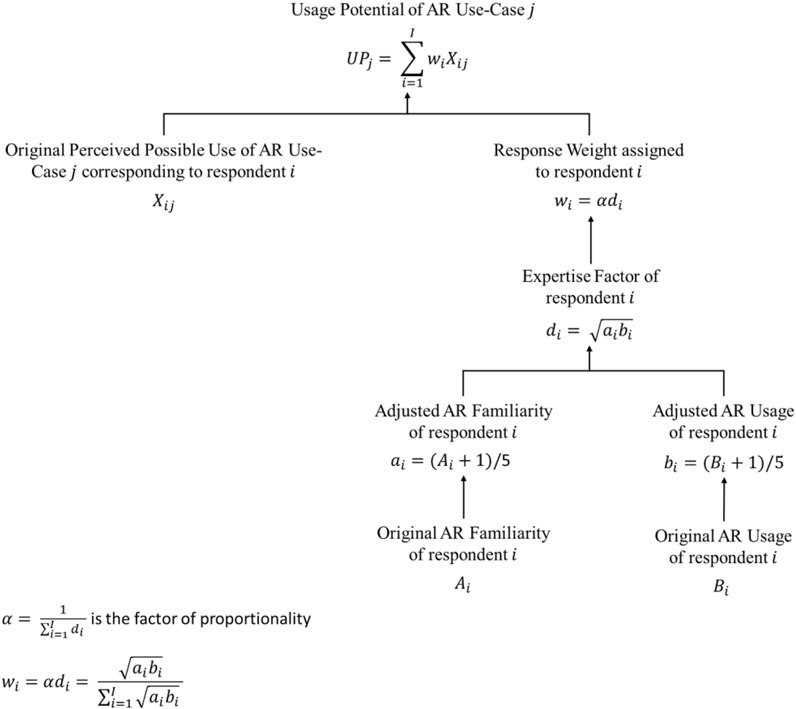
FIGURE 4. Flowchart of the mathematical model.
The objective of the mathematical model is to reduce the subjectivity of the data by adjusting the answers of the respondents based on their level of familiarity and usage of AR in construction. An important question arises as to how to prove that the methodology employed to develop the model is effective. Simulations provide a powerful technique for answering this question (Hallgren 2013). A simulation study was designed to evaluate the mathematical model developed and to compare it to competing approaches, i.e., using the arithmetic mean instead of geometric. The objective of the simulation is to prove that the values computed from the model are more representative than the observed, raw data collected from the survey. In other words, the goal is to demonstrate that the proposed model generates a dataset that has a smaller deviation from an assumed true dataset than the deviation in the directly observed dataset. This section provides an overview of the procedure involved in designing and running the simulation.
Four datasets are generated in this simulation: the assumed true dataset, the observed dataset, the arithmetic-based modeled dataset, and the geometric-based modeled dataset. The true dataset represents the expected reference responses and will be used as a datum to evaluate the results of the models. The observed dataset is obtained by simulating human responses through the introduction of random noise to the true dataset for each response. Furthermore, the two modeled datasets are generated by applying the corresponding mathematical weighting model to each response in the observed dataset. In addition to the four datasets, two variables are also generated in this study: familiarity of AR and usage of AR. These two variables are then used to compute the expertise factor on which the weights are based. This simulation was run 1,000 times in a Monte Carlo fashion.
The first step in designing the simulation is generating the true dataset which represents the assumed true Usage Potential of each AR use-case. This dataset consists of 43 columns in which each column represents an AR use-case. The rows of the true dataset are the 1,000 simulation runs whose values were generated using the Latin-Hypercube Sampling (LHS) experimental design technique using Python, set to be between 1 and 5. The values represent the five-point Likert scale used in the survey.
The next step is to compute the observed dataset. This dataset is developed to represent the data of the respondents collected from the survey. For each true dataset of the 1,000 simulation runs, an observed dataset was created with a sample size of 1,000 representing the number of respondents. In every run, the value of each respondent for a particular use-case was obtained by adding random noise to the true value of the corresponding column of the use-case. The randomness in the answers of the respondent is assumed to be due to the levels of familiarity of the respondent with and usage of AR. Therefore, for a particular respondent, the correspondent respondent noise is obtained by adding the noise associated with the familiarity of the respondent and usage of AR. The familiarity and usage noises follow a normal distribution between 0 and 0.5 each. Consequently, the respondent noises are normally distributed and take values between 0 and 1. The observed dataset of each run was then generated by multiplying the true values and respondent noises.
The observed datasets were then used to generate two other datasets: the first is based on the arithmetic mean (the arithmetic-based modeled dataset) and the second is based on the geometric mean (geometric-based modeled dataset). The main difference between the two models is the equation used to compute the expertise factor,
After generating the two modeled datasets, the Usage Potential of each AR use-case was obtained by summing the 1,000 respondents of each run. As for the observed dataset, the values were averaged over all respondents for each AR use-cases, resulting in two-dimensional datasets with 1,000 rows corresponding to the number of runs and 43 columns corresponding to the 43 AR use-cases, with the value in each cell corresponding to the averaged observed perceived level of usage. The format of the averaged dataset is similar to the true dataset which is also based on 1,000 simulation runs of 43 AR use-cases.
In order to evaluate the effectiveness of each model, the squared deviations between 1) observed and true values, 2) arithmetic-based modeled and true values, and 3) geometric-based modeled and true values were calculated. Then for each run, the sum of squared deviations was obtained for each of the three cases. Finally, a single deviation figure was computed for each case by averaging the squared deviations over all simulation runs.
Since a large number of cases were simulated to reduce the dependency on the randomness, the deviations were normalized. Thus, the averaged squared deviation between:
• Observed and true equals 1
• Arithmetic-based modeled and true equals 0.77
• Geometric-based modeled and true equals 0.64
Paired t-test performed in order to test 1) if the deviation between the geometric-based model and true is statistically significantly less than the other two deviations. The test resulted in a significant p-value at the 95% confidence level, indicating that the deviation between geometric-based model and true is statistically smaller than the deviations between observed and true and between arithmetic-based modeled and true, indicating the geometric model is closer to the truth. It is important to mention that models with different coefficients for familiarity and usage were also simulated. The best results were achieved when the two variables had an equal coefficient. A broad overview of the simulation is illustrated in Figure 5.
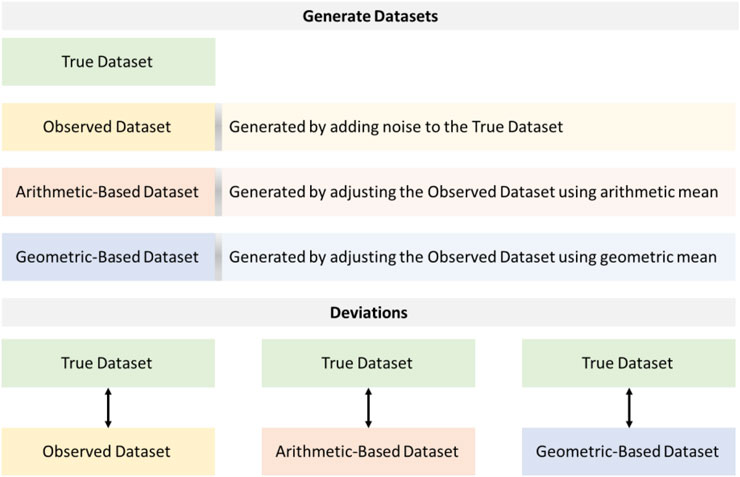
FIGURE 5. Overview of the validation process of the mathematical model.
A Usage Potential,
The k-means allows the identification of the number of clusters that give the most parsimonious balance between minimizing the number of clusters and minimum the sum of square errors within each cluster. The number of clusters is then obtained by finding the “elbow” in the scree plot (Hothorn and Everitt 2014). Figure 6 suggests that the number of clusters is 3 after which the decrease in the sum of squares is constant. The number of clusters obtained visually using the scree plot is also verified using the Silhouette Method which complements the elbow method (Mangortey et al., 2020). The Silhouette Plot in Figure 7 shows that the number of clusters is 3.
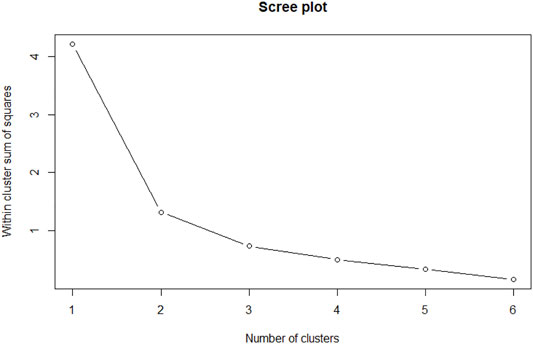
FIGURE 6. Scree plot for the k-means cluster analysis of the 43 AR use-cases.
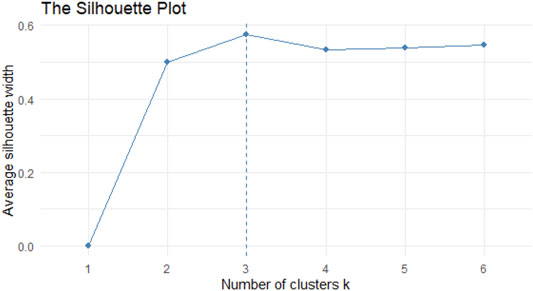
FIGURE 7. Silhouette plot for the k-means cluster analysis of the 43 AR use-cases.
Therefore, the 43 AR user-cases were grouped into three clusters based on their Usage Potential: Cluster 1 includes 17 AR use-cases, Cluster 2 encompasses 18 AR use-cases, and Cluster 3 contains the remaining 8 AR use-cases. Thus, the AR use-cases with the most potential are those in Cluster 1.
The four AR use-cases identified during the design phase of the project were all included in Cluster 1 indicating the high potential for AR to be used during the design phase. Nassereddine et al. (2019b) reported that Architects/Engineers have been using AR to leverage the visualization of 3D models and allow owners to better interact with and explore the design of their facility. Other construction stakeholders are using AR headsets to project the 3D model of a project into a room and enable owners to walk around and discuss various design options (Nassereddine et al., 2019b). Users of AR in the design phase indicated that the technology improves project visualization, project understanding, and collaboration and allows various stakeholders to be engaged in the design process.
The 16 AR benefits collected form literature were also included in the survey. Respondents were asked to specify their perceived level of impact of each AR benefit on the construction industry. Between 2 and 4% of respondents felt that these AR benefits do not exist, while the rest believed that the AR would have an impact on the construction industry in terms of the benefits reported in the survey.
Respondents who reported the existence of potential benefits to the implementation of AR also rated their perceived level of impact of the identified AR benefits on a scale from 1 (very low) to 5 (very high). Similar to the analysis of the respondents’ perceived level of usage of an AR use-case, the perceived potential impact of an AR benefit
The Benefit Potential of an AR benefit
where:
A Benefit Potential,
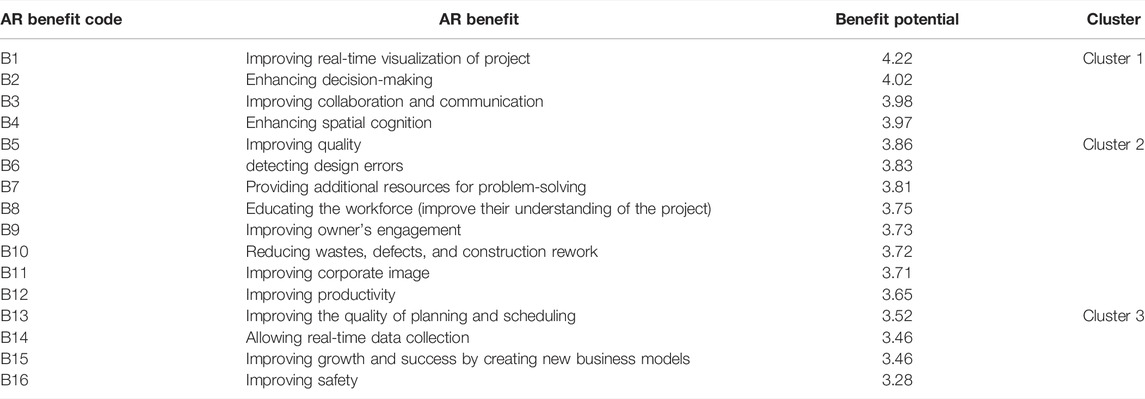
TABLE 2. Clustered table of AR benefits.
The cluster analysis grouped the 16 AR potential benefits into three clusters based on their Benefit Potential: Cluster 1 includes 4 AR benefits, Cluster 2 encompasses 8 AR benefits, and Cluster 3 contains the remaining 4 AR benefits.
The 4 AR benefits of Cluster 1 have on average a high potential impact on construction and are as follows: Improving real-time visualization of a project (4.22), Enhancing decision-making (4.02), Improving collaboration and communication (3.98), and Enhancing spatial cognition (3.97). A study conducted by Nassereddine et al. (2019b) surveyed construction practitioners who have hands-on experience using AR. Respondents were asked to elaborate on their experience and use of the technology and they frequently reported that AR improves project visualization by allowing owners and contractors to virtually walk through the project, supports decision making on-site by bridging the gap between office and field, allows a better understanding of project space such as exploring complex mechanical spaces, and promotes collaboration and knowledge sharing.
The 22 obstacles for implementing AR in the construction industry identified form literature and grouped into five categories (Financial, Human, Organizational, Technological, and Others) were included in the survey. Respondents were asked to rate the level of impact of each obstacle. Between 1 and 6% of respondents reported that the obstacles don’t have an impact whereas the rest indicated that these obstacles have some level impact on the implementation of AR in the construction industry.
Respondents who indicated the existence of obstacles also rated their perceived level of impact of each AR obstacle on a scale from very low 1) to very high 5). Similar to the analysis performed on the AR use-cases and potential benefits, a similar mathematical model was developed to reduce subjectivity and adjust the perceived potential impact of an AR obstacle
The model computes for each AR obstacle
The Obstacle Potential of an AR obstacle
where:
An Obstacle Potential,
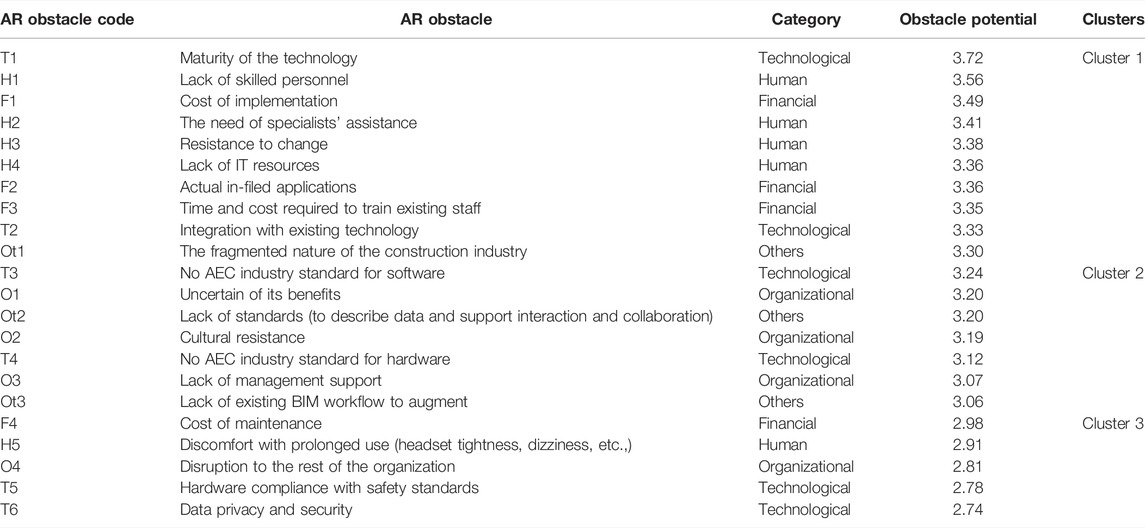
TABLE 3. Clustered table of AR obstacles.
The cluster analysis grouped the 22 obstacles into three clusters based on their Obstacle Potential: Cluster 1 includes 10 obstacles, Cluster 2 encompasses 7 obstacles, and Cluster 3 contains the remaining 5 obstacles. Although Maturity of the Technology ranked first in the first cluster of obstacles, according to Moore’s law, improvements and accessibility of AR technology will increase in the future (Danker and Jones 2014). This has also become evident with the reveal of the new Microsoft HoloLens (HoloLens 2), which is reported to have addressed the shortcomings of the first version. The technological dimension of the obstacles depends not only on the pace of technological development but also on the cooperation between construction companies and actors in other industries such as developers. A category of obstacles that should also be highlighted in the human category. As AR continues to mature and become adopted in the construction industry, construction companies need to equip their workforce with the skills needed to use the technology. Companies support the users of AR. Moreover, the uncertainty of the construction industry about the actual in-field applications of AR highlights the gap that this research is addressing. Integrating AR into an existing or a new process requires a clear understanding of how technology relates to the actual business value of the company.
Respondents were provided with 8 statements and were asked to rate their level of agreement/disagreement on a scale from 1 (strongly disagree) to 5 (Strongly agree). Respondents’ answers were also adjusted using the following Level of Agreement (LoA) model:
where:
The results are reported in Table 4. On average, respondents agree that AR has the potential to transform the construction industry, become commonly used through head-mounted displays, build upon existing practices, be used on large projects, and be more demanded by clients. Respondents also agree that the construction industry should adopt AR into its current practices and workflow. On the other hand, respondents were undecided regarding the statements that the industry is not yet clear on the suitable applications of AR and that AR is a disruptive technology. The authors hope that these AR use-cases discussed in this paper will provide construction practitioners with a clearer understanding of how AR can be applied in the construction industry.
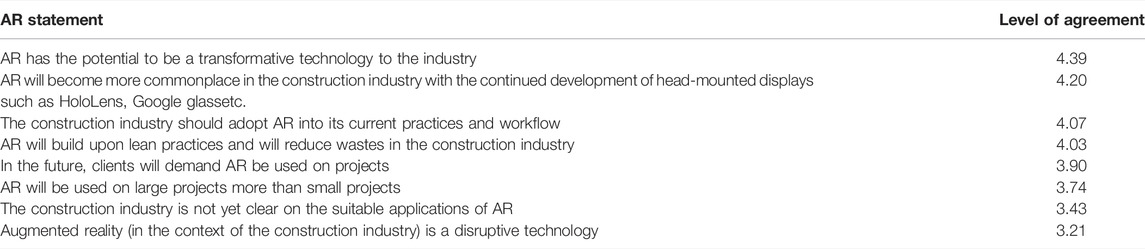
TABLE 4. Level of agreement on AR statements.
Having a comprehensive understanding of AR, its use-cases, benefits, and obstacles can help construction practitioners to have better knowledge of the potential of this technology. This study presents a comprehensive literature review about AR in the construction industry. First, 43 AR use-cases were extracted from extant literature and were grouped into the seven phases of the construction project lifecycle: Conceptual Planning, Design, Pre-Construction Planning, Construction, Commissioning, Operation and Maintenance, and Decommissioning. Next, implementing AR brings numerous benefits to construction practitioners. Potential benefits were collected from previous research work and a list of 16 benefits was formed. While AR is a promising technology in the construction industry, some obstacles need to be addressed before integrating AR. Twenty-two obstacles were identified from the literature and were categorized into five sets of obstacles: Financial, Human, Organizational, Technological, and Others. The framework presented in Figure 8 outlines the scope of work of this paper.
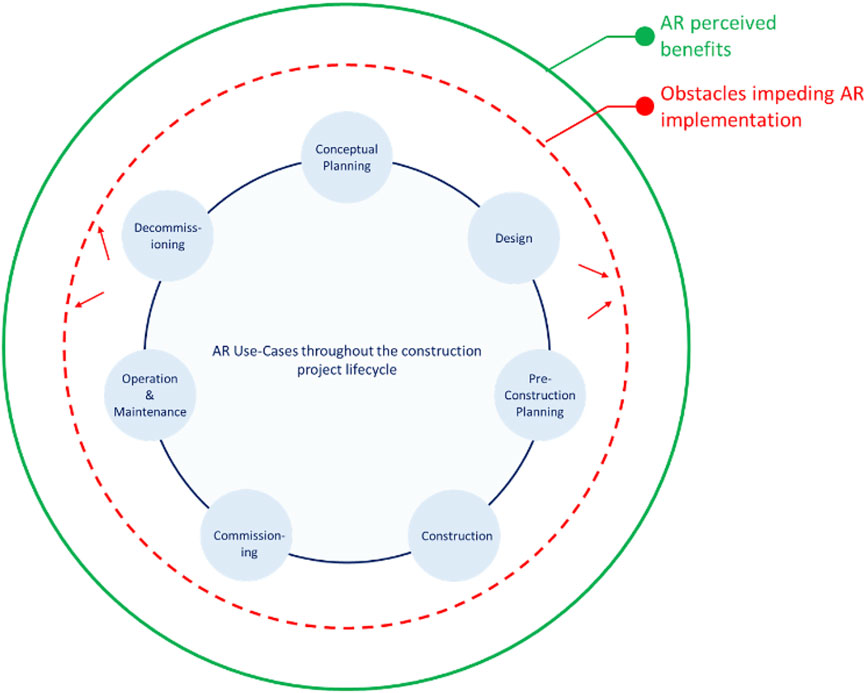
FIGURE 8. Research scope of work.
Based on data collected from A/E, GC/CM, and MEP and adjusted to account for the respondents’ familiarity with and usage of AR in construction, the most promising applications, most significant benefits, and most challenging aspects of the technology were highlighted. The results illustrate that AR is a valuable investment for industry professionals and suggest that the implementation of this technology throughout the construction lifecycle is a phased, gradual process. Some phases of the construction project are perceived to be prepared more than other phases to embrace AR. Design and Conceptual planning have the potential to embrace AR faster than commissioning for instance as all of the design use-cases and the majority of the conceptual planning use-cases are included in Cluster 1—the cluster including use-cases with the highest perceived usage—and all of the commissioning use-cases are includes in Cluster 3—the cluster including use-cases with lower probability to be implemented in the industry. Additionally, the three clusters of AR use-cases represent different AR capabilities, where the capabilities get more complex and advanced with the third cluster. The capabilities offered by the AR use-cases in cluster 1 are mostly visualization and informational capabilities which can be said to lead to the four benefits perceived to have the highest potential. The AR use-cases in cluster 2 build on the capabilities offered by the first cluster and provide analytical capabilities suggesting that additional benefits (cluster 2 of benefits) can be achieved when such applications become more promising. Lastly, the AR use-cases in cluster 3 build on the capabilities of the first two clusters and suggest new intellectual and automation capabilities leading to additional benefits that are not perceived to be reaped in the short-term (benefits in cluster 3). The results can also suggest that the more capabilities that are expected from AR, the more obstacles stakeholders will encounter. AR use-cases listed under the third cluster can be seen to be very challenging because of the lack of maturity and know-how of the technology for instance where more capabilities are yet to be supported by the technology in the construction. For example, remote site inspection (Cluster 3 of use-cases) can allow the collection of data in real time (Cluster 3 of benefits), however, several obstacles need to be overcome first such as the maturity of the technology, the fragmentation of the industry, the technical, human, and financial resources (cluster 1 of obstacles). It should be noted that as more research is conducted on AR to prove its practicability and potential, technology acceptance from the users’ perspective must be considered to ensure benefits are realized and challenges are properly addressed.
Additionally, this study investigated the future state of AR in the construction industry by asking respondents about their level of agreement with 8 statements. Results showed that respondents, on average, agree that the technology has the potential to transform the industry and will become more common place with the continue developed of head-mounted displays. The capabilities the technology offers provide new means for construction stakeholders to challenges their status-quo and either improve existing process or introduce new processes that were not possible before the technology. The COVID-19 pandemic presents an example of the construction industry can build resilience though AR by enabling remote site inspection for instance, an application that, absent of AR, is not possible. The relationships between stakeholders are also changing because of the technology showcasing better communication and collaboration, two aspects that are often challenging in the industry. Additionally, the support of the respondents of the transformative power of the technology and of the use of head-mounted displays indicates the willingness of the participants of the industry, as users, to accept the technology. Respondents also agreed that construction stakeholders should adopt AR into their current processes and workflows and that the technology can build upon Lean practices to reduce wastes in the industry. These results build on the Lean Construction 4.0 transformation that is beginning to gain momentum in the construction industry. Additionally, the results revealed that respondents expect construction owners to begin demanding the use of AR on their projects and that larger projects may use the technology more than small projects.
As the technology continues to evolve and researchers continue to prove the potential of AR and advance the knowledge of construction stakeholders in this area, many obstacles can be addressed, allowing more AR use-cases to become reality, leading to more benefits.
Augmented reality is an emerging technology within construction, and there is still little existing data about its uses, challenges, and successes. The main objective of this study is to solicit feedback from practitioners in the construction industry regarding the potential of AR and contribute to the level of understanding of the technology. A list of 43 AR use-cases throughout the lifecycle of a construction project, 16 potential benefits, and 22 obstacles for implementing AR in construction was identified from the literature review. In addition, eight statements that describe the future potential of AR in construction were formulated. A questionnaire was then developed to investigate the potential of AR from the perspective of the construction industry. Survey responses from 93 industry practitioners were included in this study. In order to reduce the subjectivity of the respondent’s perception, the survey data of each respondent was adjusted based on their level of familiarity with AR and usage of AR in the context of the construction industry. A mathematical model was developed and validated to account for the respondent’s familiarity with and usage of AR. These adjusted values were then analyzed, and cluster analysis was employed to identify the AR use-cases that have the highest Usage Potential, the AR benefits that have the highest Benefit Potential, and the AR challenges that have the highest Obstacle Potential. Moreover, the analysis of the AR statements highlighted the transformative impact AR can have on construction. Specifically, respondents agreed that AR has the potential to build upon existing Lean practices and that the Head-Mounted Display devices will become commonly used in the industry. The findings of this study contribute further knowledge to understanding the potential of AR in the construction industry by highlighting use-cases of the technology throughout the construction lifecycle, illustrating its potential benefits, and discussing the obstacles associated with its implementation.
While this study contributes to the roadmap for the implementation of AR in the construction industry by investigating its potential as perceived by construction practitioners, it does not provide a framework for the proper implementation of AR. Future directions could focus on developing an AR implementation and integration plan tailored for the construction industry. Further research could also gather a broader dataset that includes other types of companies, such as Facility Managers, Owners, and Owners Representatives, and perform a more detailed analysis for each company type. Additionally, Future work can develop a framework to assess the benefits of each AR use-case and identify metrics to measure the impact of AR throughout the lifecycle of a construction project. Moreover, research can be conducted to investigate the Technology-Organization-Environment (TOE) capabilities needed to embrace AR in the construction industry. Furthermore, and building on the culminating finding that AR has a great potential to transform the industry, more research is needed to provide construction organizations with a strategy to help them assess where the technology can be integrated, how the technology should be implemented, and how to promote the technology to ensure buy-in from the users.
The data analyzed in this study is subject to the following licenses/restrictions: The datasets includes data for a big survey and can be made available upon request. Requests to access these datasets should be directed to Hala Nassereddine, aGFsYS5uYXNzZXJlZGRpbmVAdWt5LmVkdQ==.
All listed authors have made a substantial, direct, and intellectual contribution to the content of this paper.
The authors declare that this study received funding from The Boldt Company. The funder was not involved in the study design, collection, analysis, interpretation of data, the writing of this article or the decision to submit it for publication.
The authors declare that the research was conducted in the absence of any commercial or financial relationships that could be construed as a potential conflict of interest.
All claims expressed in this article are solely those of the authors and do not necessarily represent those of their affiliated organizations, or those of the publisher, the editors and the reviewers. Any product that may be evaluated in this article, or claim that may be made by its manufacturer, is not guaranteed or endorsed by the publisher.
The authors would like to thank The Boldt Company for their continuous support throughout this research effort and for partially funding this project.
Agarwal, S. (2016). “Review on Application of Augmented Reality in Civil Engineering,” in International Conference on Inter Disciplinary Research in Engineering and Technology, 71.
Ahmed, S. (2018). A Review on Using Opportunities of Augmented Reality and Virtual Reality in Construction Project Management. Organ. Technol. Manag. construction: Int. J. 10 (1), 1839–1852.
Amor, R., Betts, M., Coetzee, G., and Sexton, M. (2002). Information Technology for Construction: Recent Work and Future Directions. J. Inf. Tech. Construction 7 (16), 245–258.
Bademosi, F., and Issa, R. R. A. (2019). Advances in Informatics and Computing in Civil and Construction Engineering. Springer, 307–313. doi:10.1007/978-3-030-00220-6_37Implementation of Augmented Reality throughout the Lifecycle of Construction Projects
Barreto, L., Amaral, A., and Pereira, T. (2017). Industry 4.0 Implications in Logistics: an Overview. Proced. Manufacturing 13, 1245–1252. doi:10.1016/j.promfg.2017.09.045
Behzadan, A. H., and Kamat, V. R. (2011). Integrated Information Modeling and Visual Simulation of Engineering Operations Using Dynamic Augmented Reality Scene Graphs. J. Inf. Tech. Construction (Itcon) 16 (17), 259–278.
Berisha-Shaqiri, A., Miftari, I., and Berisha-Namani, M. (2012). Information Technology and Digitalization of the Kosovo Economy Market and Competition. China-USA Business Rev. 11 (4).
BrckaLorenz, A., Haeger, H., Nailos, J., and Rabourn, K. (2013). “Student Perspectives on the Importance and Use of Technology in Learning,” in Annual Forum of the Association for Institutional Research. Retrieved on May.
Caudell, T. P., and Mizell, D. W. (1992). “Augmented Reality: An Application of Heads-Up Display Technology to Manual Manufacturing Processes,” in Proceedings of the twenty-fifth Hawaii international conference on system sciences (IEEE), 659–669. doi:10.1109/hicss.1992.183317
Chalhoub, J., and Ayer, S. K. (2017). Mixed Reality for Electrical Prefabrication Tasks. Comput. Civil Eng. 2017, 76–83. doi:10.1061/9780784480847.010
Chandarana, S., Shirke, O., and Desai, T. (2019). Review of Augmented Reality Applications: Opportunity Areas & Obstacles in Construction Industry.
Chen, K., and Xue, F. (2020). The Renaissance of Augmented Reality in Construction: History, Present Status and Future Directions. Smart and Sustainable Built Environment.
Chi, H.-L., Kang, S.-C., and Wang, X. (2013). Research Trends and Opportunities of Augmented Reality Applications in Architecture, Engineering, and Construction. Automation in construction 33, 116–122. doi:10.1016/j.autcon.2012.12.017
Cleveland, A. (2010). Emerging Tools to Enable Construction Engineering. J. Construction Eng. Manage. 137 (10), 836–842.
Danker, F., and Jones, O. (2014). Combining Augmented Reality and Building Information Modelling-An Industry Perspective on Applications and Future Directions.
Dave, B., and Koskela, L. (2009). Collaborative Knowledge Management-A Construction Case Study. Automation in construction 18 (7), 894–902. doi:10.1016/j.autcon.2009.03.015
Dias, J. M. S., Capo, A., Carreras, J., Galli, R., and Gamito, M. (2003). “A4D: Augmented Reality 4D System for Architecture and Building Construction,” in Conferencia Virginia tech.
Dong, S., and Kamat, V. R. (2013). SMART: Scalable and Modular Augmented Reality Template for Rapid Development of Engineering Visualization Applications. Vis. Eng. 1 (1), 1. doi:10.1186/2213-7459-1-1
Dunston, P. S., Billinghurst, M., Luo, Y., and Hampson, B. (2000). “Virtual Visualization for the Mechanical Trade,” in International Symposium on Automation and Robotics in Construction (ISARC), 1131–1136. doi:10.22260/isarc2000/0086
Elshafey, A., Saar, C. C., Aminudin, E. B., Gheisari, M., and Usmani, A. (2020). Technology Acceptance Model for Augmented Reality and Building Information Modeling Integration in the Construction Industry. ITcon 25, 161–172. doi:10.36680/j.itcon.2020.010
Gartner (2017). Augmented Reality - AR - Gartner’s Tech Definition. Available at: https://www.gartner.com/it-glossary/augmented-reality-ar/ (Accessed Dec 19, 2018).
Golparvar-Fard, M., Peña-Mora, F., and Savarese, S. (2009). D4AR–a 4-dimensional Augmented Reality Model for Automating Construction Progress Monitoring Data Collection, Processing and Communication. J. Inf. Technol. construction 14 (13), 129–153.
Hallgren, K. A. (2013). Conducting Simulation Studies in the R Programming Environment. Tqmp 9 (2), 43–60. doi:10.20982/tqmp.09.2.p043
Heinzel, A., Azhar, S., and Nadeem, A. (2017). “Uses of Augmented Reality Technology during Construction Phase,” in The Ninth International Conference on Construction in the 21st Century (CITC-9)Revolutionizing the Architecture, Dubai, United Arab Emirates, March 5th-7th, 2017 (Engineering and Construction Industry through Leadership, Collaboration and Technology).
Helmholt, K. A., Hoekstra, W., and Berlo, L. van. (2009). “C2B: Augmented Reality on the Construction Site,” in Proceedings of the 9th International Conference on Construction Applications of Virtual Reality, Sydney, Australia, 5–6.
Hothorn, T., and Everitt, B. S. (2014). A Handbook of Statistical Analyses Using R. Chapman and Hall/CRC.
Kivrak, S., and Arslan, G. (2019). “Using Augmented Reality to Facilitate Construction Site Activities,” in Advances in Informatics and Computing in Civil and Construction Engineering (Springer), 215–221. doi:10.1007/978-3-030-00220-6_26
Li, X., Yi, W., Chi, H.-L., Wang, X., and Chan, A. P. C. (2018). A Critical Review of Virtual and Augmented Reality (VR/AR) Applications in Construction Safety. Automation in Construction 86, 150–162. doi:10.1016/j.autcon.2017.11.003
Madadi, Y., Iravani, H., and Nooghabi, S. N. (2011). “Factors Effective on Familiarity and Usage of Information and Communication Technology (ICT) University College of Agriculture and Natural Resources, University of Tehran, Iran,” in University of Tehran, Iran. Procedia - Social and Behavioral Sciences, 3625–3632. doi:10.1016/j.sbspro.2011.04.34615
Mangortey, E., Puranik, T. G., Pinon-Fischer, O. J., and Mavris, D. N. (2020). “Classification, Analysis, and Prediction of the Daily Operations of Airports Using Machine Learning,” in AIAA Scitech 2020 Forum, 1196. doi:10.2514/6.2020-1196
MarketsandMarketsTM INC (2018). Augmented Reality (AR) and Virtual Reality (VR) Market worth 60.55 Billion USD and 34.08 Billion USD by 2023, Respectively. Augmented Reality And Virtual Reality Market. Available at: https://www.marketsandmarkets.com/PressReleases/augmented-reality-virtual-reality.asp (Accessed Feb 24, 2019).
Miettinen, R., and Paavola, S. (2014). Beyond the BIM utopia: Approaches to the Development and Implementation of Building Information Modeling. Automation in construction 43, 84–91. doi:10.1016/j.autcon.2014.03.009
Nassereddine, H., Hanna, A. S., and Veeramani, R. (2019b). “Exploring the Current and Future States of Augmented Reality in the Construction Industry,” in the 11th International Conference (CITC-11), London, UK.
Nassereddine, H., Schranz, C., Bou Hatoum, M., and Urban, H. (2020). “July). A Comprehensive Map for Integrating Augmented Reality during the Construction Phase,” in Creative Construction e-Conference 2020 (Budapest University of Technology and Economics), 56–64.
Nassereddine, H., Veeramani, R., and Hanna, A. (2019a). “Augmented Reality-Enabled Production Strategy Process,” in the 36th International Association for Automation and Robotics in Construction (ISARC), Banff, Alberta, Canada. doi:10.22260/isarc2019/0040
Noghabaei, M., Heydarian, A., Balali, V., and Han, K. (2020). Trend Analysis on Adoption of Virtual and Augmented Reality in the Architecture, Engineering, and Construction Industry. Data 5 (1), 26. doi:10.3390/data5010026
Oke, A. E., and Arowoiya, V. A. (2021). An Analysis of the Application Areas of Augmented Reality Technology in the Construction Industry. Smart and Sustainable Built Environment.
Papakostas, C., Troussas, C., Krouska, A., and Sgouropoulou, C. (2022). User Acceptance of Augmented Reality Welding Simulator in Engineering Training. Educ. Inf. Technol. 27 (1), 791–817. doi:10.1007/s10639-020-10418-7
Park, C.-S., and Kim, H.-J. (2013). A Framework for Construction Safety Management and Visualization System. Automation in Construction 33, 95–103. doi:10.1016/j.autcon.2012.09.012
Park, C.-S., Lee, D.-Y., Kwon, O.-S., and Wang, X. (2013). A Framework for Proactive Construction Defect Management Using BIM, Augmented Reality and Ontology-Based Data Collection Template. Automation in Construction 33, 61–71. doi:10.1016/j.autcon.2012.09.010
PricewaterhouseCoopers (2017). Global Construction 2030: A Global Forecast for the Construction Industry to 2030. PwC. Available at: https://www.pwc.com/vn/en/industries/engineering-and-construction/pwc-global-construction-2030.html (Accessed Feb 24, 2019).
Rajaratnam, D., Weerasinghe, D. M. L. P., Abeynayake, M., Perera, B. A. K. S., and Ochoa, J. J. (2021). Potential Use of Augmented Reality in Pre-contract Design Communication in Construction Projects. Intell. Buildings Int., 1–18. doi:10.1080/17508975.2021.1911776
Ramos, F., Trilles, S., Torres-Sospedra, J., and Perales, F. (2018). New Trends in Using Augmented Reality Apps for Smart City Contexts. ISPRS Int. J. Geo-Information 7 (12), 478.
Rankohi, S., and Waugh, L. (2013). Review and Analysis of Augmented Reality Literature for Construction Industry. Vis. Eng. 1 (1), 9. doi:10.1186/2213-7459-1-9
Rathnasinghe, A., Weerasinghe, L., Abeynayake, M., and Kulatunga, U. (2020). The Evolution of Information Flows in Construction Projects: A Contemporary Study on the Embracing of Augmented Reality.
Renz, A., Solas, M., Almeida, P., Buhler, M., Gerbert, P., Castagnino, S., et al. (2016). Shaping the Future of Construction. A Breakthrough in Mindset and Technology. Cologny, Switzerland: World Economic Forum. Retrieved June, 2017.
Rossini, F., Fioravanti, A., Novembri, G., and Insola, C. (2016). HOLOBUILD: Process Optimization by the Introduction of Mixed Reality in Construction Site. Back to 4.0. Maggioli SpA: Rethinking the Construction Industry, 279–288.
Rüßmann, M., Lorenz, M., Gerbert, P., Waldner, M., Justus, J., Engel, P., et al. (2015). Industry 4.0: The Future of Productivity and Growth in Manufacturing Industries. Boston Consulting Group 9 (1), 54–89.
Schranz, C., Urban, H., and Gerger, A. (2021). Potentials of Augmented Reality in a BIM Based Building Submission Process. ITcon 26 (24), 441–457. doi:10.36680/j.itcon.2021.024
Shin, D. H., and Dunston, P. S. (2008). Identification of Application Areas for Augmented Reality in Industrial Construction Based on Technology Suitability. Automation in Construction 17 (7), 882–894. doi:10.1016/j.autcon.2008.02.012
Sidani, A., Dinis, F. M., Duarte, J., Sanhudo, L., Calvetti, D., Baptista, J. S., et al. (2021). Recent Tools and Techniques of BIM-Based Augmented Reality: A Systematic Review. J. Building Eng. doi:10.1016/j.jobe.2021.102500
Song, Y., Koeck, R., and Luo, S. (2021). Review and Analysis of Augmented Reality (AR) Literature for Digital Fabrication in Architecture. Automation in Construction 128, 103762. doi:10.1016/j.autcon.2021.103762
Tabrizi, A., and Sanguinetti, P. (2019). Literature Review of Augmented Reality Application in the Architecture, Engineering, and Construction Industry with Relation to Building Information. IGI Glob., 61–73. doi:10.4018/978-1-5225-7359-3.ch005
Thomas, B., Demczuk, V., Piekarski, W., Hepworth, D., and Gunther, B. (1998). “A Wearable Computer System with Augmented Reality to Support Terrestrial Navigation,” in Digest of Papers. Second International Symposium on Wearable Computers (Cat. No. 98EX215) (IEEE), 168–171.
Thomas, B. H., and Tyerman, S. P. (1997). Collaboration Issues for Augmented Realities in an Outdoor. CSCW in HCI-worldwide, 29.
Viljakainen, T. (2020). Adoption of Augmented Reality Solutions in Field Engineering and Maintenance: Drivers and Barriers for Organizations.
Wang, X. (2009). Augmented Reality in Architecture and Design: Potentials and Challenges for Application. Int. J. Architectural Comput. 7 (2), 309–326. doi:10.1260/147807709788921985
Wang, X., and Dunston, P. S. (2007). Design, Strategies, and Issues towards an Augmented Reality-Based Construction Training Platform. J. Inf. Technol. construction (Itcon) 12 (25), 363–380.
Wang, X., Love, P. E. D., Kim, M. J., Park, C.-S., Sing, C.-P., and Hou, L. (2013). A Conceptual Framework for Integrating Building Information Modeling with Augmented Reality. Automation in Construction 34, 37–44. doi:10.1016/j.autcon.2012.10.012
Keywords: augmented reality, construction industry, use-cases, benefits, obstacles, future
Citation: Nassereddine H, Hanna AS, Veeramani D and Lotfallah W (2022) Augmented Reality in the Construction Industry: Use-Cases, Benefits, Obstacles, and Future Trends. Front. Built Environ. 8:730094. doi: 10.3389/fbuil.2022.730094
Received: 24 June 2021; Accepted: 16 March 2022;
Published: 11 April 2022.
Edited by:
Hung-Lin Chi, Hong Kong Polytechnic University, Hong Kong SAR, ChinaReviewed by:
Kriengsak Panuwatwanich, Thammasat University, ThailandCopyright © 2022 Nassereddine, Hanna, Veeramani and Lotfallah. This is an open-access article distributed under the terms of the Creative Commons Attribution License (CC BY). The use, distribution or reproduction in other forums is permitted, provided the original author(s) and the copyright owner(s) are credited and that the original publication in this journal is cited, in accordance with accepted academic practice. No use, distribution or reproduction is permitted which does not comply with these terms.
*Correspondence: Hala Nassereddine, aGFsYS5uYXNzZXJlZGRpbmVAdWt5LmVkdQ==
Disclaimer: All claims expressed in this article are solely those of the authors and do not necessarily represent those of their affiliated organizations, or those of the publisher, the editors and the reviewers. Any product that may be evaluated in this article or claim that may be made by its manufacturer is not guaranteed or endorsed by the publisher.
Research integrity at Frontiers
Learn more about the work of our research integrity team to safeguard the quality of each article we publish.