 Khaula Alkaabi
 Salieu Senghore
 Abdel Rhman El Fawair3
94% of researchers rate our articles as excellent or good
Learn more about the work of our research integrity team to safeguard the quality of each article we publish.
Find out more
ORIGINAL RESEARCH article
Front. Built Environ., 17 January 2023
Sec. Urban Science
Volume 8 - 2022 | https://doi.org/10.3389/fbuil.2022.1035546
This article is part of the Research TopicNew Approaches for Sustainable & Resilient Processes and Products of Social Housing Development in the Arabian Gulf CountriesView all 13 articles
UAE's average temperature has risen in recent years and is expected to rise more in the next 40 years, creating a massive heat island agglomeration. Therefore, the demand for energy saving and diversified personal thermal management requires innovative solutions combining advanced building materials and structural designs to provide personal thermal comfort during indoor and outdoor activities. However, due to the complexities of structural designs and their associated materials, analytical and numerical strategies are for revealing real-world scenarios are limited. Therefore, full-scale experiments are required for exploring and demonstrating dynamic scenarios under thermal stress. This study aimed to explore the feasibility of using drone along with various thermal image analysis software that enables thermal photogrammetric mapping for monitoring and classification of heat rates based on building components surveyed across the UAEU campus. Thermal aerial images were collected in March 2022 and analyzed using SPSS, Agisoft Metashape Professional, DJI Thermal Tool, and FLIR for two buildings, A and B, and pedestrian spaces across UAEU's main campus in shaded, unshaded, and green zones. Noramilty and Kruskal-Wallis H tests were applied to examine if there was a statistically significant variation in surface temperatures. The pedestrian space thermal analysis showed that the natural shaded grass surface has the most tolerable heat environment (mean rank = 7.6), while the unshaded sand surface has the most unfriendly thermal environment (mean rank = 52.0), with an 18°C difference in mean surface temperature. The study also revealed the temperature evolution process and its dependence on building materials and structural designs, providing first-hand research data based on building components for the UAE climate, setting the path for future research in the era of sustainability and urban development.
Cooling is one of the most critical challenges for human beings during scorching summer days, especially performing outdoor activities (Farooq and Zhang, 2021). Nowadays, air conditioners have been widely adopted to manage personal thermal regulation. However, its inevitable drawbacks are massive energy consumption and toxic cooling agents that are causing heat-trapping, global warming, and ozone depletion over time (Gaonkar et al., 2018; Valinejadshoubi et al., 2021). Moreover, they are unserviceable for outdoor people to unload their heat stress. Therefore, several innovative solutions and strategies have been implied for providing sustainable solutions of personal thermal management while performing indoor as well as outdoor activities by incorporating energy efficient and passive cooling techniques that involve innovative structural designs and advanced materials such as solar reflective paints (Li et al., 2021), radiative coating (Gao et al., 2021), personal thermal wears (Peng and Cui, 2020), and so forth.
Monitoring the thermal environment of buildings is critical for assessing the performance of existing structures and identifying cost-effective energy-saving solutions (Zhang and Li, 2020; Aguilar et al., 2022). Therefore, a lot of research has been conducted on monitoring the thermal environment impact on outdoor and indoor scenarios (Han et al., 2022; Li et al., 2022). For instance, Maroy et al. (2017) investigate the use of infrared thermography (IRT) to estimate the thermal performance of insulating glass units (IGUs) in Belgium. First, numerical simulations were used to perform a sensitivity analysis on the boundary conditions. Quantitative IR measurements were then carried out on several glass kinds in the lab and on-site. Their findings show that the exact estimation of thermal resistance is not possible with IRT; however, it can distinguish poor insulating IGUs from good and moderate ones, provided that the IRT inspection should be carried out under cloudy conditions and with a temperature difference of at least 15.0°C.
Similarly, Kumar et al. (2018) used outdoor observations to analyze the thermal performance of high thermal mass office spaces operating under natural ventilation mode for the climatic conditions of Jaipur, India. Part of the field measurement data is utilized to construct indoor-outdoor correlations, which are then validated against the rest of the data to predict indoor temperatures in high-density office buildings. Furthermore, when applied to predict indoor temperatures of similarly constructed passive structures, established correlations demonstrated an excellent correlation coefficient (R2 ≥ .92). The use of thermal mass in the building envelope can eliminate an extra 40% and 98% of total thermal discomfort time during the summer and winter seasons, respectively.
Zheng et al. (2020) evaluate the thermal performance of the building’s entire envelope structure. They present a thermal infrared (TIR) external evaluation approach and devise a way to obtain TIR images of the building envelope using a UAV outfitted with an infrared camera and create a 3D point cloud model that includes temperature data for any specified locations. The created 3D TIR model has a temperature accuracy of 5.0°C, whereas 81.25% of the measuring spots have a temperature accuracy of 3.0°C, which is acceptable for the thermal infrared technique. As a result of this technology, a comprehensive, accurate, and efficient in situ evaluation of the building envelope in the urban environment is achievable.
In contrast to conducting an outdoor/field observation or on-site/lab experiment, Kirimtat and Krejcar (2018) gave a comprehensive overview of past studies investigating the anomalies of building envelopes using IRT. They categorized the applications by measuring methods, analysis schemes, and analysis types to demonstrate IRT’s potential in building envelope inspection for providing energy-efficient solutions. According to key reviews and findings of their research, heat loss, moisture, and air leakage all have a substantial impact on the energy performance of building envelopes.
Heat loss through the building envelope can be divided into two categories: heat loss through the plain portions, measured by the thermal transmittance (U-value), and heat loss through thermal bridging O'Grady et al. (2017a). Several studies have evaluated the heat loss induced by thermal bridging using various methods (Heinrich and Dahlem, 2000; Zalewski et al., 2010; Ascione et al., 2013; Ascione et al., 2014). For instance, O’Grady et al. (2017a) used an outdoor infrared thermographic survey to estimate the thermal bridging performance and devised an efficient, non-destructive, in situ testing approach. They include an assessment of the wind velocity impact on the Ψ-value—linear thermal transmittance since wind velocity substantially impacts heat losses through the building envelope. The results revealed that the Ψ-value strongly depends on wind velocity, making it nearly impossible to compare measurements of the -value performed under different wind conditions. A strategy is suggested for converting the Ψ-value measured at any wind velocity to a standard value corresponding to a 4 m/s wind velocity. This modification approach makes the methodology generally applicable from a practical standpoint.
O’Grady et al. (2017b) also offered another quantitative ITT methodology for calculating structures’ thermal bridge heat flow rate. The methodology can be used to calculate the Ψ-values of any existing building envelope. This innovative method used the ITT alone to determine the actual heat flow rate induced by thermal bridge qTB and -value, with no other supporting methods. The qTB and Ψ-value determined using the supplied approach accurately reflect the thermal bridge’s actual thermal performance.
Recently, Leggiero et al. (2021) presented a comprehensive workflow for quantifying radiative heat loss from building envelopes. This includes the setup and technique for fast building accurate 3D thermographic models and analyzing them with software designed specifically for this purpose (VAMPIRE- a Versatile Analysis and Measurement Protocol for Infrared Emissions). Three analytical models for building envelope radiative heat loss are implemented and tested through controlled tests for viability. The workflow is then shown by assessing the thermal radiation losses of two buildings on the University of North Georgia’s campuses. Their findings implied that the approach could promptly yield accurate radiative heat loss measurements and could be a valuable complement to more thorough thermal analysis techniques.
In addition to thermal monitoring of buildings, providing personal thermal management will perform outdoor activities necessitate the thermal environment monitoring of outdoor spaces, such as parking lots and pedestrian spaces. Nan et al. (2022) analyzed the difference in the thermal environment of eight different parking lots in Hangzhou, China, and proposed that the shading significantly influenced the management of thermoregulation; however, the cooling effect of trees was found the stronger than the artificial shading. Meanwhile, the grass is found to be helpful in mitigating urban heat agglomeration by decreasing the surface temperature (Nan et al., 2022). Yin et al. (2022) analyzed the thermal environment of outdoor public spaces. The authors concluded that the thermal comfort in outdoor spaces is highly influenced by the atmospheric conditions, leading from the highest temperatures in summer to freezing in winter. Therefore, careful consideration is required while selecting building and shading materials and structural orientations to ensure the thermal comfort of occupants during all seasons of the year (Yin et al., 2022).
The use of unmanned aircraft systems (UASs) has grown recently across a wide range of inspection applications (Falorca and Lanzinha, 2021; Alkaabi and El Fawair, 2022), and its infrared photography has proven to be more advanced than traditional auditing methods (Corsi, 2010). The infrared audit is an intriguing tool among the energy audit techniques and is widely adopted. The two most important elements in producing a top-notch infrared audit, in accordance with Dall’O et al. (2013), are high-performance equipment and the infrared auditor’s technical expertise. They discussed the outcomes of an infrared audit campaign for 14 pre-existing buildings in Milan Province, Italy, erected throughout various eras and with varied building technologies. The thermal resistance obtained indirectly by thermography of the opaque walls of the structures under investigation were compared to real known values to verify the method’s reliability and the margin of error. The study found that the implementation of this method is adequately trustworthy in solid-mass structure buildings, which are the most common in Italy; however, the percentage of variation is very high in buildings with insulated external walls.
Focusing on the application of UAS for energy audit purposes, Rakha and Gorodetsky (2018) provided a thorough overview of the literature on UAS applications in the built environment. They identified a standard protocol for using a UAS for energy audit missions, and their analysis highlighted current UAS-based thermal imaging techniques and methodology. As part of the findings for the literature study, investigative methodologies for before, during, and post-flight studies were designed, calibrated, and tested on the Syracuse University campus. As a move toward standardizing the automation of building envelope inspection, the findings recommend further empirical experimentation and research replication to improve procedure accuracy.
The average temperature in the UAE has risen by over 1.5°C in recent years mainly as a result of greenhouse gas emissions, and projections indicate that it could rise by another 2.5°C in the next 40 years, eventually generating a massive heat island agglomeration (Issa, 2016; Ksiksi and Al-Blooshi, 2019; Hill, 2021). Considering these challenges, sustainable cities and communities are a key goal among all SDGs under the local agenda of the UAE national government. This key sustainability objective necessitates a thoughtful exploration of how we build buildings and communities to be resilient, safe, and sustainable in a way that responds to future challenges such as climate change and the Emirati community’s socio-economic growth. For Example, monitoring the surface temperatures of buildings is critical for assessing the performance of existing structures and identifying cost-effective energy-saving solutions. Therefore, this study explores the application of thermal imagery-based cameras on UAVs for mapping urban structures for the first time to the best of our knowledge for the climatic conditions of the UAE. The flight missions were conducted throughout the weekend of 26 and 27 March 2022, at the United Arab Emirates University (UAEU) main campus to examine the feasibility of employing UAVs for thermal photogrammetric mapping for assisting in the monitoring and classifying of heat rates based on orientation and building components, such as glass, cement, sand, etc., because the layout, orientation, materials, and on-site location directly influence the heat gain in the buildings. Buildings A and B were chosen for this study, with Building A having an E-shaped design surrounded by an artificial shaded pathway and open spaces. Building B is oval in shape, with a large artificial water pool on one side and open green space on the other. Furthermore, the spatial distribution of thermal comfort is evaluated and analyzed for selected pedestrian spaces and parking lots based on their structural configurations, such as shaded, unshaded, and areas near plants or trees. Overall, the findings are expected to be useful to decision-makers concerned with issues of sustainability and urban development, such as monitoring the effects of the urban thermal environment and developing corresponding mitigation strategies for building components and thermal environment in pedestrian spaces to ensure the personal thermal management of occupants with minimum footprints.
Firstly, the drone camera Parrot Anafi Thermal was calibrated, and the interior orientation parameters (IOP) were calculated to set and maintain the precision and accuracy of the drone. The camera calibration was conducted at the E5 Laboratory in the UAE University, and the camera’s inner orientation parameters were also numerically measured, as shown in Figure 1A. The thermal camera has been calibrated according to the reflection temperature in each measurement with a corresponding temperature and relative humidity of 22.0°C and 42%, respectively. The reference standards, indication errors, and measurement uniformity are briefly explained in the Supplementary Tables SA1–SA3, respectively. In addition, the interior orientations of the camera were checked to confirm that they matched the principal distances (c) and principal point locations (xp, yp) as well as picture coordinate corrections for various deviations from the expected perspective geometry. The IOP was determined using a bundle adjustment with self-calibration.
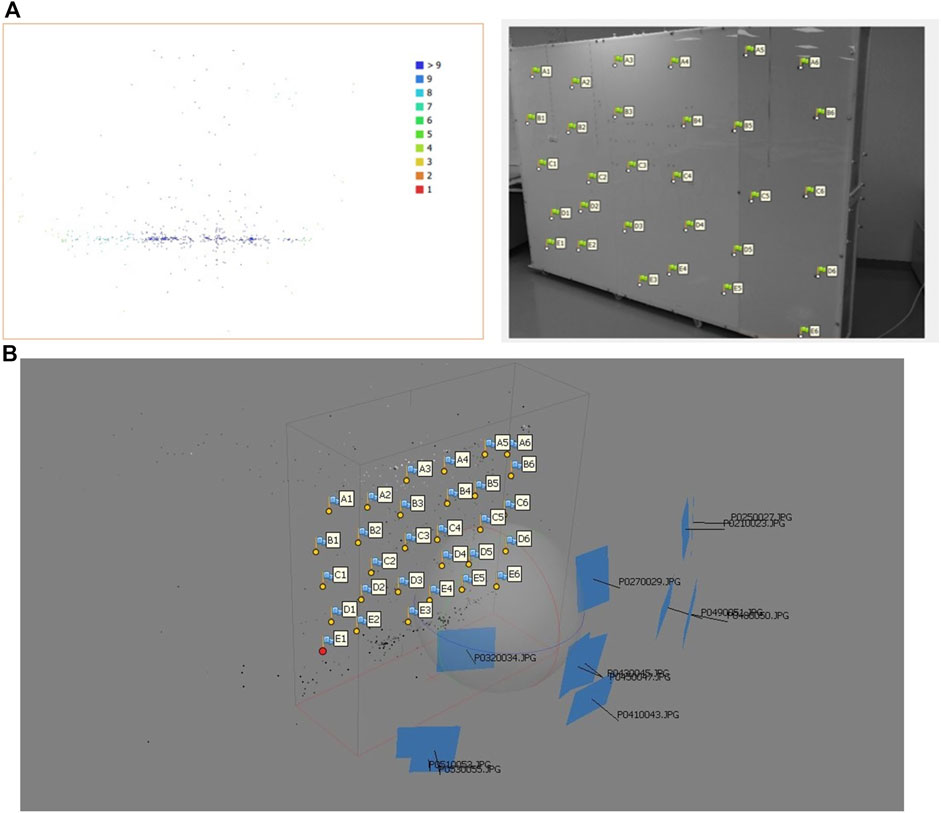
FIGURE 1. (A) Camera locations and image overlap using physical board in UAEU Laboratory; (B) Perspective view showing the location of exposure stations, camera orientation and GCPs using Agisoft software.
The existing wide-format calibration field was used to calibrate the new drone camera. The Calibration process was conducted in accordance with the workflow shown in Figure 2. After applying the camera calibration steps, the error results were determined. The Parrot Anafi thermal camera was calibrated, and the drone was ready to be used for photogrammetric mapping. The perspective location of exposure stations, and camera orientation, are shown in Figure 1B using Agisoft software.

FIGURE 2. Camera calibration Workflow.
Maintaining the thermoregulation of students and workers while performing indoor and outdoor activities is essentially required to maximize work productivity. Therefore, to analyze the impact of the ambient temperature on the heat gain of building materials and shadings, the flight missions were conducted throughout the weekend of 26 and 27 March 2022, at the UAEU main campus. Due to summer break during the peak summer months, when students are not required to come, this time of the year was selected for conducting the experiments. In comparison, it is still the on-going spring semester during which the students are required to attend their classes on-campus, while the weather profile, as shown in Figure 3, shows that the peak daytime solar irradiance is high, with temperatures reaching up to 40.0°C and low relative humidity, making it essential to monitor the thermal environment. Furthermore, the flight missions were conducted during the weekend to reduce the influence of students’ bodies detected by the thermal camera. Pix4Dcapture and Parrot FreeFlight 6 applications were employed to create autonomous drone flight plans and missions and take needed aerial image shots. Tables 1, 2 illustrate the main characteristics of the two drones utilized in this study and associated flight mission plans for capturing aerial images in both visible and thermal modes.
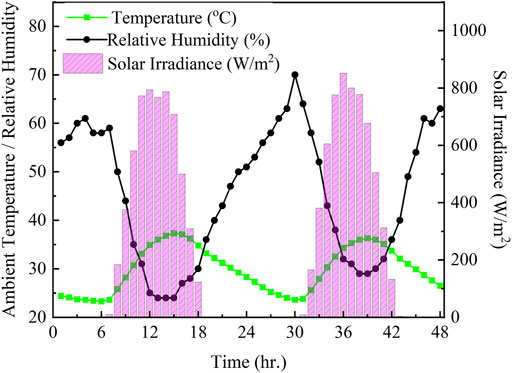
FIGURE 3. Metrological data for Al Ain (24.1302°N, 55.8023°E) on 26 March 2022 and 27 March 2022.
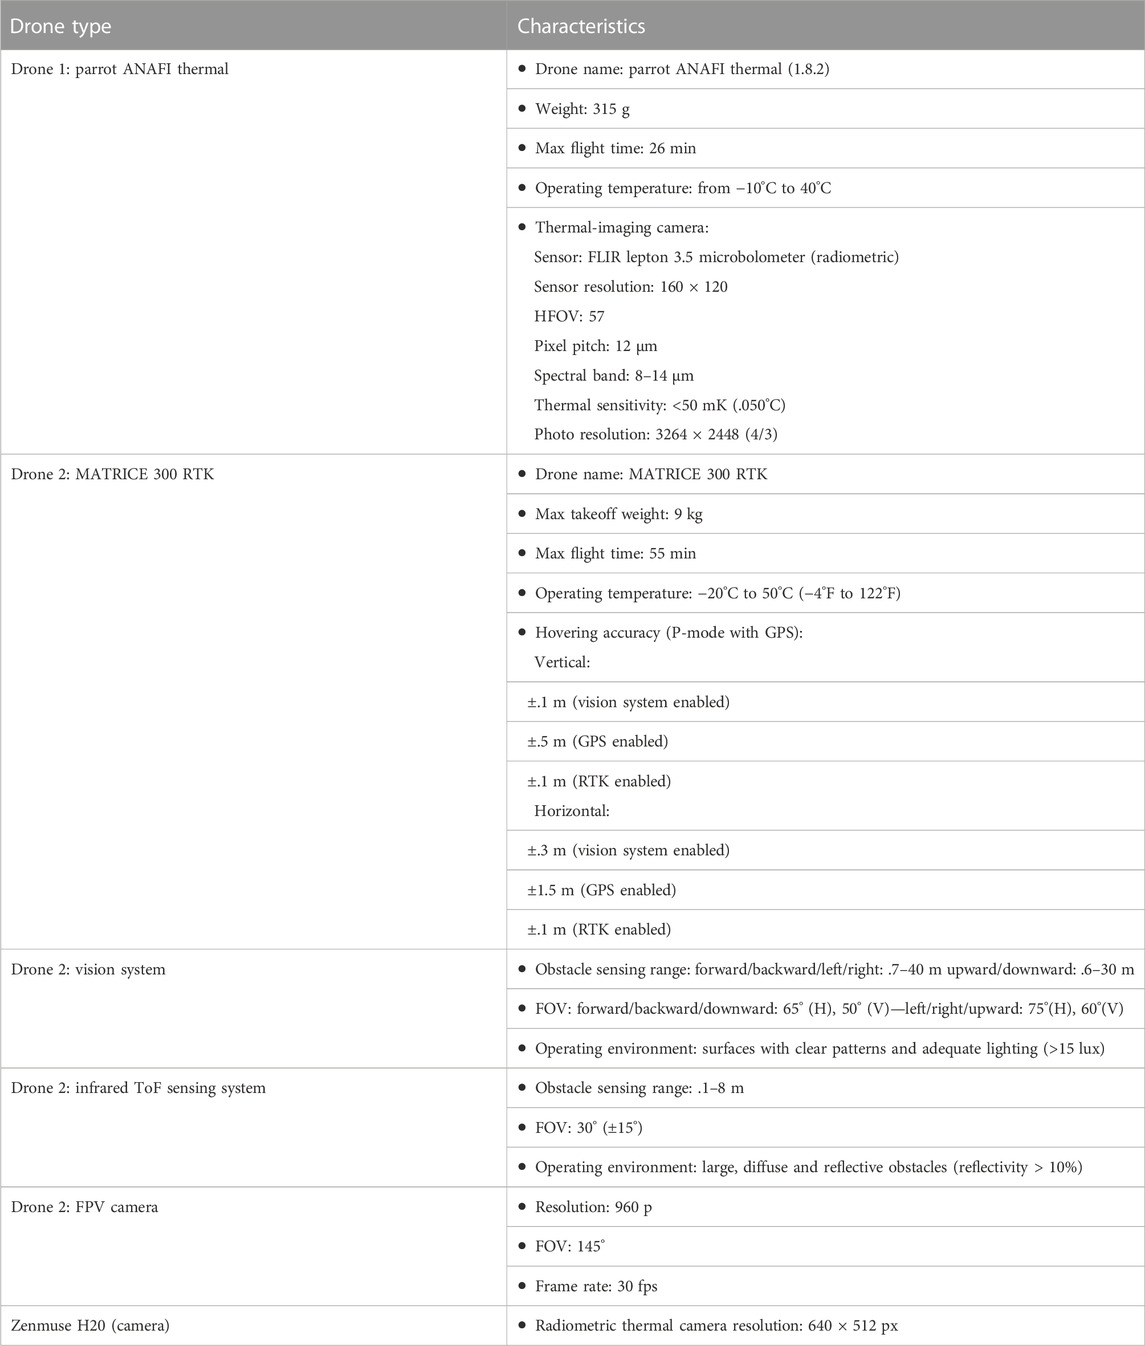
TABLE 1. The characteristics of the drones and cameras employed in this research project.
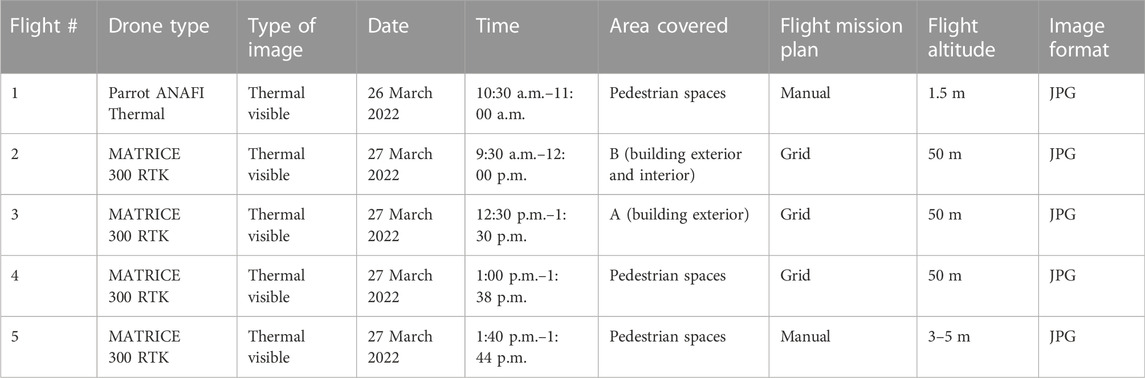
TABLE 2. Flights Planning and aerial surveys.
Many thermal aerial images were taken by the drone for two different buildings, referred to as A building and B Building, as well as pedestrian spaces across the main campus of UAEU. Thermal analysis and 3D model development were carried out using the following software:
1- Agisoft Metashape Professional (1.8.0 build 13794): used for developing 3D models (Visible RGB, Thermal) taken by MATRICE 300 RTK
2- DJI Thermal Analysis Tools 2 (V21.18): used for thermal analysis for selected thermal images taken by MATRICE 300 RTK
3- DJI Thermal Analysis Tool (V1.1.0): used for thermal analysis for selected thermal images taken by MATRICE 300 RTK
4- FLIR: used for thermal analysis for selected thermal images taken by Parrot ANAFI Thermal drone
Using Agisoft Metashape Professional Software, the aerial photos captured during the drone flight were calibrated, as well as the camera locations and error estimates, as shown in Figures 4A, B and Table 3. The software then processes the calibrated photos to create and construct a three-dimensional model of the A building and its associated digital elevation model using 1,474 aerial images, as shown in Figures 4C, D.
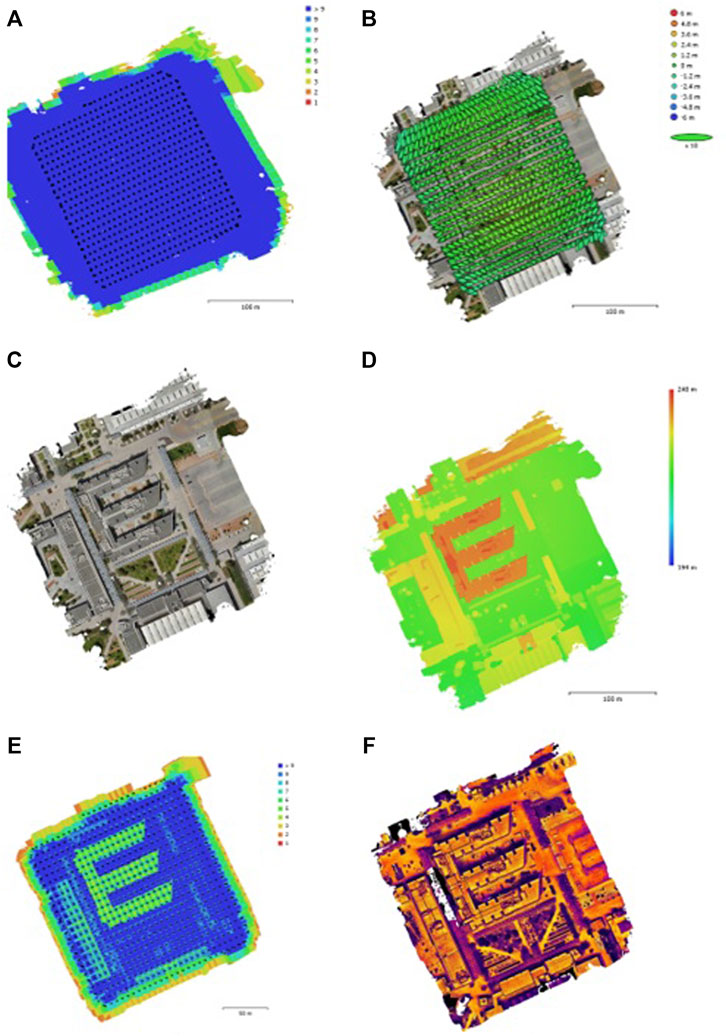
FIGURE 4. (A) Camera locations and image overlap; (B) Camera locations and error estimate*; (C) Constructed 3D model for A building; (D) Digital elevation model for A building using Agisoft Metashape; (E) Camera locations and image overlap; (F) Thermal 3D model for A building. * Note: Z error is represented by ellipse color. X, Y errors are represented by ellipse shape. Estimated camera locations are marked with a black dot.
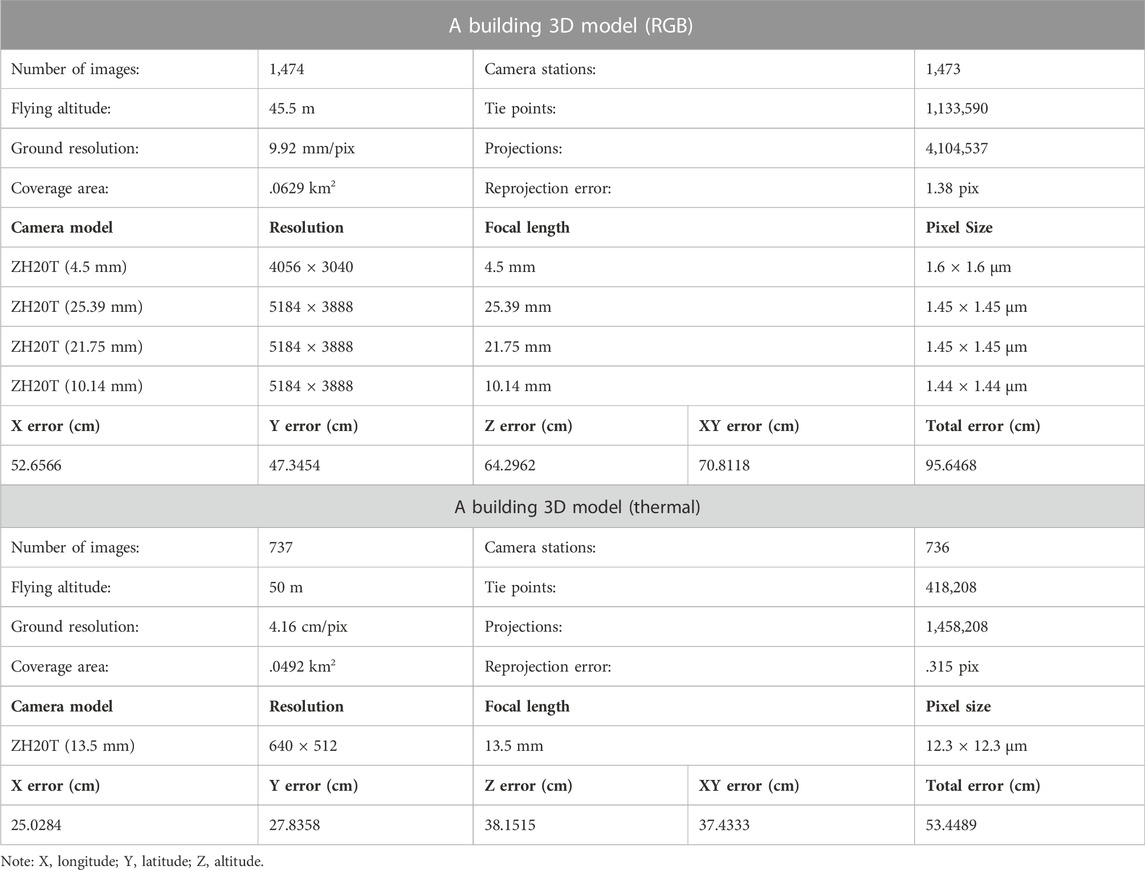
TABLE 3. A building 3D model (RGB, Thermal): Cameras’ specifications and average camera location error.
Agisoft Metashape Professional Software was used to construct a thermal 3D model for the A building at UAEU campus using 737 thermal aerial images, as shown in Figures 4E, F; Table 3.
This study explores the temperature environment of the B building. The heat demand is determined by several factors, including:
• The insulating characteristics of the construction material are referred to as the U-values of the walls
• The amount of heat carried away by air movement varies according to the size of the building and the number of windows.
• The difference in temperature between the inside and outside of a building—the cooling energy required for cooling a building varies by season.
• Double glazed spandrel (DGS) glass is used in all strucures in this study to ensure the opaqueness along with the excellent strength.
Thermal assessments are crucial throughout the design phase of a building because they provide an estimate of the energy required to cool or heat the building. Figure 5 showcases the side views of the B outdoor building, with thermal images illustrating the difference in external temperatures using the DJI Thermal Analysis Tool. Thermal imaging measurements for the B indoor building are shown in Figure 6.
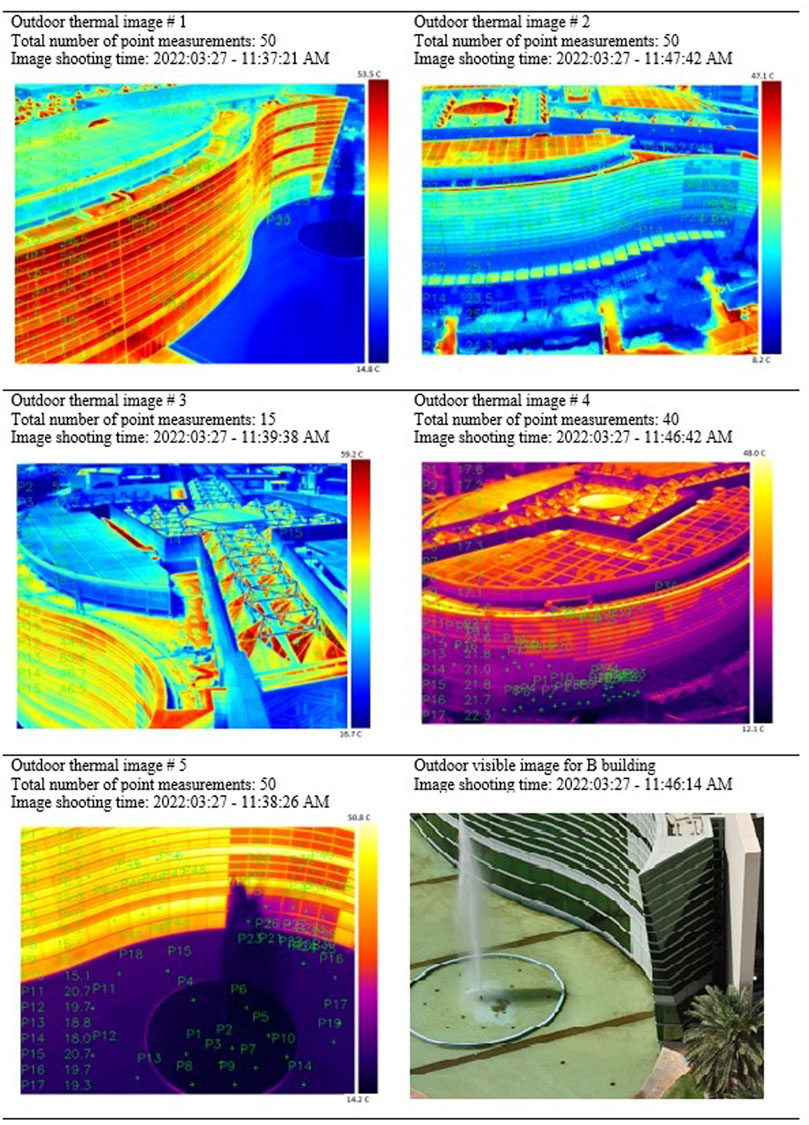
FIGURE 5. Thermal imaging measurements for the B outdoor building.
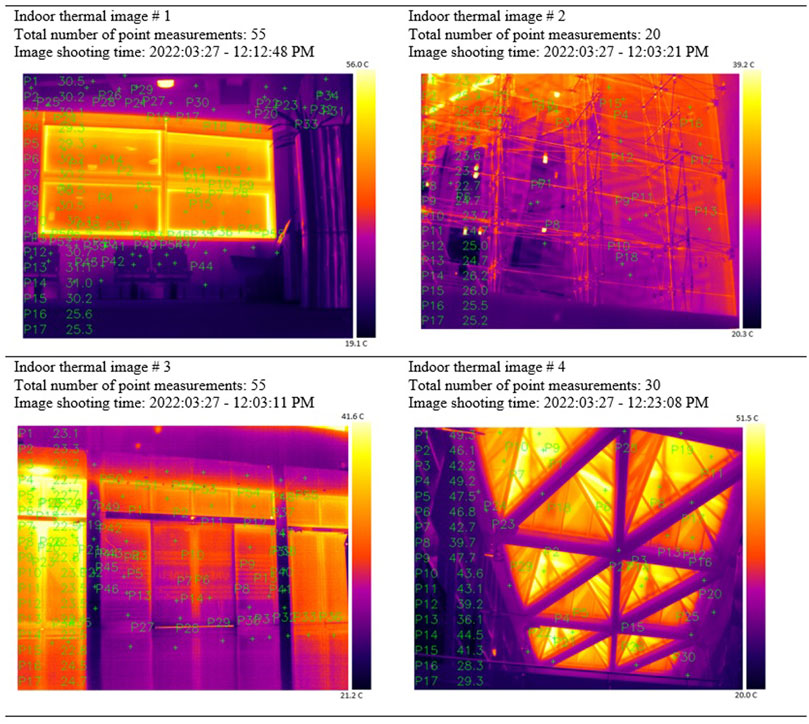
FIGURE 6. Thermal imaging measurements for the B indoor building.
Figure 7 shows a comparison between the visible image and the infrared image analysis for the pedestrian zone (Case 1) using FLIR Tools. As indicated from spot measurements that shaded surface (Sp1: 30.2°C; Sp2: 30.9°C; Sp21: 31.1°C) tends to be cooler than an unshaded surface directly exposed to the Sun (Sp10: 46.3°C; Sp11: 45.1°C), with a substantial temperature difference of around 14.0°C–16.0°C. Therefore, pedestrian zones located between buildings and covered by shads tend to have a more tolerable heat environment than unshaded zones.
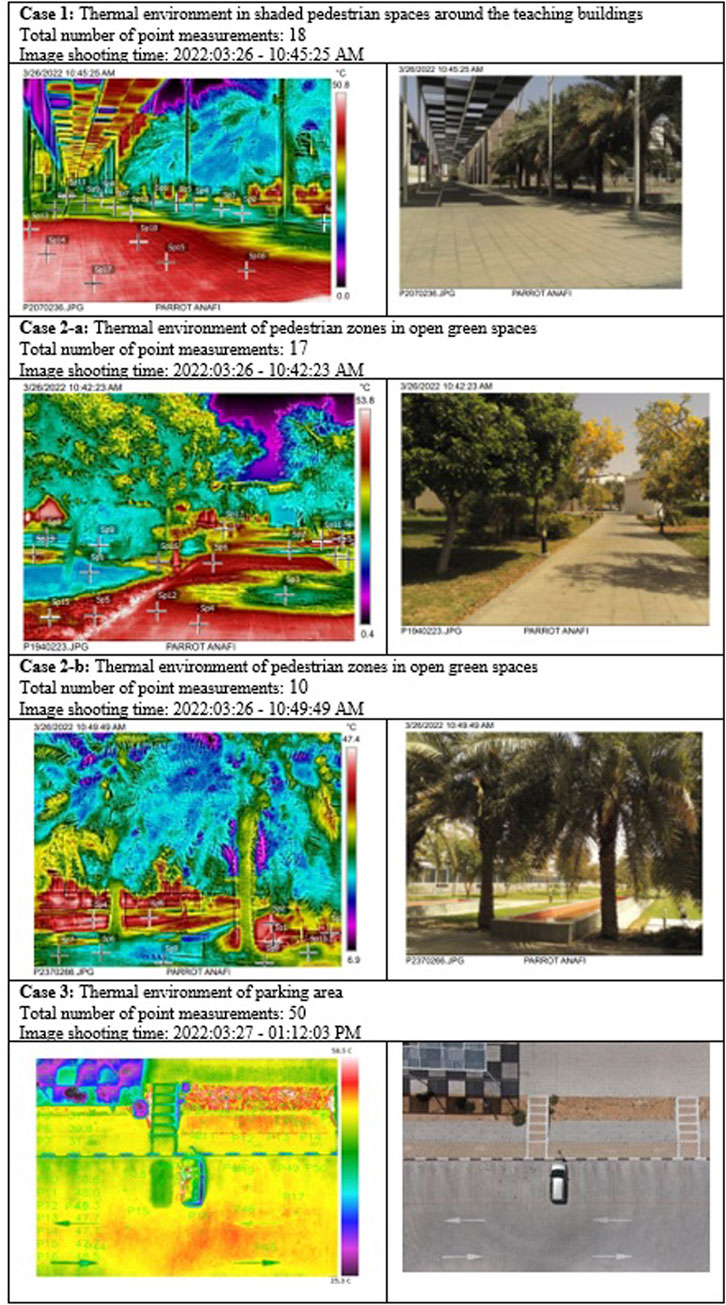
FIGURE 7. Thermal environment analysis in shaded pedestrian areas (Case 1), pedestrian zones in open green spaces (Case 2-a, Case 2-b), and campus parking lot.
A comparison analysis of the thermal environment in pedestrian zones (a) and (b) adjacent to green spaces and tree shading show a tolerable heat surface environment using FLIR Tools, as shown in Figure 7. For example, shaded surfaces in Case 2-a located near trees tend to have lower temperatures (Sp1 30.2°C; Sp8 30.3°C; Sp9 31.1°C; Sp2 30.9°C) than exposed surfaces to the Sun directly (Sp4 47.1°C; Sp5 46.4°C) as indicated in Figure 7 Case 2-a. In Case 2-b, the shaded surfaces also tended to be tolerable for pedestrians (Sp7 30.9°C; Sp8 31.3°C; Sp10 31.0°C) (Figure 7).
Thermal analysis for different points around the campus parking lot reports higher temperature measurements using DJI Thermal Analysis Tool 2, as illustrated in Figure 7. The excessive temperatures (exceeding 40.0°C) were primarily attributed to the pavement’s construction materials and lack of sufficient shade.
Statistical Package for the Social Sciences (SPSS) version 26 from IBM was used to analyze the collected data. First, a descriptive statistics test was conducted. Next, the normality distribution test for the data was performed using Shapiro-Wilk and Kolmogorov-Smirnov tests, which were assessed at the 5% significance level. In all cases, the p-value was less than (<) .05, which led to do a non-parametric test. The Kruskal-Wallis test was then used to analyze and contrast the statistical differences between the study’s more than two independent groups. Afterward, Spearman’s Rank Correlations was performed to examine the strength (weak, moderate, strong, etc.) and type (positive or negative) of the relationship between the overall temperatures of the three variables (B OBSSM1, B IBCSM2, and B ELFSM3) of the B building in the study.
This study’s descriptive statistics data comprised the thermal conditions of the following variables: Pedestrian Spaces Shaded Surface types (PSSST), the A outdoor building components and surface materials (A OBCSM), the B outdoor building sides and surface materials (B OBSSM), the B indoor building components and surface materials (B IBCSM), and the B external landscape features and surface materials (B ELFSM). For each variable, descriptive statistics (mean and standard deviation) were computed (Table 4). According to the descriptive statistics of mean values, the thermal environment in the A OBCSM was the most intense, followed by the PSSST and the B OBSSM. The descriptive statistics’ mean values revealed that B ELFSM had the least intense thermal environment. However, the B IBCSM had the biggest sample size (N), the smallest standard error of the mean, and the least amount of variation (standard deviation). All the other variables had positively skewed distributions, except A outdoor building components and surface materials (A OBCSM). Also, A OBCSM recorded the highest maximum temperature (°C), while B ELFSM had the lowest minimum temperature (°C). B IBCSM and B ELFSM had the highest and lowest kurtosis values, respectively.
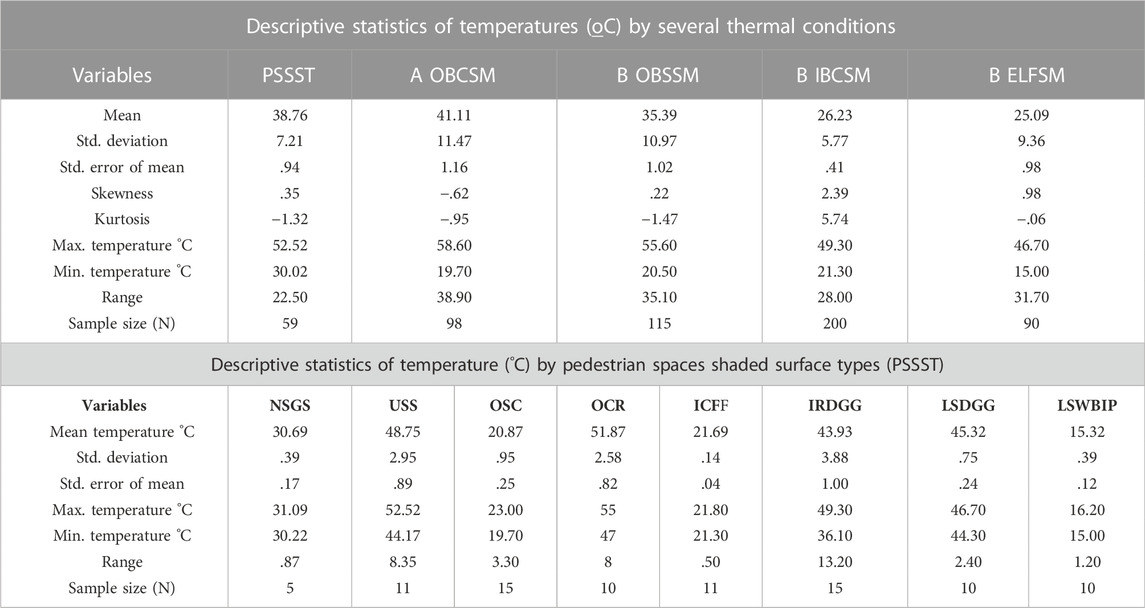
TABLE 4. Descriptive statistics of temperatures (°C) by several thermal conditions and by pedestrian spaces shaded surface types (PSSST).
In accordance with the study’s data, the PSSST variable consists of six groups, namely: 1) unshaded sand area (N = 11, 18.6%), 2) unshaded cement area (N = 15, 25.4%), 3) artificial shade cement area (N = 6, 10.2%), 4) natural shade cement zone (N = 11, 18.6%), 5) unshaded grass zone (N = 11, 18.6%), and 6. natural shade grass zone (N = 5, 8.5%). As shown in Table 4, descriptive statistics of mean and standard deviations were computed for each group of the previously mentioned variables. Results of the PSSST variable showed that the natural shaded grass surface (NSGS) has the least mean surface temperature (mean = 30.7°C), while the unshaded sand surface (USS) has the greatest mean surface temperature (mean = 48.7°C)—a difference in mean surface temperature of 18°C. The A OBCSM variable comprises seven groups, namely: 1) outside cement roof (N = 10, 10.2%), 2) outside shaded cement (N = 15, 15.3%), 3) outside unshaded cement (N = 10, 10.2%), 4) outside unshaded dark double-glazed spandrel (DGS) glass (N = 7, 7.1%), 5) outside shaded cement wall (N = 10, 10.2%), 6) unshaded gray cement roof (N = 25, 25.5%), and 7) unshaded gray small pebbles roof (N = 21, 21.4%). Descriptive statistics results of the A OBCSM revealed that the outside shaded cement (OSC) recorded the lowest mean thermal condition (mean = 20.9°C), while the outside cement roof (OCR) component recorded the highest mean temperature (mean = 51.9°C), with a mean surface temperature variation of 31.0°C.
The B OBSSM variable contains nine groups, namely: 1) outdoor left side dark green glass (N = 25, 21.7%), 2) outdoor left side white glass (N = 10, 8.7%), 3) outdoor left side white cement roof (N = 10, 8.7%), 4) outdoor left side white metal roof (N = 5, 4.3%), 5) outdoor right side DGS dark green glass (N = 25, 21.7%), 6) outdoor right side DGS white glass (N = 10, 8.7%), 7) Outdoor right side white cement roof (N = 10, 8.7%), 8) Outdoor right side white metal roof (N = 5, 4.3%), and 9) Outdoor DGS dark green glass roof (N = 15, 13%). Findings from the B OBSSM descriptive analysis have shown that the outdoor right side made of white DGS glass surface material (located near the trees) has the lowest mean surface temperature (mean = 22.6°C), while the outdoor left side (exposed to direct rays from the rising sun) made of dark green DGS glass surface material has the greatest mean surface temperature (mean = 48.3°C)—having a mean surface temperature difference of 25.6°C.
There are fourteen categories for the B IBCSM variable. First is the indoor dark green DGS glass roof (N = 15, 7.5%; Figure 6—Image 4). The second is the indoor metal roof (N = 15, 7.5%; Figure 6—Image 4). The third is the inside second entrance DGS glass door on the ground floor (N = 15, 7.5%; Figure 6—Image 3). Fourth is the inside entrance DGS glass door on the ground floor (N = 11, 5.5%; Figure 6—Image 3). Fifth is the indoor floor marbles beside the entrance door on the ground floor (N = 10, 5%; Figure 6—Image 3). Sixth is the inside cement wall at the entrance door on the ground floor (N = 19, 9.5%; Figure 6—Image 3). Seventh is the indoor glass roof at the entrance on the first floor (N = 20, 10%; Figure 6—Image 2). Eighth is the indoor glass window on the first floor (N = 15, 7.5%; Figure 6—Image 1). Ninth is the inside cement roof on the first floor (N = 15, 7.5%; Figure 5—Image 1). The tenth is the indoor cement wall on the first floor (N = 15, 7.5%; Figure 5—Image 1). The eleventh is the indoor wooden chairs beside the glass window (on the left side) on the first floor (N = 10, 5%; Figure 6—Image 1). The twelfth is the indoor carpet close to the window on the first floor (N = 9, 4.5%; Figure 6—Image 1). Thirteen is the indoor carpet far from the window on the first floor (N = 9, 4.5%; Figure 6—Image 1). Fourteen is the indoor white transparent curtain on the first floor (N = 20, 10%; Figure 6—Image 1). According to the descriptive analysis of the B IBCSM variable, the indoor carpet located a bit away from the window on the first floor (ICFF) has the lowest mean surface temperature (mean = 21.7°C), while the indoor roof made of dark green glass (IRDGG) has the highest mean surface temperature (mean = 43.9°C)—the variation in the mean surface temperature was 22.2°C.
Like the B OBSSM variable, the B ELFSM variable comprises nine categories: 1) right side DGS white glass adjacent to natural shade—trees (N = 10, 11.1%), 2) right side DGS white glass exposed to the Sun (N = 10, 11.1%), 3) Right side DGS white glass near artificial shade (N = 10, 11.1%)., 4) right side dark green DGS glass exposed to the Sun (N = 10, 11.1%), 5) left side water body inside pool ring (N = 10, 11.1%), 6) left side water body outside pool ring (N = 10, 11.1%), 7) left side white DGS glass near water body pool ring (N = 10, 11.1%), 8) Left side white DGS glass at higher floors far from pool ring (N = 10, 11.1%), 9) left side dark green class near water pool (N = 10, 11.1%). Results showed that the dark green DGS glass next to the fountain or pool on the B building’s left side (LSDGG) tends to have the highest mean surface temperature (mean = 45.3°C). On the other hand, the water body inside the pool ring on the B building’s left side (LSWBIP) showed the least mean surface temperature (mean = 15.3°C). The was a mean surface temperature variation of 30.0°C between the water body inside the pool ring and the dark green glass.
A normality test was conducted to determine the most appropriate metric (parametric or non-parametric) technique for analyzing the data to answer our research questions (Table 5). The variables—thermal conditions of Pedestrian Spaces—Shaded Surface types (PSSST), the temperatures of the A outdoor building components and surface materials (OBCSM), the thermal conditions of the B outdoor building sides and surface materials (OBSSM), the temperatures of the B indoor building components and surface materials (IBCSM), and the thermal conditions of the B external landscape features and surface materials (ELFSM) were all non-normally distributed (p-value < .05) according to both the Kolmogorov and Shapiro statistical tests.
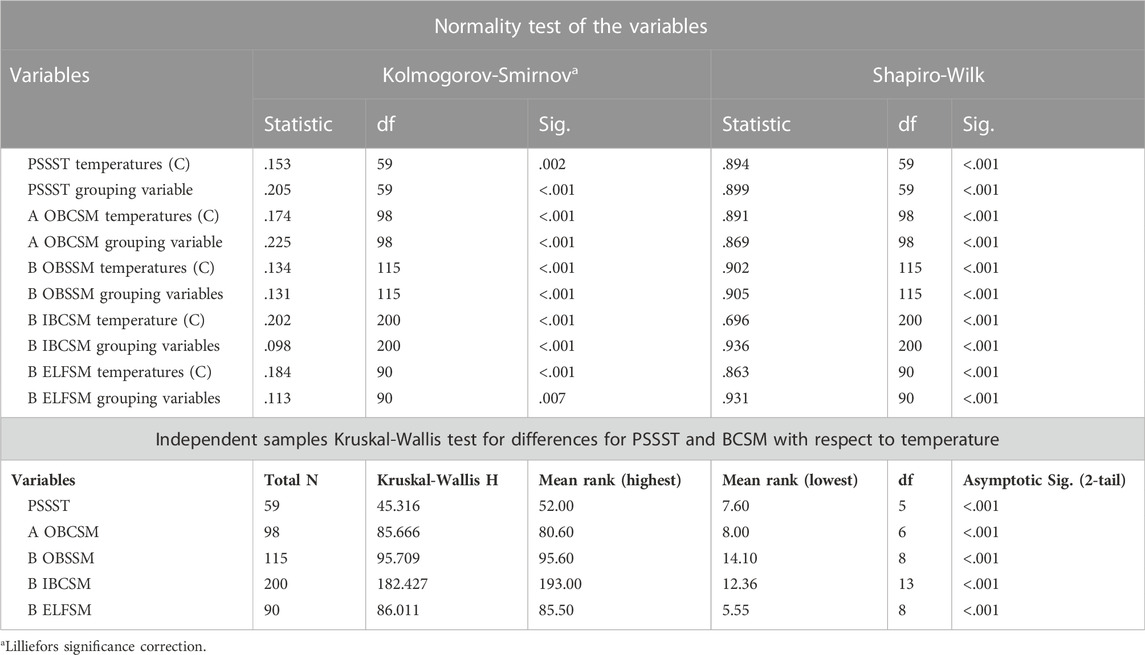
TABLE 5. Normality test of the variables and independent samples Kruskal-Wallis Test for differences for PSSST and BCSM with respect to temperature.
Since the data were not normally distributed, a non-parametric independent sample Kruskal-Wallis Test for Thermal Conditions of Pedestrian Spaces—Shaded Surface types (PSSST) were performed to examine if there is any statistically significant difference in temperature among the shaded surface materials/types for pedestrians. The test result (Table 5) reveals a significant statistical difference between some shaded surface types with respect to Temperature (Test Statistics = 45.316, df = 5, p < .001). Mean rank = 52.0 indicates that the Unshaded Sand surface has the highest temperature, followed by the Unshaded Cement surface type (mean rank = 38.3) and Unshaded Grass (Mean rank = 29.55). The test result shows that the Natural Shade Grass recorded the lowest temperature with a mean rank of 7.6, followed by the Natural Shaded Cement surface (mean rank = 10.2) and the Artificial Unshaded Cement surface (mean rank = 24.7). Overall, the results showed that the Natural Shaded Grass surface tends to have the most tolerable heat environment, while the Unshaded Sand surface has the most unfriendly thermal environment, with a huge mean temperature difference of 44.4°C. Therefore, shading the area with natural grass or trees as much as possible is the most efficient way to create a comfortable pedestrian zone.
The Kruskal Wallis H test results also showed a significant statistical difference between some groups of the grouping variables PSSST; thus, a pairwise post-hoc test (Table 6) was run to identify which paired samples surface types have temperatures that are statistically significantly different at .05 significance level. The post-hoc test results (Table 6) for the PSSST grouping variable showed that out of the fifteen paired samples, only the following two paired samples were not statistically significant: 1. The Artificial Shaded Cement surface (ASC) and Unshaded Grass surface (UG) (p = .159 > .05); 2. The Natural Shaded Cement surface (NSC) and the Natural Shaded Grass surface (NSG) (p = .396 > .05) at .05 level of significance. In other words, all the paired samples of the shaded surface types showed a statistically significant difference in temperature except for 1. ASC and UG, and 2. NSC and NSG. This could partly imply that the difference in mean temperatures of naturally shaded pedestrian spaces tend to be statistically insignificant in the Spring season at UAEU campus.
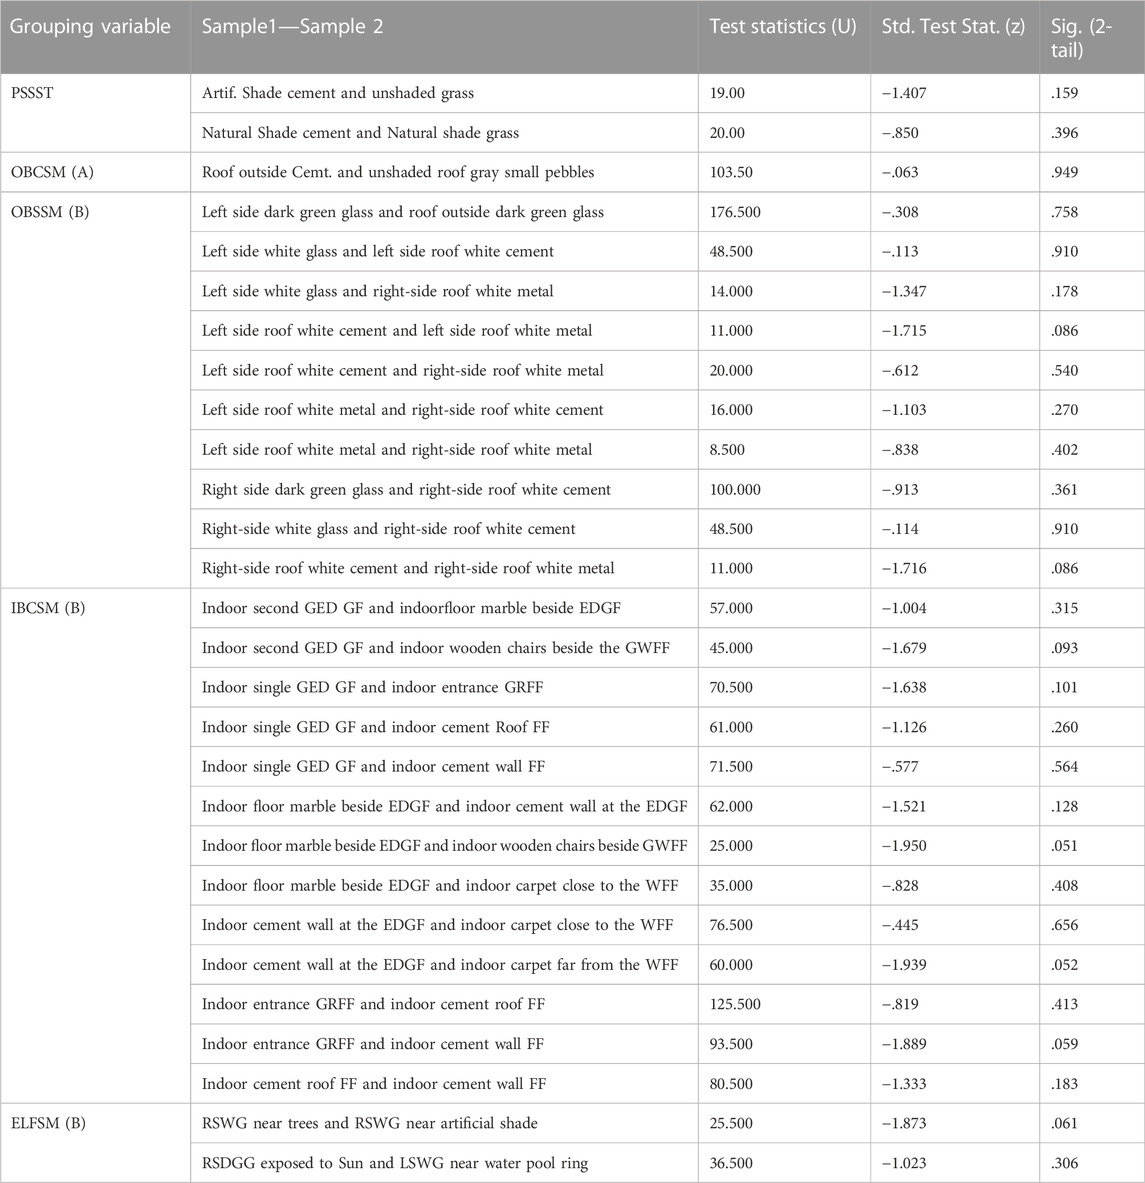
TABLE 6. Pairwise Comparisons of the PSSST, OBCSM (A), OBSSM (B), IBCSM (B), and ELFSM (B) Grouping Variables in terms of Temperature (T).
The Kruskal-Wallis H test results (Table 5) for the exterior A building components (e.g., roof, wall) and surface material types/colors (e.g., glass, cement, small pebbles) grouping variable reveal a significant statistical difference between some building components and surface material types/colors with respect to Temperature (Test Statistics = 85.666, df = 6, p < .001). According to the mean ranks of the grouping variable OBCSM, the outside cement roof component (mean rank = 80.6) registered the highest level of heat, followed by the unshaded roof component made of small gray pebbles (mean rank = 80.4) and the unshaded roof consisting of gray cement (Mean rank = 57.6). In addition, the test result shows that the outside shaded cement recorded the lowest temperature (mean rank = 8.0), followed by the exterior shaded dark DGS glass surface, which has a mean rank of 20.21. Next is the shaded outside wall made of cement (mean rank = 28.4). It is important to note that the data (thermographic images) were captured during the daytime in Spring, precisely between 12:42 p.m. and 1:41 p.m. on 27 March 2022.
For the OBCSM grouping variable, the post-hoc test results (Table 6) showed that out of the twenty-one paired samples, and only one paired sample did not show a statistically significant difference with regards to temperature—Roof Outside Cement (ROC) and Unshaded Roof Gray small pebbles (URGSP) (p = .949 > .05) at .05 level of significance. In other words, all the paired samples of the building components and surface material types/colors showed a statistically significant difference in temperature except for the paired sample (the outside roof comprising of cement and the unshaded roof made of small gray pebbles) of A building.
Similarly, an independent sample Kruskal-Wallis Test for the exterior of the B building (grouping variable) was used to examine if there was a statistically significant variation in temperature between the building sides (e.g., left side, right side, etc.) and surface material types/colors (e.g., metal, glass, cement, etc.). The test result (Table 5) shows a statistically significant difference in temperature between some building sides and surface material types/colors (Test Statistics = 95.709, df = 8, p .001). The outdoor left side made of dark green DGS glass surface material registered the highest amount of heat (mean rank = 95.6), followed by the outside roof made of dark green DGS glass surface material (mean rank = 93.1), and the outside left side made of white DGS glass (Mean rank = 63.2). Furthermore, the outside right side made of white DGS glass surface material (located near the trees) recorded the lowest temperature (Mean rank = 14.1), followed by the exterior roof on the right side made of white cement surface material with a mean rank of 26.4, and the external dark green DGS glass on the right side (mean rank of 28.1). It is worth noting that the data (thermographic images) were taken between 11:37 a.m. and 11:47 a.m. on 27 March 2022.
The post-hoc test results (Table 6) of the grouping variable OBSSM for B building showed that ten out of the thirty-six paired samples revealed a non- significant statistical difference with regards to temperature 1. Left Side Dark Green DGS Glass and Roof Outside Dark Green DGS Glass (p = .758 > .05); 2. Left Side White DGS Glass and Left Side Roof White Cement (p = .910 > .05); 3. Left Side White Glass and Right-Side Roof White Metal (p = .178 > .05); 4. Left Side Roof White Cement and Left Side Roof White Metal (p = .086 > .05); 5. Left Side Roof White Cement and Right-Side Roof White Metal (p = .540 > .05); 6. Left Side Roof White Metal & Right-Side Roof White Cement (p = .270 > .05); 7. Left Side Roof White Metal and Right-Side Roof White Metal (p = .402 > .05); 8. Right Side Dark Green DGS Glass and Right-Side Roof White Cement (p = .361 > .05); 9. Right-Side White Glass and Right-Side Roof White Cement (p = .910 > .05); 10. Right-Side Roof White Cement and Right-Side Roof White Metal (p = .086 > .05) at .05 level of significance. In other words, except for the ten mentioned paired samples, all the other paired samples of the B building sides and surface material types/colors showed a statistically significant difference in temperature.
An independent sample Kruskal-Wallis Test was performed to analyze if there was a statistically significant difference in temperature among the building components (example: window, floor, wall, roof, etc.) and surface materials (example: cement, marble, glass, carpet, etc.) inside B building. The test result (Table 5) shows a statistically significant difference in temperature between some of the indoor building components and surface materials (Test Statistics = 182.427, df = 13, p < .001 < .05). The roof inside, made of dark green glass, indicated the highest temperature (mean rank = 193.0). This is followed by an indoor DGS glass window on the first floor that receives direct rays from the rising sun, which registers a mean rank of 175.1. Next in rank is the indoor roof made of metal, with a mean rank of 162.8. Following the indoor metal roof is the indoor white transparent curtain hung on the window on the first floor (mean rank = 144.3). On the other hand, the indoor carpet located a bit far from the window on the first floor had the lowest temperature with a mean rank of 12.4. This is followed by the indoor cement wall at the entrance door found on the ground floor, registering a mean rank of 29.8. The inside carpet close to the window on the first floor showed the third lowest temperature with a mean rank = of 34.1, followed by indoor floor marble beside the entrance door on the ground floor (mean rank = 44.1). It is important to point out that all the thermographic images of the inside B building components and surface materials were taken between 12:03 p.m. and 12:33 p.m. on 27 March 2022.
The post-hoc test results (Table 6) of the grouping variable IBCSM for B building showed that thirteen out of the ninety-one paired samples revealed a non-significant statistical difference regarding their temperatures (i.e., 1. The interior second DGS glass entrance door, ground floor and the inside floor marble beside the entrance door ground floor (p = .315 > .05); 2. The inside second DGS glass entrance door, ground floor and the indoor wooden chairs beside the DGS glass window, first floor (p = .093 > .05); 3. The interior DGS glass entrance door, ground floor and the indoor entrance DGS glass roof, first floor (p = .101 > .05); 4. The inside DGS glass entrance door, ground floor and the indoor cement roof, first floor (p = .260 > .05); 5. The interior DGS glass entrance door, ground floor and the indoor cement wall, first floor (p = .564 > .05); 6. The interior floor marble beside the entrance door, ground floor and the indoor cement wall at the entrance door, ground floor (p = .128 > .05); 7. The indoor floor marble beside the entrance door, ground floor and the inside wooden chairs beside the DGS glass window, first floor (p = .051 > .05); 8. The interior floor marble beside the entrance door, ground floor and the indoor carpet close to the window, first floor (p = .408 > .05); 9. The indoor cement wall at the entrance door, ground floor and the indoor carpet close to the window, first floor (p = .656 > .05); 10. The indoor cement wall at the entrance door, ground floor and the indoor carpet far from the window, first floor (p = .052 > .05); 11. The indoor DGS glass roof at the entrance, first floor and the indoor cement roof, first floor (p = .413 > .05); 12. The indoor DGS glass roof at the entrance, first floor and the indoor cement wall, first floor (p = .059 > .05); 13. The indoor cement roof, first floor and the indoor cement wall, first floor (p = .183 > .05) at .05 level of significance. In other words, except for the thirteen mentioned paired samples, all the other paired samples of the B internal building components and surface material types showed a statistically significant difference in temperature.
An independent sample Kruskal-Wallis Test for the landscape features around B building (grouping variable) was conducted to examine if there was a statistically significant variation in temperature among the surface material types/colors (e.g., glass, cement, etc.) and the external landscape features (e.g., trees, artificial shades, fountain, etc.) in the vicinity of B building. The test result (Table 5) shows a statistically significant difference in temperature between some of the surface materials and the outdoor landscape features (Test Statistics = 86.011, df = 8, p < .001 < .05). The dark green DGS glass near the water pool/fountain on the left side of the B building registered the highest temperature (mean rank = 85.5). This is followed by the white DGS glass on higher floors far from the pool ring/fountain with a mean rank of 75.5, and the white DGS glass near water body pool ring with a mean rank of 60.5. Conversely, the water body inside the pool ring on the left side of the building recorded the lowest temperature with a mean rank = 5.5, followed by the white DGS glass near the artificial shade located on the right side of the building (mean rank = 18.0). Next comes the white DGS glass close to the trees (natural shade) which has a mean rank of 22.9. It is worth noting that the data (thermographic images) were taken between 11:38 a.m. and 11:46 a.m. on 27 March 2022.
The post-hoc test results (Table 6) for the ELFSM (B) grouping variable revealed that only two of the twenty-one paired samples did not show a statistically significant difference in temperature i.e., 1. The white DGS glass near the natural shade (trees) and white DGS glass near the artificial walkway shade are both located on the right side of B building (p = .061 > .05); 2. The dark green DGS glass is exposed to sunlight on the right side of B building, and the white DGS glass near the water fountain ring on the left side of the building (p = .306 > .05) at a 5% level of significance. In other words, except for the two paired samples described above, the temperatures of all the paired external landscape features and surface materials samples of the B building have a statistically significant variation in thermal conditions.
In this study, it could be noted from the results of the various thermal image analysis that almost all the indoor and outdoor landscape features, building components, and surface materials of the A and B buildings as well as the pedestrians’ spaces in the UAEU main campus have significant variations in their thermal mass. Utilizing high thermal mass materials along with night cooling is a more sustainable solution to reduce the risk of overheating for many building types, including commercial structures (Farooq et al., 2021). Thermal mass is the capability of a material to absorb, hold, and emit heat. Heat is taken in and stored by materials like tiles, bricks, and concrete. As a result, they do have a high level of thermal mass. Timber and cloth, for example, have little thermal mass because they do not absorb and store heat (Reardon et al., 2020).
Also, it is crucial to include thermal lag when evaluating thermal mass. Thermal lag refers to the rate at which a substance collects and emits heat. Materials that absorb and discharge heat slowly have long thermal lag times (such as concrete and brick), whereas materials with short thermal lag times (such as steel) absorb and release heat rapidly. Identifying materials with high thermal mass is essential because when utilized properly, high thermal mass materials can greatly improve comfort while lowering energy use in buildings. Thermal mass functions as a thermal battery, averaging out daylight variations to moderate internal temperatures. The thermal mass may absorb heat from direct sunshine in the daytime during the winter. At night, it transmits this heat back into the building (Reardon et al., 2020).
Thermal mass could be employed to keep a building cool in the summer. If the light is unable to reach the mass (for example, through shadowing), the mass will absorb heat from the interior of the house. The stored energy can then be drawn out overnight by allowing cool breezes and convection currents to flow over the thermal mass. On the other hand, poor thermal mass use can impair comfort and boost energy use. Insufficient thermal mass can absorb the body heat on a cold winter night or radiate heat all night as inhabitants try to rest during summertime. Baggs and Mortensen (2006) elucidated that in most climate zones, adding thermal mass elements to buildings can help reduce the amount of energy used for heating and cooling, as well as the environmental effects of burning fossil fuels for energy production. It can also lower costs, increase comfort, and reduce or even eliminate the need for air conditioning.
Non-normal distributions were detected for three variables of the B building (B OBSSM, B IBCSM, and B ELFSM) had non-normal distributions (Table 7). Therefore, the link between these factors, which should not be interpreted as cause-and-effect correlations, was examined using Spearman’s rank correlation (Table 8). According to the results of rank correlation analysis, the B OBSSM variable was most significantly correlated with the B ELFSM (=−.488, p .01) and least significantly correlated with the B IBCSM (= −.460, p .01). The strength of both associations was moderate with negative direction according to the coefficient of correlation (ρ). This implies that an increase in the overall temperature of the B OBSSM variable, for instance, decreases the B IBCSM variable and vice versa. Likewise, the B IBCSM variable exhibited strongest correlation with B ELFSM (ρ = .690, p < .01) and the weakest correlation with B OBSSM (ρ = -.460, p < .01). According to the coefficient of correlation (ρ), the association between B IBCSM and B ELFSM was positive and slightly strong, indicating a rise in the overall heat of the ELFSM of B building leads to a rise in the overall temperature of the B IBCSM and vice versa. On the other hand, the relationship between B IBCSM and B OBSSM was negative and moderately strong according to the coefficient of correlation (ρ). All these bivariate associations were statistically significant at .01 level of significance (p < .01), and the sample size of each variable was N = 90.
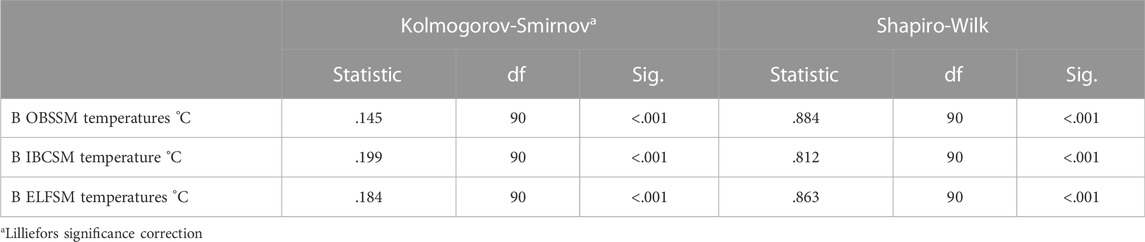
TABLE 7. Normality test of B OBSSM, B IBCSM, and B ELFSM.
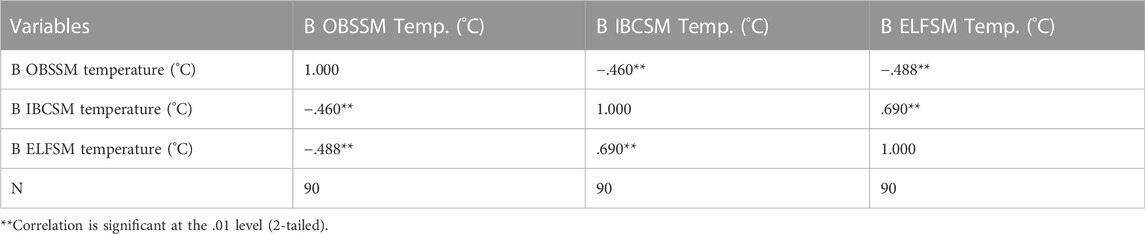
TABLE 8. Spearman’s bivariate rank correlations between the overall temperatures of B OBSSM, B IBCSM, and B ELFSM.
Among the certain threats arising due to climate change and global warming, the devasting effect of heat agglomeration has caught significant attention during the past decades. The major impact of a rise in ambient temperature has intensified the peak cooling load demand of buildings as well as caused poor personal thermal management of occupants during outdoor activities. Therefore, assessing the thermal environment of buildings and outdoor structures is essential to provide sustainable solutions to overcome these challenges by incorporating advanced building materials and innovative structural designs. However, numerical estimation is restricted in showcasing and predicting accurate temperature variations over time due to abrupt changes in weather conditions, occupancy rate, diversity in building materials, and variation in buildings orientation structures. Therefore, employing thermal infrared imaging cameras and UAVs are proven to be reliable, cost-effective, and efficient methods of visualizing real-time situations under varying conditions of heat stress.
This study explores the application of thermal imagery-based cameras on UAVs for mapping urban structures, and the flight missions were conducted throughout the weekend of 26 and 27 March 2022, at the UAEU main campus to explore the potential of using UAVs for thermal photogrammetric mapping in order to help track and categorize heat rates in buildings according to their orientation and material composition (such as glass, cement, sand, etc.). Additionally, the spatial distribution of thermal comfort is assessed and analyzed based on the structural configurations of selected pedestrian areas and parking lots, such as shaded, unshaded, and areas near plants or trees. The analysis results for thermal conditions of shaded/unshaded surface types for pedestrian space revealed that the natural shaded grass surface tends to have the most tolerable heat environment (mean rank = 7.6). In contrast, the unshaded sand surface has the most unfriendly thermal environment (mean rank = 52.0), with a difference in mean surface temperature of 18.0°C. This finding corroborates with the study by Zhao et al. (2020), who found that between shaded and unshaded portions of the mean radiant temperatures (MRT), there was a temperature differential of more than 3.0°C. The MRT readings were lower at the measuring sites close to vegetation.
The analysis results of outdoor building components and surface materials have shown that the exposed cement roof component registered the highest level of heat (mean rank = 80.6), while the shaded cement outside recorded the lowest thermal condition (mean rank = 8.0), with a mean surface temperature variation of 31°C. In addition, the statistical findings of the B outdoor building sides and surface materials showed that the outdoor left side (exposed to direct rays from the rising sun) made of dark green DGS glass surface material has the highest amount of heat (mean rank = 95.6), while the outer right side made of white DGS glass surface material (located near the trees) recorded the lowest temperature (Mean rank = 14.1), having a mean surface temperature difference of 26°C. Likewise, results from the analysis of the B indoor building components and surface materials showed that the roof inside, made of dark green DGS glass, has the highest temperature (mean rank = 193.0), while the indoor carpet located a bit far from the window on the first floor had the lowest temperature with a mean rank of 12.36. The mean surface temperature difference between the roof inside and the carpet is 22.0°C.
These findings are consistent with the views of Massetti et al. (2019) and Djekic et al. (2018). According to Massetti et al. (2019), on summer days, thermal distress was most noticeable over exposed asphalt, and because gravel has a higher reflectivity, thermal discomfort was even more apparent compared to exposed gravel. Shaded surfaces, however, exhibited significant reductions in thermal stress. Over the course of the fall season, incoming solar radiation declines, yet direct radiation under the steadily thinning forest canopy rises. The difference in asphalt surface temperature between exposed and shaded areas decreases substantially from roughly 20.0°C–3.0°C because of this lessened shading effect. Djekic et al. (2018) observed that surfaces exposed to sunlight and shaded surfaces exhibit the largest temperature variations, which vary from 2.0°C to 20.0°C. The users’ thermal comfort is impacted by temperature differences (8.0°C) between the hottest and coolest materials (rough black granite and smooth red granite), the hottest material and grass (22.0°C), and shaded and unshaded places (20.0°C). Additionally, surfaces exposed to sunlight during the day maintained a greater temperature than surfaces that were shaded or partially shaded during the day, even after overnight cooling down.
For the B external landscape features and surface materials, the results revealed that the dark green DGS glass near the water pool/fountain on the left side of the B building tends to have the most unfriendly external heat environment (mean rank = 85.5). Conversely, the water body inside the pool ring on the left side of the building tends to have the friendliest thermal environment, with a mean rank = 5.5. The difference in mean surface temperature of dark green DGS glass and the water body inside the pool ring was 30.0°C. This result further elucidates that the thermal comfort of practically every indoor and outdoor landscape feature, structural component, and surface material in the A and B buildings, as well as the pedestrian spaces, varies significantly. There were substantial positive and negative correlations among the overall temperature variables of B OBSSM, B IBCSM, and B ELFSM, according to Spearman’s rank correlations.
The findings above indicate that the presence and type of shade (e.g., natural shaded grass surface vs. unshaded sand surface), the type and color of building surface material (e.g., dark green DGS glass surface material vs. white DGS glass surface material), and building design and orientation (e.g., left direction vs. right direction) have a significant impact on the thermal environment of buildings, and pedestrians’ space in the context of UAEU campus during the Spring season. It also indicates that the comfort and thermal environment of outdoor pedestrians, building components, and surface materials are improved by shade, vegetation, and the structural design and position of a building (Lin and Matzarakis, 2008; Yin et al., 2022; Kang et al., 2020). However, it is crucial to keep in mind that the placement and orientation of buildings, the patterns and types of vegetation (such as grass, shrubs, and trees), variation in solar irradiance, and ambient conditions altogether affect the thermal comfort of occupants as well as the load profile of buildings.
In line with SDG 11 goal of providing sustainable, safe, and resilient human settlement and urban development, this study explores the application of thermal imagery-based cameras on UAVs for thermal photogrammetric mapping, assisting in the monitoring and classifying of heat rates based on orientation and building components, such as glass, cement, sand, etc. Furthermore, the spatial distribution of surface temperatures is evaluated and analyzed for selected pedestrian spaces and parking lots based on their structural configurations, such as shaded, unshaded, and areas near plants or trees.
The analysis results for thermal conditions of shaded/unshaded surface types for pedestrian space revealed that the natural shaded grass surface has the most tolerable heat environment (mean rank = 7.6), while the unshaded sand surface has the most unfriendly thermal environment (mean rank = 52.0), with an 18°C difference in mean surface temperature. Furthermore, outdoor building components and surface materials revealed that the exposed cement roof component registered the highest level of heat (mean rank = 80.6), whereas the shaded cement outside recorded the lowest thermal condition (mean rank = 8.0), with a mean surface temperature variation of 31.0°C. Meanwhile, indoor building components and surface materials revealed that the dark green DGS glass roof had the highest temperature (mean rank = 193.0). In contrast, the indoor carpet placed a bit further from the window on the first level floor had the lowest temperature with a mean rank of 12.36. The mean surface temperature difference between the roof inside and the carpet is 22.0°C. The external landscape elements and surface materials are investigated, and the results indicate that the dark green DGS glass near the water pool/fountain has the most unfavorable heat environment (mean rank = 85.5). On the other hand, the water body within the pool ring on the left side of the building has the most tolerable thermal environment, with a mean rank = 5.5.
The findings demonstrate that the building load profile and pedestrian comfort are influenced by several factors, including local atmospheric conditions, building material and orientation, shading and the presence of trees in the targeted area. Literature suggests several heat mitigation strategies, such as opting for optimized orientation with minimal south facing and excellent ventilation, planting vegetation, such as planting trees, green roofs, and walls: due to their capability of heat mitigation by enabling solar reflectivity, evapotranspiration, and blocking solar irradiance. Furthermore, high albedo materials, such as reflective/radiative coatings and paints for glass windows, walls and roofs, as well as pedestrian pathways, are potential candidates for improving outdoor thermal comfort and reducing the peak load profile of buildings by simultaneously minimizing solar radiation absorption and maximizing emitted radiation. To decrease urban heat agglomeration, it is necessary to examine the effect of trees on wind speed and direction and to develop innovative materials with nearly 100% solar reflectivity and maximum emissivity. However, one of the potential challenges of employing reflective/radiative paints on walls and rooftops is that they might cause discomfort by increasing the heat load during summer. Therefore, self-adaptive heating/cooling materials should be introduced to overcome such limitations. Furthermore, since the meteorological data has a significant role in the desired level of personal comfort, future research experiments should be conducted across diverse climates to find a correlation between heat mitigation strategies and climatic conditions.
The raw data supporting the conclusion of this article will be made available by the authors, without undue reservation.
KA has contributed on the formation of the study proposal and research supervision, drone flying plan and experiment, manuscript writing, imagery analysis, statistical data analysis and interpretation, and publication submission. SS has helped with manuscript writing, statistical data analysis and interpretation. AR helped with 3D model creation, camera calibration and drone flying plan.
The study is funded by the Research and Sponsored Projects Office at United Arab Emirates University (Grant Code #G00003775).
Authors would like to acknowledge the support received by United Arab Emirates University in conducting this study, as well as all participating research assistant students. The authors are grateful for FEDS, MOD, and GCAA for facilitating this study drone experiment.
The authors declare that the research was conducted in the absence of any commercial or financial relationships that could be construed as a potential conflict of interest.
The handling editor MS declared a shared affiliation with the author KA, SS, ER at the time of review.
All claims expressed in this article are solely those of the authors and do not necessarily represent those of their affiliated organizations, or those of the publisher, the editors and the reviewers. Any product that may be evaluated in this article, or claim that may be made by its manufacturer, is not guaranteed or endorsed by the publisher.
The Supplementary Material for this article can be found online at: https://www.frontiersin.org/articles/10.3389/fbuil.2022.1035546/full#supplementary-material
1B outdoor building sides and surface materials.
2B indoor building components and surface materials.
3B external landscape features and surface materials.
Aguilar, A. J., de la Hoz-Torres, M. L., Martínez-Aires, M. D., and Ruiz, D. P. (2022). Thermal perception in naturally ventilated university buildings in Spain during the cold season. Buildings 12 (7), 890. doi:10.3390/buildings12070890
Alkaabi, K., and El Fawair, A. R. (2022). Application of A Drone camera in detecting road surface cracks: A UAE testing case study. Arab World Geogr. 24 (3), 221–239. doi:10.5555/1480-6800.24.3.221
Ascione, F., Bianco, N., De Masi, R. F., De’Rossi, F., and Vanoli, G. P. (2013). Simplified state space representation for evaluating thermal bridges in building: Modelling, application and validation of a methodology. Appl. Therm. Eng. 61 (2), 344–354. doi:10.1016/j.applthermaleng.2013.07.052
Ascione, F., Bianco, N., De Masi, R. F., Mauro, G. M., Musto, M., and Vanoli, G. P. (2014). Experimental validation of a numerical code by thin film heat flux sensors for the resolution of thermal bridges in dynamic conditions. Appl. Energy 124, 213–222. doi:10.1016/j.apenergy.2014.03.014
Baggs, D., and Mortensen, N. (2006). “Thermal mass in building design,” in The BDP environment design guide (Royal Australian Institute of Architects), 1–9. https://www.jstor.org/stable/26148285.
Corsi, C. (2010). History highlights and future trends of infrared sensors. J. Mod. Opt. 57 (18), 1663–1686. doi:10.1080/09500341003693011
Dall’O’, G., Sarto, L., and Panza, A. (2013). Infrared screening of residential buildings for energy audit purposes: Results of a field test. Energies 6 (8), 3859–3878. doi:10.3390/en6083859
Djekic, J., Djukic, A., Vukmirovic, M., Djekic, P., and Dinic Brankovic, M. (2018). Thermal comfort of pedestrian spaces and the influence of pavement materials on warming up during summer. Energy Build. 159, 474–485. doi:10.1016/j.enbuild.2017.11.004
Falorca, J. F., and Lanzinha, J. C. G. (2021). Facade inspections with drones–theoretical analysis and exploratory tests. Int. J. Build. Pathology Adapt. 39 (2), 235–258. doi:10.1108/IJBPA-07-2019-0063
Farooq, A. S., and Zhang, P. (2021). Fundamentals, materials and strategies for personal thermal management by next-generation textiles. Compos. Part A Appl. Sci. Manuf. 142, 106249. doi:10.1016/j.compositesa.2020.106249
Farooq, A. S., Zhang, P., Gao, Y., and Gulfam, R. (2021). Emerging radiative materials and prospective applications of radiative sky cooling - a review. Renew. Sustain. Energy Rev. 144, 110910. doi:10.1016/j.rser.2021.110910
Gao, Y., Song, X., Farooq, A. S., and Zhang, P. (2021). Cooling performance of porous polymer radiative coating under different environmental conditions throughout all-year. Sol. Energy 228, 474–485. doi:10.1016/j.solener.2021.09.062
Gaonkar, P., Bapat, J., and Das, D. (2018). Location-aware multi-objective optimization for energy cost management in semi-public buildings using thermal discomfort information. Sustain. Cities Soc. 40, 174–181. doi:10.1016/j.scs.2017.12.021
Han, B., Luo, Z., Liu, Y., Zhang, T., and Yang, L. (2022). Using Local Climate Zones to investigate Spatio-temporal evolution of thermal environment at the urban regional level: A case study in Xi’an, 76. China, 103495. doi:10.1016/j.scs.2021.103495Sustain. Cities Soc.
Heinrich, H., and Dahlem, K.-H. (2000). Thermography of low energy buildings. Proc. Int. Conf. Quantitative Infrared Thermogr. Qirt. doi:10.21611/qirt.2000.022
Kang, M., Kim, K. R., and Shin, J-Y. (2020). 'Event-based heat-related risk assessment model for South Korea using maximum perceived temperature, wet-bulb globe temperature, and air temperature data. Int. J. Environ. Res. Public Health 17 (8), 2631. doi:10.3390/ijerph17082631
Kirimtat, A., and Krejcar, O. (2018). A review of infrared thermography for the investigation of building envelopes: Advances and prospects. Energy Build. 176, 390–406. doi:10.1016/j.enbuild.2018.07.052
Ksiksi, T. S., and Al-Blooshi, L. S. (2019). Climate change in the UAE: Modeling air temperature using ARIMA and STI across four bio-climatic zones. F1000Res 973. doi:10.12688/f1000research.19557.1
Kumar, S., Singh, M. K., Mathur, A., Mathur, S., and Mathur, J. (2018). Thermal performance and comfort potential estimation in low-rise high thermal mass naturally ventilated office buildings in India: An experimental study. J. Build. Eng. 20, 569–584. doi:10.1016/j.jobe.2018.09.003
Leggiero, M., Andrew, B., Elliott, R., Indergaard, J., Sharma, J. B., and Vogel, T. (2021). Radiative heat loss estimation of building envelopes based on 3D thermographic models utilizing small unmanned aerial systems (sUAS). Energy Build. 244, 110957. doi:10.1016/j.enbuild.2021.110957
Li, X., Peoples, J., Yao, P., and Ruan, X. (2021). Ultrawhite BaSO4Paints and films for remarkable daytime subambient radiative cooling. ACS Appl. Mater. Interfaces 13 (18), 21733–21739. doi:10.1021/acsami.1c02368
Li, X., Stringer, L. C., and Dallimer, M. (2022). The role of blue green infrastructure in the urban thermal environment across seasons and local climate zones in East Africa, 80, 103798. doi:10.1016/j.scs.2022.103798Sustain. Cities Soc.
Lin, T. P., and Matzarakis, A. (2008). Tourism climate and thermal comfort in sun moon lake, taiwan. Int. J. Biometeorology 52, 281–290. doi:10.1007/s00484-007-0122-7
Maroy, K., Carbonez, K., Steeman, M., and Van Den Bossche, N. (2017). Assessing the thermal performance of insulating glass units with infrared thermography: Potential and limitations. Energy Build. 138, 175–192. doi:10.1016/j.enbuild.2016.10.054
Massetti, L., Petralli, M., Napoli, M., Brandani, G., Orlandini, S., and Pearlmutter, D. (2019). Effects of deciduous shade trees on surface temperature and pedestrian thermal stress during summer and autumn. Int. J. Biometeorology 63 (4), 467–479. doi:10.1007/s00484-019-01678-1
Nan, X., Yan, H., Zhu, H., Han, Q., Wu, R., and Bao, Z. (2022). Assessing the thermal environments of parking lots in relation to their shade design characteristics. Sustain. Cities Soc. 83, 103931. doi:10.1016/j.scs.2022.103931
O’Grady, M., Lechowska, A. A., and Harte, A. M. (2017a). Infrared thermography technique as an in-situ method of assessing heat loss through thermal bridging. Energy Build. 135, 20–32. doi:10.1016/j.enbuild.2016.11.039
O’Grady, M., Lechowska, A. A., and Harte, A. M. (2017b). Quantification of heat losses through building envelope thermal bridges influenced by wind velocity using the outdoor infrared thermography technique. Appl. Energy 208, 1038–1052. doi:10.1016/j.apenergy.2017.09.047
Peng, Y., and Cui, Y. (2020). Advanced textiles for personal thermal management and energy. Joule 4 (4), 724–742. doi:10.1016/j.joule.2020.02.011
Rakha, T., and Gorodetsky, A. (2018). Review of Unmanned Aerial System (UAS) applications in the built environment: Towards automated building inspection procedures using drones. Automation Constr. 93, 252–264. doi:10.1016/j.autcon.2018.05.002
Reardon, C., McGeeMilne, C. G., and Marlow, A. (2020). Thermal mass. Aust. Gov. –The Commonw. Coat Arms.
Valinejadshoubi, M., Moselhi, O., Bagchi, A., and Salem, A. (2021). Development of an IoT and BIM-based automated alert system for thermal comfort monitoring in buildings. Sustain. Cities Soc. 66, 102602. doi:10.1016/j.scs.2020.102602
Yin, Y., Zhang, D., Zhen, M., Jing, W., Luo, W., and Feng, W. (2022). Combined effects of the thermal-acoustic environment on subjective evaluations in outdoor public spaces. Sustain. Cities Soc. 77 (8), 103522. doi:10.1016/j.scs.2021.103522
Zalewski, L., Lassue, S., Rousse, D., and Boukhalfa, K. (2010). Experimental and numerical characterization of thermal bridges in prefabricated building walls. Energy Convers. Manag. 51 (12), 2869–2877. doi:10.1016/j.enconman.2010.06.026
Zhang, Y., and Li, X. (2020). Monitoring and analysis of subway tunnel thermal environment: A case study in guangzhou, China'. Sustain. Cities Soc. 55, 102057. doi:10.1016/j.scs.2020.102057
Zhao, X., Luo, Y., and He, J. (2020). Analysis of the thermal environment in pedestrian space using 3D thermal imaging. Energies 13 (14), 3674. doi:10.3390/en13143674
Zheng, H., Zhong, X., Yan, J., Zhao, L., and Wang, X. (2020). A thermal performance detection method for building envelope based on 3d model generated by UAV thermal imagery. Energies 13 (24), 6677. doi:10.3390/en13246677
IGUs Insulating glass units
TIR Thermal infrared
UAV Unmanned aerial vehicle
IRT Infrared thermography
ITT Infrared thermography technique
IOP Interior orientation parameters
DGS Double glazed spandrel
SP Spot measurement
SPSS Statistical Package for the Social Sciences
PSSST Pedestrian Spaces Shaded Surface types
A OBCSM A outdoor building components and surface materials
B OBCSM B outdoor building components and surface materials
B IBCSM B indoor building components and surface materials
B ELFSM B external landscape features and surface materials
B OBSSM B outdoor building sides and surface materials
NSGS Natural shaded grass surface
OSC Outside shaded cement
OCR Outside cement roof
ICFF Indoor carpet located a bit away from the window on the first floor
IRDGG Indoor roof made of dark green glass
LSDGG Dark green DGS glass next to the fountain or pool on the B building’s left side
LSWBIP The water body inside the pool ring on the B building’s left side
ASC Artificial Shaded Cement surface
NSC Natural Shaded Cement surface
ROC Roof Outside Cement
URGSP Unshaded Roof with Gray small pebbles
Keywords: thermal environment, urban heat island, urban agglomeration, personal thermoregulation, sustainable buildings
Citation: Alkaabi K, Senghore S and Rhman El Fawair A (2023) Toward sustainable cities: Monitoring thermal environment for buildings and pedestrian space using drone-captured 3D thermal imaging. Front. Built Environ. 8:1035546. doi: 10.3389/fbuil.2022.1035546
Received: 02 September 2022; Accepted: 13 December 2022;
Published: 17 January 2023.
Edited by:
Martin Scoppa, United Arab Emirates University, United Arab EmiratesReviewed by:
Giuseppe Riccio, University of Naples Federico II, ItalyCopyright © 2023 Alkaabi, Senghore and Rhman El Fawair. This is an open-access article distributed under the terms of the Creative Commons Attribution License (CC BY). The use, distribution or reproduction in other forums is permitted, provided the original author(s) and the copyright owner(s) are credited and that the original publication in this journal is cited, in accordance with accepted academic practice. No use, distribution or reproduction is permitted which does not comply with these terms.
*Correspondence: Khaula Alkaabi, a2hhdWxhLmFsa2FhYmlAdWFldS5hYy5hZQ==
Disclaimer: All claims expressed in this article are solely those of the authors and do not necessarily represent those of their affiliated organizations, or those of the publisher, the editors and the reviewers. Any product that may be evaluated in this article or claim that may be made by its manufacturer is not guaranteed or endorsed by the publisher.
Research integrity at Frontiers
Learn more about the work of our research integrity team to safeguard the quality of each article we publish.