 S. Prasanth
 Goutam Ghosh
- Civil Engineering Department, Motilal Nehru National Institute of Technology Allahabad, Prayagraj, Uttar Pradesh, India
In the seismic design of a reinforced concrete building, selecting appropriate response reduction factor (R) is vital for the building’s seismic response. Indian Standard (IS) 1893-2016 provides R values of 3 and 5 for ordinary moment resisting frames and special moment resisting frames, respectively. As R factors are used to incorporate the building’s non-linearity, R factor selection should be based on the building’s performance in terms of resilience. Since IS does not provide any clause on the background for selecting R factors for the design aspects, the study emphasizes the appropriate selection of R factors with respect to a building’s functionality, performance level, and resilience. In this study, a high-rise building was designed with various R factors (R = 3, 4, 5, and 6). To estimate the building’s functionality, five different recovery paths (RP-1 to RP-5), which match the real scenario, were used. The response of the building in each case was observed at two design levels, Design Basic Earthquake (DBE) level and MCE level. Variations in ductility demand, performance level, and resilience for each building case at each design level were observed. The R factor was used to obtain lateral design force at the DBE level by reducing the actual base shear placed on the structure. The reduction in the lateral design force with maximum R yielded high ductility demand and high loss of resilience. The result shows that the considered building can be designed with a maximum R of 6 since its resilience is almost 50%; hence, recovery is possible at a high cost. The performance level of the building at R = 6 lies at CP-C for the MCE design level. Considering the building’s resilience and performance level aspects, the maximum R factor was found to be 6. This helps the stakeholder and designer in the selection of R, based on the requirements of building functionality, performance level, and resilience.
1 Introduction
Generally, seismic loads imposed on buildings are significantly higher than those considered in the design. Several design codes identify a building’s non-linear response using the response reduction factor (R factor) metric. Each country’s codes suggest the R factor to reduce the elastic response of the building. R factor is defined as the “response modification coefficient” in ASCE-7 (2005), “behavior factor” in Eurocode-8 (2004), and “response reduction factor” in Indian Standard (IS) 1893-2016. Most structures use R factors to reduce seismic loads so that they will move toward the inelastic range. Hence, to dissipate energy, the structure must undergo greater deformation. Many studies have estimated R factors and their effects on the seismic performance of structures. The literature review includes studies conducted to find realistic R factors for different types of buildings.
As per IS 1893–2016 Part 1, the R factor given is significantly higher as compared to the actual scenario (Mondal et al., 2018). The corrected R value with respect to the earthquake series was found to have a lower value compared to the designed R (Abdollahzadeh and Sadeghi 2018). In a study, the effects of story height and column/beam capacity ratio on behavior factor (q) were calculated for steel special moment resisting frames, with the results showing the q factor suggested by Eurocode-8 to be underestimated for low-rise structures (Yahmi et al., 2018). A study was conducted to find the effect of pf bracing system arrangement on R factor by performing non-linear pushover analysis, with the arrangement of bracing/shear walls at alternate bays showing an increased R factor (Tamboli and Amin, 2015). The effect of soil flexibility on the R factor of a water tank was evaluated by performing non-linear static pushover analysis, with the result showing soil flexibility to affect the R factor, time period, and global performance of the structure (Patel and Amin, 2018). Nishanth et al. (2017) evaluated the actual R value using pushover analysis and considering the effects on factors such as geometrical non-linearity and story height, with the results showing that the R value suggested by the code is on the higher side. Using non-linear pushover analysis, Chaulagain et al. (2014) found the seismic response of the building, showing that load path, ductility factor, and beam column strength ratio affect the R factor. The effect of vertical links in braced frames on R factor was evaluated with consideration of seismic demand and capacity (Mohsenian and Mortezaei, 2018). Francisco Javier Pérez Jiménez and Leandro Morillas (2022) performed non-linear time history analysis for a 3-story healthcare building lying at medium seismicity and having importance factors (I factors) of 1.0, 1.2, 1.4, and 1.5. Their results showed that the building experienced less damage with higher I factors. The impact of non-uniformity, in terms of span and height, on R factor was examined, and the result showed that the R value decreases with height and is greatly affected by non-uniformity (Hussein et al., 2021). The effect of change in building boundary condition on R factor was examined (Attia and Irheem, 2018). Keykhosravi and Aghayari (2017) evaluated R factors for bare and steel-braced RC framed structures. A study was conducted to find various factors, like ductility and over strength factor, that affect a building’s behavior Kappos (1999). Patel and Shah (2010) examined the factors required to formulate the R factor for a framed RC structure. Galasso et al. (2014) examined the importance of component-wise response reduction for structural behavior for RC members. Abdi et al. (2015) emphasized that R factor determines the non-linear behavior of the building at higher ground motion level. Prasanth and Ghosh (2021b) accounted for strength degradation, in terms of stiffness, using the cracking coefficient in the analysis and observed its impact on the building’s resilience. Due to an imbalance in environmental conditions, a change occurs in the seismic design acceleration spectrum, which affects the building’s functionality. Prasanth and Ghosh (2021a) estimated resilience, across the design acceleration spectrum, for an existing high-rise concrete building. A computational platform with a hybrid model was presented to estimate damage and resilience at a wide scale without addressing recovery, which may be utilized by decision-makers for pre-disaster events (Marasco et al., 2021). Hashemi et al. (2019) evaluated the influence of four distinct ground movements on the functionality and performance of a five-story structure with limited ductility located in a low seismicity location and with a soft story mechanism. Along with the theory, a quantitative approach for assessing seismic resilience in the health care society was suggested by Cimellaro et al. (2010a). The authors emphasized that repair downtime is important for structural loss recovery because it combines social, environmental, and structural losses for a specific ground motion with hazard levels of 2%, 5%, 10%, and 20% probability of exceedance and the corresponding functionality of the hospital community system. Cimellaro et al. (2010b) devised theoretical equations to assess the direct and indirect losses caused by structural-socio deterioration. Hudson et al. (2012) highlighted the significance of robust infrastructure and principles connected with resilience-based design, as well as guidelines for including enough resilience in infrastructure design. Even during extreme weather occurrences, the resilience-based strategy has been employed (Gallagher and Cruickshank, 2015). Three solutions have been suggested for building robust or sustainable earthquake-efficient moment frames: replaceable energy-dissipating moment connections, energy-dissipating grade beams, and a hybrid rocking–stepping core (Grigorian and Kamizi, 2019). A computational platform with a hybrid model was presented to estimate damage and resilience at a wide scale without addressing recovery, which may be utilized by decision-makers for pre-disaster events (Marasco, et al., 2021). Using Monte Carlo simulation and logistic regression, Dukes, et al. (2018) constructed a bridge-specific fragility model, which serves as a design tool for strengthening the performance-based approach to improving the seismic resilience of bridges. Hashemi et al. (2019) evaluated the influence of four distinct ground movements on the functionality and performance of a five-story structure with limited ductility located in a low seismicity location with a soft story mechanism.
A higher R factor leads to additional expenses in terms of detailing, whereas a lower R leads to over-estimation of design base shear, leading to higher member cross-sections. The above studies show that much research has evaluated and used realistic R in design. The studies have been silent as to what aspects of R factors must be selected, apart from the seismicity zone for the design. This study highlights the most important consideration, namely, building resilience, in the selection of R factors. Resilience-based selection of R factors helps in proper recovery planning for post-seismic events. As many country code provisions are silent on these aspects, the study emphasizes that resilience, performance level, and ductility demand must be considered in the selection of the R factor for a particular building.
2 Description of the building and its seismicity
A G+10-story symmetrical building was considered for this study. The building had a plan area of 18 × 18 m and a total height of 44 m, with a story height of 4 m (Figure 1). The building was designed as per IS 456-2000. The dead load included the self-weight of beams, columns, slabs, and walls. The slab thickness of 150 mm and wall load on the outer periphery were considered. The wall thickness of 230 mm and floor finish of 1.5 kN/m2 were considered.
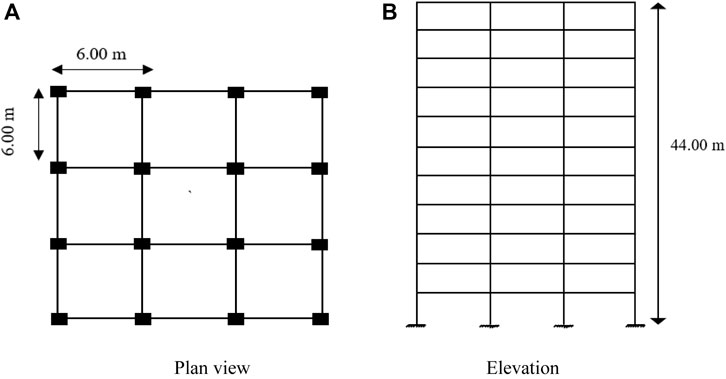
FIGURE 1. Plan and elevation view of the building. (A) Plan view. (B) Elevation.
A live load of 3 kN/m2 and roof live load of 0.75 kN/m2 were considered. The concrete grade of M25 and M30 have been considered for beams and columns, respectively. Steel reinforcement with a yield strength of 500 MPa was used in this study. According to IS 1893:2016 Part I, 5% damping with medium (type II) soil was considered. Different R factors (R = 3, 4, 5, and 6) were considered, and the importance factor (I) was taken as 1.5 with a zone factor (Z) of 0.36 g. For each case of R, the response of the building was analyzed with respect to two design levels, namely, DBE and MCE levels. The scale factors used with respect to DBE and MCE levels were 2.6487 and 5.2974, respectively.
Each building case was subjected to five different earthquake ground motions such as El Centro, Kobe, Bam, San Fernando, and Tabas. The ground-motion time history data were collected from the Pacific Earthquake Engineering Research (PEER) center ground motion database. The IS response spectrum was scaled to 1.00 g. The ground motion was made compatible with the IS response spectrum, and compatible time history (TH) data were found. The matched/compatible time history data was used in the study.
3 Concept design
The building was designed with different R factors and with consideration of the building’s performance level, ductility demand, and resilience.
3.1 Structural details of the building
The building was designed as per IS 456-2000 using SAP2000 (SAP V22, 2000). The ductile detailing was followed with confined reinforcement as per IS 13920-2016. The final cross-section and reinforcement details for each building case are shown in Tables 1–4. The stirrups for beams were calculated as per ductile requirements, and in the present study, the 150 mm spacing was provided at the mid-span location and with 100 mm spacing 2 days from the support. For column sections, the spacing of ties in the confinement zone was 100 mm, and the spacing of ties in the rest of the zones was of D/2, or 300 mm. However, the provided spacing of ties in the rest of the zones was 200 mm.

TABLE 1. Structural details of the building corresponding to case I (R = 3).

TABLE 2. Structural details of the building corresponding to case II (R = 4).

TABLE 3. Structural details of the building corresponding to case III (R = 5).
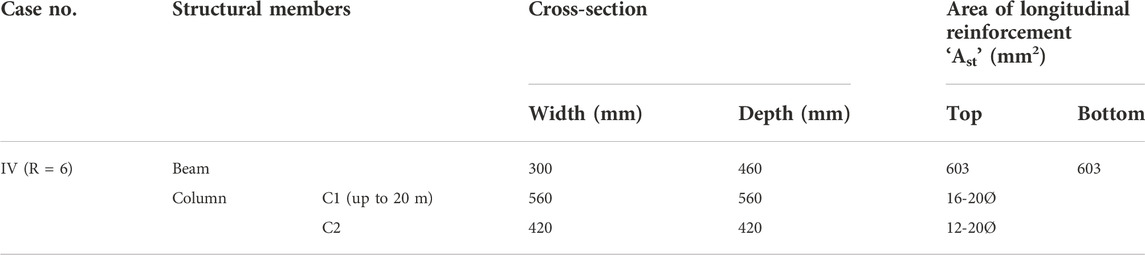
TABLE 4. Structural details of the building corresponding to case IV (R = 6).
3.2 Non-linear time history analysis (NLTHA)
The non-linear time history analysis was done using SAP2000 (SAP V22, 2000). Initially, each building case was analyzed for dead and live load cases (gravity loads), and corresponding time periods at mode 1 and 2 were noted. To perform NLTHA, the non-linearity of the building was incorporated using auto hinges. M3 hinges were used for beams, and P-M2-M3 hinges were assigned for columns (FEMA-356, 2000). With respect to the above hinges, the NLTHA was performed using the compatible-ground motions time history. Since the building was symmetrical in plan orientation, the seismic loading was subjected toward the major direction (Ux). In this study, the building was subjected to five different ground motions along Ux (longitudinal) direction. Based on the various ground motions, the maximum displacement was found at each design level with respect to each ground motion. The control node was taken as a top-roof node and the maximum displacement at that point corresponding to the Ux direction was noted. The maximum roof displacement was found for each building case (Table 5).
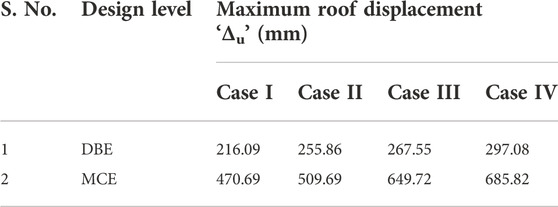
TABLE 5. Maximum roof displacement for each building case.
3.2.1 Estimation of ductility demand of the building
The most important seismic parameter is ductility demand. To find the ductility demand, the bilinearization of the capacity curve was done using the secant initial stiffness by equal area method, as per ATC-40 (ATC-40, 1996) guidelines. The yield and ultimate displacement were found from the bilinear curve for each case. The yield displacement (Δy) with respect to cases I, II, III, and IV were found to be 184.48mm, 183.34mm, 178.79mm, and 174.23 mm, respectively. The ratio of ultimate and yield displacement (Δu/Δy) gives the displacement ductility demand of the building at each design level (Table 6).
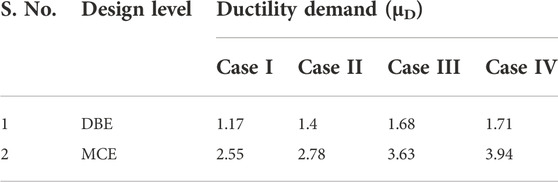
TABLE 6. Ductility demand for each building case.
As per ASCE 41-17 (ASCE/SEI 41-17, 2017), a maximum displacement ductility of less than 2 indicates low ductility demand. A value of more than 4 indicates high ductility demand. As shown in Table 6, each case of building at the DBE design level has a ductility demand ranging from 1.17 to 1.71, which is less than 2. This shows that the building experiences low ductility demand at the DBE level, which is achievable. At the MCE design level, the building has a ductility demand of almost 4 for the R = 6 case. This indicates that, the higher the R, the higher the ductility demand. At R = 6, the building has a ductility demand of 3.94, which is achievable.
3.2.2 Performance level from NLTHA
Based on the damage level of the structure, three types of performance levels exist, namely the immediate occupancy (IO) level, the life safety (LS) level, and the collapse prevention (CP) level. The performance level was found, with reference to the force–deformation curve (ref: ASCE 41-17), based on the location of performance point and hinge formation.
In static non-linear pushover analysis (FEMA-440, 2005), the demand and capacity curves intersect, and the point of intersection is known as the performance point. The location of that point over the capacity curve in acceleration displacement response spectrum (ADRS) format gives the performance level. In the case of NLTHA, the performance level is found based on hinge formation at the last step of the ground motion. The performance level was found for each building case at each design level. The performance level obtained from non-linear time history is shown in Table 7.
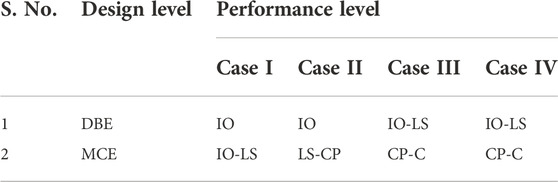
TABLE 7. Variation in performance level.
As Table 7 shows, a change in R factor affects the performance level of the building. At the DBE design level, the building at R = 3 lies at IO level, whereas it reaches the IO-LS level at R = 6. With respect to the MCE design level, the building lies at IO-LS level at the lower R factor (R = 3), whereas it lies at CP-C at higher R factor (R = 6). This shows that a higher R factor affects the building performance levels due to higher ductility demand at higher R.
4 Vulnerability assessment
Using HAZUS methodology (HAZUS, 2003), the probability of exceedance was found at each damage state, such as the slight, moderate, extreme, and collapse damage states. The damage probability was found using Eq. 1:
where Sd denotes spectral displacement, Sd,ds is the median threshold value of spectral displacement, βds is variability in terms of the standard deviation of the natural logarithm of spectral displacement, and ɸ is the cumulative normal distribution function.
From the capacity curve obtained from the pushover analysis, the yield (Sdy) and ultimate (Sdu) displacement were found by bilinearization as per ATC-40 guidelines. To find the threshold of the damage state, the equation proposed by Barbat et al. (2006) was used. Spectral displacement (Sd) was calculated from the maximum roof displacement using the below formula:
where MPF and Øk,rooftop indicate mode participation factor and modal amplitude at rooftop, respectively, for the first mode (taken as 1), whereas
The probability of exceedance was found by developing fragility curves with respect to spectral displacement (Figures 2–5). The vulnerability in terms of fragility curve was plotted against probability of exceedance on the y-axis and spectral displacement (Sd) on the x-axis. The y-axis ordinates ranged from 0 to 1, which indicated a 0–100% possibility of exceeding the specific damage level or state. Using fragility curves, the probability of the building experiencing various damages was evaluated. With respect to spectral displacement at each design level, the vertical line was plotted and intersected the fragility curves of various damage states. The point of the intersection gives the probability percentage of exceedance for that specific damage state.
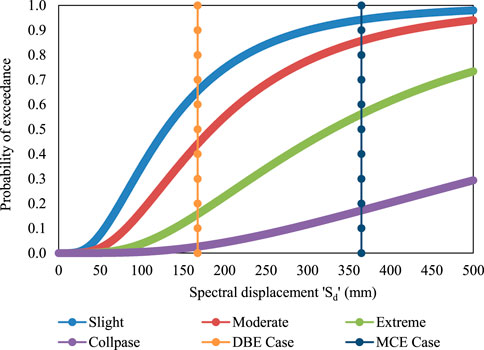
FIGURE 2. Fragility curve for case I building.
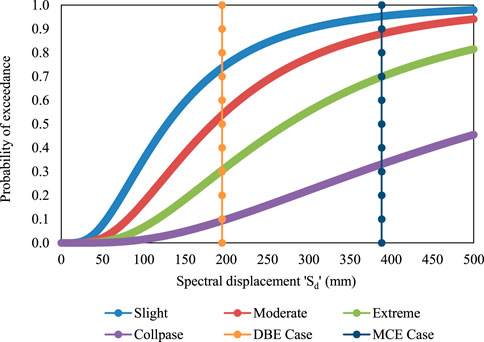
FIGURE 3. Fragility curve for case II building.
From fragility curves (Figures 2–5), the probability of exceedance at the DBE and MCE design levels at R = 5 and R = 6 showed more than a 60% certainty of experiencing moderate damage. When compared with R = 3, R = 4, and R = 5, the collapse damage probability was higher in the case of R = 6. This variation in damage probability has a direct impact on building’s direct loss ratio.
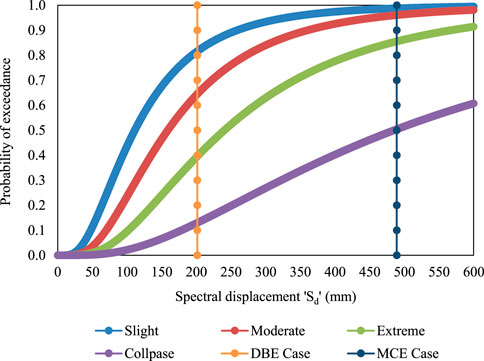
FIGURE 4. Fragility curve for case III building.
4.1 Estimation of damage loss ratio
Direct economic loss included structural and non-structural damages to the building, whereas indirect economic loss depends on factors such as relocation expense and loss of income. This study aimed to focus on direct economic losses in dealing with structural damages. The loss ratio was found using Eq. 4:
where K is the harm state of the building, PE (DS = K) is the discreet damage probability of being in the damage state at the time of the incident, and rK is the damage ratio related to each damage state taken from the HAZUS MR4 technical manual.
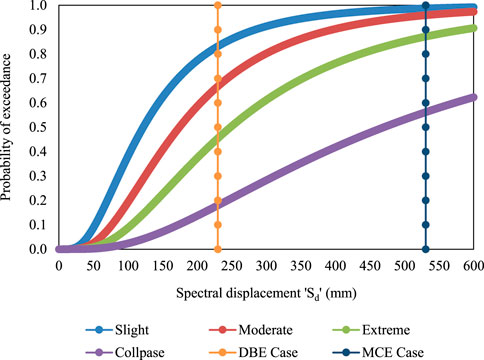
FIGURE 5. Fragility curve for case IV building.
The discrete damage probability was found using the below formulations:
• P [DS = S] = P [DS = S] - P [DS = M]
• P [DS = M] = P [DS = M] - P [DS = E]
• P [DS = E] = P [DS = E] - P [DS = C]
• P [DS = C] = P [DS = C]
S = slight, M = moderate, E = extreme, C = collapse, and DS = damage state.
The direct damage loss ratio was evaluated for each building case at each design level (Table 8). The damage loss ratio was higher for higher R factors due to high ductility demand.
5 Estimation of resilience from functionality curves
The functionality curve was found using three analytical recovery models proposed by Michel Bruneau et al. (2003). Apart from the three conventional recovery patterns—linear, exponential, and trigonometric recovery paths—two modified recovery paths were used based on practical scenarios. The functionality curve and resilience were found using Eq. 5:
where tOE is time of occurrence of a seismic event, TRE is recovery time, and H ( ) denotes heave sidestep function. In this study, tOE is assumed to be 50 days, total recovery time 65 days, and total control time period (TLC) 140 days (Ali Hadigheh et al., 2016).
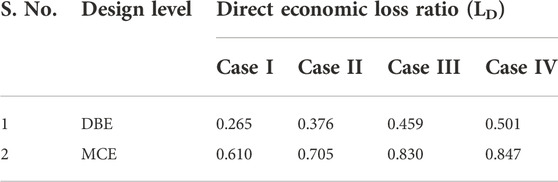
TABLE 8. Direct damage loss ratio.
The analytical equations for each recovery functions are shown below:
In real scenarios, the recovery function has its own path as per practical conditions. In Figure 6, each function follows a different recovery path. The linear functions have consistent behavior, implying that the resources are available on time. The exponential functions on the starting route have a greater functionality rate, indicating a significant influx of resources at the beginning, although this is not always practical. In cases of resource shortage, the trigonometric functions follow a lower functionality rate at the initial stage.
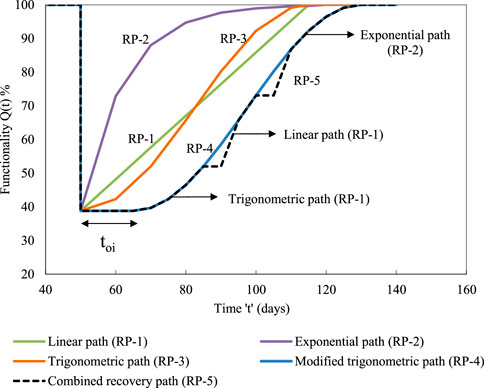
FIGURE 6. Different types of recovery paths (RP-1 to RP-5).
The new parameter toi was introduced in the functionality Eq. 5. The parameter was introduced based on the concept that in practical conditions, recovery cannot be started once the seismic event has occurred (Figure 6). In real scenarios, the recovery process takes time and requires proper damage assessment of the structure. Based on this, the functionality and recovery equation was modified as below:
The new recovery path, termed RP-5, includes linear, exponential, and trigonometric recovery patterns in its recovery profile (Figure 6). A toi of 15 days and a break of 5 days in the recovery were considered at two different functionality levels. This was based on the concept that in all scenarios the increasing recovery path was not possible, and hence a break in the recovery process was adopted. The functionality curves were developed for each design level (Figures 7–10) with respect to each recovery path.
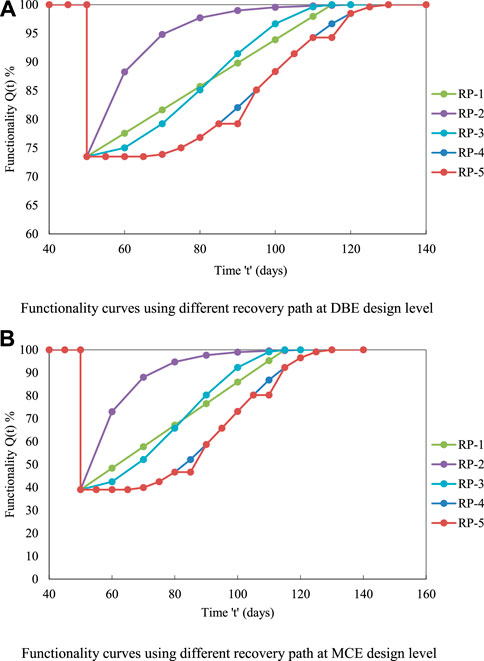
FIGURE 7. Functionality curves for case I building with respect to various recovery paths. (A) Functionality curves using different recovery paths at DBE design level. (B) Functionality curves using different recovery paths at MCE design level.
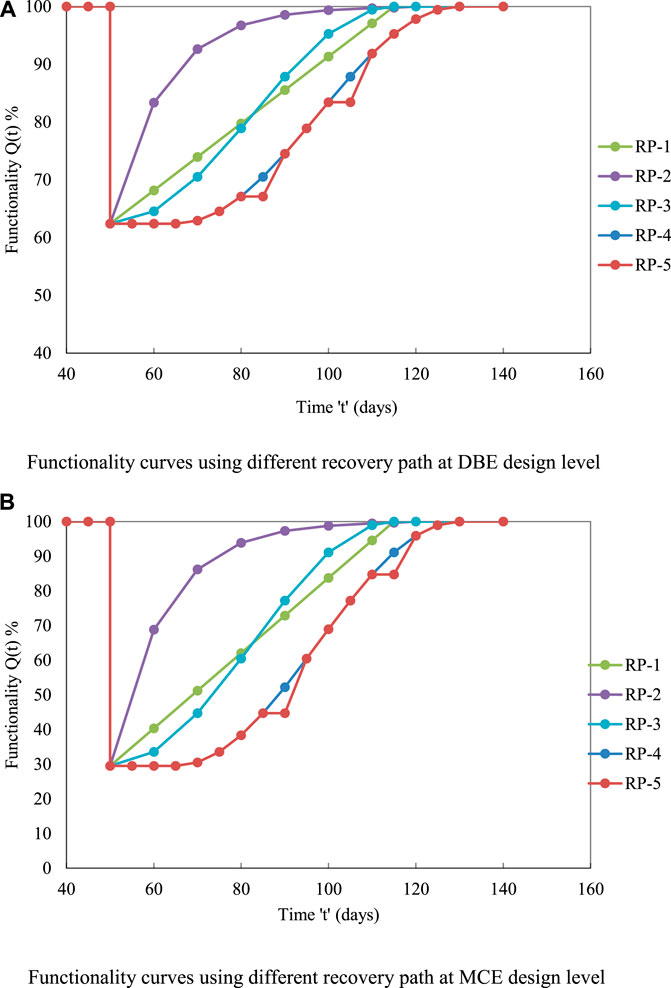
FIGURE 8. Functionality curves for case II building with respect to various recovery paths. (A) Functionality curves using different recovery paths at DBE design level. (B) Functionality curves using different recovery paths at MCE design level.
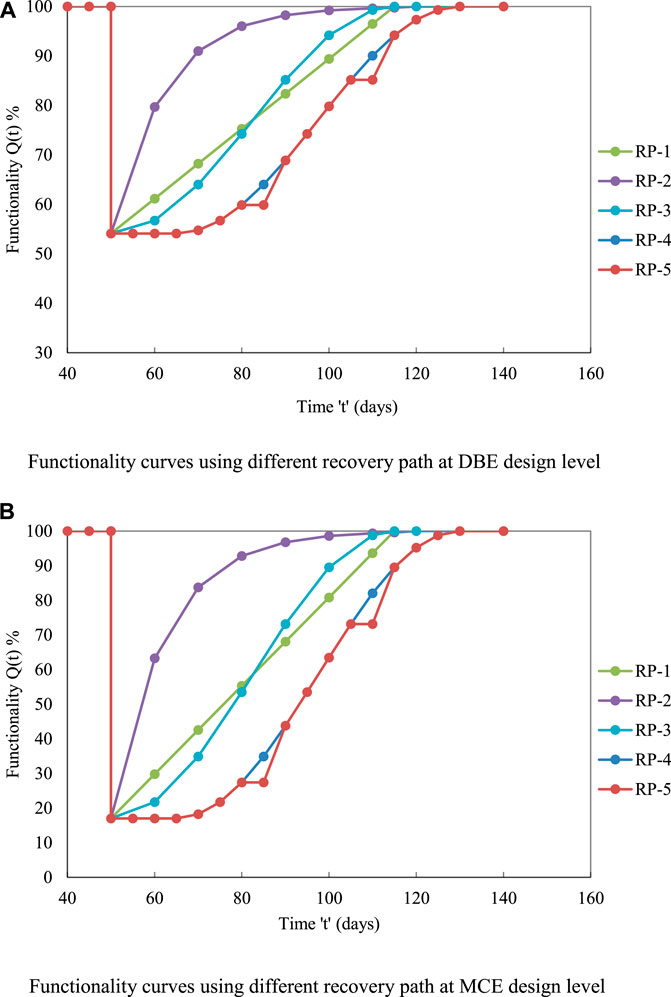
FIGURE 9. Functionality curves for case III building with respect to various recovery paths. (A) Functionality curves using different recovery paths at DBE design level. (B) Functionality curves using different recovery paths at MCE design level.
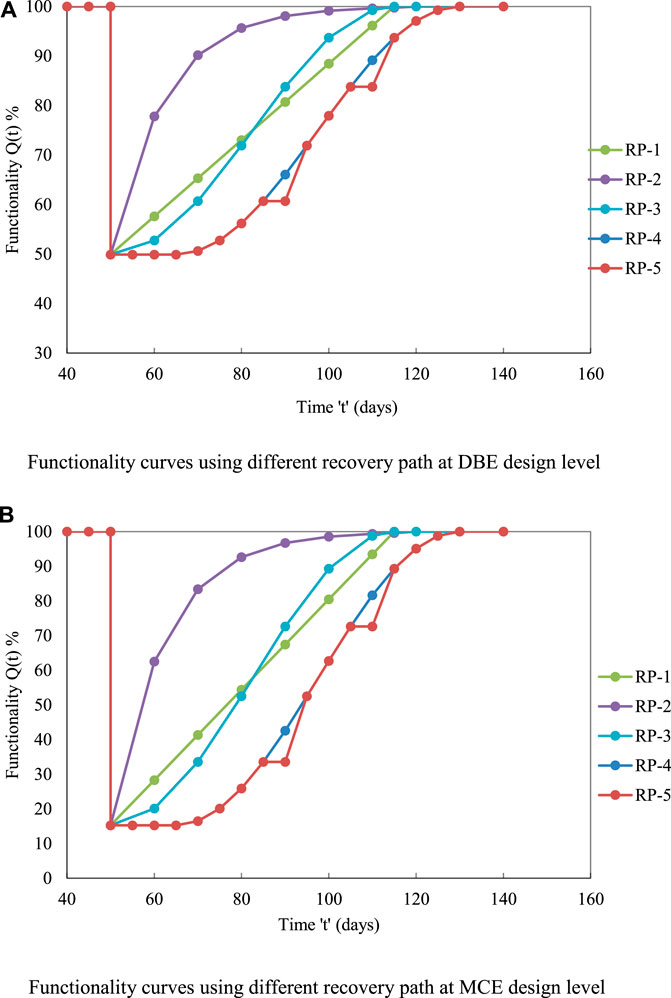
FIGURE 10. Functionality curves for case IV building with respect to various recovery paths. (A) Functionality curves using different recovery paths at DBE design level. (B) Functionality curves using different recovery paths at MCE design level.
The area under and above the functionality curves (Figures 7–10) shows the resilience of the building and the loss of resilience (LOR). The area of the curve was found using Origin software. The resilience at each design level with five recovery functions was found (Tables 9–12).
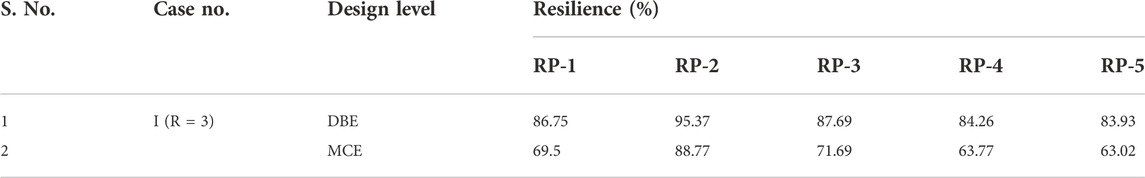
TABLE 9. Variation in resilience at each design level for case I building.
As Table 9 demonstrates, the building’s resilience at the DBE design level with respect to five recovery paths (RP-1 to RP-5) varied from 83.93% to 86.75%. At the MCE design level, a further drop in resilience was observed. The resilience at the MCE design level varied from 63.02% to 69.50%. The maximum dropdown in resilience at the MCE design level was about 24.9%, which was due to an increase in the damage loss ratio at the MCE level. Since recovery path RP-2 was not practically possible in all situations, comparisons were made between the remaining recovery paths (RP-1, RP-3, RP-4 and RP-5).
For recovery path RP-5, nearly 3–4% less resilience at the DBE level and 12–13% less resilience at the MCE level were observed when compared with the conventional recovery path (RP-1 and RP-3). This was due to an initial delay in the start of the recovery process. Though there was not much difference in resilience for the RP-4 and RP-5 recovery paths, the slight reduction in resilience was observed due to breaks in the recovery process. In community-level analysis (large scale), this break in the recovery process affects the recovery time and control time period, due to which high reduction in resilience can be observed. The maximum loss of resilience (LOR) was found to be around 16.07% and 36.98% at the DBE and MCE design levels, respectively, corresponding to RP-5.
For case II (Table 10), the building’s resilience at the DBE design level varied from 81.20% to 77.18. At the MCE design level, the further drop in the resilience was observed. Resilience at the MCE design level varied from 64.75 to 57.26%. The maximum LOR was found to be around 22.82% and 42.74% at the DBE and MCE design levels, respectively.

TABLE 10. Variation in resilience at each design level for case II building.
For case III (Table 11), the building’s resilience at the DBE design level ranged from 77.05 to 72.17%. At the MCE design level, the resilience varied from 58.51% to 49.69%. The maximum LOR was found to be around 27.83% and 50.31% for the DBE and MCE design levels, respectively.
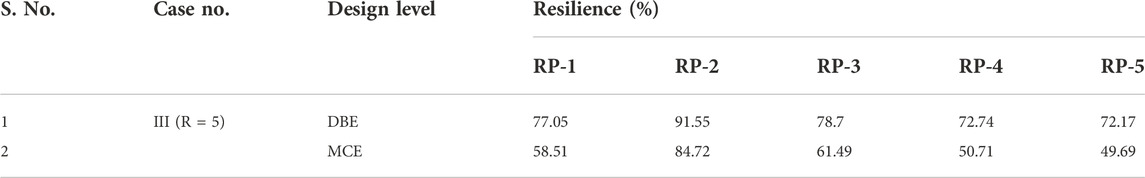
TABLE 11. Variation in resilience at each design level for case III building.
For case IV (Table 12), the building’s resilience at the DBE design level ranged from 74.95 to 69.57%. At the MCE design level, the resilience varied from 57.63% to 48.53%. The maximum LOR was found to be around 30.43% and 51.47% at the DBE and MCE design levels, respectively.

TABLE 12. Variation in resilience at each design level for case IV building.
It was observed that, at both design levels, the building corresponded to case IV (R = 6) and showed lower resilience compared with other building cases. This was due to the high ductility demand at R = 6 (case IV building).
6 Conclusion
The study was conducted to emphasize the selection of R factors for seismic design, based on a building’s performance and resiliency. A high-rise symmetrical building was subjected to various ground motions, and its seismic performance was assessed at two design levels, the DBE and MCE levels. Variations in ductility demand and performance were observed for each building case, corresponding to the DBE and MCE levels. Some of the major observations were as follows:
• At the DBE design level, all building cases experienced low ductility demand. At the MCE design level, the building corresponded to R = 5 and R = 6, almost reaching high ductility demand. This shows that the increase in R factors leads to higher ductility demand. The building cases which experienced lesser, moderate-to-high ductility demand, were comparatively easier and more economical to achieve. This helps in the proper selection of R factors in design.
• As the R factor increased, significant changes in performance level were observed. At the DBE design level, the performance level increased from IO level (at R = 3 and R = 4) to IO-LS level (at R = 5 and R = 6). At the MCE design level, the building experienced a significant variation in performance level (IO-LS level to CP-C level) from R = 3 to R = 6. This result shows that the building can be designed for a maximum R factor of 6 without collapse by maintaining its structural integrity even at the MCE design level. This shows that, with respect to ductility demand and performance, the building can be designed at a maximum of R = 6 to ensure adequate design.
• The functionality of the building during the post-seismic event was gradually reduced with increasing R factors. The maximum dropdown in functionality was observed at R = 6 (from 100% to 15.25%) at both the DBE and MCE design levels. This shows that proper R factors are to be selected to ensure less functionality loss for possible recovery.
• Variation in resilience was observed between the five recovery paths (RP-1 to RP-5). The new recovery paths RP-4 and RP-5 gave lesser resilience when compared with other conventional recovery paths. This was due to an initial delay in the recovery process at RP-4 and a break in the recovery process at RP-5, leading to a higher loss of resilience.
• Though the building at R = 5 and R = 6 suffered significant functionality loss at MCE, it held almost 50% resiliency. This was due to maintaining adequate ductility demand at R = 6. A higher loss of resilience of about 51.47% was estimated for R = 6 building cases, which may demand additional retrofitting costs because of higher damage. This result shows that, despite other seismic performances, the building’s resilience must considered in planning the post-seismic recovery process.
• This result shows that the selection of R factor should be based on the building’s resilience, in addition to its performance level and ductility demand. The building, which is located at a high seismicity zone (zone V), shows a significant change in seismic behavior for different R factors. Based on seismicity conditions, the R factor can be selected considering resilience.
The study is limited to direct damage losses (structural damage), and non-structural damage losses were not considered since these must be assessed with a vigorous survey and depend on the location of the building. In addition, this study is limited to a symmetrical building case. Since the recovery time and control time period are purely based on the availability of resources (time and functional importance of the building), the literature review shows that the building has a recovery time of 65 days and a total control time period of 140 days. This will not be the same in all the cases, and hence a large-scale survey must be done.
Data availability statement
The original contributions presented in the study are included in the article/Supplementary Material; further inquiries can be directed to the corresponding author.
Author contributions
All authors listed have made a substantial, direct, and intellectual contribution to the work and approved it for publication.
Conflict of interest
The authors declare that the research was conducted in the absence of any commercial or financial relationships that could be construed as a potential conflict of interest.
Publisher’s note
All claims expressed in this article are solely those of the authors and do not necessarily represent those of their affiliated organizations, or those of the publisher, the editors and the reviewers. Any product that may be evaluated in this article, or claim that may be made by its manufacturer, is not guaranteed or endorsed by the publisher.
Supplementary material
The Supplementary Material for this article can be found online at: https://www.frontiersin.org/articles/10.3389/fbuil.2022.1029209/full#supplementary-material
References
Abdi, H., Hejazi, F., Saifulnaz, R., Karim, I. A., and Jaafar, M. S. (2015). Response modification factor for steel structure equipped with viscous damper device. Int. J. Steel Struct. 15, 605–622. doi:10.1007/s13296-015-9008-4
Abdollahzadeh, G., and Sadeghi, A. (2018). Earthquake recurrence effect on the response reduction factor of steel moment frame. Asian J. Civ. Eng. 19, 993–1008. doi:10.1007/s42107-018-0079-3
Ali Hadigheh, S., Saeed Mahini, S., Setunge, S., and Mahin, S. A. (2016). A preliminary case study of resilience and performance of rehabilitated buildings subjected to earthquakes. Earthquakes Struct. 11 (6), 967–982.
ASCE/SEI 41-17 (2017). Seismic evaluation and retrofit of existing buildings. Virginia: American Society of Civil Engineers.
ATC-40 (1996). Seismic evaluation and retrofit of reinforced concrete buildings. California: Applied Technology Council.
Attia, W. A., and Irheem, M. M. M. (2018). Boundary condition effect on response modification factor of X-braced steel frames. HBRC J. 14 (1), 104–121. doi:10.1016/j.hbrcj.2016.03.002
Chaulagain, H., Rodrigues, H., Spacone, E., Guragain, R., Mallik, R., and Varum, H. (2014). Response reduction factor of irregular RC buildings in Kathmandu valley. Earthq. Eng. Eng. Vib. 13, 455–470. doi:10.1007/s11803-014-0255-8
Cimellaro, G. P., Andrei Reinhorn, M., and Michel, B. (2010a). Framework for analytical quantification of disaster resilience. Eng. Struct. 32, 3639–3649. doi:10.1016/j.engstruct.2010.08.008
Cimellaro, G. P., Andrei Reinhorn, M., and Michel, B. (2010b). Seismic resilience of a hospital system. Struct. Infrastructure Eng. 6 (1-2), 127–144. doi:10.1080/15732470802663847
Dukes, J., Mangalathu, H., Jamie, E. P., and DesRoches, R. (2018). Development of a bridge-specific fragility methodology to improve the seismic resilience of bridges. Earthquakes Struct. 15 (3), 253–261.
FEMA-440 (2005). Improvement of nonlinear static seismic analysis procedures. California: Federal Emergency Management Agency.
FEMA-356 prestandard (2000). Prestandard and commentary for seismic rehabilitation of buildings. Virginia.
Galasso, C., Maddaloni, G., and Cosenza, E. (2014). Uncertainly analysis of flexural over strength for capacity design of RC beams. J. Struct. Eng. (N. Y. N. Y). 140 (7). doi:10.1061/(ASCE)ST.1943-541X.0001024
Gallagher, D., and Cruickshank, H. (2015). Planning under new extremes: Resilience and the most vulnerable. Proc. Institution Civ. Eng. - Munic. Eng. 169 (3), 127–137. doi:10.1680/muen.15.00003
Grigorian, M., and Kamizi, M. (2021). High-performance resilient earthquake-resisting moment frames. Proc. Institution Civ. Eng. – Struct. Build. 175 (5), 401–417. doi:10.1680/jstbu.19.00109
Hashemi, M. J., Al-Attraqchi, A. Y., Kalfat, R., and Al-Mahaidi, R. (2019). Linking seismic resilience into sustainability assessment of limited-ductility R.C. buildings. Eng. Struct. 188, 121–136. doi:10.1016/j.engstruct.2019.03.021
HAZUS (2003). MR4 technical manual. Multihazard loss estimation methodology. Washington DC, USA: Department of homeland society.
Hudson, S., Cormie, D., Tufton, E., and Inglis, S. (2012). Engineering resilient infrastructure. Proc. Institution Civ. Eng. - Civ. Eng. 165 (6), 5–12. doi:10.1680/cien.11.00065
Hussein, M. M., Gamal, M., and Attia, W. A. (2021). Seismic response modification factor for RC-frames with non-uniform dimensions. Cogent Eng. 8 (1), 1923363. doi:10.1080/23311916.2021.1923363
IS:1893. Part-1 (2016). Indian standard criteria for earthquake resistance design of structures. New Delhi: Bureau of Indian Standards.
Kappos, A. J. (1999). Evaluation of behavior factors on the basis of ductility and overstrength studies. Eng. Struct. 21 (9), 823–835. doi:10.1016/s0141-0296(98)00050-9
Keykhosravi, A., and Aghayari, R. (2017). Evaluating response modification factor (R) of reinforced concrete frames with chevron brace equipped with steel slit damper. KSCE J. Civ. Eng. 21, 1417–1423. doi:10.1007/s12205-016-1055-7
Marasco, S., Cardoni, A., Zamani Noori, A., Kammouh, O., Domaneschi, M., and Cimellaro, G. P. (2021). Integrated platform to assess seismic resilience at the community level. Sustain. Cities Soc. 64, 102506. doi:10.1016/j.scs.2020.102506
Mohsenian, V., and Mortezaei, A. (2018). Evaluation of seismic reliability and multilevel response reduction factor (R factor) for eccentric braced frames with vertical links. Earthquakes Struct. 14 (6), 537–549. doi:10.12989/EAS.2018.14.6.537
Mondal, A., Ghosh, S., and Reddy, G. R. (2018). Performance-based evaluation of the response reduction factor for ductile RC frames. Eng. Struct. 56, 1808–1819. doi:10.1016/j.engstruct.2013.07.038
Nishanth, M., Visuvasam, J., Simon, J., and Packiaraj, J. S. (2017). Assessment of seismic response reduction factor for moment resisting RC frames. IOP Conf. Ser. Mat. Sci. Eng. 263 (3), 032034. doi:10.1088/1757-899X/263/3/032034
Patel, B., and Shah, D. (2010). “Formulation of response reduction factor for RCC framed staging of elevated water tank using static pushover analysis,” in Proceedings of the world congress on engineering (London: U.K).
Patel, K. N., and Amin, J. A. (2018). Performance-based assessment of response reduction factor of RC-elevated water tank considering soil flexibility: A case study. Int. J. Adv. Struct. Eng. 10, 233–247. doi:10.1007/s40091-018-0194-0
Prasanth, S., and Ghosh, G. (2021b). Effect of cracked section properties on the resilience based seismic performance evaluation of a building. Structures 34, 1021–1033. doi:10.1016/j.istruc.2021.08.035
Prasanth, S., and Ghosh, G. (2021a). Effect of variation in design acceleration spectrum on the seismic resilience of a building. Asian J. Civ. Eng. 22, 331–339. doi:10.1007/s42107-020-00316-1
SAP V22 (2000). Integrated software for structural analysis and design. Berkley, CA, USA: Computers and Structures. Inc.
Tamboli, K., and Amin, J. A. (2015). Evaluation of response reduction factor and factor of RC braced frame. J. Mater. Eng. Struct. 2, 120–129.
Keywords: response reduction factor, functionality, performance level, resilience, ductility demand
Citation: Prasanth S and Ghosh G (2022) Role of resilience in selection of R factors for an RC building. Front. Built Environ. 8:1029209. doi: 10.3389/fbuil.2022.1029209
Received: 26 August 2022; Accepted: 17 October 2022;
Published: 22 November 2022.
Edited by:
Fadzli Mohamed Nazri, Universiti Sains Malaysia (USM), MalaysiaReviewed by:
Alessandra Aprile, University of Ferrara, ItalyRijalul Fikri, Syiah Kuala University, Indonesia
Copyright © 2022 Prasanth and Ghosh. This is an open-access article distributed under the terms of the Creative Commons Attribution License (CC BY). The use, distribution or reproduction in other forums is permitted, provided the original author(s) and the copyright owner(s) are credited and that the original publication in this journal is cited, in accordance with accepted academic practice. No use, distribution or reproduction is permitted which does not comply with these terms.
*Correspondence: S. Prasanth, UHJhc2FudGhAbW5uaXQuYWMuaW4=
†These authors have contributed equally to this work and share first authorship