
94% of researchers rate our articles as excellent or good
Learn more about the work of our research integrity team to safeguard the quality of each article we publish.
Find out more
ORIGINAL RESEARCH article
Front. Built Environ., 17 January 2022
Sec. Construction Management
Volume 7 - 2021 | https://doi.org/10.3389/fbuil.2021.813399
This article is part of the Research TopicManagerial Responses against COVID-19View all 7 articles
 Maosu Li1†
 Yi Peng2†
 Yijie Wu3†
 Jinying Xu3†Tan Tan4†Hui Guo3†Weisheng Lu3†Anthony G. O. Yeh1†
 Fan Xue3*†
The built environment closely relates to the development of COVID-19 and post-disaster recovery. Nevertheless, few studies examine its impacts on the recovery stage and corresponding urban development strategies. This study examines the built environment’s role in Wuhan’s recovery at the city block level through a natural experiment. We first aggregated eight built environmental characteristics (BECs) of 192 city blocks from the perspectives of density, infrastructure supply, and socioeconomic environment; then, the BECs were associated with the recovery rates at the same city blocks, based on the public “COVID-19-free” reports of about 7,100 communities over the recovery stages. The results showed that three BECs, i.e., “number of nearby designated hospitals,” “green ratio,” and “housing price” had significant associations with Wuhan’s recovery when the strict control measures were implemented. At the first time of reporting, more significant associations were also found with “average building age,” “neighborhood facility development level,” and “facility management level.” In contrast, no associations were found for “controlled residential land-use intensity” and “plot ratio” throughout the stages. The findings from Wuhan’s recovery pinpointing evidence with implications in future smart and resilient urban development are as follows: the accessibility of hospitals should be comprehensive in general; and the average housing price of a city block can reflect its post-disaster recoverability compared to that of the other blocks.
• Natural experiment for testing correlations between the built environment and Wuhan’s recovery from COVID-19.
• Designated hospitals, neighborhood facility level, green ratio, housing price, building age, and facility management level were associated with the early recovery (p < 0.01).
• Only designated hospitals, green ratio, and housing price were still associated with the recovery in later stages (p < 0.05).
• No association found for controlled residential land-use intensity and plot ratio throughout the whole stage.
• New evidence and implications for smarter and resilient urban development.
Coronavirus disease 2019 (COVID-19) is one of the deadliest pandemics in human history (Sohrabi et al., 2020). Understanding its mechanism from biological, ecological, and social perspectives is thus important, especially to avoid its wide spread and infection and further facilitates urban recovery. Since the transmission is a spatial-related process, substantial geographical research has been made to monitor, analyze, contain, and recover from the unprecedented pandemic (Desjardins et al., 2020; Franch-Pardo et al., 2020).
The built environment is the collection of human-made surroundings for human activity, ranging in scale from buildings to neighborhoods and cities. Its direct physical settings and indirect human behavior intervention have led to its significant influence on infectious disease dynamics, especially in certain infections transmitted by contact, aerosols, or droplets (Pinter-Wollman et al., 2018). Typical built environmental characteristics (BECs) include population and land-use density (Yu and Wen 2016; Ahmadian et al., 2019), infrastructure supply (Loo and Lam 2012; Chen et al., 2019), and social-economic environment (Aldrich 2012; Qu et al., 2018), the role of which has been proved critical for the known infectious diseases such as cholera (Pinter-Wollman et al., 2018), H1N1 (Lowcock et al., 2012; Ponnambalam et al., 2012), and SARS (Fang et al., 2009). Similarly, the relationship between these BECs and the COVID-19 pandemic needs to be re-identified to inspire urban recovery and future resilient urban development.
Numerous studies nowadays have been conducted on different spatial scales to unfold the impacts of BECs on the COVID-19 development (Frank et al., 2019). For instance, there existed a positive correlation between the county-level population density and the confirmed COVID-19 cases in Hubei Province, China, (Xiong et al., 2020) and US (Klompmaker et al., 2021; Sy et al., 2021). District-level land-use and population density as well as infrastructure settings including green space ratio and hospital density were significantly correlated with the morbidity rate in Wuhan of Hubei (You et al., 2020). At the block and community level, commercial vitality and infrastructure supply were found to have a significant correlation with the number of confirmed cases in Wuhan (Li et al., 2020) and Huangzhou of Hubei (Li et al., 2021) as well as Hong Kong (Kan et al., 2021).
Nevertheless, the role of the BECs in the COVID-19 recovery may be different from that in urban development. For instance, it is found that although the high land-use density may increase the concentration of people and facilitate disease transmission, their superior health and educational systems are also more prepared to handle pandemics, leading to higher rates of recovery and lower rates of mortality (Dye 2008; Hamidi et al., 2020). In contrast, inadequate healthcare management would decrease the rate of recovery among COVID-19 patients (Hopman et al., 2020). Although some cities have experienced recoveries from the pandemic, most cities are still struggling with handling COVID-19. Thus, the impacts of BECs on COVID-19 recovery from different spatial scales are scarce for exploration. Compared to the large-scale analysis, block-level BECs and the COVID-19 recovery can present more fine-scale insights into a precious non-pharmaceutical intervention and inspire the future resilient urban development (Li et al., 2021). However, its comprehensive understanding is desired but overlooked.
Wuhan is a megacity with over 11 million inhabitants living in about 7,100 residential communities. As the first lockdown and recovered city, the city was locked down on 23 January 2020 and resumed in early April 2020. Strong interventions such as closed community management were implemented to restrict the inner-city transmission. The non-commutable urban environment enables a natural experiment test bed to explore the role of BECs in the COVID-19 recovery (Thomson 2020). This study attempts to investigate the associations between the BECs and their recovery from COVID-19 in the block level through geospatial statistical analysis. Two questions are examined: 1) What is the initial recovery distribution of Wuhan city blocks with different built environments? 2) Under strong interventions such as the intracity mobility restriction and community-based lockdown, what is the role of the built environment in the later urban recovery?
This study mainly focuses on the 192 city blocks in the central urban area of Wuhan. They were from the eight districts, including Caidian, Hanyang, Hongshan, Jiang’an, Jianghan, Qiaokou, Qingshan, and Wuchang as shown in Figure 1. The city block delineated by the Wuhan Natural Resources and Planning Bureau is the study unit in this research (WNRPB 2015). A city block is a group of communities with the same controlled residential land-use intensity.
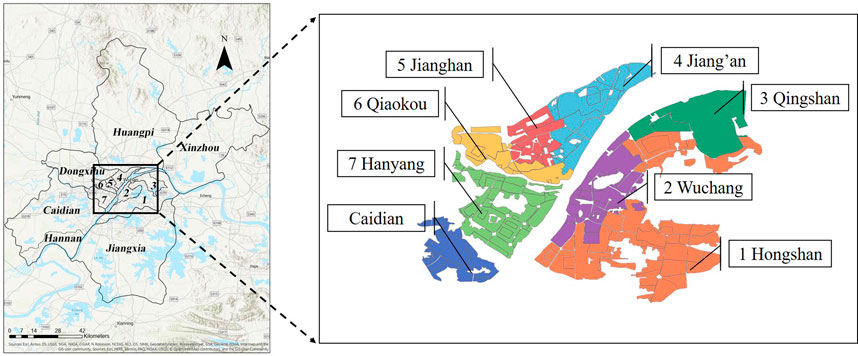
FIGURE 1. Location of 192 city blocks of eight districts in Wuhan, China.
Figure 2 shows the flowchart of the GIS-based data aggregation and statistical analysis methods. First, eight typical BECs and COVID-19-free rate (CFR) are defined in Section 2.3. Four kinds of datasets from different sources were collected and cleansed using GIS spatial measurement, as described in Section 2.4. Spearman’s rank correlation analysis between BECs and CFR is explained in Section 2.5.
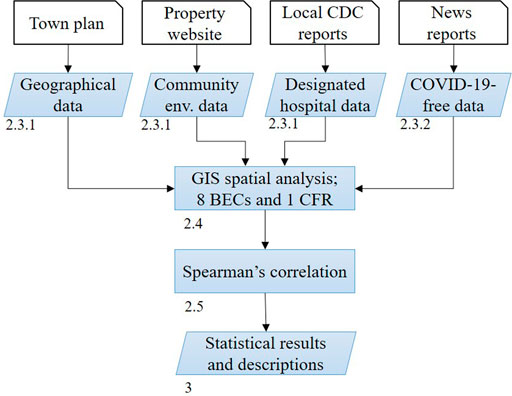
FIGURE 2. Natural experiment research design of this study.
Table 1 lists the definitions of eight BECs as independent variables. The BECs represent three types of quality of the built environment at the city block level, namely the density, infrastructure supply, and socioeconomic environment. Besides the eight BECs, the dependent variable CFR is also measured at the city block level.
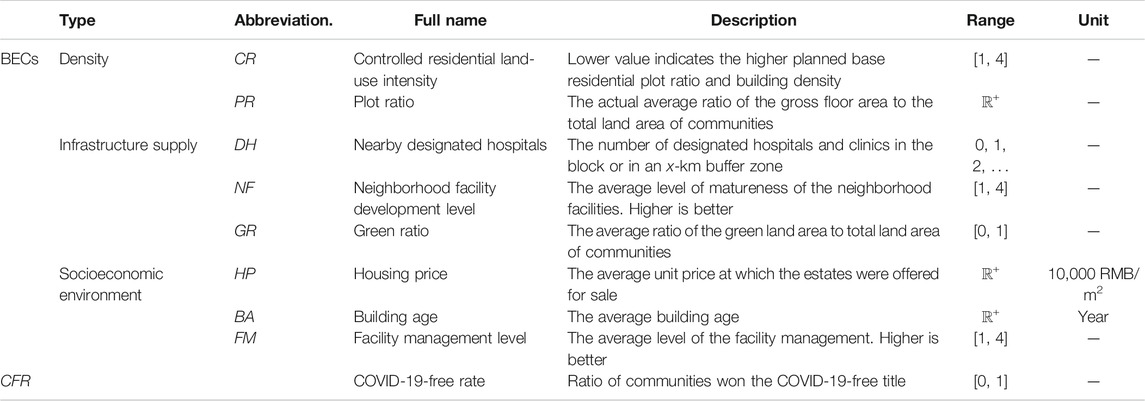
TABLE 1. Eight BECs and CFR defined for a city block in this study.
In this research, two BECs are defined to represent the density of the built environment. One is the controlled residential land-use intensity defined by the Wuhan government for each city block, as listed in Table 1. According to local regulations, the controlled residential land-use intensity strictly limits the intensity of residential land development. For example, a block with the controlled residential land-use intensity = 1 has the guideline permission of developing not more than 20% density of buildings and a base plot ratio at 3.2, as shown in Table 2. Another BEC is the average of actual plot ratios of communities within the city blocks reflecting the real land-use intensity, the range of which belongs to ℝ+ representing the positive real numbers. In addition, it also indirectly reflects the population density of the city blocks because of the blocked transportation system.
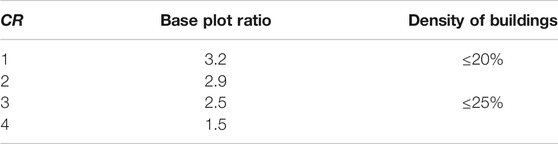
TABLE 2. Controlled residential land-use intensity (CR) defined for Wuhan (WNRPB 2015).
Three BECs in Table 1 represent the infrastructure supply for each city block. One is the number of designated hospitals and clinics, which is measured within the block with a buffer of 3 km. The other two BECs are the average development level of the neighborhood facility and the green ratio of the city blocks. The neighborhood facility development level using a four-point scale is assessed as the matureness of the neighborhood in terms of public facilities and commercial and transportation services, whereas the green ratio was the average ratio of the green land area to the total land area of the communities. For both, the higher indices stand for the better infrastructure settings.
Last, three BECs including housing price, building age, and neighborhood facility management level are defined to depict the socioeconomic environment. Housing price refers to the average unit price of residential communities in the city blocks, where the unit is 10,000 RMB/m2. The building age refers to the average age of residential buildings. For the facility management level of blocks, we assessed them in a four-point scale where 1 indicated “poor” and 4 stood for “excellent.”
CFR is defined as the “COVID-19-free ratio” of communities in the city blocks. On 5th March 18:00, 42 days after the lockdown, the Centers for Disease Control and Prevention of Wuhan consistently started to report a series of “COVID-19-free community” honor lists. A community was called “COVID-19-free” if both of the following conditions were met (Xiao 2020):
(1) no new confirmed, suspected, fever, or close contact cases in the past 14 days;
(2) strictly social distancing, closed estate management, fully screened inhabitants, and regular sterilization.
Three datasets of the built environment were collected, as shown in Figure 3. The printed plan of 192 city blocks was from the Wuhan Natural Resources and Planning Bureau (2015). We geo-registered and reconstructed the topographical boundaries of the city blocks with ArcGIS 10.1 and saved the geographical boundaries in the vector format of GeoJSON, as shown in Figure 3. Meanwhile, we collected the controlled residential land-use intensity data for the case area. The residential land-use intensities and their spatial distribution pattern are shown in Figure 4A.
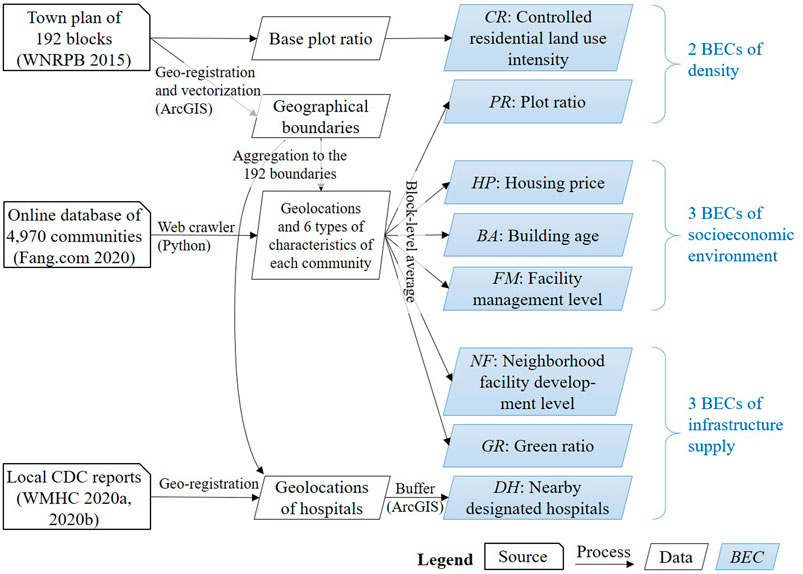
FIGURE 3. Data collection and preprocessing for the eight BECs.
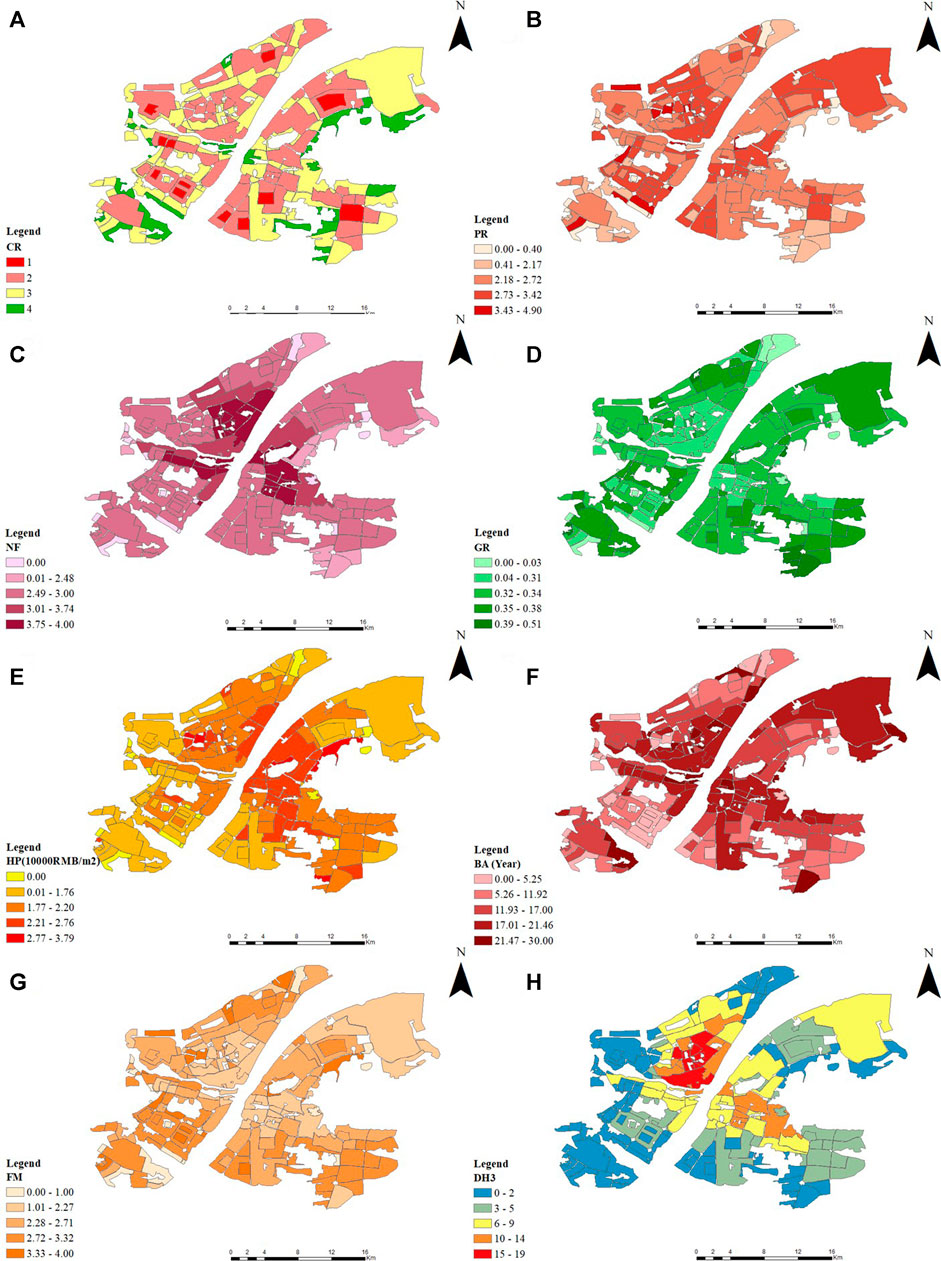
FIGURE 4. Visualized patterns of the eight BECs of the city blocks in Wuhan. (A) Controlled residential land-use intensity (CR), (B) plot ratio (PR), (C) neighborhood facility development level (NF), (D) green ratio (GR), (E) housing price (HP), (F) building age (BA), (G) facility management level (FM), and (H) nearby designated hospitals (DH3).
An online property dataset was collected using Python web crawler for the profile of the communities, as shown in Figure 3. The data source was Fang.com (2020), a city-wide property database listing residential estates in over 7,000 communities of whole Wuhan City. After using a geospatial analysis, the boundaries of the 192 city blocks selected 4,138 communities for this study. For each community, there are six characteristics related to the population density including 1) plot ratio, infrastructure supply including 2) neighborhood facility development level and 3) green ratio as well as socioeconomic environment including 4) housing price, 5) building age, and 6) facility management level. We extracted all the residential communities for the case area and associated each community with the actual geolocation on WGS-84 globe (transformed from the China’s local BD-09 coordinate system). Six related BECs were extracted as an average by aggregating the communities into city blocks. The spatial distribution patterns of the BECs are shown in Figures 4B–G.
Furthermore, a list of 48 designated hospitals and 60 designated fever clinics were collected, as shown in Figure 3. The name list of hospitals designated for COVID-19 treatment in urban Wuhan was collected from the Wuhan Municipal Health Commission (2020a), while the list of designated fever clinics was collected from the Wuhan Municipal Health Commission (2020b). By matching the two lists and removing the duplicates, 72 hospitals and fever clinics were confirmed, with their full names, addresses, and geocoded locations on the WGS-84 globe. We aggregated them into city blocks to examine the spatial distribution pattern of DH3 as shown in Figure 4H.
As shown in Figure 5A, 20 lists of COVID-19-free communities were authorized from 5th March to 14th May by the Wuhan Municipal Headquarters. Before the reopening of the city in early April 2020, as shown by the green line in Figure 5A, the CFR was about 99% in urban Wuhan. On 30 June 2020, all 7,102 communities were branded COVID-19-free. From late January to early March 2020, Wuhan increasingly implemented a series of measures, such as bans on transportation, suspension of public gatherings, closed management of villages, communities, and units. Thus, we assume that the access to the built environment was totally controlled when the first report was released.
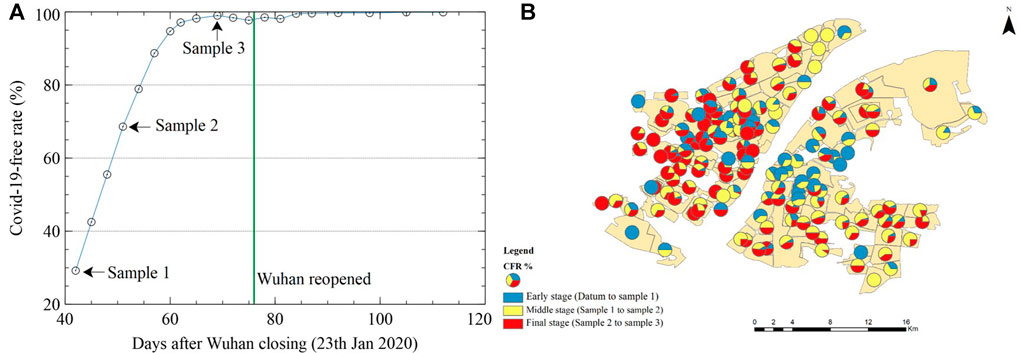
FIGURE 5. Accumulated COVID-19-free rates of communities in Wuhan. (A) Three sampling time points and (B) recovery rates in three stages.
We selected three data samples from the series of COVID-19-free community reports, as shown in Figure 5A, based on the overall CFR. The first sample on 5 March 2020 represented CFR1 = 29.2%, while the second was CFR2 = 68.6% released on 14th March and the third was CFR3 = 99.0% on 1st April. The second sample was selected for an approximate average of CFR1 and CFR3. We downloaded the reports of about 7,100 communities from Changjiang Daily (CJD, 2020a; CJD, 2020b; CJD, 2020c), parsed the name list from the report images. Then, we registered and fine-tuned the geo-locations of all the communities to the WGS-84 globe using Amap.com (https://lbs.amap.com/api/webservice/, ver. 3), which is one of the most popular digital maps and offers accurate geocoding services in China. Finally, about 4,970 residential communities were associated with the 192 city blocks in the case area.
Figure 5 visualizes the recovery rates of each block from the three phases, including datum-to-CFR1 (early stage), CFR1-to-CFR2 (middle stage), and CFR2-to-CFR3 (final stage). A general pattern is found that the western Wuhan relatively lagged in terms of city block recovery. In this research, the basic recovery rate, i.e., CFRP1 = CFR1 was selected to present the initial recovery situation of all blocks at the early age. Then, the percentages of recovery for the rest two stages, i.e., CFRP2 = (CFR2 − CFR1)/(1 − CFR1) and CFRP3 = (CFR3 – CFR2)/(1 − CFR1) were selected as the ‘pure’ recovery rates of the city blocks.
We first apply Spearman’s rank correlation to examine the relations between the eight BECs and the three CFR variables. Pearson’s linear correlation is inappropriate in this study due to some non-normal variables. The Spearman’s correlation coefficient ρ is defined as:
where n is the total number of the city blocks, xi and yi stand for the ranks of the variables,
Figure 6 shows the results of analysis, where the data spreadsheet is available in the Supplementary Material. The diagonal subfigures show that some variables, such as CFRP1 and neighborhood facility development level, were not in normal distributions. The upper triangle in Figure 6 shows Spearman’s rank correlation tests, while the lower triangle displays the scatter plots. The scales of two axes target the two variables of the scatter plots.
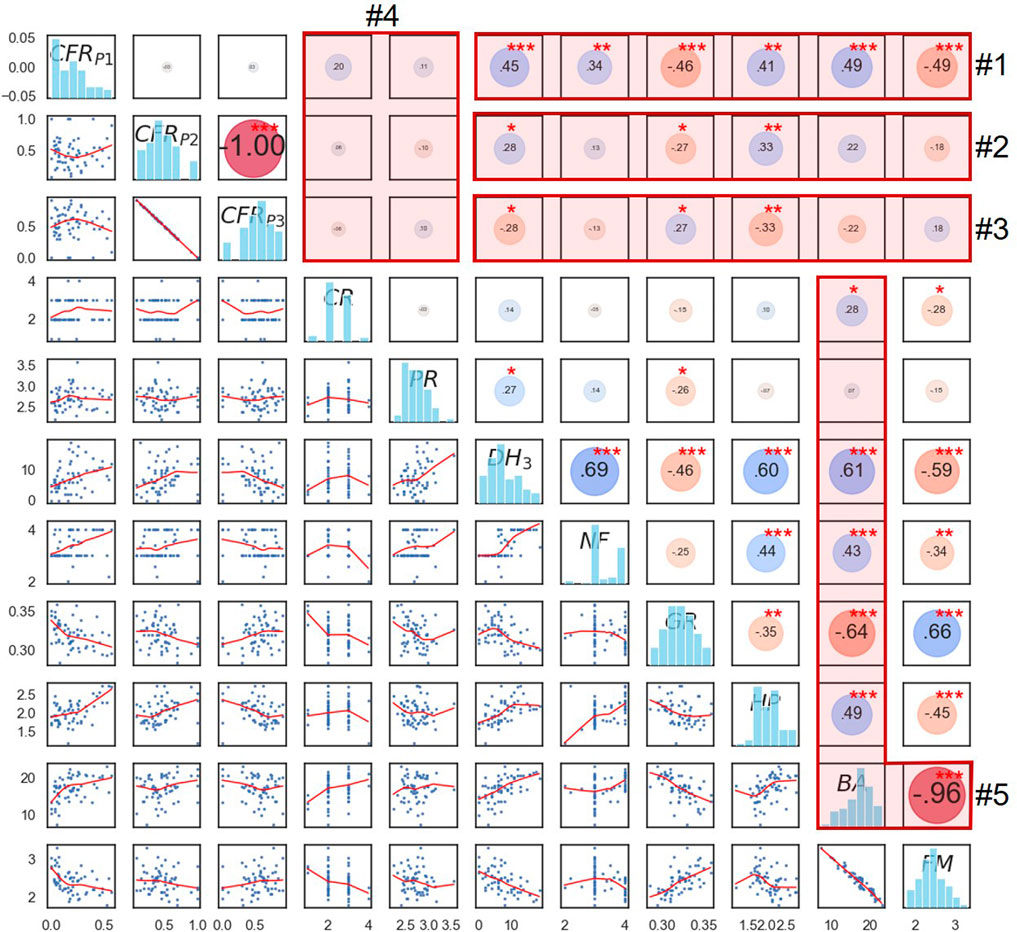
FIGURE 6. Results of Spearman’s rank correlation analysis (n = 60), with the histograms at diagonal subfigures (abbreviations referring to Figure 4), scatter plots in the lower triangle, and the area of the circle in the upper triangle indicates the absolute value (cold color = positive; warm = negative) of the Spearman coefficient ρ (two-tailed significance p: *** ≤0.001 < ** ≤0.01 < * ≤0.05).
As shown in the red rectangle #1 in Figure 6, CFRP1 was significantly associated with all six BECs from the infrastructure supply and socioeconomic environment, i.e., nearby designated hospitals (3 km), neighborhood facility development level, green ratio, housing price, building age, and facility management. In particular, the neighborhood facility development level had a weak positive association (ρ = 0.34, p ≤0.05, n = 60), while others had moderate associations (0.41 ≤ ρ ≤ 0.49). In other words, on 5 March 2020, or the first sample point, the city blocks with more aged communities and nearby hospitals, a lower green ratio, more mature public facilities, and a higher housing price and property management level had higher recovery rates. The possible reasons include 1) probably lower infection rates at the initial stage and 2) earlier recoveries in such city blocks.
Next, the associations of the six BECs against CFRP1 had a sharp decline against CFRP2, as shown in the red rectangle #2 in Figure 6. It indicates that the strictly closed management, i.e., complete isolation from the outdoor urban environment for most dwellers, comprehensively weakened the associations. For example, the ρ values were approximately halved except for housing price. Yet, three BECs, nearby designated hospitals (3 km), green ratio, and housing price, were still found significant (p < 0.05, n = 60). Besides, the signs of the two ρ values for housing price were seen as consistent.
The correlations of the six BECs against CFRP3 in the red rectangle #3 in Figure 6 were mirror reflections of those regarding CFRP2. In contrast, the controlled residential land-use intensity and plot ratio representing the density of the built environment, as shown in the red rectangle #4 of Figure 6, had no considerable roles in resumptions in Wuhan.
Other significant correlations between BECs mainly from the infrastructure supply and socioeconomic environment were also observed. For instance, aged communities in Wuhan were strongly associated with lower green ratios (ρ = −0.64, p ≤0.001, n = 60), as shown in the red rectangle #5 in Figure 6. Such an association also prevails in most of China’s megacities due to the fast urbanization. Besides, the associations between the building age and other BECs such as nearby designated hospitals (3 km), neighborhood facility development level, housing price, facility management level, and controlled residential land-use intensity were also in line with the spatial distribution patterns shown in Figure 4. Large proportion of aged city blocks was mainly located in the central part of Wuhan, which owned a higher housing price, higher-level nearby facility development, and more hospitals but less facility management.
In addition, a sensitivity analysis using eleven sample sizes of buffer zones from 0 to 10 km was implemented to test the trends of associations considering the modifiable areal unit problem (MAUP) (Openshaw 1981). Figure 7 shows that the trends in the first two stages. The nearby designated hospitals within an increasing buffer zone size had a consistent strengthening correlation with CFRP1 and a declining p-value to 10–5 at 8 km. The correlation with CFRP2 had a different trend. When the buffer zone size increased, the figure for the coefficient in Figure 7A rose at first and reached the maximum at 3 km; then, it declined gradually. Under the line of p = 0.05 in Figure 7B, 3 km was the only significant point for CFRP2 (ρ = 0.2810, p ≤0.05, n = 60). It indicates that 3 km was a “sweet point” for Wuhan to aggregate the number of designated hospitals and clinics in both the early and later stages.
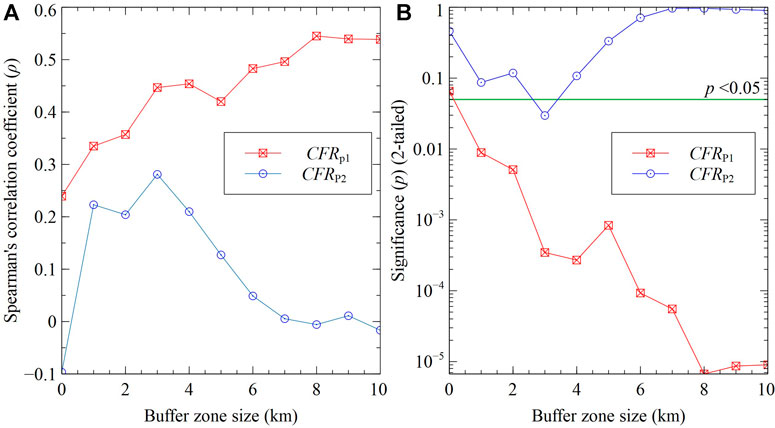
FIGURE 7. Results of sensitivity analysis against the buffer zone size for nearby designated hospitals. (A) Spearman’s coefficient and (B) significance level (n = 60).
The findings of this article suggest that both infrastructure supply and socioeconomic environment factors had significant associations with city block–level COVID-19 recovery in Wuhan. Six examined BECs, i.e., nearby designated hospitals (3 km), neighborhood facility development level, green ratio, housing price, building age, and facility management level were significantly associated with Wuhan’s initial recovery from the COVID-19 pandemic. The associations on the first sampling point may refer to the combination of BECs’ impacts on COVID-19 transmission and the different initial confirmed possibility of blocks in different areas, which should be further explored.
Two BECs concerning the density of the built environment, i.e., controlled residential land-use intensity and plot ratio, were not significant for the city block–level recovery throughout the study period. In contrast, studies on COVID-19 transmission have found a significant positive association between the population density and the possibilities of transmission (Chhikara et al., 2020; You et al., 2020). The comparison of the findings shows the macro-BECs have varied associations in different stages such as disaster control (i.e., COVID-19 transmission) and post-disaster recovery.
Furthermore, these BECs were associated with each other. Besides the findings of aged city blocks mentioned in Section 3, the housing price was found to be the strongest correlation with the number of nearby designated hospitals and clinics (medical facilities). Surprisingly, the green ratio was negatively associated with COVID-19 recovery in Wuhan’s case, which echoes some studies in China, for example, high public green space density increased the COVID-19 morbidity rate in Wuhan (You et al., 2020).
In the middle and final recovery stages, the six BECs’ associations with the recovery rates were weakened in general. It implies that strict measures against human mobility at the neighborhood and city block level showed a statistical impact on the BECs’ roles. However, three BECs, i.e., nearby designated hospitals (3 km), green ratio, and housing price, still had significant associations in the later stages of recovery; in addition, the three BECs may indicate the city blocks’ innate urban resilience levels due to the full isolation of residents from the environment. The effectiveness of human activity and mobility control measures, as weakened associations with BECs, also echoes the findings in the literature (Chhikara et al., 2020; Hartley and Perencevich 2020; Hirschhorn et al., 2020; Islam et al., 2020; Xiong et al., 2020).
This study aims to fill in the research gap of the BECs and COVID-19 recovery associations at the city block level. The findings provide new evidence at a fine-spatial scale for researchers and practitioners in the fields of urban development, urban health, post-disaster recovery, and public policy. For example, Wuhan’s tight control measures for COVID-19 have effectively weakened BECs’ associations with COVID-19 transmission. The findings also echo classical urban development and post-disaster recovery theories. For example, the infrastructure settings such as medical resources and neighborhood greenery management show significant but inverse impacts on Wuhan’s recovery; some BECs of the socioeconomic environment, such as housing price, can effectively reflect the disaster and secondary disaster development (Aldrich 2012; Peng et al., 2020; Rouhanizadeh et al., 2020).
The findings may inspire smarter and more resilient urban development, in Wuhan and elsewhere. For Wuhan, a city that just completed its 2010–2020 Town Plan (GovWH 2010), the accessibility of medical infrastructures, nature, and public services—besides the existing density and transport—should be emphasized in the next plan. In addition, the BECs’ associations may inspire the cities that are struggling with the pandemic (Allam and Jones 2020; Parnell 2020). Under the strong mobility intervention, preparedness should concern more on the infrastructure supply and socioeconomic environment for epidemic response and recovery.
The positive associations of nearby designated hospitals suggest systematic review and reshaping of the density and accessibility of public health and medical resources in urban development. The trends of the buffer ranges to the medical facilities seem to suggest a walkable distance, such as 3 km for Wuhan, may be a “sweet point” for optimal infrastructure designs for planning residential blocks. This finding may be more helpful to the fast urbanization in China and other emerging economies, where public health facilities in the marginal areas or new towns cannot match the speed of real estate development.
The negative associations of green ratios revealed an unusual case. It did not disprove the role of greenery on urban health in megacities. Instead, it implies that public health facilities outweighed a town’s greenery landscape in terms of epidemic recovery. In addition, the negative association between greenery and housing price in Wuhan may infer a disparity in accessibilities in Wuhan. That is, the high-income population sacrifices their access to nature for public services and resources—such as hospitals, subways, and education, which echoes studies in property valuation (Huang & Yin 2015; Xu et al., 2016). Thus, the housing price of a city block can reflect its post-disaster recoverability to an extent. In the future, one way to resolve the disparity of infrastructure supply is to encourage integration and sharing of resources across city blocks from the sharing economy perspective (Liu et al., 2016). Another possible way is comprehensive and inclusive planning that equally meets the needs of low-income and vulnerable groups in Wuhan and other cities.
This study also has limitations. Our main data source was government reports distributed by newspapers, which were based on medical tests and self-reporting fever data. Due to the incubation period and asymptomatic patients, the aggregated CFR values may contain small errors. Furthermore, the correlation analysis between aggregated COVID-19 recovery and built environment in the city block level was reasonable, but lost data details such as causes and causality data. Another limitation lies in the source of the online property database, which does not assess the streets and parks surrounding the communities. The significant associations in Wuhan may also be limited by the urban plans, climate, ethnicity, and culture though the methodology can be replicated in other cities.
In the future, we look forward to seeing studies on BECs associations and impacts on different cities and countries with different intervention conditions so that the findings can be further verified thoroughly. More quantified urban data sources, such as city information modeling (Xue, Wu et al., 2021) and computable street view features (Xue, Li et al., 2021), might reveal new evidence as well. Encouragements and subsidies based on solid evidence, for example, to increase the quantities of nearby hospitals, promote residential landscape sanitary management levels, and take prioritized measures for targeted economic city blocks should be further recommended for sustainable and smart urban development.
This study employed a randomized GIS-based natural experiment study across the city blocks in Wuhan to investigate whether different built environmental characteristics (BECs) were associated with COVID-19 recovery rates. All the six BECs from the infrastructure supply and socioeconomic environment were found significantly associated with the initial COVID-19 recovery in the megacity of Wuhan. They were nearby designated hospitals (3 km), neighborhood facility development level, green ratio, housing price, building age, and facility management level. The strict measures in the later recovery stages seemed to weaken all the six associations in general. As a result, three BECs, i.e., nearby designated hospitals (3 km), green ratio, and housing price, still had significant associations. In contrast, both BECs presenting the density of the built environment had no association with the recovery throughout the whole stage. The statistical results in the article may be useful for the cities that are still fighting COVID-19. More importantly, the evidence can pinpoint several implications for smart and resilient urban development, for example, comprehensive and balanced accessibility of medical facilities and public facility services.
The original contributions presented in the study are included in the article/Supplementary Material, further inquiries can be directed to the corresponding author.
ML and FX contributed to the conception and design of the study. ML and FX organized the database. ML, YW, and FX performed the statistical analysis and charting. ML and FX wrote the first draft of the manuscript. YP, JX, TT, and HG wrote subsections of the manuscript. All authors contributed to manuscript revision and read and approved the submitted version.
The authors declare that the research was conducted in the absence of any commercial or financial relationships that could be construed as a potential conflict of interest.
All claims expressed in this article are solely those of the authors and do not necessarily represent those of their affiliated organizations, or those of the publisher, the editors, and the reviewers. Any product that may be evaluated in this article, or claim that may be made by its manufacturer, is not guaranteed or endorsed by the publisher.
The Supplementary Material for this article can be found online at: https://www.frontiersin.org/articles/10.3389/fbuil.2021.813399/full#supplementary-material
Ahmadian, E., Sodagar, B., Mills, G., Byrd, H., Bingham, C., and Zolotas, A. (2019). Sustainable Cities: The Relationships between Urban Built Forms and Density Indicators. Cities 95, 102382. doi:10.1016/j.cities.2019.06.013
Aldrich, D. P. (2012). Building Resilience: Social Capital in post-disaster Recovery. Chicago, USA: University of Chicago Press.
Allam, Z., and Jones, D. S. (2020). Pandemic Stricken Cities on Lockdown. Where Are Our Planning and Design Professionals [now, Then and into the Future]? Land use policy 97, 104805. doi:10.1016/j.landusepol.2020.104805
Chen, Y., Shen, L., Zhang, Y., Li, H., and Ren, Y. (2019). Sustainability Based Perspective on the Utilization Efficiency of Urban Infrastructure --- A China Study. Habitat Int. 93, 102050. doi:10.1016/j.habitatint.2019.102050
Chhikara, B. S., Rathi, B., Singh, J., and Poonam, F. N. (2020). Corona Virus SARS-CoV-2 Disease COVID-19: Infection, Prevention and Clinical Advances of the Prospective Chemical Drug Therapeutics. Chem. Biol. Lett. 7 (1), 63–72.
CJD. (2020a, April 1). 99.0% of Communities Are COVID-19-free in Wuhan! Don't Relax, Insist on Not Going Out unless Necessary (in Chinese). Changjiang Daily. Retrieved from https://mp.weixin.qq.com/s/qmJnAh-OuhA4eBPR22QN_Q
CJD. (2020b, March 15). Wuhan Announced the Fourth-Batch Assessment of COVID-19-free Communities. Changjiang Daily. Retrieved from http://news.cjn.cn/wsqzgzb/jtd/202003/t3591318.htm
CJD. (2020c, March 6). Wuhan Announces the First Batch of COVID-19-free Communities, See if Your home Is There (in Chinese). Changjiang Daily. Retrieved from http://www.cjrbapp.cjn.cn/p/166086.html
Desjardins, M. R., Hohl, A., and Delmelle, E. M. (2020). Rapid Surveillance of COVID-19 in the United States Using a Prospective Space-Time Scan Statistic: Detecting and Evaluating Emerging Clusters. Appl. Geogr. 118, 102202. doi:10.1016/j.apgeog.2020.102202
Fang, L.-Q., de Vlas, S. J., Feng, D., Liang, S., Xu, Y.-F., Zhou, J.-P., et al. (2009). Geographical Spread of SARS in mainland China. Trop. Med. Int. Health 14 (S1), 14–20. doi:10.1111/j.1365-3156.2008.02189.x
Fang.com (2020). Fangtianxia Wuhan. Beijing, China: Fang.com. Retrieved from https://wuhan.fang.com/.
Franch-Pardo, I., Napoletano, B. M., Rosete-Verges, F., and Billa, L. (2020). Spatial Analysis and GIS in the Study of COVID-19. A Review. Sci. Total Environ. 739, 140033. doi:10.1016/j.scitotenv.2020.140033
Frank, L. D., Iroz-Elardo, N., MacLeod, K. E., and Hong, A. (2019). Pathways from Built Environment to Health: a Conceptual Framework Linking Behavior and Exposure-Based Impacts. J. Transport Health 12, 319–335. doi:10.1016/j.jth.2018.11.008
GovWH, (2010). Wuhan General Town Plan (2010-2020). Wuhan: The Government of Wuhan City, China. Retrieved from http://gtghj.wuhan.gov.cn/wu/pc-992-61109.html.
Hamidi, S., Ewing, R., and Sabouri, S. (2020). Longitudinal Analyses of the Relationship between Development Density and the COVID-19 Morbidity and Mortality Rates: Early Evidence from 1,165 Metropolitan Counties in the United States. Health & Place 64, 102378. doi:10.1016/j.healthplace.2020.102378
Hartley, D. M., and Perencevich, E. N. (2020). Public Health Interventions for COVID-19. Jama 323 (19), 1908–1909. doi:10.1001/jama.2020.5910
Hirschhorn, L., Smith, J. D., Frisch, M. F., and Binagwaho, A. (2020). Integrating Implementation Science into COVID-19 Response and Recovery. BMJ 369, m1888. doi:10.1136/bmj.m1888
Hopman, J., Allegranzi, B., and Mehtar, S. (2020). Managing COVID-19 in Low- and Middle-Income Countries. Jama 323 (16), 1549–1550. doi:10.1001/jama.2020.4169
Huang, H., and Yin, L. (2015). Creating Sustainable Urban Built Environments: an Application of Hedonic House price Models in Wuhan, China. J. Hous Built Environ. 30 (2), 219–235. doi:10.1007/s10901-014-9403-8
Islam, N., Sharp, S. J., Chowell, G., Shabnam, S., Kawachi, I., Lacey, B., et al. (2020). Physical Distancing Interventions and Incidence of Coronavirus Disease 2019: Natural experiment in 149 Countries. BMJ 370, m2743. doi:10.1136/bmj.m2743
Kan, Z., Kwan, M.-P., Wong, M. S., Huang, J., and Liu, D. (2021). Identifying the Space-Time Patterns of COVID-19 Risk and Their Associations with Different Built Environment Features in Hong Kong. Sci. Total Environ. 772, 145379. doi:10.1016/j.scitotenv.2021.145379
Klompmaker, J. O., Hart, J. E., Holland, I., Sabath, M. B., Wu, X., Laden, F., et al. (2021). County-level Exposures to Greenness and Associations with COVID-19 Incidence and Mortality in the United States. Environ. Res. 199, 111331. doi:10.1016/j.envres.2021.111331
Li, B., Peng, Y., He, H., Wang, M., and Feng, T. (2021). Built Environment and Early Infection of COVID-19 in Urban Districts: A Case Study of Huangzhou. Sustain. Cities Soc. 66, 102685. doi:10.1016/j.scs.2020.102685
Li, X., Zhou, L., Jia, T., Peng, R., Fu, X., and Zou, Y. (2020). Associating COVID-19 Severity with Urban Factors: a Case Study of Wuhan. Ijerph 17 (18), 6712. doi:10.3390/ijerph17186712
Liu, W., Liu, Y., Twum, P., and Li, S. (2016). National Equity of Health Resource Allocation in China: Data from 2009 to 2013. Int. J. Equity Health 15 (1), 1–8. doi:10.1186/s12939-016-0357-1
Loo, B. P., and Lam, W. W. (2012). Geographic Accessibility Around Health Care Facilities for Elderly Residents in Hong Kong: A Microscale Walkability Assessment. Environ. Plann. B 39 (4), 629–646. doi:10.1068/b36146
Lowcock, E. C., Rosella, L. C., Foisy, J., McGeer, A., and Crowcroft, N. (2012). The Social Determinants of Health and Pandemic H1N1 2009 Influenza Severity. Am. J. Public Health 102 (8), e51–e58. doi:10.2105/AJPH.2012.300814
Parnell, S. (2020). The Enabling Conditions of post-pandemic City Government. Environ. Plann. B: Urban Analytics City Sci. 47 (7), 1143–1145. doi:10.1177/2399808320950041
Peng, Y., Gu, X., Zhu, X., Zhang, F., and Song, Y. (2020). Recovery Evaluation of Villages Reconstructed with Concentrated Rural Settlement after the Wenchuan Earthquake. Nat. Hazards 104, 139–166. doi:10.1007/s11069-020-04241-z
Pinter-Wollman, N., Jelić, A., and Wells, N. M. (20182017). The Impact of the Built Environment on Health Behaviours and Disease Transmission in Social Systems. Phil. Trans. R. Soc. B 373 (1753), 20170245. doi:10.1098/rstb.2017.0245
Ponnambalam, L., Samavedham, L., Lee, H. R., and Ho, C. S. (2012). Understanding the Socioeconomic Heterogeneity in Healthcare in US Counties: the Effect of Population Density, Education and Poverty on H1N1 Pandemic Mortality. Epidemiol. Infect. 140 (5), 803–813. doi:10.1017/S0950268811001464
Qu, S., Hu, S., Li, Q., and Yang, S. (2018). Quantitative Evaluation of the Impacts of Driving Factors on Urban Residential Land price and Analysis of Their Spatio-Temporal Heterogeneity: a Case Study of Wuhan City (In Chinese with English Abstract). Prog. Geogr. 37 (10), 1371–1380. doi:10.18306/dlkxjz.2018.10.007
Rouhanizadeh, B., Kermanshachi, S., and Nipa, T. J. (2020). Exploratory Analysis of Barriers to Effective post-disaster Recovery. Int. J. Disaster Risk Reduction 50, 101735. doi:10.1016/j.ijdrr.2020.101735
Sohrabi, C., Alsafi, Z., O'Neill, N., Khan, M., Kerwan, A., Al-Jabir, A., et al. (2020). World Health Organization Declares Global Emergency: A Review of the 2019 Novel Coronavirus (COVID-19). Int. J. Surg. 76, 71–76. doi:10.1016/j.ijsu.2020.02.034
Sy, K. T. L., White, L. F., and Nichols, B. E. (2021). Population Density and Basic Reproductive Number of COVID-19 across United States Counties. PLoS One 16 (4), e0249271. doi:10.1371/journal.pone.0249271
Thomson, B. (2020). The COVID-19 Pandemic. Circulation 142 (1), 14–16. doi:10.1161/CIRCULATIONAHA.120.047538
WMHC. (2020b, January 20). List of Fever Clinics and Designated Hospitals in Wuhan. Wuhan, China: Wuhan Municipal Health Commission. Retrieved from http://wjw.wuhan.gov.cn/xwzx_28/gsgg/202004/t20200430_1199587.shtml.
WMHC. (2020a, February 26). Use Statistics of Beds in Designated Hospitals in Wuhan (February 25, 2020). Wuhan, China: Wuhan Municipal Health Commission. Retrieved from http://wjw.wuhan.gov.cn/ztzl_28/fk/tzgg/202004/t20200430_1197173.shtml.
WNRPB (2015). Announcement of the "Regulations on the Management of Land Use Construction Intensity in the Urban Districts of Wuhan. Wuhan, China: Wuhan Natural Resources and Planning Bureau. Retrieved from http://zrzyhgh.wuhan.gov.cn/zwgk_18/fdzdgk/jcgk/qtwjygk/202001/t20200107_614962.shtml.
Xiao, J. (2020, March 6). The First List of COVID-19-free Communities in Wuhan, Try to Find Your home (in Chinese). Changjiang News. Retrieved from http://www.cjrbapp.cjn.cn/p/166086.html.
Xiong, Y., Wang, Y., Chen, F., and Zhu, M. (2020). Spatial Statistics and Influencing Factors of the COVID-19 Epidemic at Both Prefecture and County Levels in Hubei Province, China. Ijerph 17 (11), 3903. doi:10.3390/ijerph17113903
Xu, T., Zhang, M., and Aditjandra, P. T. (2016). The Impact of Urban Rail Transit on Commercial Property Value: New Evidence from Wuhan, China. Transportation Res. A: Pol. Pract. 91, 223–235. doi:10.1016/j.tra.2016.06.026
Xue, F., Li, X., Lu, W., Webster, C. J., Chen, Z., and Lin, L. (2021). Big Data-Driven Pedestrian Analytics: Unsupervised Clustering and Relational Query Based on Tencent Street View Photographs. Ijgi 10 (8), 561. doi:10.3390/ijgi10080561
Xue, F., Wu, L., and Lu, W. (2021b). Semantic Enrichment of Building and City Information Models: A Ten-Year Review. Adv. Eng. Inform. 47, 101245. doi:10.1016/j.aei.2020.101245
You, H., Wu, X., and Guo, X. (2020). Distribution of COVID-19 Morbidity Rate in Association with Social and Economic Factors in Wuhan, China: Implications for Urban Development. Ijerph 17 (10), 3417. doi:10.3390/ijerph17103417
Keywords: built environment, post-disaster recovery, COVID-19-free community, natural experiment, GIS
Citation: Li M, Peng Y, Wu Y, Xu J, Tan T, Guo H, Lu W, Yeh AGO and Xue F (2022) Role of the Built Environment in the Recovery From COVID-19: Evidence From a GIS-Based Natural Experiment on the City Blocks in Wuhan, China. Front. Built Environ. 7:813399. doi: 10.3389/fbuil.2021.813399
Received: 11 November 2021; Accepted: 24 December 2021;
Published: 17 January 2022.
Edited by:
Hadi Sarvari, Islamic Azad University, IranReviewed by:
Aynaz Lotfata, Chicago State University, United StatesCopyright © 2022 Li, Peng, Wu, Xu, Tan, Guo, Lu, Yeh and Xue. This is an open-access article distributed under the terms of the Creative Commons Attribution License (CC BY). The use, distribution or reproduction in other forums is permitted, provided the original author(s) and the copyright owner(s) are credited and that the original publication in this journal is cited, in accordance with accepted academic practice. No use, distribution or reproduction is permitted which does not comply with these terms.
*Correspondence: Fan Xue, eHVlZkBoa3UuaGs=
†ORCID: Maosu Li, orcid.org/0000-0002-9970-4053; Yi Peng, orcid.org/0000-0002-7042-9254; Yijie Wu, orcid.org/0000-0003-1441-1583; Jinying Xu, orcid.org/0000-0001-9589-6396; Tan Tan, orcid.org/0000-0002-3374-8299; Hui Guo, orcid.org/0000-0003-2801-1652; Weisheng Lu, orcid.org/0000-0003-4674-0357; Anthony G. O. Yeh, orcid.org/0000-0002-0587-0588; Fan Xue, orcid.org/0000-0003-2217-3693
Disclaimer: All claims expressed in this article are solely those of the authors and do not necessarily represent those of their affiliated organizations, or those of the publisher, the editors and the reviewers. Any product that may be evaluated in this article or claim that may be made by its manufacturer is not guaranteed or endorsed by the publisher.
Research integrity at Frontiers
Learn more about the work of our research integrity team to safeguard the quality of each article we publish.