
94% of researchers rate our articles as excellent or good
Learn more about the work of our research integrity team to safeguard the quality of each article we publish.
Find out more
ORIGINAL RESEARCH article
Front. Built Environ. , 17 December 2021
Sec. Urban Science
Volume 7 - 2021 | https://doi.org/10.3389/fbuil.2021.797179
This article is part of the Research Topic Social-Ecological Urbanism: Developing Discourse, Institutions and Urban Form for the Design of Resilient Social-Ecological Systems in Cities View all 4 articles
Rapid economic development and population growth has led to urban densification and massive land use changes, putting pressure on both ecosystems, and people. In this context, public health issues have become crucial for cities to address to ensure they remain livable and healthy for everyone. Since the health challenges of cities tend to manifest themselves differently among different population groups—e.g., groups of higher socioeconomic status tend to be correlated with better health than groups of low socioeconomic status—closing the health gap has become a priority for creating healthy cities for everyone. More greenness close to where people live and better accessibility to green areas has been shown to be useful for improving human health and for tackling health inequalities. This paper aims at developing a method for supporting urban planners and policymakers on where to geographically prioritize investments in green infrastructure to contribute to closing the health gap and promote community resilience through improving public health. Using the City of Stockholm as a pilot, we apply a GIS analysis to identify vulnerable population groups in relation to geotagged empirical human health- and socio-economic data. By then assessing vulnerable populations in relation to population numbers and accessibility to urban green areas, an Urban Green Opportunity Map (UGOM) was created, identifying focus areas where investment in green infrastructure will contribute most to closing the health gap and building community resilience.
The rapid economic development of the past decades combined with current and predicted population growth has led to the loss of green areas outside and inside urban areas due to city expansion and city compaction respectively, putting pressure on both ecosystems and people (Folke et al., 2011; Seto et al., 2011; Berghauser Pont et al., 2017; Gren et al., 2019; Colding et al., 2020). In this context, public health issues have become crucial for urban areas to address in order to ensure they remain livable and healthy for everyone, as e.g., reflected in several of the UN SDG goals, e.g., goal 3 “Good Health and Well-Being”, goal 10 “Reduced Inequalities”, and goal 11 “Sustainable Cities and Communities” (United Nations, Department of Economic and Social Affairs, Population Division, 2019). The health challenges of cities entails physical as well as mental health issues (Sundquist et al., 2004; Hidaka, 2012; Lee et al., 2012; Sallis et al., 2016). Also, they tend to manifest themselves differently among different socioeconomic groups in society. For example, groups with higher socioeconomic status tend to be correlated with better health than groups with lower socioeconomic status (Mackenbach and Bakker, 2003; Smith, 2007). Closing such health gaps is essential in creating healthy cities for everyone (Marmot, 2017) and is a priority of e.g., the Swedish government (Folkhälsomyndigheten, 2019). In this context, a growing body of literature has shown that more greenness close to where people live and better accessibility to green areas are useful for improving human health (Nowak et al., 2006; Stigsdotter et al., 2010; van den Berg et al., 2010; Villeneuve et al., 2012; Ward Thompson et al., 2012; Markevych et al., 2014). Furthermore, such urban green related health benefits have been shown to be effective in tackling health inequalities brought by socio-economic factors (Braubach et al., 2017) and have even been shown to have proportionally larger positive effects on populations from lower socioeconomic groups, which are generally considered at higher risk of poverty-related stress and associated health issues (Mitchell and Popham, 2008). Although we in this paper, due to the reasons stated above, are primarily concerned with tackling health inequalities from a socio-economic perspective, there are undoubtedly other valid perspectives in this context, such as immutable characteristics, e.g., gender and age (Ode Sang et al., 2016).
The issue of health has also been put forward as an essential parameter in the context of resilience, with the argument that good health contributes to overall resilience of a community (Morton and Lurie, 2013) e.g., in facing disturbances and disasters (Chandra et al., 2013). Resilience in the built environment has been presented as one of several domains contributing to the overall resilience of a community (Mcallister, 2016). Based on the notion that people and nature are interdependent systems (Folke et al., 2011) there is good reason to also view the urban green infrastructure as an integrated part of the built environment.
Hence, in this paper, we attempt to address the issue of promoting resilient and healthy cities for everyone by developing a method for supporting urban planners in identifying locations where investments in green infrastructure will make the most sense in closing the health gap in relation to socio-economic status and to also build community resilience through improved public health. The aim of the study is not to provide quantitative calculations on the return on investment, but to draw on the already established positive link between accessibility to urban green areas and human health benefits, particularly in relation to socio-economic status (Braubach et al., 2017). The City of Stockholm will here be used as a pilot study area.
More specifically, we will: 1) use geotagged empirical socio-economic- and health indicator data to create a Health Vulnerability Map (HVM), with the purpose of identifying locations with the most vulnerable populations; 2) create an urban green accessibility map (UGAM) by linking high resolution satellite imagery (orthophoto) to address points1 in the City of Stockholm, using network analysis; and 3) create an Urban Green Opportunity Map (UGOM) by combining spatial information on health vulnerability, green area accessibility and population density, in order to pinpoint locations where investment in the green infrastructure would make the most sense in the context of closing the health gap from a socio-economic perspective and building community resilience through improved public health. Finally, we will 4) discuss our results and the pros and cons of the method in relation to promoting resilient and healthy cities for everyone.
The City of Stockholm, located in the south eastern part of Sweden (Figure 1), is the economic and political center of Sweden (Dobers and Hallin, 2009). It occupies a total surface area of 215,92 km2 with a population of 962154, which is about 9.5% of Sweden’s population (Stockholm Stad, 2020). The population growth in Stockholm has been accompanied by many common features of urbanization in a globalizing context, including densification, privatization, displacements in the economy, and spatial segregation (Littke, 2015). Furthermore, Sweden is committed to building houses at an unprecedented rate and out of a total of 700000 homes to be built (Boverket, 2016) over 300000 are to be built in the Stockholm area alone until 2030 (Stockholm Anslagstavla Facebook LinkedIn Instagram Youtube Twitter, 2018; Stockholm County Council et al., 2018). Hence, while green areas still make up a large portion of the city’s surface, urban development trends have put pressure on these areas favoring quality over quantity and prioritizing densification over sprawl (Littke, 2015). Thus, Stockholm is getting increasingly expensive, and the share of green areas is gradually reduced, which may worsen spatial segregation and decrease access to green infrastructure among certain parts of the population. Understanding these trends is therefore a vital part in understanding the dynamics at play between health status and availability to urban green areas.
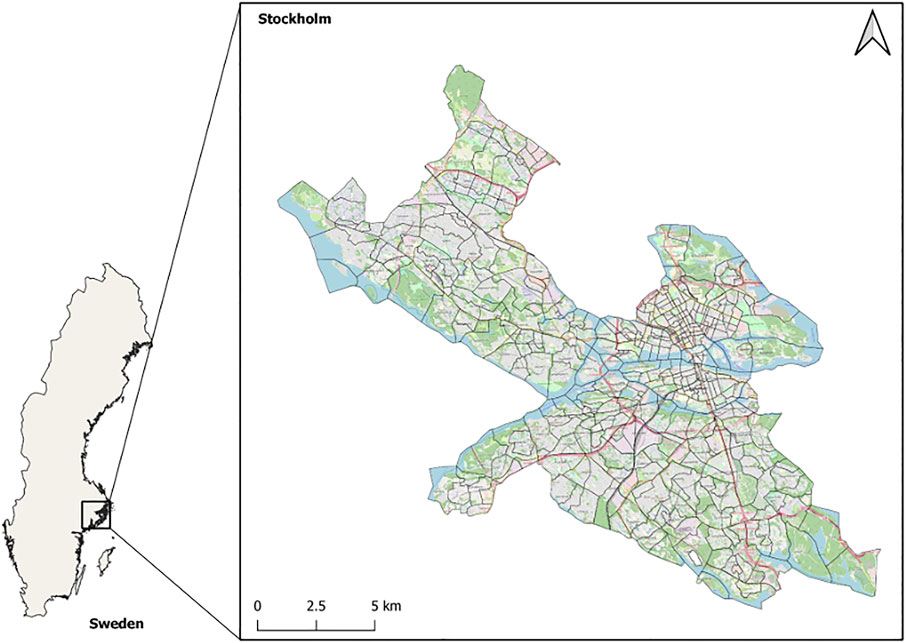
FIGURE 1. The City of Stockholm (Stockholm municipality). This figure contains data from Open Street Map.
To geographically identify the location of vulnerable populations in a health context, a health vulnerability map (HVM) was constructed. This map is based on three health indicators, including one indirect socio-economic- and two direct health indicators.
The socio-economic indicator, based on income and level of education, is here used as an indirect indicator of health. Populations with lower socioeconomic status are generally being considered at higher risk of poverty-related stress and associated health issues (Mitchell and Popham, 2008). Two direct health indicators, “sick days per person” and “median age at first hospitalized heart attack” were also included. All three indicators were ranked on a scale from 1 to 3, with 3 being the most vulnerable (Table 1).
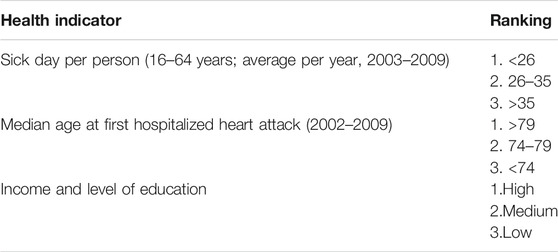
TABLE 1. The three health indicators constituting the health vulnerability map (HVM), ranked from 1 to 3, with 3 representing the highest vulnerability.
The theoretically highest total rank in relation to health vulnerability in the HVM equals 9: “low income and education”, rank 3; >35 “sick days per person”, rank 3; and the “median age at first hospitalized heart attack” <74 years, rank 3. The least vulnerable locations, i.e., the theoretically lowest summarized rank equals 3: “high income and education”, rank 1; “sick days per person” <26, rank 1; and “median age at first hospitalized health attack” >79, rank 1.
The spatially specific health- and socio-economic data for these indicators was derived from two databases, which are compiled and managed on the directive of the Stockholm County Council (SLL): the ODB-database2 and the VAL-database3. The ODB-database contributes information on population- and socio-economic data, while the VAL- database contributes information on consumption of medical care, together with health statistics. The data is anonymized. According to the ODB-database, the city of Stockholm is divided into 419 so-called base areas (“basområden”). Population data4 is used to describe the distribution of people living in each base area (Figure 2).
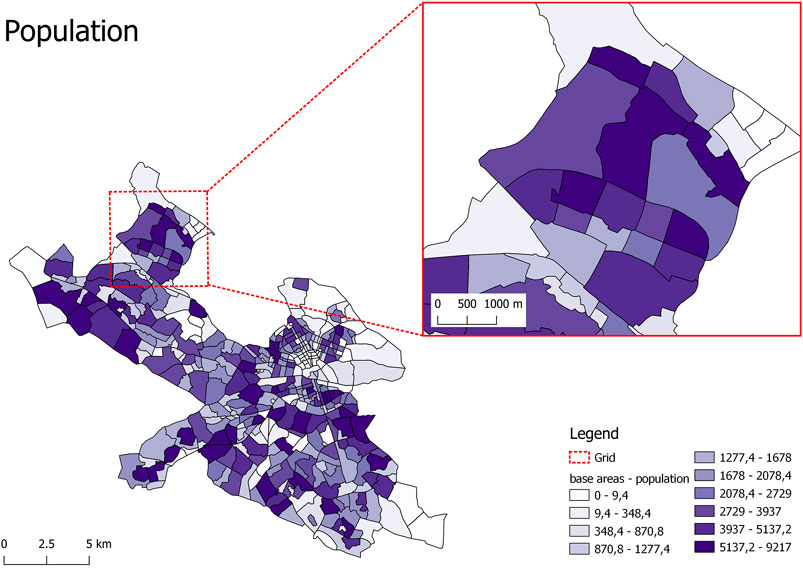
FIGURE 2. Population in each of the 419 base areas in the City of Stockholm. Data derived from the ODB database.
To assess the populations in the 419 base areas in relation to the three included health indicators and also capture the disproportionately positive health effect of urban green area accessibility with regards to populations with low socio-economic status, the following classification was made:
1) base areas with the highest total rank, including a rank 3 in the “income and education” indicator (i.e., groups with low socio-economic status), were classified as “highly vulnerable incl. socio-econ”;
2) base areas with the highest total rank, irrespective of rank in the “income and education” indicator, were classified as “highly vulnerable excl. socio-econ”;
3) base areas with the next highest total rank, including a rank 3 in the “income and education” indicator, were classified as “vulnerable incl. socio-econ”;
4) base areas with the next highest total rank, irrespective of rank in the “income and education” indicator, were classified as “vulnerable excl. socio-econ”; finally, the remaining base areas were classified as “less vulnerable”.
By combining these classes with population data, the total number of people living in each class is calculated.
To assess the green area accessibility of people in the 419 base areas in the City of Stockholm, an urban green accessibility map (UGAM) was constructed. The construction of the accessibility map encompasses multiple steps (Figure 3), entailing the use of a high-resolution satellite image (orthophoto, containing near-IR-spectrum) to create a normalized difference vegetation index (NDVI) map, which, in turn, is linked to all address points using network analysis.
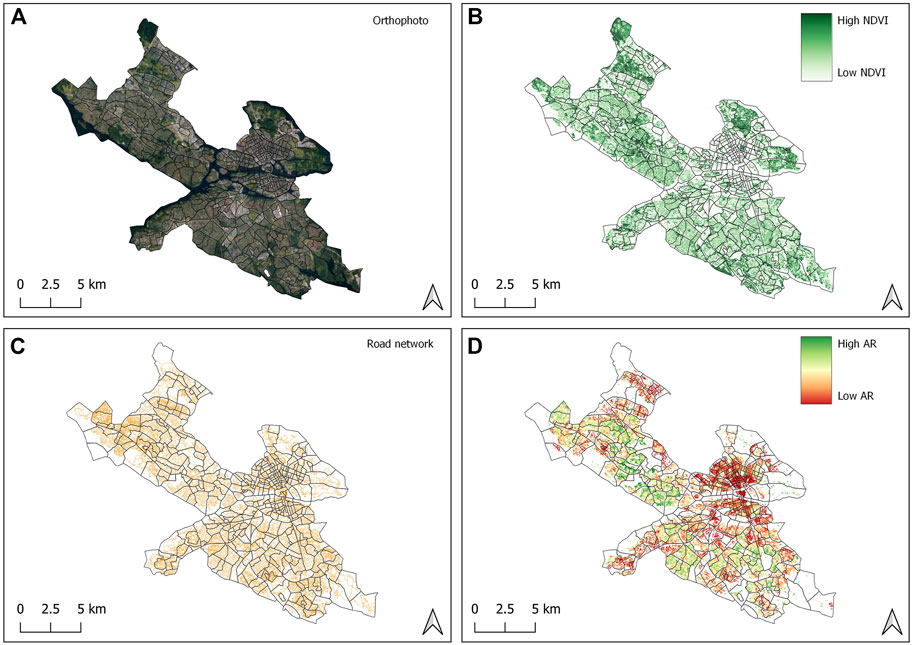
FIGURE 3. Steps towards constructing an urban green accessibility map (UGAM): (A) a high resolution orthophoto (containing IR-spectrum) was used for calculating a normalized difference vegetation index (NDVI); (B) 30 m × 30 m grid cells were created to vectorize the NDVI raster, resulting in a NDVI map with average values between 0,1, and 1; (C) a non-motorized road network was then used as the basis for creating an isochrone around each address point; (D) using 400 m as the distance threshold, the resulting UGAM map is an expression of how much green area is accessible from any given address point within a 5 min walk (400 m), i.e., the attraction reach (AR).
To calculate the NDVI, high resolution satellite imagery (orthophoto) (Figure 3A) provided by the Swedish Mapping, Cadastral and Land Registration Authority (Lantmäteriet) at a resolution of 16 cm × 16 cm was used, cf. Eq. 1.
The resulting map (Figure 3B) thus symbolizes the share of near infrared light out of the total red spectrum, enabling the isolation of areas containing vegetation and has values ranging from −1 to 1 (theoretically). Upon manual inspection of the satellite imagery and comparison with the resulting NDVI, 0,1 was selected as a satisfactory threshold, designating living plant material, such as grass, trees and bushes, while excluding e.g. asphalt, gravel and water. 30 m × 30 m grid cells were then created (Thygesen et al., 2020) to vectorize the NDVI raster, and each grid cell given a value corresponding to the average NDVI in that cell’s area. The resulting NDVI map from this procedure therefore outputs a vectorized map of the study area with average NDVI values above 0, 1.
To calculate accessible NDVI greenness for any given address point, the QGIS plugin PST5 was used, and more specifically, the PST attraction reach function. Attraction Reach calculates, for each object that is defined as origin in the analysis, the sum of all attractions from a set of attraction objects that can be reached via the network within a radius defined by the user. For our purpose, the origins are address points and the vectorized NDVI map is the attraction where each grid cell (centroid) is weighted by the average NDVI value. 400 m is used as distance threshold, creating an isochrone around each address point which equates to roughly 5 min walking distance that people are willing to walk (Gehl, 2010). The non-motorized road network6 (Figure 3C) is used to define these isochrones as it is more accurate than Euclidean buffers using straight line distance (“as the bird flies”). The resulting UGAM (Figure 3D) is thus an expression of how much green area is accessible from any given address point within a 5-min walk (400 m).
To construct an UGAM with a resolution compatible with the HVM (Figure 4), the high resolution UGAM (Figure 3D) was aggregated to the level of base areas by calculating the median values obtained with the PST attraction reach for each of the 419 base areas, hence, constructing an aggregated UGAM.
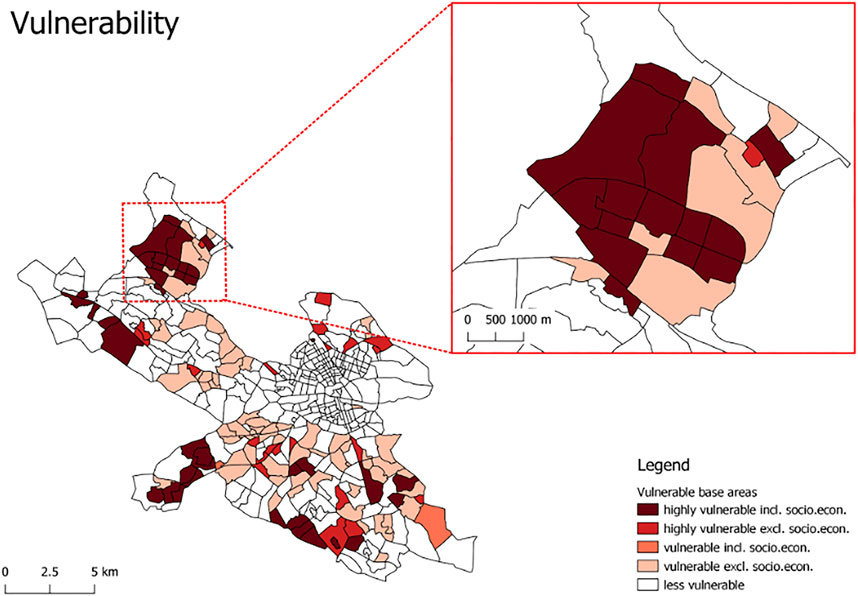
FIGURE 4. In the Health Vulnerability Map (HVM) the 419 base areas in the City of Stockholm are classified in relation to three health indicators, “income and level of education”, “number of sick days per person per year”, and “median age of first hospitalized heart attack”. All indicators are ranked 1–3, where 3 represents the most vulnerable. The two darkest red classes (“highly vulnerable incl. socio econ.” and “highly vulnerable excl. socio econ.”) entails areas with a total rank of 8. “Highly vulnerable incl. socio econ.” includes areas with the lowest socio-economic status (i.e., a rank of 3 in the socio-economic indicator “income and level of education”), while “highly vulnerable excl. socio.econ.” includes areas where the socio-economic rank is > 3.
In order to pinpoint locations where investment in the green infrastructure would make the most sense in the context of closing the health gap from a socio-economic perspective and also contribute to community resilience through improved public health, an urban green opportunity map (UGOM) was constructed by, firstly, reclassifying the base areas using the three datasets introduced above (the population data, the HVM, the aggregated UGAM) and, secondly, selecting base areas which meet all of the following three conditions:
1) a sufficiently high population count, set at > 2000 people, to ensure the relevance of potential greening measures;
2) the most vulnerable people with regards to health, i.e., base areas with the highest total rank in relation to the three included health indicators (using HVM, see Table 1), including the socio-economic indicator at rank 3 (i.e., belonging to the class “highly vulnerable incl. socio-econ”);
3) the lowest accessibility to green areas (using UGAM), set at the lowest third of median accessibility.
The HVM (Figure 4) shows the 419 base areas of the City of Stockholm classified according to health vulnerability with regards to the three health indicators: “income and level of education”; “number of sick days per person per year”; “median age of first hospitalized heart attack”. The highest identified total rank for any base area was 8, while the next highest total rank was 7. Hence, base areas with a total rank <7 constitutes the class “less vulnerable”.
About 134000 people in the City of Stockholm belong to the most vulnerable class, “highly vulnerable incl. socio-econ.”, while 36000 belong to the class “highly vulnerable excl. socio-econ.”. Only about 100 people belong to the class “vulnerable incl. socio-econ.”, while about 179000 people belong to the class “vulnerable excl. socio-econ.”. 558000 people belong to the class “less vulnerable” in relation to the three included health indicators.
The aggregated UGAM (Figure 5) shows the median attraction reach per base area in the City of Stockholm. It shows that many areas with low levels of urban green accessibility are located in the city center, but also that there are many areas in the periphery with low levels of accessibility, such as the base areas in the northwest (see the enlarged section in Figure 5).
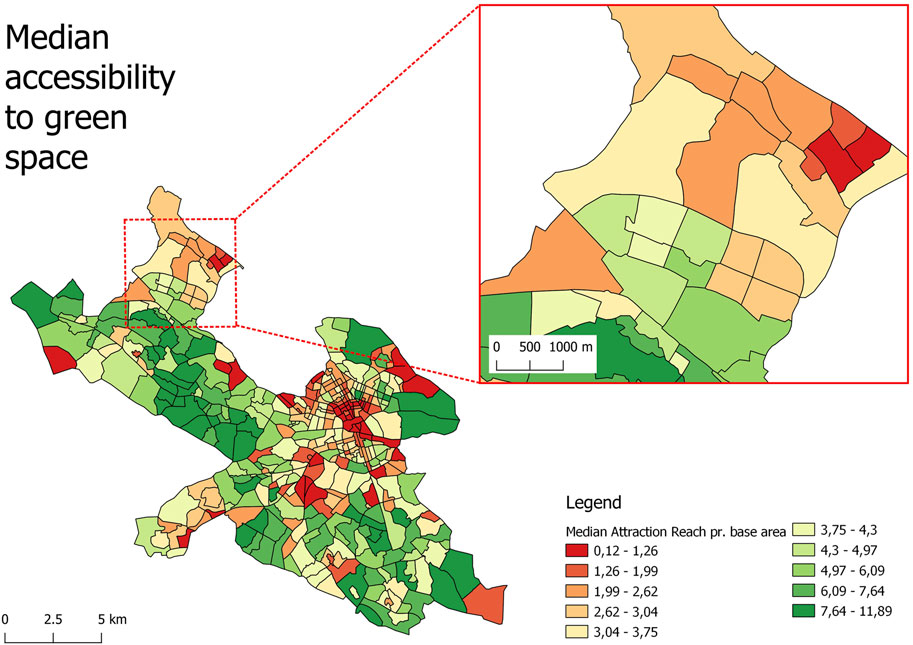
FIGURE 5. The aggregated UGAM shows the median accessibility to green areas within each of the 419 base areas in the City of Stockholm.
The UGOM pinpoints base areas which fulfill the three conditions described in Section 3.3. Using this approach, eight base areas, referred to as focus areas, were identified (Figure 6).
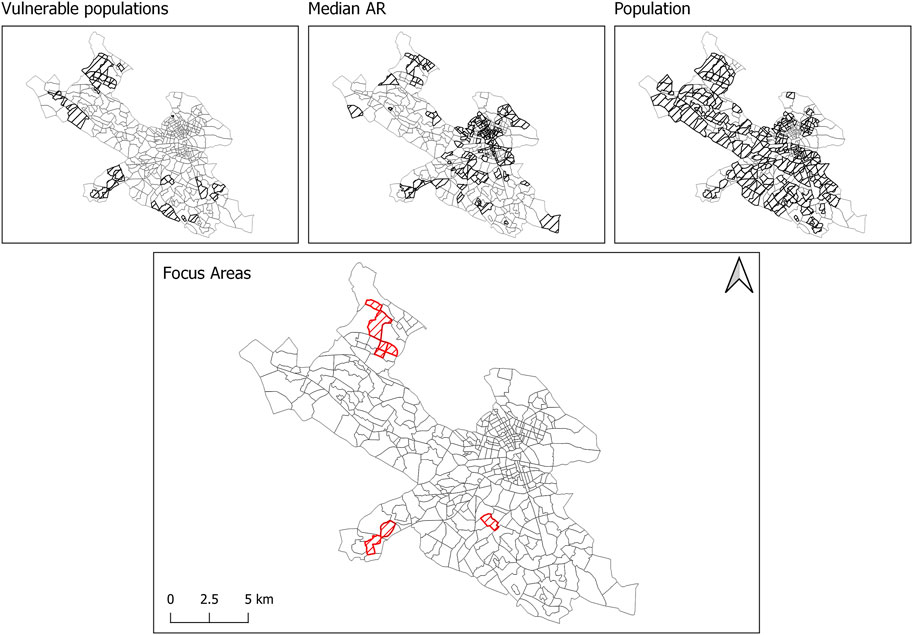
FIGURE 6. Outlined and crosshatched are the base areas in the City of Stockholm that are pinpointed as focus areas, due to fulfilling the following three conditions: (1) having a sufficient population count, i.e., base areas with a population above 2000 people; (2) having the most vulnerable populations with regards to health indicators, i.e., populations classified as “highly vulnerable incl. socio econ.”; and (3) having the lowest third of median accessibility. The three smaller maps are the maps that have provided the information with regards to the three conditions.
Our method aims at identifying locations where investing in green infrastructure will provide health benefits to the highest number of the most vulnerable people with the lowest accessibility to urban green areas. For the case of Stockholm, this resulted in eight identified focus areas (Figure 6). Although providing a good start for identifying where to focus green infrastructure investments, our method provides a first assessment of the green infrastructure accessibility to be included in a future planning strategy. For example, although we, by using network analysis to overcome physical barriers rather than Euclidean buffers, which use straight line distance (“as the bird flies”), are able to be more accurate in the context of assessing accessibility to urban green areas and thus be more precise in geographically prioritizing areas of investments, future planning strategies would benefit from broadening the scope of green area accessibility. Such an expansion could e.g., in addition to physical barriers, also address institutional- and psychological barriers, potentially preventing or restricting access to benefits provided by urban green areas in various ways (Biernacka and Kronenberg, 2019). Institutional barriers can e.g., be related to ownership (public vs. private) (Pelorosso et al., 2021) and psychological barriers can be related to the feeling of safety in moving in urban green areas (Turkseven Dogrusoy and Zengel, 2017). Additional physical barriers located outside, on the boundary and inside urban green area have also been identified (Barber et al., 2021).
Another limitation was that the empirical health indicator data is only available on an aggregated base areas level. This means that, in order not to give a false impression of the health data having a higher resolution than it actually has, an aggregated version of the UGAM (Figure 5) had to be used when pinpointing focus areas (Figure 6). However, once the focus areas have been identified, the high resolution UGAM (Figure 3D) can be used to provide decision makers and planners with additional information on population distribution and variations in green area accessibility within the focus areas (Figure 7). Still, it would be interesting to investigate the potential impact on prioritized locations if more detailed health data was made available.
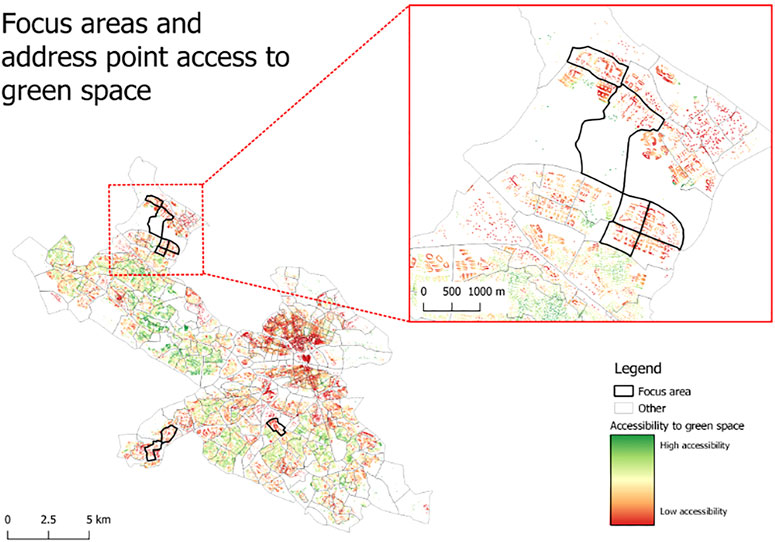
FIGURE 7. To provide policy makers and planners with additional information on population distribution and green area accessibility within focus areas, the eight identified focus areas (i.e., the UGOM) are presented in combination with the high resolution UGAM, showing green area accessibility from any given address point within a 5 min walk (400 m).
In the context of promoting resilient cities, by highlighting the link between the built environment (including the green infrastructure), public health and community resilience, the method also provides an approach for addressing the building of resilience in an urban planning and design context.
Although the data used in this paper is specific for the city of Stockholm, we see no reason why the method itself, which proposes a way to address the urban health gap from a socio-economic perspective using geospatial analysis, could not be applied in other cities, providing adequate basic data is available. However, there are other aspects worth considering. A significant number of studies on the effects of urban green areas on health have been performed mainly in European cities (Mitchell and Popham, 2008; van den Berg et al., 2010; deVries et al., 2013). As such, it is presently unclear to which degree the type of model constructed in this study is applicable to cities beyond Europe. Richardson et al. (2012) have shown that the positive relationship between green space and health is not found in many American cities, presumably because of the different lifestyles that exist in the United States related to, among other factors, high levels of urban sprawl and increased car dependency. It is possible that a minimal threshold of density is necessary for green areas to have any effect on health in urban contexts. Kardan et al. (2015) for example, found evidence of a positive relationship between green space and health in Toronto, Canada, a city whose density is close that of Berlin’s (Larondelle et al., 2014).
Important next steps include investigating the potential for the development of green infrastructure policy and planning, as well as maintenance plans of green infrastructure. In this context, more detailed information on what goes on within and around the focus areas will ultimately be required in order to effectively realize the human health benefits linked to urban green areas. Here, lessons can be learned from the results presented in this paper. For example, when comparing the enlarged sections in Figures 4, 5, there are locations with good accessibility to green areas, but where the population in the base area still exhibit high health vulnerability. This can be due to accessibility to green areas not being the only thing effecting health status. There are e.g., strong indications that not only quantity, but also the quality of the accessible green areas matters. In fact, it has been shown that quality of urban green areas not only matter, but may even be of higher significance than quantity (de Vries et al., 2013). In the context of green area quality with regards to urban form, lots of evidence points to the direction of diverse vegetation forms being more effective in addressing health issues, rather than non-diverse forms, e.g., lawns (Aerts et al., 2018). Another aspect to consider is the distribution of the green infrastructure, where concentrated green areas, such as parks, could have a different health impact than more scattered greenness or linear green elements, such as boulevards (Dong and Liu, 2018; Xiao et al., 2020). Recalling that the NDVI does not assess the configuration of vegetation, but rather only describes presence and density of vegetation, one of the most effective measures for increasing the median attraction reach (AR) for the residents of Stockholm, might not only be the creation of more parks or “centralized” greening measures, but rather a “decentral” regreening along roads and open spaces. However, although a decentral approach might be more effective at increasing the median AR, this opens the discussion of the quality of such greening and whether it has comparable health effect to establishing more dense and central spaces of refuge. Increasing the NDVI values and the AR in general, should therefore not be regarded as a goal in itself, as this does not reflect any qualitative aspects of neither health benefits nor the aesthetic quality of said greening. Another issue influencing planning decisions in this context, is the fact that people move, hence making it difficult to predict the profile of the population that will live in a location at any point in time. This calls for aiming at an approach where all addresses should have good access to green areas, independent of the current population. Thus, the NDVI map and the ability to make frequent analysis of accessibility to green area becomes key.
In this paper, we have tried to address the issue of equality and the promotion of healthy cities for everyone by prioritizing the closing of the health gap from a socio-economic point of view. However, there are undoubtedly additional ways of identifying vulnerable populations within a human health and equality perspective. For example, various immutable characteristics, such as age and gender, have been shown to influence people’s preferences as to how to design urban green areas for realizing health benefits (Ode Sang et al., 2016). Taking such issues into account could potentially change the prioritization as to where and how to invest in the green infrastructure to promote healthy cities for everyone.
Another crucial issue in the context of planning healthy cities for everyone is the relationship between greenness, health, and gentrification processes. However, this requires a longitudinal study and thus data over an extended period of time, which was not available for the study presented in this paper. It has been posited that it is imperative to consider both short- and long term consequences in such planning, when asking who benefits (Cole et al., 2017). The development of green areas may in the short term positively impact disadvantaged population groups, but in the long term may affect housing prices and ultimately result in these groups being forced to leave the neighborhood. If planning measures are to integrate increasingly precise planning opportunities, they should also aim to ensure that those for whom the results are intended also are able to benefit in the long term.
The proposed method provides a basis for urban planners and policymakers to geographically prioritize investments in green infrastructure to contribute to closing the health gap and to promote community resilience through improved public health.
The method can be improved by making it even more precise and powerful in supporting decision makers and planners on the type of green area investments that are needed to contribute to creating resilient and healthy cities for everyone. In this context, we suggest the following: improving the resolution of the health data; apart from quantity, also addressing the quality and distribution of green areas; expanding the issue of accessibility by addressing it in relation to multi layered barriers along institutional-, physical- as well as psychological dimensions; and, finally, analyzing green area preferences in relation to various immutable characteristics.
The original contributions presented in the study are included in the article/Supplementary Material, further inquiries can be directed to the corresponding author.
The work is based on the master thesis of OR, hence he is given first authorship. He has also contributed to the text. AG has coordinated the writing of the paper contributed most to the text and the transformation of the information in the master thesis into a scientific paper. AF has contributed with GIS analysis and creation of the figures, as well as contributing to the text. MB has contributed to the text.
AG’s work has been funded through a research grant (reference number: 2017-00937) received from the Swedish Research Council for Environment, Agricultural Sciences and Spatial Planning (FORMAS). Funding for open access publication fees are kindly provided by the Beijer Institute of Ecological Economics, the Royal Swedish Academy of Sciences, Stockholm, Sweden.
Author OR was employed by company Kairos Future, Stockholm, Sweden.
The remaining authors declare that the research was conducted in the absence of any commercial or financial relationships that could be construed as a potential conflict of interest.
All claims expressed in this article are solely those of the authors and do not necessarily represent those of their affiliated organizations, or those of the publisher, the editors and the reviewers. Any product that may be evaluated in this article, or claim that may be made by its manufacturer, is not guaranteed or endorsed by the publisher.
We wish to thank two reviewers for valuable comments.
1Data sets per municipality for real property location addresses (lantmateriet.se).
2www.regionplanekontoret.sll.se.
4www.dataportal.se/sv/datasets/733_65201/basomraden.
5The plugin is open access and the code is available on https://github.com/SMoG-Chalmers/PST; the documentation is available on https://www.researchgate.net/publication/354118033_PST_Documentation_v323_20210708.
6The non-motorized networks include all streets and paths that are accessible for people walking or cycling, including those that are shared with vehicles. All streets where walking or cycling is forbidden, such as motorways, highways, or high-speed tunnels, are not included in the network. https://snd.gu.se/en/catalogue/study/snd1153.
Aerts, R., Honnay, O., and Van Nieuwenhuyse, A. (2018). Biodiversity and Human Health: Mechanisms and Evidence of the Positive Health Effects of Diversity in Nature and green Spaces. Br. Med. Bull. 127, 5–22. doi:10.1093/bmb/ldy021
Barber, A., Haase, D., and Wolff, M. (2021). Permeability of the City - Physical Barriers of and in Urban green Spaces in the City of Halle, Germany. Ecol. Indicators 125, 107555. doi:10.1016/j.ecolind.2021.107555
Berghauser Pont, M., Ahrné, K., Gren, Å., Kaczorowska, A., and Marcus, L. (2017). Integrating Visibility Graph Analysis (VGA) with Connectivity Analysis. LANDSCAPE ECOLOGY #157.
Biernacka, M., and Kronenberg, J., 2019. Urban green Space Availability Accessibility and Attractiveness and the Delivery of Ecosystem Services Available at: https://digitalcommons.lmu.edu/cate/vol12/iss1/5 12.
Boverket, 2016, 2016. Reviderad Prognos Över Behovet Av Nya Bostäder till 2025 [WWW Document]. Boverket. URL Available at: https://www.boverket.se/sv/om-boverket/publicerat-av-boverket/publikationer/2016/reviderad-prognos-over-behovet-av-nya-bostader-till-2025/(accessed 9.24.21).
Braubach, M., Egorov, A., Mudu, P., Wolf, T., Ward Thompson, C., and Martuzzi, M. (2017). “Effects of Urban Green Space on Environmental Health, Equity and Resilience,” in Nature-Based Solutions to Climate Change Adaptation in Urban Areas: Linkages between Science, Policy and Practice, Theory and Practice of Urban Sustainability Transitions. Editors N. Kabisch, H. Korn, J. Stadler, and A. Bonn (Cham: Springer International Publishing), 187–205. doi:10.1007/978-3-319-56091-5_11
Chandra, A., Williams, M., Plough, A., Stayton, A., Wells, K. B., Horta, M., et al. (2013). Getting Actionable about Community Resilience: The Los Angeles County Community Disaster Resilience Project. Am. J. Public Health 103, 1181–1189. doi:10.2105/AJPH.2013.301270
Colding, J., Gren, Å., and Barthel, S. (2020). The Incremental Demise of Urban Green Spaces. Land 9, 162. doi:10.3390/land9050162
Cole, H. V. S., Garcia Lamarca, M., Connolly, J. J. T., and Anguelovski, I. (2017). Are green Cities Healthy and Equitable? Unpacking the Relationship between Health, green Space and Gentrification. J. Epidemiol. Community Health 71, jech–2017. doi:10.1136/jech-2017-209201
de Vries, S., van Dillen, S. M. E., Groenewegen, P. P., and Spreeuwenberg, P. (2013). Streetscape Greenery and Health: Stress, Social Cohesion and Physical Activity as Mediators. Soc. Sci. Med. 94, 26–33. doi:10.1016/j.socscimed.2013.06.030
Dobers, P., and Hallin, A. (2009). The Use of Internet in Building the Brand of "Stockholm. The Capital of Scandinavia, 265–294. doi:10.4018/978-1-60566-134-6.Ch013
Dong, Y., and Liu, H. (2018). Health-oriented Evaluation of the Spatial Distribution of Urban Green Space in the Wuhan Inner City Area of China. New Forest, UK: Presented at the ECO-ARCHITECTURE 2018, 37–48. doi:10.2495/ARC180041
Folke, C., Jansson, Å., Rockström, J., Olsson, P., Carpenter, S. R., Chapin, F. S., et al. (2011). Reconnecting to the Biosphere. AMBIO 40, 719–738. doi:10.1007/s13280-011-0184-y
Folkhälsomyndigheten, 2019. Folkhälsans Utveckling – Årsrapport 2019 — Folkhälsomyndigheten [WWW Document]. URL Available at: http://www.folkhalsomyndigheten.se/publicerat-material/publikationsarkiv/f/folkhalsans-utveckling-arsrapport-2019/(accessed 9.23.21).
Gehl, J., 2010. Cities for People [WWW Document]. Isl. Press. URL Available at: https://islandpress.org/books/cities-people (accessed 11.22.21).
Gren, Å., Colding, J., Berghauser-Pont, M., and Marcus, L. (2019). How Smart Is Smart Growth? Examining the Environmental Validation behind City Compaction. Ambio 48, 580–589. doi:10.1007/s13280-018-1087-y
Hidaka, B. H. (2012). Depression as a Disease of Modernity: Explanations for Increasing Prevalence. J. Affective Disord. 140, 205–214. doi:10.1016/j.jad.2011.12.036
Kardan, O., Gozdyra, P., Misic, B., Moola, F., Palmer, L. J., Paus, T., et al. (2015). Neighborhood Greenspace and Health in a Large Urban center. Sci. Rep. 5, 11610. doi:10.1038/srep11610
Larondelle, N., Hamstead, Z. A., Kremer, P., Haase, D., and McPhearson, T. (2014). Applying a Novel Urban Structure Classification to Compare the Relationships of Urban Structure and Surface Temperature in Berlin and New York City. Appl. Geogr. 53, 427–437. doi:10.1016/j.apgeog.2014.07.004
Lee, I.-M., Shiroma, E. J., Lobelo, F., Puska, P., Blair, S. N., and Katzmarzyk, P. T. (2012). Lancet Physical Activity Series Working GroupEffect of Physical Inactivity on Major Non-communicable Diseases Worldwide: an Analysis of burden of Disease and Life Expectancy. The Lancet 380, 219–229. doi:10.1016/S0140-6736(12)61031-9
Littke, H. (2015). Planning the Green Walkable City: Conceptualizing Values and Conflicts for Urban Green Space Strategies in Stockholm. Sustainability 7, 11306–11320. doi:10.3390/su70811306
Mackenbach, J. P., and Bakker, M. J. (2003). European Network on Interventions and Policies to Reduce Inequalities in HealthTackling Socioeconomic Inequalities in Health: Analysis of European Experiences. The Lancet 362, 1409–1414. doi:10.1016/S0140-6736(03)14639-9
Markevych, I., Thiering, E., Fuertes, E., Sugiri, D., Berdel, D., Koletzko, S., et al. (2014). A Cross-Sectional Analysis of the Effects of Residential Greenness on Blood Pressure in 10-year Old Children: Results from the GINIplus and LISAplus Studies. BMC Public Health 14, 477. doi:10.1186/1471-2458-14-477
Marmot, M. (2017). Closing the Health gap. Scand. J. Public Health 45, 723–731. doi:10.1177/1403494817717433
Mcallister, T. P. (2016). Community Resilience: The Role of the Built Environment, 533–548. doi:10.1007/978-3-319-29713-2_24
Mitchell, R., and Popham, F. (2008). Effect of Exposure to Natural Environment on Health Inequalities: an Observational Population Study. The Lancet 372, 1655–1660. doi:10.1016/S0140-6736(08)61689-X
Morton, M. J., and Lurie, N. (2013). Community Resilience and Public Health Practice. Am. J. Public Health 103, 1158–1160. doi:10.2105/AJPH.2013.301354
Nowak, D. J., Crane, D. E., and Stevens, J. C. (2006). Air Pollution Removal by Urban Trees and Shrubs in the United States. Urban For. Urban Green. 4, 115–123. doi:10.1016/j.ufug.2006.01.007
Ode Sang, Å., Knez, I., Gunnarsson, B., and Hedblom, M. (2016). The Effects of Naturalness, Gender, and Age on How Urban green Space Is Perceived and Used. Urban For. Urban Green. 18, 268–276. doi:10.1016/j.ufug.2016.06.008
Pelorosso, R., La Rosa, D., Floris, S., and Cerino, N. (2021). “Planning Accessible Urban Green Infrastructure for Healthy and Fair Historical Towns: The Study Case of Viterbo, Central Italy,” in Innovation in Urban and Regional Planning. INPUT 2021. L, Ecture Notes in Civil Engineering. Editors D. La Rosa, and R. Privitera (Springer), 43–51. doi:10.1007/978-3-030-68824-0_5
Richardson, E. A., Mitchell, R., Hartig, T., de Vries, S., Astell-Burt, T., and Frumkin, H. (2012). Green Cities and Health: a Question of Scale. J. Epidemiol. Community Health 66, 160–165. doi:10.1136/jech.2011.137240
Sallis, J. F., Cerin, E., Conway, T. L., Adams, M. A., Frank, L. D., Pratt, M., et al. (2016). Physical Activity in Relation to Urban Environments in 14 Cities Worldwide: a Cross-Sectional Study. The Lancet 387, 2207–2217. doi:10.1016/S0140-6736(15)01284-2
Seto, K. C., Fragkias, M., Güneralp, B., and Reilly, M. K. (2011). A Meta-Analysis of Global Urban Land Expansion. PLOS ONE 6, e23777. doi:10.1371/journal.pone.0023777
Smith, J. P. (2007). The Impact of Socioeconomic Status on Health over the Life-Course. J. Hum. Resour. XLII, 739–764. doi:10.3368/jhr.XLII.4.739
Stigsdotter, U. K., Ekholm, O., Schipperijn, J., Toftager, M., Kamper-Jørgensen, F., and Randrup, T. B. (2010). Health Promoting Outdoor Environments - Associations between green Space, and Health, Health-Related Quality of Life and Stress Based on a Danish National Representative Survey. Scand. J. Public Health 38, 411–417. doi:10.1177/1403494810367468
Stockholm Anslagstavla Facebook LinkedIn Instagram Youtube Twitter, 2018. Regional Utvecklingsplan För Stockholm, RUFS 2050 [WWW Document]. URL Available at: https://www.sll.se/verksamhet/Regional-utveckling/strategier-och-planer-inom-regional-utveckling/rufs-2050/ (accessed 9.24.21).
Stockholm County Council ätt iresa, R., din, P., sjukresor, F. O., webbplatsen, O., nyheter, P., and cookies, O. (2018). Tillgänglighetsredogörelse, Telefon: 08-737 25 00,cmVnaW9uc3RvY2tob2xtQHNsbC5TZSw= E. -post.
,+regionstockholm@sll.Se,+E.+-post&btnG=">Google Scholar
Stockholm Stad, 2020, Statistisk Årsbok - Stockholms Stad [WWW Document]. URL Available at: https://start.stockholm/om-stockholms-stad/utredningar-statistik-och-fakta/statistik/statistisk-arsbok/(accessed 9.24.21).
Sundquist, K., Frank, G., and Sundquist, J. (2004). Urbanisation and Incidence of Psychosis and Depression. Br. J. Psychiatry 184, 293–298. doi:10.1192/bjp.184.4.293
Thygesen, M., Engemann, K., Holst, G. J., Hansen, B., Geels, C., Brandt, J., et al. (2020). The Association between Residential Green Space in Childhood and Development of Attention Deficit Hyperactivity Disorder: A Population-Based Cohort Study. Environ. Health Perspect. 128, 127011. doi:10.1289/EHP6729
Türkseven Doğrusoy, İ., and Zengel, R. (2017). Analysis of Perceived Safety in Urban Parks: A Field Study in Büyükpark and Hasanağa Park. Metu Jfa 34. doi:10.4305/METU.JFA.2017.1.7
United Nations, Department of Economic and Social Affairs, Population Division (2019). World Urbanization Prospects: The 2018 Revision.
van den Berg, A. E., Maas, J., Verheij, R. A., and Groenewegen, P. P. (2010). Green Space as a Buffer between Stressful Life Events and Health. Soc. Sci. Med. 70, 1203–1210. 1982. doi:10.1016/j.socscimed.2010.01.002
Villeneuve, P. J., Jerrett, M., G. Su, J., Burnett, R. T., Chen, H., Wheeler, A. J., et al. (2012). A Cohort Study Relating Urban green Space with Mortality in Ontario, Canada. Environ. Res. 115, 51–58. doi:10.1016/j.envres.2012.03.003
Ward Thompson, C., Roe, J., Aspinall, P., Mitchell, R., Clow, A., and Miller, D. (2012). More green Space Is Linked to Less Stress in Deprived Communities: Evidence from Salivary Cortisol Patterns. Landscape Urban Plann. 105, 221–229. doi:10.1016/j.landurbplan.2011.12.015
Keywords: closing the health gap, community resilience building, equal cities, green area accessibility, healthy cities, resilience in the built environment, resilient cities, sustainable urban planning
Citation: Rostang O, Gren A, Feinberg A and Berghauser Pont M (2021) Promoting Resilient and Healthy Cities for Everyone in an Urban Planning Context by Assessing Green Area Accessibility. Front. Built Environ. 7:797179. doi: 10.3389/fbuil.2021.797179
Received: 18 October 2021; Accepted: 23 November 2021;
Published: 17 December 2021.
Edited by:
Shu-Li Huang, National Taipei University, TaiwanReviewed by:
Raffaele Pelorosso, University of Tuscia, ItalyCopyright © 2021 Rostang, Gren, Feinberg and Berghauser Pont. This is an open-access article distributed under the terms of the Creative Commons Attribution License (CC BY). The use, distribution or reproduction in other forums is permitted, provided the original author(s) and the copyright owner(s) are credited and that the original publication in this journal is cited, in accordance with accepted academic practice. No use, distribution or reproduction is permitted which does not comply with these terms.
*Correspondence: Asa Gren, YXNhLmdyZW5AYmVpamVyLmt2YS5zZQ==
Disclaimer: All claims expressed in this article are solely those of the authors and do not necessarily represent those of their affiliated organizations, or those of the publisher, the editors and the reviewers. Any product that may be evaluated in this article or claim that may be made by its manufacturer is not guaranteed or endorsed by the publisher.
Research integrity at Frontiers

Learn more about the work of our research integrity team to safeguard the quality of each article we publish.