 R. S. McLeod
 M. Mathew2
- 1Institute of Building Physics, Services and Construction, Graz University of Technology, Graz, Austria
- 2Grune Designs, Mumbai, India
- 3Department of Chemistry, Loughborough University, Loughborough, United Kingdom
Young people spend extended periods of time in educational buildings, yet relatively little is known about the air quality in such spaces, or the long-term risks which contaminant exposure places on their health and development. Although standards exist in many countries in relation to indoor air quality in educational buildings, they are rarely subject to detailed post-occupancy evaluation. In this study a novel indoor air quality testing methodology is proposed and demonstrated in the context of assessing the post-occupancy performance of a recently refurbished architecture studio building at Loughborough University, United Kingdom. The approach used provides a monitoring process that was designed to evaluate air quality in accordance with United Kingdom national guidelines (Building Bulletin 101) and international (WELL Building) standards. Additional, scenario-based, testing was incorporated to isolate the presence and source of harmful volatile organic compounds, which were measured using diffusive sampling methods involving analysis by thermal desorption - gas chromatography - mass spectrometry techniques. The findings show that whilst the case-study building appears to perform well in respect to existing national and international standards, these guidelines only assess average CO2 concentrations and total volatile organic compound limits. The results indicate that existing standards, designed to protect the health and wellbeing of students, are likely to be masking potentially serious indoor air quality problems. The presence of numerous harmful VOCs found in this study indicates that an urgent revaluation of educational building procurement and air quality monitoring guidelines is needed.
Introduction
Air pollution exerts one of the largest single impacts on human health and life expectancy (Kelly and Fussell, 2015; Health Effects Institute, 2019). Current estimates suggest that around 5 million premature deaths occur each year as a result of indoor and outdoor air pollution (Health Effects Institute, 2019). Although global mortality rates have declined over the past decade, largely due to the tightening of air pollution legislation in China, the impacts of air pollution are not confined to developing economies. Recent research has shown that ambient air pollution in Europe is responsible for a much greater mortality factor than previously assumed. Around 800,000 deaths each year are directly attributed to air pollution in Europe (EU-28) with the mean loss of life expectancy (LLE) estimated at 2.2 years (Lelieveld et al., 2019). Cardiovascular disease (CVD) (including myocardial infarctions, strokes, hypertension, diabetes, and atherosclerosis) comprises the majority of air pollution induced morbidity and mortality (Münzel et al., 2018). In the USA, ambient air pollution emission levels have dropped steadily since the 1970s as a result of the Clean Air Act (US EPA, 2019). Despite this progress, a recent report by the American Lung Association (ALA, 2020) highlighted that nearly 50% of all Americans inhabit counties with unhealthy levels of ozone and/or particulate pollution.
Indoor air quality (IAQ) is a term used to encompass the ‘physical, chemical and biological characteristics of air in the indoor environment and its relation to the occupant’s physical and psychological heath, comfort and productivity’ (Klepeis et al., 2001; Riggs, 2014). The importance of investigating the causes of poor IAQ in (Fanger, 2006; Riggs, 2014) diverse contexts cannot be overstated in light of the fact that, in developed countries, humans spend more than 90% of their time (on average) indoors (Riggs, 2014; ALA, 2020).
In many contexts indoor air has been routinely found to be more contaminated than outdoor air, since it contains additional pollutants emitted from building materials, consumer products and human activities (Klepeis et al., 2001; Chan, 2002; Chen and Zhao, 2011; Li et al., 2017).
Indoor Air Quality Within Educational Buildings
The topic of IAQ in educational buildings is of particular importance because children and young adults spend more time in educational institutions than in any other indoor environment except their home (Bakó-Biró et al., 2012). Furthermore, children and adolescents are known to be particularly susceptible to poor air quality (Yang et al., 2009) since they breathe large volumes of air relative to their body weights, at a stage when their tissues and organs are still developing (RCP, 2016). Documented health impacts associated with educational buildings, include allergies, asthma, airway hyper-reactivity and cardio vascular disease (Carrer et al., 2002; Kim et al., 2007; Cochran Hameen et al., 2020). Moreover, the consequences of poor IAQ in the educational setting are not confined to students, with two US occupational health studies showing that educational employees have the highest prevalence of work related asthma of any single occupation (Fletcher et al., 2006; Mazurek et al., 2008). Beyond these direct health impacts, poor IAQ has been shown to impact student productivity and performance (Bakó-Biró et al., 2012), thereby degrading the learning environment and impacting upon academic attainment and wellbeing (Carrer et al., 2002; Yang et al., 2009; Bakó-Biró et al., 2012; RCP, 2016).
One of the largest studies of indoor air quality (IAQ) and sick building syndrome (SBS) in European schools to date (the SINPHONIE study) (Baloch et al., 2020) collected qualitative data from over 7,000 children and 319 teachers in order to ascertain both the physical and perceived characteristics of classrooms and the school environment in general. The study was supported by quantitative analysis of key air pollutants and other environmental factors drawn from 115 schools in 54 cities across 23 European countries. The contaminants analysed included: Volatile Organic Compounds (VOCs) (μg/m3), Particulate Matter (PM) 2.5, Carbon Monoxide (CO) (ppm), Ozone, and Radon (Bq/m3). The study concluded that European school children are exposed to a wide variety of harmful air pollutants at levels well above those recommended by national and international standards and this was found to be adversely associated with various health outcomes. Despite its breadth, the study was limited by the use of relatively short-term measurements of key indoor air pollutants (IAPs), which might not be representative of long-term exposure levels (Baloch et al., 2020). A similar cross-sectional study carried out in the US Midwest (in 2017) compared the VOC concentrations in high performance elementary schools to conventional school buildings. The study (Zhong et al., 2017) identified 24 different VOC species indoors but found no systematic differences between high performance (EnergyStar and LEED certified buildings) and conventional schools.
Educational buildings, like any other building, must comply with national building regulations; however, the functional requirements of such regulations are often drafted in broad terms. For this reason, government regulatory bodies typically issue guidance documents demonstrating practical ways with which to achieve compliance with the regulations. In England and Wales these are known as Approved Documents (ADs), with ADF (HM Government, 2015) providing guidance on ventilating buildings. Requirement F1 (1), from Part F of Schedule 1 to The Building Regulations 2010, states: “There shall be adequate means of ventilation provided for people in the building” (HM Government, 2000). In relation to schools and educational buildings ADF states that, “Ventilation provisions in schools can be made in accordance with the guidance in Building Bulletin 101” and that “Building Bulletin 101 can also be used as a guide to the ventilation required in other educational buildings such as further education establishments…”, (Education and Skills Funding Agency, 2018). Thus, although intended primarily for schools, Building Bulletin 101 (BB101) has been widely adopted in the further education and higher education sectors, in the absence of more specific guidance. Building Bulletins address the whole indoor environment and have evolved over time (Figure 1) in response to emerging evidence regarding issues such as the risk of overheating (McLeod and Swainson, 2017) and poor IAQ in schools, with the most recent guidance being published in BB101 (2018) (Education and Skills Funding Agency, 2018).
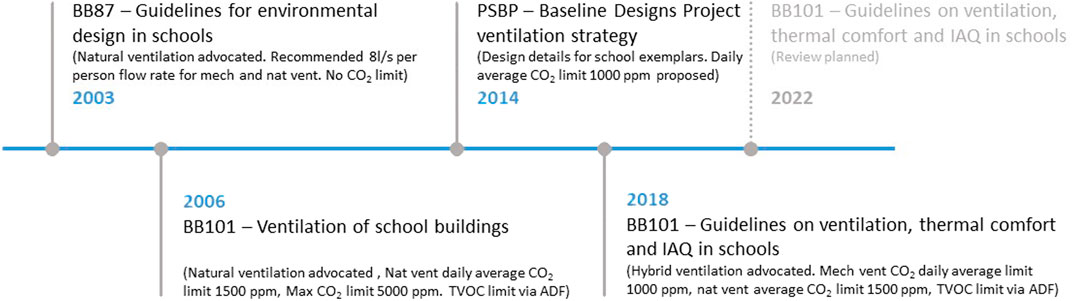
FIGURE 1. Timeline showing the evolution of ventilation design standards in UK schools.
CO2 is a metabolic by-product of cellular respiration and is recognised as a contaminant at elevated room concentrations (Jacobson et al., 2019). Although relatively high levels of CO2 exposure pose no imminent danger to health, they are known to reduce concentration thereby decreasing the academic performance of students (Mendell et al., 2013; Jacobson et al., 2019) whilst also increasing absenteeism (Shendell et al., 2004). Since CO2 concentration varies as a function of the occupancy level and air change rate it has been widely adopted as an indicator of ventilation effectiveness in buildings. According to European Standard EN16798-1:2019 (CEN, 2019) indoor CO2 levels of 550, 800 and 1,350 ppm above the outdoor concentration, correspond to Categories I; II; III and IV respectively for High; Medium; and Moderate/Low levels of expectation, in terms of IAQ. The recommended United Kingdom Department for Education (DfE) design targets for CO2 levels set in BB101 correspond to category II (Medium expectation) of EN16789 for mechanically ventilated buildings, with an allowance for category III for part of the time if natural and hybrid ventilation systems are used (Education and Skills Funding Agency, 2018).
Current ventilation standards referred to in the building codes of Europe, North America and elsewhere, have largely been formulated on the basis of establishing minimum ventilation rates to dilute bio effluents (i.e. unpleasant odours) in order to mitigate the risks of occupant discomfort (Carrer et al., 2018). In practice this means that IAQ control in guidance documents such as EN16798 (CEN, 2019), ADF (HM Government, 2015) Building Bulletin (BB)101 (Education and Skills Funding Agency, 2018), ASHRAE 62.1 (ASHRAE, 2019) and the International WELL Building Standard (International WELL Building Institute, 2020a) describe threshold limit values (TLVs) for CO2 based on achieving the minimum fresh air flow rates needed to dilute gaseous contaminants. As a result, IAQ control strategies in modern mechanically ventilated buildings have relied largely on the use of demand control ventilation (DCV) regulated according to the CO2 concentration within a space (Awbi, 2003).
A strong correlation has been demonstrated between the air change rates in schools (which are significantly associated with CO2 concentrations) and the resultant indoor environmental quality (IEQ) (Zhong et al., 2019). Despite this fact a growing number of studies (Shaughnessy et al., 2006; Haverinen-Shaughnessy et al., 2011; Turunen et al., 2013) have criticised the use of CO2 as a single proxy indicator of air quality on the basis that it ignores the role of harmful contaminants released from the building fabric, furnishings, appliances and consumer products within the building envelope. Furthermore, it is well established that the indoor environment consists of various pollutants whose concentration indoors depends upon numerous factors (Jacobson et al., 2019), including:
• Volume of air contained in the indoor space
• Rate of production of each pollutant
• Rate of release of each pollutant
• Rate of removal of the pollutant from the air via reaction or settling
• Rate of air exchange with the outside air
• Quality of the outside air
From this perspective, the precise ventilation rate needed (using a contaminant dilution approach) to maintain acceptable levels of pollutants in a building is difficult to determine and is likely to vary over time. This is further compounded by the fact that the combined effect of two (or more) pollutants (A and B) can be synergistic (C > A + B), additive (C = A + B), antagonistic (C < A + B) or independent (Turunen et al., 2013; Gaihre et al., 2014). Thus, dilution using outside air is not always sufficient in improving IAQ in buildings, and in many contexts it may actually increase indoor air pollutants (Chan, 2002; Chen and Zhao, 2011; Carrer et al., 2018).
In recent decades a number of additional drivers have impacted upon the IAQ in educational buildings. The evolution of teaching pedagogy towards active learning and learner-centred teaching processes (Freeman et al., 2014) coupled with economic constraints led to the 1960s and 70s being characterised by ‘open-plan’ classrooms. This trend towards fewer but larger classrooms has continued to this day (Wall et al., 2008). Overcrowding has become an ever increasing problem for United Kingdom universities, as many universities have resorted to over-subscribing their courses in order to increase tuition-fee income (Boscott, 2020) with university applications currently at record levels (Weale, 2020). Alongside these transitions, the successive tightening of national building regulations and the introduction of the Energy Performance of Buildings Directive (2010/31/EU) (The European Parliament and The Council of the European Union, 2010) has driven improvements in the energy performance of educational buildings across the EU. It is estimated that these legislative drivers may have led to a substantial reduction in school ventilation rates, with a corresponding increase in the concentration of some indoor air pollutants (Stranger et al., 2015). The compounding nature of these issues suggests that much clearer guidance is needed when new build and refurbishment measures are undertaken in educational buildings.
Volatile Organic Compounds
According to Yu and Crump (Yu and Crump, 1998) the incorporation of new building materials in energy-efficient building refurbishment can have a significant impact on IAQ for prolonged periods (in some cases beyond 2 years) mainly due to the off-gassing of a wide range of Volatile Organic Compounds (VOCs). VOC concentrations are typically much higher indoors compared to outdoors due to the multitude of potential sources (Brown et al., 1992; Guo et al., 2004; Lee et al., 2005), restricted internal dilution volumes and relatively low air change rates (Brown et al., 1992; The European Parliament and The Council of the European Union, 2010; Weale, 2020). Cross sectional studies, such as the pan-European OFFICAIR study (Campagnolo et al., 2017) have shown (in the context of office buildings) that the most prevalent sources of VOCs, including aldehydes, can be directly linked to building materials (e.g. carpet, flooring, paints etc).
The temporal profile of VOCs in buildings is highly dynamic in nature, this is because building materials can act as emission sinks before subsequently becoming secondary sources as they reemit adsorbed chemicals (ASHRAE, 2017; Lucattini et al., 2018). Indoor climatic characteristics (including temperature and relative humidity) have been shown to be important determinants of VOC and aldehyde concentrations (Spinazzè et al., 2020). Whilst adsorption processes may temporarily lead to lower peak concentrations, the subsequent desorption process prolongs the presence of indoor air pollutants (ASHRAE, 2017; US EPA, 2020). Thus, the type of materials and compounds and the environmental conditions present in a given space can greatly influence the rate of adsorption and desorption, which can be visualised in time dependency profiles (Figure 2).
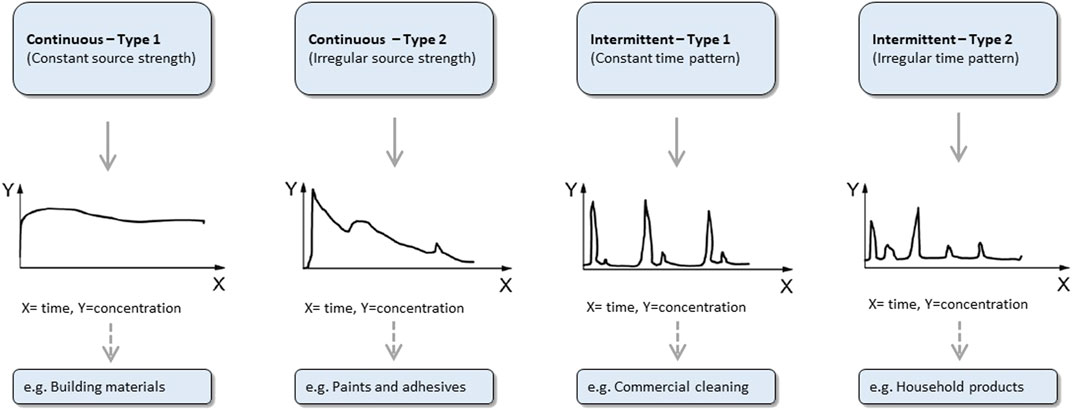
FIGURE 2. Characterisation of the time dependency of VOC emissions according to source type (British Standards Institution, 2007; Spinazzè et al., 2020).
Individual VOC concentrations depend upon the presence or absence of an extremely wide range of potential emission sources and sinks (Seifert and Ullrich, 1987; British Standards Institution, 2007; ASHRAE, 2017). Identification and quantification of all of the individual VOCs found in the indoor air is currently limited as the knowledge base is still sparse (Wolkoff and Nielsen, 2001). BB101 acknowledges that “VOCs can present a risk to the health and comfort of occupants…and can adversely affect children particularly those in vulnerable groups (for example, those that suffer asthma and allergies)” (Education and Skills Funding Agency, 2018). However, it goes on to state that, “At the levels found in school buildings their most likely health effect is short-term irritation of the eyes, nose, skin and respiratory tract” (Education and Skills Funding Agency, 2018). BB1010 makes a number of recommendations in relation to VOCs suggesting that potentially harmful emissions can be reduced by avoiding or eliminating the sources of pollutants (e.g., by the careful selection of materials) however it stops short of providing specific recommendations for VOC monitoring or sampling. Some air quality guidelines, including AD F of the United Kingdom Building Regulations (HM Government, 2015), advocate using the simplified method of assessing total volatile organic compounds (TVOC) rather than individual values. As a result TVOC concentrations above 300
Despite the popularity of their usage, the basis for using CO2 and TVOC as proxy indicators of acceptable IAQ in buildings remain poorly established. According to the Royal College of Physicians CO2 and TVOC are, “not indicators of potential health effects but rather of problems with ventilation that could lead to health effects” (RCP, 2016, p23). This distinction is important in the context of the standards used to benchmark the safety and acceptability of IAQ in educational buildings. Numerous longitudinal studies have shown that TVOC concentrations display a strong temporal dependency following the completion of new and renovated buildings (Holøs et al., 2019; Persson et al., 2019; Suzuki et al., 2019). Mysen et al. (2003) and Wachenfeldt et al. (2007) proposed that for buildings such as schools and offices indoor air pollution could be successfully controlled using demand-controlled mechanical ventilation. A meta-analysis of longitudinal studies carried out by Holøs et al., 2019) confirmed that whilst the rate of ventilation has no significant impact on emission rates it can be fundamental to controlling airborne contaminant concentrations. In line with this observation European Norm EN16798-1 notes that, “the dilution required for reducing the health risk from a specific air pollutant shall be evaluated separately from the ventilation rates required to obtain a desired perceived air quality level. The highest of these ventilation rate values shall be used for the design. If critical sources are identified for health, it shall be checked that they remain below the health threshold values” (Jacobson et al., 2019). However, in the context of non-residential buildings EN16798-1 states that, “For the design of ventilation systems and calculation of design heating and cooling loads, the design ventilation rate shall be specified based on national requirements…“. Therefore, in the context of United Kingdom educational buildings the national requirements set out in ADF and BB101 take precedence over EN16798-1. Ignoring legislative constraints, in practice the success of such a strategy would require knowledge of the local emission rates of all harmful pollutants. Despite such realisations little has been published in the way of detailed guidance for the detection and control of indoor air contaminants within educational buildings and in particular protocols to limit elevated rates of harmful off-gassing in newly built and refurbished buildings.
The following research was conducted in order to shed light on the implications of current IAQ guidance in the context of United Kingdom educational buildings. An action research case study involving IAQ monitoring in a United Kingdom university building, which had undergone extensive refurbishment, in accordance with ADF of the United Kingdom Building Regulations (and therein BB101) is used to explore these issues. The aim of this work is to assess the post-completion IAQ of this building under operational conditions (6–12 months post-completion) in order to evaluate whether the design methodology in BB101, with respect to the identification and management of indoor air contaminants, is adequate to mitigate impaired academic performance as well as potential long terms health effects.
Methods
The primary focus of this paper is on demonstrating a robust and replicable methodology to address the shortfalls of existing IAQ standards in educational buildings and for this reason a single building was chosen as a pilot case-study. Although no single building can ever be considered representative of the entire education stock from an IAQ perspective, most United Kingdom school, college and university new build and refurbishment projects are procured through procurement partnership frameworks (Crowe et al., 2013). This means that there are a limited number of suppliers registered on any given procurement framework which can bid for a contract, with the result that similar construction materials and products are widely used in educational buildings on a regional and national basis. The purpose of this case study is therefore illustrative, in order to highlight the application of the methodology in relation to current IAQ standards, rather than to generalise more widely about the specific findings.
In order to assess the implications of BB101 and current United Kingdom legislative guidance, in the context of a refurbished educational building, a broad IEQ monitoring strategy was developed which involved monitoring of the dry bulb temperature, globe temperature, relative humidity, ventilation flow rates as well as IAQ parameters. Since the focus of this paper is on the IAQ aspects of this campaign, the methods will discuss only these aspects, which consisted of monitoring CO2 concentrations at multiple locations and conducting discrete diffusive (passive) air sampling in an attempt to identify the VOCs present in the space. This approach provided the potential to investigate CO2 concentrations at a relatively high spatial and temporal resolution as well as to detect a wide range of VOCs. The presence of other potentially harmful contaminants, such as particulates, were not addressed in this study, as they are predominantly introduced via the outside air (and combustion and particulate generating activities do not occur inside this building) (Riley et al., 2002). Furthermore, the outdoor air brought in via the ventilation system was not directly studied as this would have required repeated long-term sampling in the proximity of the building to establish the repeated presence and sources of any external contaminants identified (which would typically be conducted over an extended period, to capture both the cold and warm periods of the year). Thus, the following methodology was adopted in order to evaluate whether the application of BB101 in this context was sufficiently robust to provide good quality ventilation and avoid VOC exposure which might pose a health risk to the occupants.
Case Study Building
The recently refurbished Keith Green Building (Figure 3, left) serves as one of the main teaching buildings for the School of Architecture at Loughborough University in the United Kingdom Midlands. The open studio space located on the first-floor space is designed to house a maximum of 100 architecture students (Figure 3, right) engaged in studio-based (i.e., design and model building) activities. The nature of undergraduate architecture degree programmes means that the space was not occupied at full capacity for a typical 8-h working day, but rather it was intermittently occupied for continuous periods (sometimes up to 24 h per day) in accordance with project submission deadlines. The open studio space was identified for the IAQ monitoring campaign in this study after strong odours (characteristic of VOC off-gassing) were noted to persist several months after completion of refurbishment works, in August 2017. This led to occupants resorting to opening windows for extended periods, in an attempt to purge ventilate, as the mechanical ventilation system was unable to reduce the presence of the odours.
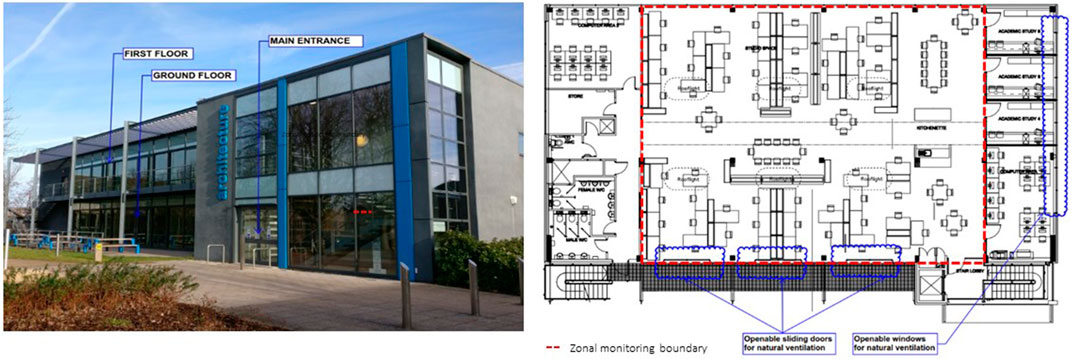
FIGURE 3. Keith Green Building, School of Architecture, Loughborough University (left) and First Floor Open Studio space used for the IAQ monitoring campaign (right).
Heating to the first-floor open studio space is provided via a low temperature hot water (LTHW) trench heating system, which is turned off during the summer months. The open studio space is mechanically ventilated using a ducted variable air volume (VAV) supply and extract ventilation system which is controlled by a building energy management system (BEMS) based on the CO2 concentration in the space (Figure 4). The recommended ventilation rate in BB101 is 5–8 L/s per occupant, although it is noted that, “Higher ventilation rates may be required for practical activities, such as science, design and technology and food technology” (Education and Skills Funding Agency, 2018). Based on the maximum design occupancy of 100 people and a zonal volume of approximately 940 m3 (Figure 4) the ventilation system would be expected to deliver 2-3 air change per hour (ACH) when the building was fully occupied.
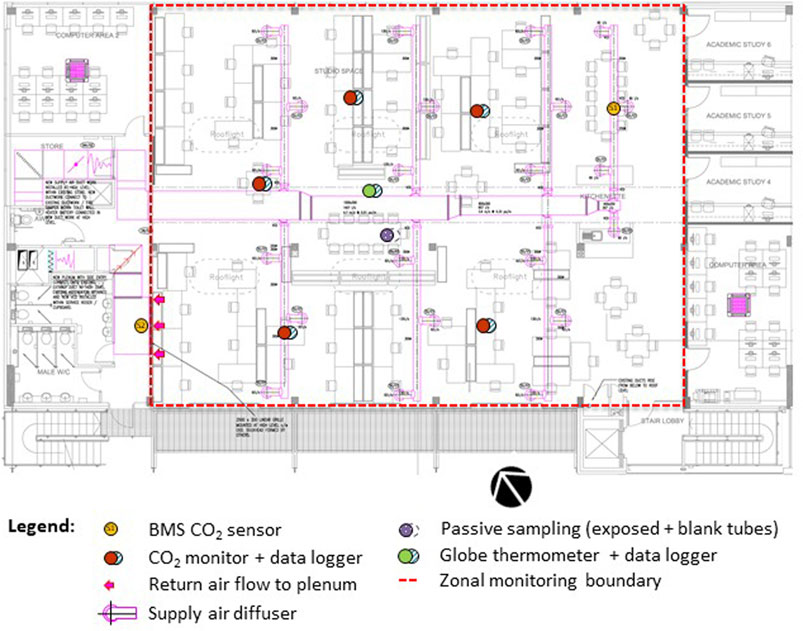
FIGURE 4. First-floor plan showing ventilation ductwork layout (magenta) and the positions of monitoring and sampling devices.
Indoor Air Quality Monitoring Devices - Location Plan
The location of the monitoring and sampling devices in the first-floor open studio space can be seen in Figure 4. VOC sampling took place in the centre of the open-plan room at table height, where the air is likely to be well mixed and sufficiently far away from the ventilation supply and extract terminals to avoid local influences. Five stand-alone CO2 sensors were dispersed in an approximately equidistant constellation to capture local variations in the CO2 concentration at desk height, whilst the BEMS CO2 sensors were located at opposite sides of the space (in predetermined locations as specified by the mechanical ventilation system supplier). A detailed description of the indoor environmental variables that were measured with these devices is provided in Table 1.
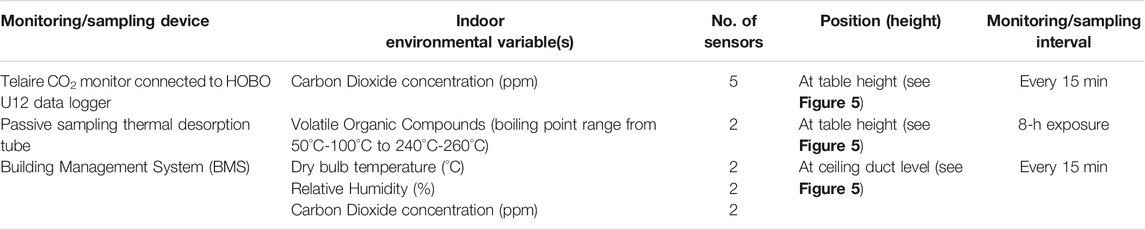
TABLE 1. Monitoring and sampling devices - summary of measured variables, location and sampling intervals.
CO2 Monitoring Scenarios and Objectives
Monitoring of the CO2 levels within the space was assessed in accordance with current United Kingdom guidelines and the international WELL building standard. In addition to the general ventilation requirements of Section 6 of AD F, the United Kingdom Department for Education (DfE) has, via BB101, set the following performance standards for teaching and learning spaces which are intended to ensure compliance with Regulation 6 (Ventilation) of the Workplace Regulations (Health, Safety and Welfare) Regulations 1992 (2013 revision) (HSE, 2013). BB101 states that “where mechanical ventilation is used (or when hybrid systems are operating in mechanical mode) in general teaching and learning spaces, sufficient outdoor air should be provided to ensure the daily average CO2 concentration is less than 1,000 ppm, during the occupied period. Furthermore, the maximum CO2 concentration cannot exceed 1,500 ppm for more than 20 consecutive minutes each day when the number of room occupants is equal to, or less than the design occupancy (Education and Skills Funding Agency, 2018, p23). The maximum design occupancy of the open studio space is 100 students (Figure 4, right) however in practice the occupancy numbers varied greatly throughout the monitoring campaign and rarely exceeded 50% of this capacity.
BB101 assessments are typically carried out at the design stage using dynamic simulation studies, which utilise the modelling assumptions provided in BB101 (Section 8.1 Internal conditions) (Education and Skills Funding Agency, 2018). There is currently no guidance regarding the assumptions which should be used for the post-occupancy evaluation (POE) of CO2 concentrations. Although CO2 is denser than air, CO2 stratification occurs because exhaled breath is warm, and is either immediately entrained into the main body plume or rises as a secondary plume where it typically settles at an intermediate height before being entrained and carried into the upper layer (Bhagat et al., 2020). Pei et al. (2019) showed that temperature and CO2 stratification is particularly pronounced in mechanically ventilated buildings using displacement ventilation. In this study CO2 was monitored using two independent systems, in an attempt to establish the most reliable monitoring configuration. The first was situated at the desk-top level using five calibrated Telaire CO2 sensors (equally distributed in the space) connected to HOBO U12 data loggers logging at 15-min intervals and the second at the ceiling-duct level via two sensors (one at the room outlet plenum and one on the opposite side of the room, logging at 15-min intervals) connected to the BMS system (Figure 4).
Volatile Organic Compound Monitoring Scenarios and Objectives
Three different VOC sampling scenarios were defined with the intention of identifying the VOCs present under different operational conditions. The VOC sampling objectives corresponding to the three IAQ scenarios are described in Table 2. During the sampling process paired diffusive tubes (i.e., an exposed tube and a blank tube) were deployed side-by-side. VOC samplers used 10 cm Tenax®/Carbotrap 1TD hydrophobic absorbent tube (Markes International Ltd., Llantrisant, United Kingdom) with a 5 mm diffusion gap. Before sampling the tubes were pre-conditioned at 310°C for 30 min with high purity nitrogen gas, before being capped and stored in a closed container ready for sampling. During sampling the exposed tube, with the diffusion cap, was kept open to the indoor environment to capture the VOCs present in the indoor air whilst the blank tube remained closed (thereby acting as a control). Whilst sampling the tubes were placed in an upright position at the centre of the open studio space at table height, as this is considered to be within the height of the breathing zone of seated occupants (Xing et al., 2001; Licina et al., 2015; Lee et al., 2019). For each scenario, three independent sampling measurements were taken in order to establish repeatability between the VOCs detected. All of the air sampling measurements were conducted during unoccupied periods to eliminate the effects of direct off-gassing from the building occupants, as the aim of the study was to identify only the contribution of VOCs originating within the indoor environment due to materials that had gone into the refurbishment as well as any model-making materials stored in the space.
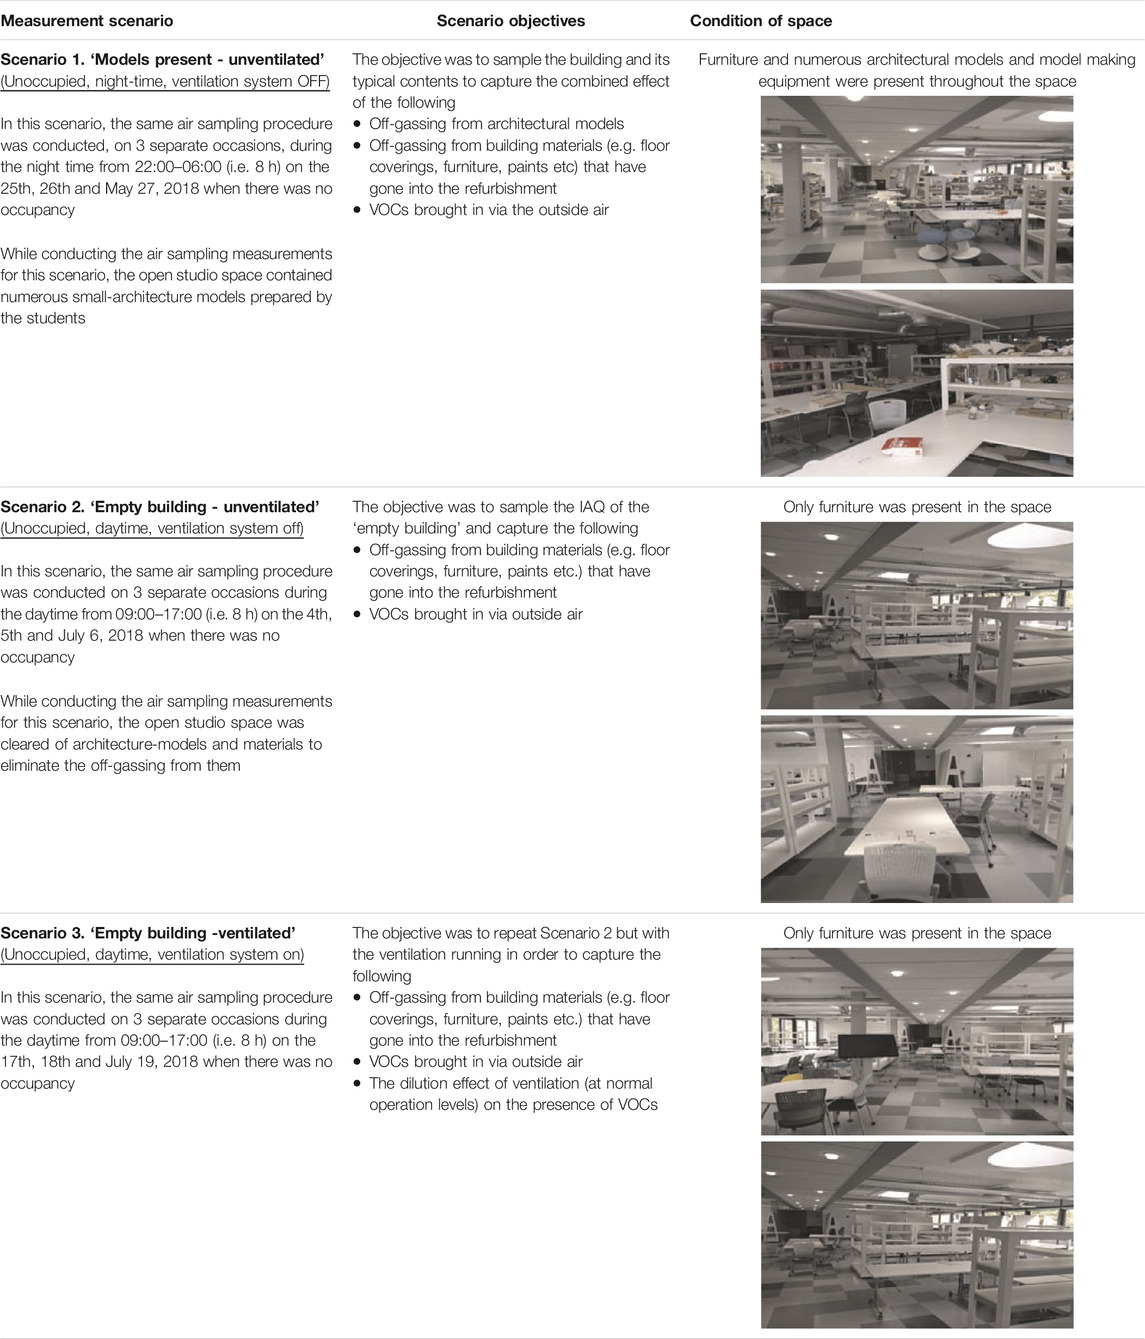
TABLE 2. Measurement scenarios and their objectives.
Description of Volatile Organic Compound Analysis Process
The collected samples were analysed using a thermal-desorption/gas-chromatography/mass-spectrometry (TD/GC/qMS) process. A Unity-2 thermal desorption unit (Markes International, Llantrisant, United Kingdom) was interfaced to a GC (Agilent, 7890A) (using an Rtx-5MS, 0.25 um 0.25 mm ID column) coupled to a quadrupole mass spectrometer (Agilent MS 5977A). The key stages of this process are shown in Figure 5, and the GC-MS instrumentation parameters are provided in Table 3.
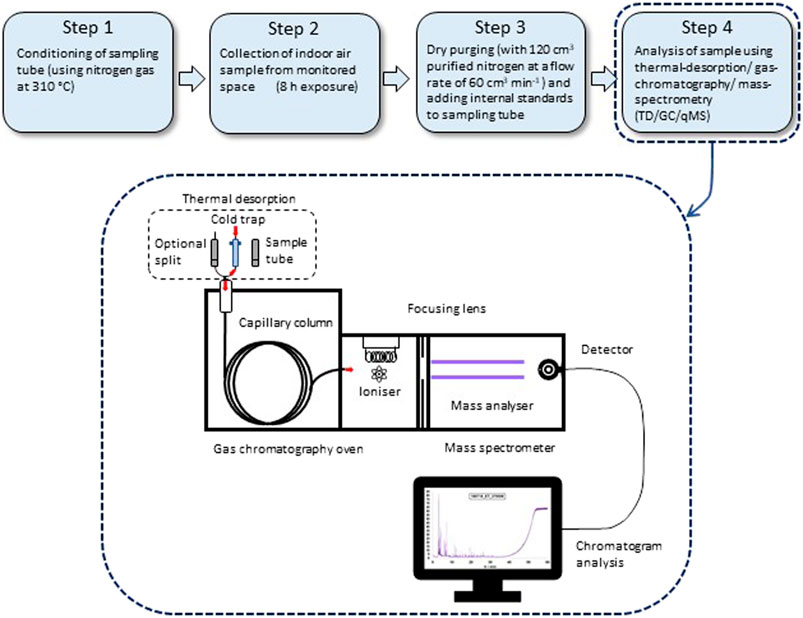
FIGURE 5. Schematic of VOC sampling and the TD/GC/qMS analysis process (52).
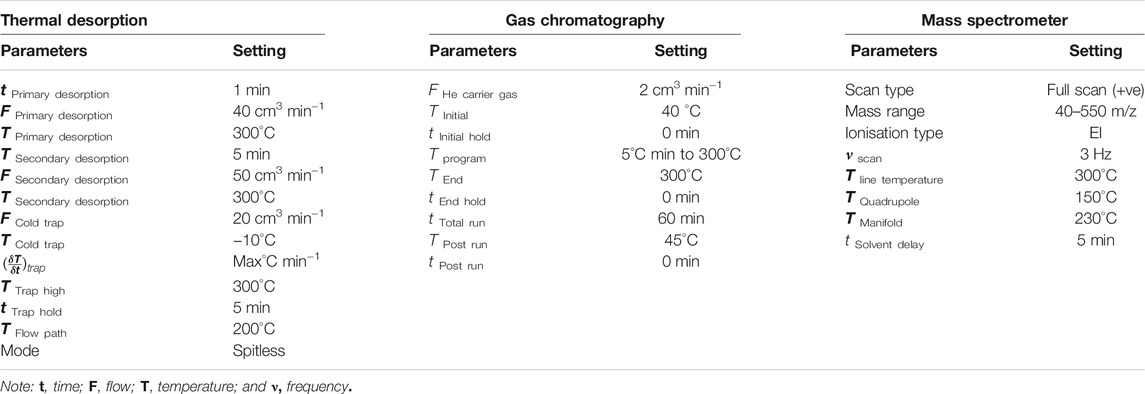
TABLE 3. GC-MS Instrumentation parameters.
Procedure for Establishing Repeatability for Compounds Detected in the Chromatogram and Elimination of Background Weight of Compounds
The output of the TD/GC/qMS analysis process is given in the form of a chromatogram, which represents the different VOCs present in the indoor environment based on their retention time. The retention time is a measure of the time taken for a particular solute to pass through a chromatography column and is calculated from the time elapsed between injection into the capillary column and its subsequent detection in the mass analyser (Figure 5). The analysis of each sample was undertaken with 60 min as the total retention time.
The following procedure was used for the analysis of the data, in order to establish repeatability between compounds and eliminate any undesirable background effects caused by VOCs present in the conditioned sampling tubes:
• Step 1 – Normalising the peak area value
The peak area values of the compounds detected in the exposed and blank tube were normalised to the internal standard Toluene-d8. The unit of the peak area value is counts. For the exposed tube, the normalised peak area value is calculated by dividing the peak area of the compounds in the exposed tube by the peak area value of Toluene-d8 in the exposed tube. Similarly, for the blank tube, the normalised peak area value is calculated by dividing the peak area of the compounds in the blank tube by the peak area value of Toluene-d8 in the blank tube.
• Step 2 – Elimination of the background effect
The compounds present in the exposed tube for a particular sampling period are cross-referenced against those present in the blank tube for the same sampling period. If a compound is found to be present in both the exposed and the blank tube, then the normalised peak area value calculated in Step 1 for that particular compound in the exposed tube is reduced by the normalised peak area value of the corresponding compound in the blank tube. If the result of this subtraction is positive, it indicates that the background quantity of the compound present in the blank tube has been eliminated thus leaving only the additional contribution arising from the exposed tube during sampling. If the result of this subtraction is negative, it indicates that the compound was present in the blank tube but not in indoor environment and should therefore be discarded from the results. If the compound is not present in the blank tube, then Step 3.
• Step 3 – Accounting for the injection rate of the internal standard Toluene-d8
The injection rate of the Toluene-d8 is 69 pg (pg). The normalised peak area values (calculated in Step 1 & 2) are divided by this injection rate to give the quantity of a particular compound in counts/nanograms (ng) equivalent of internal standard Toluene-d8.
• Step 4 – Establishing repeatability of identified compounds
As a form of quality control three air sampling measurements (as described in Table 2) were conducted for each measurement scenario to establish the repeatability of the identified compounds. In this way each compound identified in an air sampling measurement was cross referenced for its availability in the other air sampling measurements of the same measurement scenario. Compounds found to be repeated in all three air sampling measurements of a measurement scenario can be assumed to indicate their undistinguished presence. Once the compounds repeatedly present in all three air sampling measurements for each measurement scenario were identified, these compounds were then checked for their presence across the three distinct measurement scenarios. Only the compounds which were consistently present in each sample across all of the measurement scenarios are reported.
It should be noted that identification of the compounds isolated by this study was limited to those compounds listed by the National Institute for Standards and Technology (NIST) library (NIST, 2019) and specifically to those that possess a chemical compound name and chemical abstract service (CAS) number (putative Level-2 identities following the Metabolomics Standards Initiative (Sumner et al., 2007)). Unknown compounds (i.e., those without a confirmed NIST library match) were not evaluated since their identity could not be established without further investigations.
Results and Analysis
Assessment of Carbon Dioxide (CO2) Concentration
Desktop level monitoring of the CO2 concentration (via the Telaire sensor network) revealed consistently low CO2 concentrations during the initial monitoring period. This finding was unexpected and is likely to reflect the relatively high ventilation rates set by the BMS system coupled with CO2 stratification in the room. The International WELL Building Standard recommends that, for demand-controlled ventilation systems, CO2 concentration should be measured at 1.2–1.8 m above floor level (International WELL Building Institute, 2020b). Given the possibility that stratification could be influencing the CO2 levels monitored at desk-top height it was decided that a more representative mean room CO2 concentration could be obtained from the higher-level sensors linked to the BMS system (Figure 4). The CO2 concentration was recorded by the BMS system just below the supply ductwork on the NE side of the first-floor open studio (S1) and at the wall-level exhaust plenum (S2) at the SW side of the space (Figure 4). The 15-minutely CO2 readings from S1 and S2 were then combined and averaged over the 8-h occupied daytime period (09:00–17:00, Monday to Friday) to obtain the daily average CO2 values (Figure 6). According to BB101 sufficient ventilation should be provided to achieve a daily average CO2 concentration of below 1,000 ppm. The monthly plots of the mean daily CO2 concentration (Figure 6) show that for the entire monitoring period (April-August 2018) the maximum daily average concentration was well within this limit and did not exceed 600 ppm.
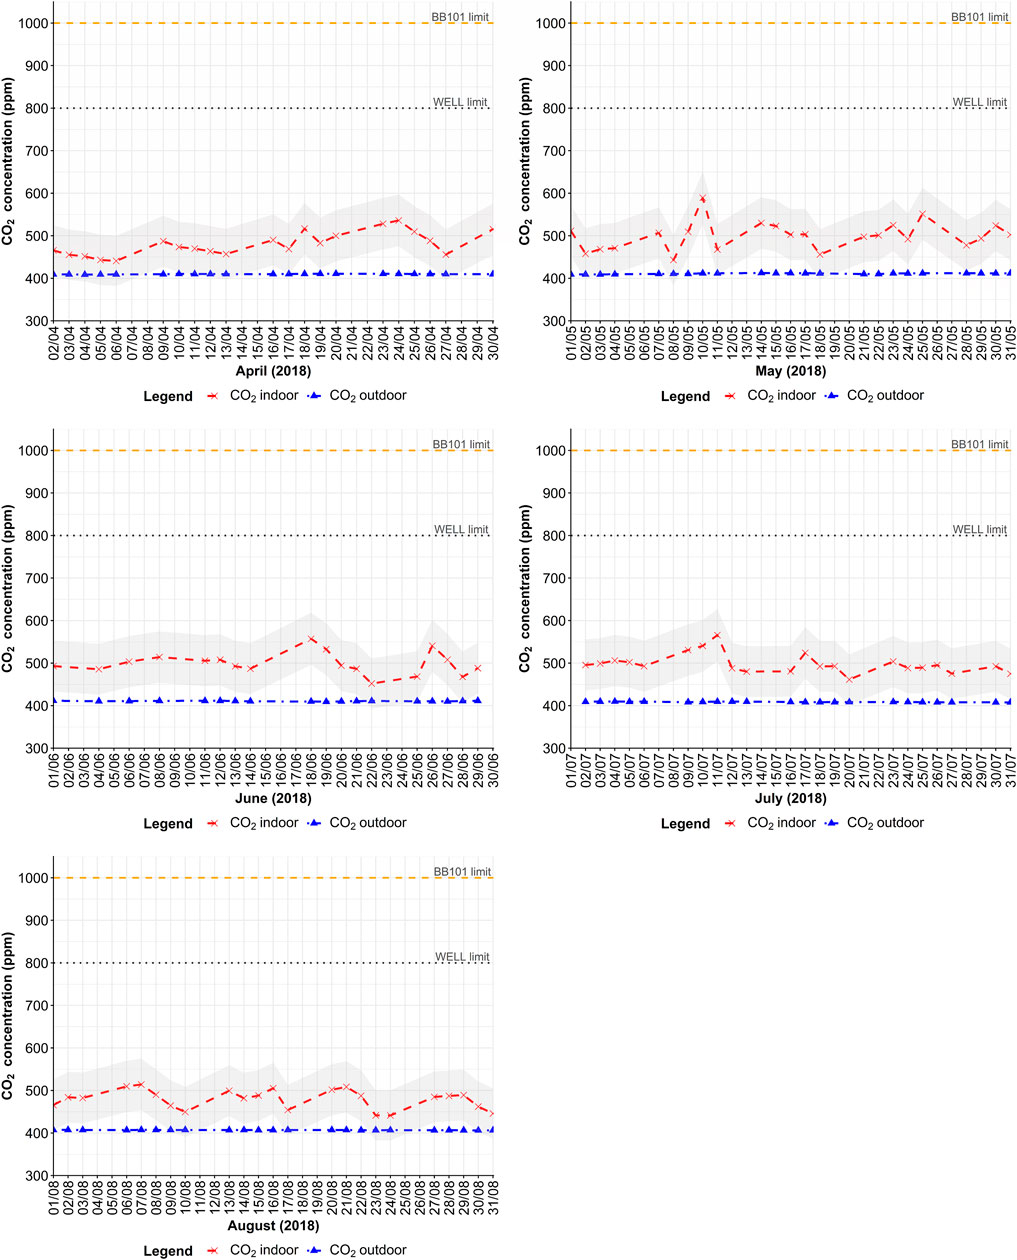
FIGURE 6. Daily average CO2 concentrations in the open studio space (Monthly, April–August 2018). Grey ribbon indicates the sensor manufacturer’s declared uncertainty interval.
BB101 also recommends that the maximum concentration should not exceed 1,500 ppm for more than 20 consecutive minutes each day. To assess this criterion the data was screened to identify the individual days with the highest CO2 concentrations at a 15 min interval. The peak concentrations were identified as occurring on 30 april (2018). Unsurprisingly, the CO2 peak was highest at the location of the exhaust sensor (Figure 4, S2) where for a period of approximately 45 min the concentration exceeded 800 ppm (peaking at 950 ppm). The supply side sensor readings (Figure 4, S1) showed a slight drop in CO2 concentration as the time the exhaust sensor peaked, presumably due to an increase in the flow rate from the BMS in response to the elevated exhaust CO2 levels. The mean value of the two sensors suggests that the average CO2 concentration in the space did not exceed 700 ppm at any point (Figure 6).
The results of the CO2 monitoring (Figures 6, 7) confirm that the ventilation of the space, during the 5 month long monitoring period, complied with the ventilation performance requirements set out in BB101 (Education and Skills Funding Agency, 2018). Furthermore, the monitored CO2 concentration compared favourably to other relevant national and international standards as shown in Table 4.
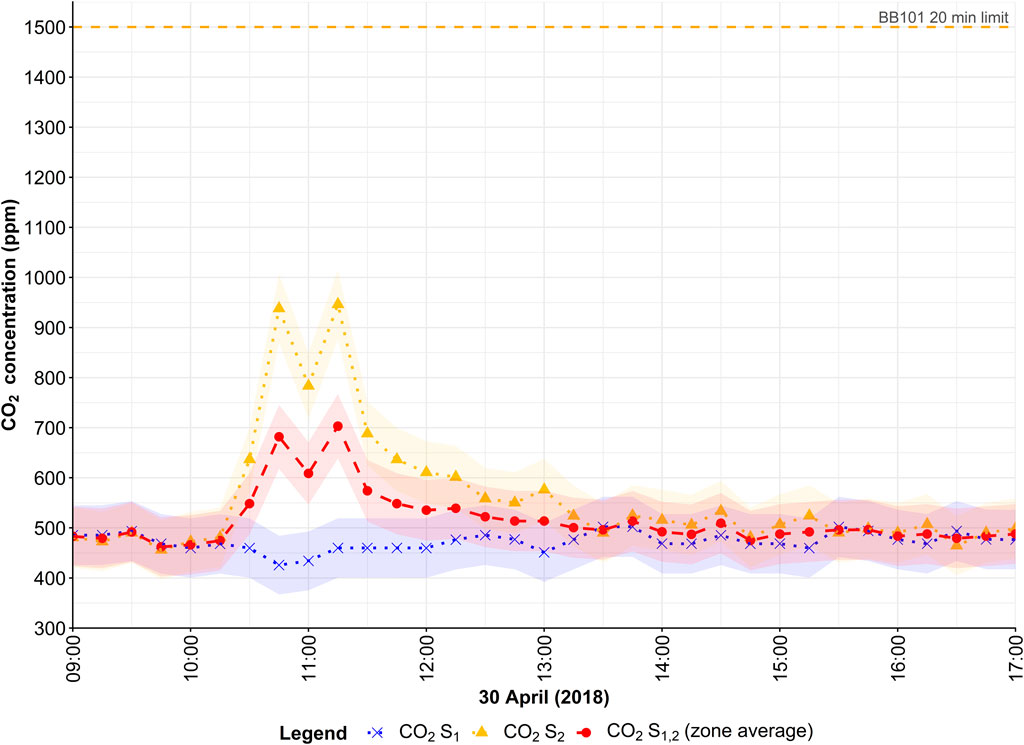
FIGURE 7. Fifteen-minute CO2 concentrations in the open studio space (peak day, April 30, 2018) as recorded at S1, S2 and the combined zonal average. Coloured ribbons indicate the sensor manufacturer’s declared uncertainty interval.
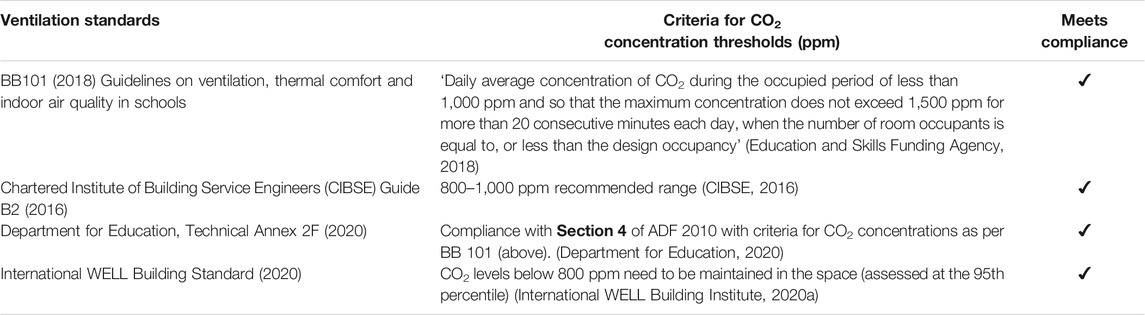
TABLE 4. Ventilation compliance comparison according to national and international ventilation standards, based on the CO2 concentration in the monitored environment.
Assessment of Diffusive Sampling for the Detection of Volatile Organic Compounds
The diffusive (passive) samples were analysed by thermal desorption GC-MS (Figure 5). This analysis produced a series of graphs known as chromatograms (Supplementary Appendix) which represent the spectrum of identified and unidentified compounds obtained for each measurement scenario (Table 2). Over two hundred and forty features, including environmental VOCs, ubiquitous artefacts (chemical noise) or siloxane compounds (arising from the analytical components or method) were identified during the sampling scenarios. VOCs such as ethanol, acetic acid, 1-butanol, pentanal, toluene, hexanal, styrene, benzaldehyde and phenol were detected (Supplementary Appendix). Of these only four compounds (acetic acid, toluene, benzaldehyde and phenol) were found to be repeatedly present in every measurement scenario, confirming their undistinguished presence in the indoor environment. The variation in the normalised peak values for these compounds, according to the interquartile range for each scenario, is shown in Figure 8.
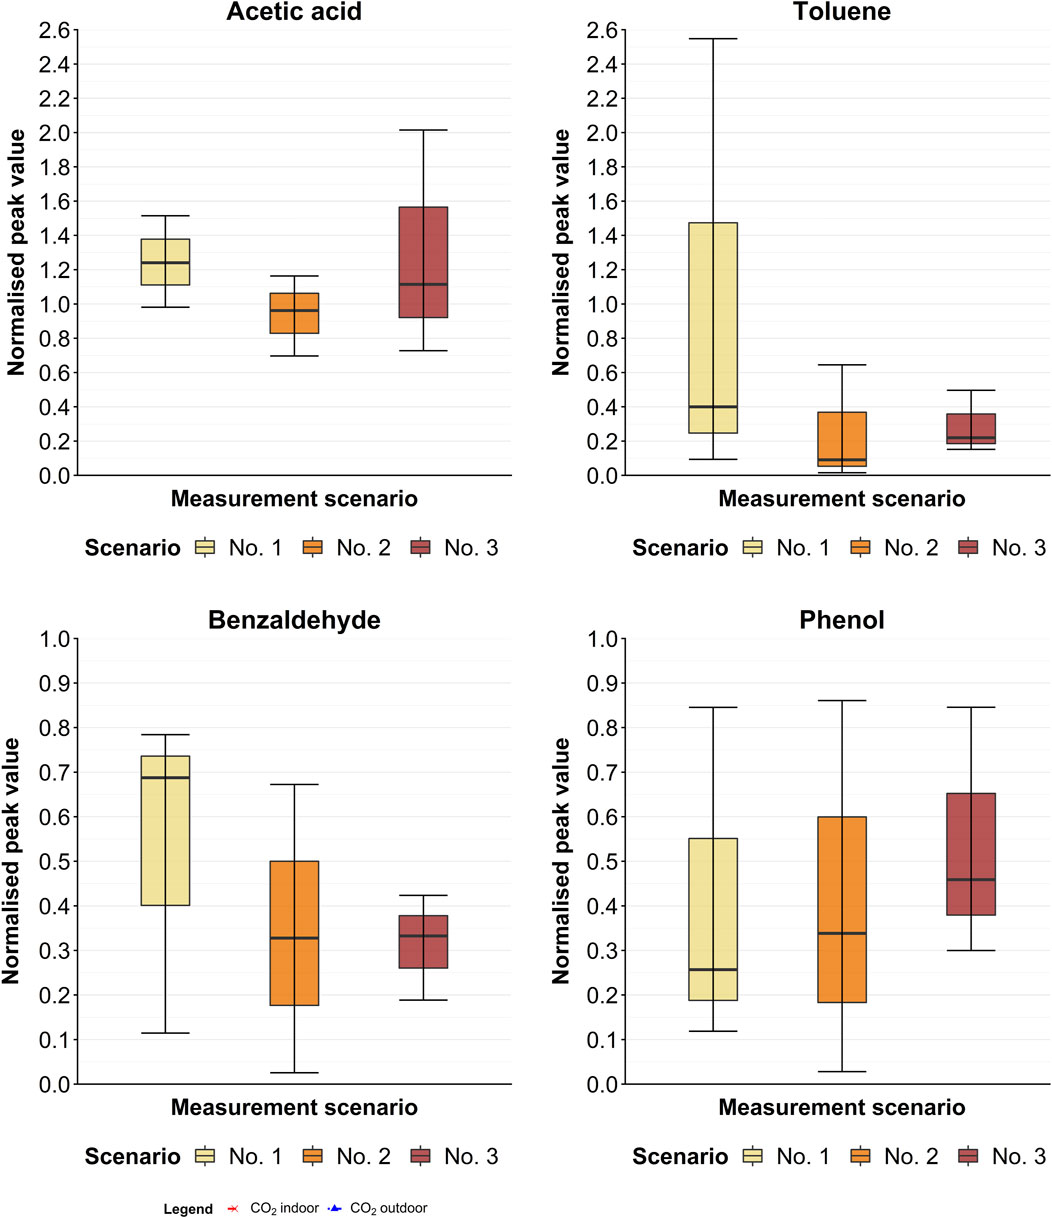
FIGURE 8. Boxplots showing the variation in the normalised peak area values for acetic acid, toluene, benzaldehyde and phenol according to the measurement scenario. The boxes represent the 25th and 75th percentiles of the data set. The median (Q2) is shown as a horizontal line and the whiskers are defined as 1.5x above and below the interquartile range.
It can be seen (Figure 8) that Scenario 1, with the ventilation turned off and architectural models present in the space, provided the highest normalised median peak counts for three of the four isolated compounds (acetic acid, toluene and benzaldehyde). The toluene and benzaldehyde counts were highest in Scenario 1 which suggest some additional contribution of these compounds from the model making process. Notably however, the median value for phenol was higher in Scenario 3 (Figure 8) where the ventilation was on and no models were present in the space, which suggests that this VOC was more likely to be associated with the building fabric or even the outside air. Furthermore, it can be seen (Figure 8) that although the presence of toluene and benzaldehyde were reduced by the introduction of ventilation in Scenario 3, the presence of acetic acid and phenol were not. This indicates the possibility of an external source for the acetic acid and phenol emissions, or their migration from a source elsewhere in the building, and requires further investigation.
Discussion
The results of the CO2 monitoring show (Figure 6) that the daily average CO2 concentration remained well within the BB101 1,000 ppm daily average limit throughout the 5-month long monitoring campaign. Similarly, when peak concentrations were assessed (Figure 7), according to the BB101 20-min maximum limit of 1,500 ppm, the studio space remained well within the threshold limiting value. Although this study took place prior to the current Covid-19 pandemic it is worth noting that the CO2 concentrations observed here lie well within the recommended CO2 limit of 800 ppm published by the United Kingdom Health and Safety Executive (HSE) (HSE, 2021) for the safe operation of ventilation systems during the current SARS-CoV-2 pandemic. It is perhaps unsurprising, in the context of an educational building, that the CO2 concentration is highly sensitive to the temporal resolution of the monitoring (i.e., daily averaging vs. sub-hourly monitoring). More significantly, in terms of the way guidance and standards are written, this study demonstrates the importance that the spatial positioning of CO2 sensors exerts on the results. In this study desk-top level monitoring of the CO2 concentrations was shown to produce relatively low readings (marginally above external levels) and for this reason higher level sensors, linked to the BMS system, were used to obtain a zonal spatial average (at approximately 2 m above floor level). This finding, regarding the placement of sensors, is supported by literature which documents the vertical stratification of CO2 in occupied rooms (Bhagat et al., 2020). In this respect the International Well Building Standard specifies that CO2 should be measured at between 1.2 and 1.8 m above the floor level (International WELL Building Institute, 2020b). Whilst BB101 recommends that CO2 should be measured at seated head height, no information is provided regarding the number of sensors or their recommended location within a space. The paucity of guidance on this issue in BB101 may reflect the fact that there is currently no requirement for in-situ monitoring at the post occupancy stage. These findings have significant implications for how future revisions of such standards are written and interpreted, particularly in the context of intermittently occupied open-plan educational spaces.
Across the 5-month monitoring period a broad range of occupancy patterns and densities were observed in monitored space, however the spatially averaged indoor CO2 concentration remained within a relatively narrow range (433–703 ppm). This finding is in marked contrast with numerous previous studies of educational buildings which have reported CO2 levels substantially above existing TLVs (CIBSE, 2016; Pei et al., 2019; Baloch et al., 2020); this outcome can be attributed to a number of factors specific to the operation of this building:
• The fresh air supply rate exceeded the 8 L/s per person specified for classrooms according to BB101 (2018).
• CO2 measurements were spatially averaged using only two locations in the open studio space. This could have led to an underestimation of localised CO2 concentrations in the context of a single zone space with a relatively large internal floor area (377 m2). Whilst BB101 indicates that the CO2 levels should be measured at seated head height no information is provided regarding the number of sensors, their accuracy, or their location within a room.
• After June 2018 (during the summer period) low to moderate occupancy was observed.
• The demand control ventilation (DCV) system employed in the building appears to respond rapidly to the changes in the exhaust plenum CO2 concentration.
• The positioning of the circular supply air diffusers and the exhaust grille (Figure 4) is facilitating good air mixing across the space.
Despite the results of the CO2 analysis indicating a seemingly well performing ventilation system, it is notable that ventilation specification in United Kingdom educational buildings currently ignores the potential contamination of the indoor air with pollutants stemming from a combination of outdoor and indoor sources (i.e., those introduced via the ventilation system or infiltration or originating from materials within the building). This is in marked contrast to the methodologies set out in the European norm EN 16798–1:2019 (Awbi, 2003; CEN, 2019) which recommends that the design ventilation rate should be calculated on the basis of two components, 1) ventilation to dilute/remove bio effluents from the occupants and 2) ventilation to remove/dilute pollution from the building and systems. Wherein, the ventilation rate appropriate for a particular occupant category (I-IV) is determined as the corresponding sum for these two components. In this study a number of VOCs were repeatedly identified through a campaign of diffusive sampling under defined operational scenarios (Figure 8), however the presence of these potentially harmful compounds is unaccounted for in the ventilation system design. Since there are currently no requirements to test for specific VOCs post-construction in any of the standards affecting schools and educational buildings in the United Kingdom, the full magnitude of this problem remains largely undetected.
The diffusive (passive) sampling methodology adopted in this study was designed to provide a non-targeted approach aimed at detecting all of the VOC compounds present in the indoor environment. This was performed by considering three distinct sampling scenarios in order to assess the building in its occupied and unoccupied states, both with and without fresh-air dilution via the mechanical ventilation system (Table 2). By repeating the sampling in this way it was found that four VOC compounds (acetic acid, toluene, benzaldehyde and phenol) were repeatedly present in each scenario (Figure 8). This confirms their undistinguished presence in the indoor environment and suggests that they are originating from the building materials or being introduced via the ventilation system (as opposed to being introduced by occupants or short duration activities). Whilst the toluene and benzaldehyde concentrations were reduced by the provision of ventilation the presence of acetic acid and phenol were not. This is potentially a significant finding as it suggests that ventilation might be ineffective as a control strategy in this context, however this would require further investigation (using paired indoor and outdoor measurements) and a larger sample size to rule out the possibility of transient external sources.
The presence of known, yet unregulated, health endangering VOCs is perhaps the most concerning finding in this study. Toluene, for example, has been associated with nervous system effects including cognitive impairment, vision and hearing loss along with changes in brain structure and chemistry following both chronic and acute exposure (Agency for Toxic Substances and Disease Registry, 2020). At levels above 500 ppm toluene is considered to be an immediate danger to life or health (IDLH) (Toluene, 2014). Toluene levels were found to be highest in scenario 1 which suggest that the source might come from the glues and solvents used in architectural model making. However, its presence was also identified in Scenarios 2 and 3 which suggests the possibility of an additional source from elsewhere in the indoor environment (such as oil-based paints used in the internal finishes) or via exhaust emissions from the adjacent car park (since toluene is a common component of unleaded vehicular emissions (Muttamara et al., 1999)). Acetic acid has a pungent odour and has been linked to sensory irritation of the eyes, nose, and upper respiratory tract; whilst at concentrations above 50 ppm it is considered to be IDLH (Toluene, 2014). Similarly, exposure to phenol is associated with irritation of the skin, eyes, nose, throat, and nervous system and at concentrations above 250 ppm it is considered to be IDLH (Baron, n. d). Benzaldehyde is a key ingredient in numerous cleaning and household products containing natural fruit flavours and has been shown to cause irritation of respiratory airways in animals and in human occupational exposure studies. There is currently little known about its long term toxicity but some researchers have suggested that inhalation of benzaldehyde poses an emerging health risk (Kosmider et al., 2016).
Further research would be required to isolate the precise indoor and outdoor source(s) responsible for the emission of these VOCs. This would involve testing samples of the indoor materials present under controlled conditions (i.e., emission chamber tests) in order to identify the emission characteristics of the specific compounds. Having identified the source of these compounds a detailed sampling plan would be required in order to capture these compounds in the indoor environment and understand whether their time dependent concentrations pose a serious ongoing health risk to the building occupants. This would involve creating calibration curves comparing a pure form of each identified compound against the one found in the indoor air. This process would quantify the concentration of each compound in ppm or
There are a number of additional limitations with respect to extrapolating the results of this study. The VOC sampling commenced 9 months (and was completed 11 months) after the completion of the refurbishment works. Had the study commenced earlier and spanned a longer duration a broader temporal profile of the VOCs arising from the refurbishment works could have been established. Furthermore, the IAQ campaign was carried out during the spring and summer period which could have influenced the actual concentration of CO2 and VOCs found due to increases in background ventilation rates during the warmer months (through the increased frequency of windows being opened). A further significant problem relates to the fact that many airborne VVOCs cannot be routinely captured using the applied technique of diffusive sampling (i.e., using Tenax®/Carbotrap absorbents) followed by TD/GC-/qMS (Salthammer, 2016). Finally, the number of VOC samples collected in this study (n = 18) would be considered relatively small for reliable quantification or assessing the significance of individual compounds. However, this study was intended to serve as a pilot study to highlight the strengths and limitations of current guidelines used in assessing higher education buildings and not to quantify the IAQ risks associated with this particular building.
Overall, the main findings of this study are in broad agreement with previous studies by Seppänen et al. (1999) and Apte et al. (2000) who demonstrated that concentrations of CO2 below 1,000 ppm do not always guarantee that the ventilation rate is adequate for the removal of air pollutants from other indoor sources. Indeed, the results of the present study suggest that whilst increased ventilation was capable of diluting some VOCs it was incapable of addressing the IAQ problems associated with every VOC. This suggests that more rigorous source control via environmental protocols designed to restrict the use of toxic materials in the indoor environment and the implementation of strict air quality controls in the vicinity of educational buildings are likely to play an important role in the solution to this complex problem.
Conclusion
The primary aim of this study was to investigate the indoor air quality of a recently refurbished higher education building by assessing the CO2 concentration and identifying individual volatile organic compounds that could be contributing to the indoor air pollution load as a result of major refurbishment works. CO2 concentration, which is widely used as a key indicator for ventilation performance for the control of indoor air quality, was found to be well below the threshold limiting values specified by all of the relevant standards, including BB101. This finding may be a result of several factors including the relatively low occupancy of the space, the spring-summer period of the monitoring study and mechanical ventilation flow rates which were intended for a higher designed occupancy level.
The maximum daily average CO2 concentration threshold for mechanically ventilated educational buildings was reduced from 1500 to 1000ppm in the most recent edition of BB101 (2018), highlighting the importance of low CO2 levels in achieving a comfortable and effective learning environment. However, the results highlight that CO2 concentration should not be conflated with providing good indoor air quality. Volatile organic compounds originating from a variety sources, both within and around educational buildings cannot be ignored due to the risk of serious short and long-term health impacts. Currently Approved Document F of the United Kingdom building regulations attempts to address this problem by specifying a total volatile organic compound limit (where TVOC >300
This study adopted a non-targeted approach to assess the indoor air quality of an open-studio space which led to the detection of numerous harmful volatile organic compounds that could not have been inferred from either the CO2 concentration or the concept of a total volatile organic compound threshold. The methodology used in this study (involving long-term CO2 monitoring coupled with scenario based passive VOC sampling) could be readily adopted in future revisions of indoor air quality standards, such as BB101 and WELL, as a post-completion commissioning requirement. Implementing such a strategy in all new and refurbished educational buildings would help to ensure that the provision of ‘good indoor air quality’ in educational buildings is predicated upon restricting the sources of indoor air contaminants as well as reducing the ingress of unwanted external pollutants. This implies a need for current standards to evolve beyond CO2 and total volatile organic compound limits, where the quantification of individual volatile organic compounds and their health impacts are factored into the indoor air quality classification. This issue is of paramount importance in the context of educational buildings in which young people spend a high proportion of their developing lives.
Data Availability Statement
The original contributions presented in the study are included in the article/Supplementary Material, further inquiries can be directed to the corresponding author.
Author Contributions
RM - Research Design, Ventilation and CO2 monitoring Methodology, Data Analysis, Original Draft, Final Draft, Project Supervision MM - Research Design, Ventilation and CO2 and VOC monitoring and sampling, Data Analysis, Original Draft DS - Research Design, VOC Methodology, VOC Data Analysis, Project Supervision PT - Research Design, VOC Methodology, VOC Data Analysis, Project Supervision.
Conflict of Interest
The authors declare that the research was conducted in the absence of any commercial or financial relationships that could be construed as a potential conflict of interest.
Publisher’s Note
All claims expressed in this article are solely those of the authors and do not necessarily represent those of their affiliated organizations, or those of the publisher, the editors and the reviewers. Any product that may be evaluated in this article, or claim that may be made by its manufacturer, is not guaranteed or endorsed by the publisher.
Acknowledgments
The authors would like to gratefully acknowledge the support of Dr Robert Schmidt III, of the School of Architecture, Building and Civil Engineering at Loughborough University, for providing unrestricted access to the Keith Green building in support of this research study.
Supplementary Material
The Supplementary Material for this article can be found online at: https://www.frontiersin.org/articles/10.3389/fbuil.2021.769761/full#supplementary-material
References
Abdul-Wahab, S. A., Chin Fah En, S., Elkamel, A., Ahmadi, L., and Yetilmezsoy, K. (2015). A Review of Standards and Guidelines Set by International Bodies for the Parameters of Indoor Air Quality. Atmos. Pollut. Res. 6, 751–767. doi:10.5094/APR.2015.084
Agency for Toxic Substances and Disease Registry (2020). ATSDR - Toxicological Profile: Toluene. Available at: https://www.atsdr.cdc.gov/ToxProfiles/tp.asp?id=161&tid=29 (Accessed October 7, 2020).
ALA (2020). State of the Air. Available at: www.stateoftheair.org.
Apte, M. G., Fisk, W. J., and Daisey, J. M. (2000). Associations between Indoor CO2 Concentrations and Sick Building Syndrome Symptoms in U.S. Office Buildings: An Analysis of the 1994-1996 BASE Study Data. Indoor Air 10, 246–257. doi:10.1034/j.1600-0668.2000.010004246.x
ASHRAE (2019). ANSI/ASHRAE Standard 62.1. Ventilation for Acceptable Indoor Air Quality. Available at: https://webstore.ansi.org/Standards/ASHRAE/ANSIASHRAE622019?gclid=CjwKCAjwiOv7BRBREiwAXHbv3FRX0GJexdYDlItf4b6VdqURu_c5McT9f4WI63N8oGg_mIVlgk6B0xoCVNcQAvD_BwE (Accessed October 5, 2020).
ASHRAE (2017). ASHRAE Handbook. Atlanta, GA: The American Society of Heating, Refrigerating and Air-Conditioning Engineers (ASHRAE).
Awbi, H. B. (2003). Ventilation of Buildings: Second Edition, Spon Press Taylor & Francis Group. London: Routledge. doi:10.4324/9780203634479
Bakó-Biró, Z., Clements-Croome, D. J., Kochhar, N., Awbi, H. B., and Williams, M. J. (2012). Ventilation Rates in Schools and Pupils' Performance. Building Environ. 48, 215–223. doi:10.1016/j.buildenv.2011.08.018
Baloch, R. M., Maesano, C. N., Christoffersen, J., Banerjee, S., Gabriel, M., Csobod, É., et al. (2020). Indoor Air Pollution, Physical and comfort Parameters Related to Schoolchildren's Health: Data from the European SINPHONIE Study. Sci. Total Environ. 739, 139870. doi:10.1016/j.scitotenv.2020.139870
Baron, P. (n.d). Generation and Behavior of Airborne Particles (Aerosols). Available at: https://www.cdc.gov/niosh/topics/aerosols/pdfs/aerosol_101.pdf (Accessed September 14, 2020).
Beinfait, D., Fitzner, K., Lindvall, T., Seppanen, O., Woolliscroft, M., Fanger, O., et al. (1992). Guidelines for Ventilation Requirements in Buildings. Report No.11. Eur. Collaborative Action. (Eca) – Indoor Air Qual. its impact man. 1, 1.
Berglund, B., Clausen, G., De, J., and Mqilhave, L. (1997). Report 19. Total Volatile Org. Comp. (Tvoc) Indoor Air Qual. Invest. 1, 1.
Bhagat, R. K., Davies Wykes, M. S., Dalziel, S. B., and Linden, P. F. (2020). Effects of Ventilation on the Indoor Spread of COVID-19. J. Fluid Mech. 903, F1. doi:10.1017/jfm.2020.720
Boscott, A. (2020). UK Universities Turning Students Away from Overcrowded Lectures, Redbrick News. Available at: https://www.redbrick.me/uk-universities-turning-students-away-from-overcrowded-lectures/(Accessed September 18, 2020).
British Standards Institution (2007). BS EN ISO 16000–5 : 2007. Indoor Air - Part 5: Sampling Strategy for Volatile Organic Compounds (VOCS), London. Available at: https://infostore.saiglobal.com/en-us/Standards/BS-EN-ISO-16000-5-2007-249382_SAIG_BSI_BSI_579927/(Accessed September 23, 2020).
Brown, V. M., Crump, D. R., and Gardiner, D. (1992). Measurement of Volatile Organic Compounds in Indoor Air by a Passive Technique. Environ. Tech. 13, 367–375. doi:10.1080/09593339209385164
Campagnolo, D., Saraga, D. E., Cattaneo, A., Spinazzè, A., Mandin, C., Mabilia, R., et al. (2017). VOCs and Aldehydes Source Identification in European Office Buildings - the OFFICAIR Study. Building Environ. 115, 18–24. doi:10.1016/j.buildenv.2017.01.009
Carrer, P., de Oliveira Fernandes, E., Santos, H., Hänninen, O., Kephalopoulos, S., and Wargocki, P. (2018). On the Development of Health-Based Ventilation Guidelines: Principles and Framework. Int. J. Environ. Res. Public Health 15. doi:10.3390/ijerph15071360
Carrer, P., Bruinen De Bruin, Y., Franchi, M., and Valovirta, E. (2002). The EFA Project: Indoor Air Quality in European Schools. Available at: https://bit.ly/3y5Y3XR (Accessed August 31, 2020).
CEN (2019). EN 16798–1:2019. Energy Performance of Buildings. Ventilation for Buildings. Indoor Environmental Input Parameters for Design and Assessment of Energy Performance of Buildings Addressing Indoor Air Quality, thermal Environment, Lighting and Acoustics. Available at: https://bit.ly/3eW89D8 (Accessed October 5, 2020).
Chan, A. T. (2002). Indoor-outdoor Relationships of Particulate Matter and Nitrogen Oxides under Different Outdoor Meteorological Conditions. Atmos. Environ. 36, 1543–1551. doi:10.1016/S1352-2310(01)00471-X
Chen, C., and Zhao, B. (2011). Review of Relationship between Indoor and Outdoor Particles: I/O Ratio, Infiltration Factor and Penetration Factor. Atmos. Environ. 45, 275–288. doi:10.1016/j.atmosenv.2010.09.048
CIBSE Guide A (2015). Environmental Design. London: The Chartered Institution of Building Services Engineers (CIBSE).
CIBSE (2016). Guide B2: Ventilation and Ductwork. Available at: https://www.cibse.org/knowledge/knowledge-items/detail?id=a0q20000008JuB7AAK (Accessed September 17, 2020).
Cochran Hameen, E., Ken-Opurum, B., Priyadarshini, S., Lartigue, B., and Pisipati, S. (2020). “Effects of School Facilities Mechanical and Plumbing Characteristics and Conditions on Student Attendance, Academic Performance and Health,” in International Conference on Green Building (IEEE). Available at: https://bit.ly/3zzhuZg (Accessed September 28, 2020).
Crowe, P. (2013). “The Implementation of UK Procurement Policy in University Refurbishment Projects,” in IPGRC 2013 Int. Post Grad. Res. Conf. Editors V. Ahmed, C. Egbu, J. Underwood, A. Lee, and P. Chynoweth Available at: http://www.ipgrc.com/2013/(Accessed October 12, 2020).
Daisey, J. M., Angell, W. J., and Apte, M. G. (2003). Indoor Air Quality, Ventilation and Health Symptoms in Schools: An Analysis of Existing Information. Indoor Air 13, 53–64. doi:10.1034/j.1600-0668.2003.00153.x
Department for Education (2020). Technical Annex 2F: Mechanical Services and Public Health Engineering. Available at: https://assets.publishing.service.gov.uk/government/uploads/system/uploads/attachment_data/file/939408/Annex_2F_Mechanical_Services_Nov_2020.pdf.
Education and Skills Funding Agency (2018). BB 101: Guidelines on Ventilation, thermal comfort and Indoor Air Quality in Schools. Available at: https://www.gov.uk/government/publications/building-bulletin-101-ventilation-for-school-buildings#history (Accessed September 11, 2020).
European Parliament (2004). Directive 2004/42/CE of the European Parliament and of the Council of 21 April 2004 on the Limitation of Emissions of Volatile Organic Compounds Due to the Use of Organic Solvents in Certain Paints and Varnishes and Vehicle Refinishing Products and Amending Directive 1999/13/EC, off. J. L 143. Available at: https://eur-lex.europa.eu/legal-content/EN/ALL/?uri=celex:32004L0042 (Accessed September 23, 2020).
Fletcher, A. M., London, M. A., Gelberg, K. H., and Grey, A. J. (2006). Characteristics of Patients with Work-Related Asthma Seen in the New York State Occupational Health Clinics. J. Occup. Environ. Med. 48, 1203–1211. doi:10.1097/01.jom.0000245920.87676.7b
Freeman, S., Eddy, S. L., McDonough, M., Smith, M. K., Okoroafor, N., Jordt, H., et al. (2014). Active Learning Increases Student Performance in Science, Engineering, and Mathematics. Proc. Natl. Acad. Sci. 111, 8410–8415. doi:10.1073/pnas.1319030111
Gaihre, S., Semple, S., Miller, J., Fielding, S., and Turner, S. (2014). Classroom Carbon Dioxide Concentration, School Attendance, and Educational Attainment. J. Sch. Health 84, 569–574. doi:10.1111/josh.12183
Guo, H., Lee, S. C., Chan, L. Y., and Li, W. M. (2004). Risk Assessment of Exposure to Volatile Organic Compounds in Different Indoor Environments. Environ. Res. 94, 57–66. doi:10.1016/S0013-9351(03)00035-5
Haverinen-Shaughnessy, U., Moschandreas, D. J., and Shaughnessy, R. J. (2011). Association between Substandard Classroom Ventilation Rates and Students' Academic Achievement. Indoor Air 21, 121–131. doi:10.1111/j.1600-0668.2010.00686.x
HM Government (2015). Approved Document F. Ventilation, 2010 Edition Incorporating 2013 Amendments. Available at: https://www.gov.uk/government/uploads/system/uploads/attachment_data/file/468871/ADF_LOCKED.pdf (Accessed July 1, 2020).
HM Government (2000). The Building Regulations, Queen’s Printer of Acts of Parliament. Available at: https://www.legislation.gov.uk/uksi/2000/2531/schedule/1/made (Accessed September 22, 2020).
Holøs, S. B., Yang, A., Lind, M., Thunshelle, K., Schild, P., and Mysen, M. (2019). VOC Emission Rates in Newly Built and Renovated Buildings, and the Influence of Ventilation – a Review and Meta-Analysis. Int. J. Vent 18, 153–166. doi:10.1080/14733315.2018.1435026
HSE (2021). Ventilation and Air Conditioning during the Coronavirus (COVID-19) Pandemic, Heal. Saf. Exec. Guid. Available at: https://www.hse.gov.uk/coronavirus/equipment-and-machinery/air-conditioning-and-ventilation/identifying-poorly-ventilated-areas.htm (Accessed October 12, 2020).
HSE (2013). Workplace Health, Safety and Welfare. Workplace (Health, Safety and Welfare) Regulations 1992. Approved Code of Practice and Guidance L24. Available at: www.nationalarchives.gov.uk/doc/open-government-licence/.
International WELL Building Institute (2020). The International WELL Building Standard. Section 18: Air Quality Monitoring and Feedback. Available at: https://standard.wellcertified.com/air/air-quality-monitoring-and-feedback (Accessed September 11, 2020).
International WELL Building Institute (2020). Ventilation Effectiveness. Available at: https://standard.wellcertified.com/air/ventilation-effectiveness (Accessed October 7, 2020).
Jacobson, T. A., Kler, J. S., Hernke, M. T., Braun, R. K., Meyer, K. C., and Funk, W. E. (2019). Direct Human Health Risks of Increased Atmospheric Carbon Dioxide. Nat. Sustain. 2, 691–701. doi:10.1038/s41893-019-0323-1
Kelly, F. J., and Fussell, J. C. (2015). Air Pollution and Public Health: Emerging Hazards and Improved Understanding of Risk. Environ. Geochem. Health 37, 631–649. doi:10.1007/s10653-015-9720-1
Kim, J. L., Elfman, L., and Norbäck, D. (2007). Respiratory Symptoms, Asthma and Allergen Levels in Schools ? Comparison between Korea and Sweden. Indoor Air 17, 122–129. doi:10.1111/j.1600-0668.2006.00460.x
Klepeis, N. E., Nelson, W. C., Ott, W. R., Robinson, J. P., Tsang, A. M., Switzer, P., et al. (2001). The National Human Activity Pattern Survey (NHAPS): a Resource for Assessing Exposure to Environmental Pollutants. J. Expo. Sci. Environ. Epidemiol. 11, 231–252. doi:10.1038/sj.jea.7500165
Kosmider, L., Sobczak, A., Prokopowicz, A., Kurek, J., Zaciera, M., Knysak, J., et al. (2016). Cherry-flavoured Electronic Cigarettes Expose Users to the Inhalation Irritant, Benzaldehyde. Thorax 71, 376–377. doi:10.1136/thoraxjnl-2015-207895
Lee, C. S., Haghighat, F., and Ghaly, W. S. (2005). A Study on VOC Source and Sink Behavior in Porous Building Materials - Analytical Model Development and Assessment. Indoor Air 15, 183–196. doi:10.1111/j.1600-0668.2005.00335.x
Lee, J. Y., Wargocki, P., Chan, Y. H., Chen, L., and Tham, K. W. (2019). Indoor Environmental Quality, Occupant Satisfaction, and Acute Building‐related Health Symptoms in Green Mark‐certified Compared with Non‐certified Office Buildings. Indoor Air 29, 112–129. doi:10.1111/ina.12515
Lelieveld, J., Klingmüller, K., Pozzer, A., Pöschl, U., Fnais, M., Daiber, A., et al. (2019). Cardiovascular Disease burden from Ambient Air Pollution in Europe Reassessed Using Novel hazard Ratio Functions. Eur. Heart J. 40, 1590–1596. doi:10.1093/eurheartj/ehz135
Licina, D., Melikov, A., Sekhar, C., and Tham, K. W. (2015). Transport of Gaseous Pollutants by Convective Boundary Layer Around a Human Body. Sci. Tech. Built Environ. 21, 1175–1186. doi:10.1080/23744731.2015.1060111
Lu, C.-Y., Tsai, M.-C., Muo, C.-H., Kuo, Y.-H., Sung, F.-C., and Wu, C.-C. (2017). Personal, Psychosocial and Environmental Factors Related to Sick Building Syndrome in Official Employees of Taiwan. Ijerph 15, 7. doi:10.3390/ijerph15010007
Lucattini, L., Poma, G., Covaci, A., de Boer, J., Lamoree, M. H., and Leonards, P. E. G. (2018). A Review of Semi-volatile Organic Compounds (SVOCs) in the Indoor Environment: Occurrence in Consumer Products, Indoor Air and Dust. Chemosphere 201, 466–482. doi:10.1016/j.chemosphere.2018.02.161
Maroni, M., Seifert, B., and Lindvall, T. (1995). Indoor Air Quality, Volume 3-1st Edition. Elsevier Sci. Available at: https://www.elsevier.com/books/indoor-air-quality/maroni/978-0-444-81642-9 (Accessed September 17, 2020).
Matson, U. (2005). Indoor and Outdoor Concentrations of Ultrafine Particles in Some Scandinavian Rural and Urban Areas. Sci. Total Environ. 343, 169–176. doi:10.1016/j.scitotenv.2004.10.002
Mazurek, J. M., Filios, M., Willis, R., Rosenman, K. D., Reilly, M. J., McGreevy, K., et al. (2008). Work-related Asthma in theEducational Services Industry: California, Massachusetts, Michigan, and New Jersey, 1993-2000. Am. J. Ind. Med. 51, 47–59. doi:10.1002/ajim.20539
McLeod, R., and Swainson, M. (2017). Chronic Overheating in Low Carbon Urban Developments in a Temperate Climate. Renew. Sust. Energ. Rev. 74, 201–220.
Mendell, M. J., Eliseeva, E. A., Davies, M. M., Spears, M., Lobscheid, A., Fisk, W. J., et al. (2013). Association of Classroom Ventilation with Reduced Illness Absence: a Prospective Study in California Elementary Schools. Indoor Air 23, 515–528. doi:10.1111/ina.12042
Miller, J., Semple, S., and Turner, S. (2010). High Carbon Dioxide Concentrations in the Classroom: the Need for Research on the Effects of Children's Exposure to Poor Indoor Air Quality at School. Occup. Environ. Med. 67, 799. doi:10.1136/oem.2010.057471
Molhave, L., Clausen, G., Berglund, B., Ceaurriz, J., Kettrup, A., Lindvall, T., et al. (1997). Total Volatile Organic Compounds (TVOC) in Indoor Air Quality Investigations*. Indoor Air 7, 225–240. doi:10.1111/j.1600-0668.1997.00002.x
Münzel, T., Gori, T., Al-Kindi, S., Deanfield, J., Lelieveld, J., Daiber, A., et al. (2018). Effects of Gaseous and Solid Constituents of Air Pollution on Endothelial Function. Eur. Heart J. 39, 3543–3550. doi:10.1093/eurheartj/ehy481
Muttamara, S., Leong, S. T., and Lertvisansak, I. (1999). Assessment of Benzene and Toluene Emissions from Automobile Exhaust in Bangkok. Environ. Res. 81, 23–31. doi:10.1006/enrs.1998.3941
Mysen, M., Rydock, J. P., and Tjelflaat, P. O. (2003). Demand Controlled Ventilation for Office Cubicles-Can it Be Profitable? Energy and Buildings 35, 657–662. doi:10.1016/S0378-7788(02)00212-8
NIST (2019). NIST/EPA/NIH Mass Spectral Library-PC Version, NIST Standard Reference Database 1A. NIST. Available at: https://doi.org/10.18434/T4H594.doi:10.18434/T4H594
Oppl, R., and Neuhaus, T. (2008). Emission Specifications in Europe and the US-Limit Values (TVOC, LCI, CREL,...) in Critical Discussion. Copenhagen: Indoor Air Conference.
Pei, G., Rim, D., Schiavon, S., and Vannucci, M. (2019). Effect of Sensor Position on the Performance of CO2-based Demand Controlled Ventilation. Energy Build 202, 1. doi:10.1016/j.enbuild.2019.109358
Persson, J., Wang, T., and Hagberg, J. (2019). Indoor Air Quality of Newly Built Low-Energy Preschools - Are Chemical Emissions Reduced in Houses with Eco-Labelled Building Materials? Indoor Built Environ. 28, 506–519. doi:10.1177/1420326X18792600
RCP (2016). Every Breath We Take: the Lifelong Impact of Air Pollution. Available at: https://www.rcplondon.ac.uk/projects/outputs/every-breath-we-take-lifelong-impact-air-pollution (Accessed August 31, 2020).
Riggs, J. J. (2014). An Approach to Increasing Awareness of IAQ, Middlesex. Available at: https://eprints.mdx.ac.uk/id/eprint/13523 (Accessed August 31, 2020).
Riley, W. J., McKone, T. E., Lai, A. C. K., and Nazaroff, W. W. (2002). Indoor Particulate Matter of Outdoor Origin: Importance of Size-dependent Removal Mechanisms. Environ. Sci. Technol. 36, 200–207. doi:10.1021/es010723y
Salthammer, T. (2016). Very Volatile Organic Compounds: an Understudied Class of Indoor Air Pollutants. Indoor Air 26, 25–38. doi:10.1111/ina.12173
Seifert, B., and Ullrich, D. (1987). Methodologies for Evaluating Sources of Volatile Organic Chemicals (VOC) in Homes. Atmos. Environ. (1967) 21, 395–404. doi:10.1016/0004-6981(87)90018-7
Seppänen, O. A., Fisk, W. J., and Mendell, M. J. (1999). Association of Ventilation Rates and CO2 Concentrations with Health andOther Responses in Commercial and Institutional Buildings. Indoor Air 9, 226–252. doi:10.1111/j.1600-0668.1999.00003.x
Shaughnessy, R. J., Haverinen-Shaughnessy, U., Nevalainen, A., and Moschandreas, D. (2006). A Preliminary Study on the Association between Ventilation Rates in Classrooms and Student Performance. Indoor Air 16, 465–468. doi:10.1111/j.1600-0668.2006.00440.x
Shendell, D. G., Prill, R., Fisk, W. J., Apte, M. G., Blake, D., and Faulkner, D. (2004). Associations between Classroom CO2 Concentrations and Student Attendance in Washington and Idaho. Indoor Air 14, 333–341. doi:10.1111/j.1600-0668.2004.00251.x
Spinazzè, A., Campagnolo, D., Cattaneo, A., Urso, P., Sakellaris, I. A., Saraga, D. E., et al. (2020). Indoor Gaseous Air Pollutants Determinants in Office Buildings-The OFFICAIR Project. Indoor Air 30, 76–87. doi:10.1111/ina.12609
Stranger, M., Aerts, W., Daems, J., Spruy, M., Geyskens, F., Verbeke, L., et al. (2015). Explorative Study on the Quality of the Indoor Environment in Buildings after (Energy-efficient) Renovations. Boeretang, Belgium: Vito. https://www.milieuinfo.be/dms/d/d/workspace/SpacesStore/3022641f-ea68-4873-b5ca-f07f964339c1/renovair_eindrapport.pdf.
Sumner, L. W., Amberg, A., Barrett, D., Beale, M. H., Beger, R., Daykin, C. A., et al. (2007). Proposed Minimum Reporting Standards for Chemical Analysis. Metabolomics 3, 211–221. doi:10.1007/s11306-007-0082-2
Suzuki, N., Nakaoka, H., Hanazato, M., Nakayama, Y., Tsumura, K., Takaya, K., et al. (2019). Indoor Air Quality Analysis of Newly Built Houses. Int. J. Environ. Res. Public Health 16, 1. doi:10.3390/ijerph16214142
The European Parliament and The Council of the European Union, (2010). Directive 2010/31/EU of the European Parliament and of the Council of 19 May 2010 on the Energy Performance of Buildings. Off. J. Eur. Union 53, 1. doi:10.3000/17252555.L_2010.153.eng
Toluene (2014). The National Institute for Occupational Safety and Health (NIOSH), Immediately Dangerous to Life or Health Concentrations (IDLH): Toluene - NIOSH Publications and Products. Available at: https://www.cdc.gov/niosh/idlh/108883.html (Accessed October 7, 2020).
Turunen, M., Toyinbo, O., Putus, T., Nevalainen, A., Shaughnessy, R., and Haverinen-Shaughnessy, U. (2013). Indoor Environmental Quality in School Buildings, and the Health and Wellbeing of Students. Int. J. Hyg. Environ. Health 217, 733–739. doi:10.1016/j.ijheh.2014.03.002
US EPA (2019). Air Quality - National Summary. Available at: https://www.epa.gov/air-trends/air-quality-national-summary (Accessed August 28, 2020).
US EPA (2020). Technical Overview of Volatile Organic Compounds. Available at: https://www.epa.gov/indoor-air-quality-iaq/technical-overview-volatile-organic-compounds (Accessed September 28, 2020).
Wachenfeldt, B. J., Mysen, M., and Schild, P. G. (2007). Air Flow Rates and Energy Saving Potential in Schools with Demand-Controlled Displacement Ventilation. Energy and Buildings 39, 1073–1079. doi:10.1016/j.enbuild.2006.10.018
Wall, K., Dockrell, J., and Peacey, N. (2008). Primary Schools: The Built Environment. Available at: www.primaryreview.org.uk.
Weale, S. (2020). UK Universities Receive Record Number of Applications in Lockdown, Guard. Available at: https://www.theguardian.com/education/2020/jul/09/uk-universities-record-number-applications-lockdown (Accessed September 18, 2020).
Wolkoff, P., and Nielsen, G. D. (2001). Organic Compounds in Indoor Air-Their Relevance for Perceived Indoor Air Quality? Atmos. Environ. 35, 4407–4417. doi:10.1016/S1352-2310(01)00244-8
Woolley, T. (2016). Building Materials, Health and Indoor Air Quality: No Breathing Space? London, Routledge: Taylor and Francis Group. Available at: https://www.routledge.com/Building-Materials-Health-and-Indoor-Air-Quality-No-Breathing-Space/Woolley/p/book/9781138934498 (Accessed September 17, 2020).
Xing, H., Hatton, A., and Awbi, H. B. (2001). A Study of the Air Quality in the Breathing Zone in a Room with Displacement Ventilation. Available at: www.elsevier.com/locate/buildenv.doi:10.1016/s0360-1323(01)00006-3
Xu, J., Szyszkowicz, M., Jovic, B., Cakmak, S., Austin, C. C., and Zhu, J. (2016). Estimation of Indoor and Outdoor Ratios of Selected Volatile Organic Compounds in Canada. Atmos. Environ. 141, 523–531. doi:10.1016/j.atmosenv.2016.07.031
Yang, W., Sohn, J., Kim, J., Son, B., and Park, J. (2009). Indoor Air Quality Investigation According to Age of the School Buildings in Korea. J. Environ. Manage. 90, 348–354. doi:10.1016/j.jenvman.2007.10.003
Yu, C., and Crump, D. (1998). A Review of the Emission of VOCs from Polymeric Materials Used in Buildings. Building Environ. 33, 357–374. doi:10.1016/S0360-1323(97)00055-3
Zhong, L., Su, F.-C., and Batterman, S. (2017). Volatile Organic Compounds (VOCs) in Conventional and High Performance School Buildings in the U.S. Ijerph 14, 100. doi:10.3390/ijerph14010100
Keywords: post-occupancy evaluation (POE), indoor air quality (IAQ), Building Bulletin 101 (BB101), volatile organic compounds (VOCs), thermal desorption gas chromatography mass spectrometry (TD-GC-MS), mechanical ventilation, ventilation in educational buildings, air pollution
Citation: McLeod RS, Mathew M, Salman D and Thomas CLP (2022) An Investigation of Indoor Air Quality in a Recently Refurbished Educational Building. Front. Built Environ. 7:769761. doi: 10.3389/fbuil.2021.769761
Received: 02 September 2021; Accepted: 01 November 2021;
Published: 07 January 2022.
Edited by:
Hasim Altan, Arkin University of Creative Arts and Design (ARUCAD), CyprusReviewed by:
Lexuan Zhong, University of Alberta, CanadaAndrea Spinazzè, University of Insubria, Italy
Copyright © 2022 McLeod, Mathew, Salman and Thomas. This is an open-access article distributed under the terms of the Creative Commons Attribution License (CC BY). The use, distribution or reproduction in other forums is permitted, provided the original author(s) and the copyright owner(s) are credited and that the original publication in this journal is cited, in accordance with accepted academic practice. No use, distribution or reproduction is permitted which does not comply with these terms.
*Correspondence: R. S. McLeod, bWNsZW9kQHR1Z3Jhei5hdA==