
94% of researchers rate our articles as excellent or good
Learn more about the work of our research integrity team to safeguard the quality of each article we publish.
Find out more
ORIGINAL RESEARCH article
Front. Built Environ., 07 January 2022
Sec. Coastal and Offshore Engineering
Volume 7 - 2021 | https://doi.org/10.3389/fbuil.2021.769161
This article is part of the Research TopicClimate Impact on Coastal ZonesView all 6 articles
 Fanglin Zhang
 Philip M. Orton*
Low-lying Coastal Landfill Neighborhoods (CLaNs) often have a large aspect ratio, defined here as the coastline length divided by neighborhood width, due to the common practice of reclaiming fringing wetlands along tidal waterways. Flood risk reduction for CLaNs frequently involves elevated barriers, in the form of berms, seawalls, or levees, which reduce risk but cannot completely eliminate residual risk (e.g., due to overtopping during extreme events). Managed retreat is an alternative approach for flood risk reduction, the general idea of which is to strategically ban development in hazard zones, relocate structures, and/or abandon land. This study aims at exploring the tradeoffs between elevated barriers and managed retreat in terms of both CLaN aspect ratio and storm climate, for both short-term and long-term risk reduction with sea-level rise. Hydrodynamic flood modeling of an idealized CLaN protected by different adaptation plans is used to simulate flood conditions and mortality for a range of storm surge amplitudes for both the present-day and under different sea-level rise scenarios. Results show that for a berm and a case of managed retreat of an equal cost, retreat becomes more beneficial than the berm in terms of mortality risk reduction for neighborhoods with a larger aspect ratio. The study also shows that berms are generally less effective for reducing mortality in regions with less common but higher intensity storms. This study reveals the potential of idealized modeling to provide fundamental insights on the physical factors influencing the efficacy of different adaptation strategies for mortality risk reduction.
Flood risk reduction for coastal floodplains frequently involves elevated barriers, in the form of berms, sea dikes, seawalls, or levees. However, any defense can be overtopped by a flood event that exceeds its project design height, and despite the low probability of being overtopped, the characteristics of these floods and their consequences are worth careful consideration. The authors’ prior research (Zhang et al., 2020) on mortality risk during Hurricane Sandy (2012) on Staten Island, New York, showed that once overtopped, a protective berm can cause more dangerous “flash flood–like” conditions and higher mortality. In Louisiana, over 1,100 deaths happened during Hurricane Katrina (2005), largely resulting from the breaching and overtopping of levees surrounding the city of New Orleans (Jonkman et al., 2009).
Staten Island’s eastern shore is an example of a typical neighborhood length, width, and elevation for Coastal Landfill Neighborhoods (CLaNs; Zhang et al., 2020). CLaNs are commonly seen on the east coast of the United States, as it was the first to develop land reclamation for seaside housing (Martín-Antón et al., 2016). Figure 1 shows examples of some other CLaNs (surrounded by white polylines) on the US east coast. These neighborhoods are similar in 1) their land elevation being low and relatively flat, bounded by increasing elevations on the inland side; 2) an elongated shape consisting of long along-coastline length and narrow cross-coastline width. As illustrated by the case of Hurricane Sandy and Staten Island, traditional hard defenses can sharply reduce but not eliminate flood risk for CLaNs. Once the defenses are overtopped, these basin-like neighborhoods are likely to be filled up with water quickly and dangerously, due to their large aspect ratio or length-to-width ratio. Hydrologic research has demonstrated how the morphologic features (e.g., shape and steepness) of a watershed can affect flood wave amplitude (Abuzied et al., 2016) and discharge (Elmoustafa and Mohamed 2013). While much attention has been paid to storm surge physics in the coastal ocean, little attention has been focused on flooding processes in coastal neighborhoods and the role of neighborhood morphology.
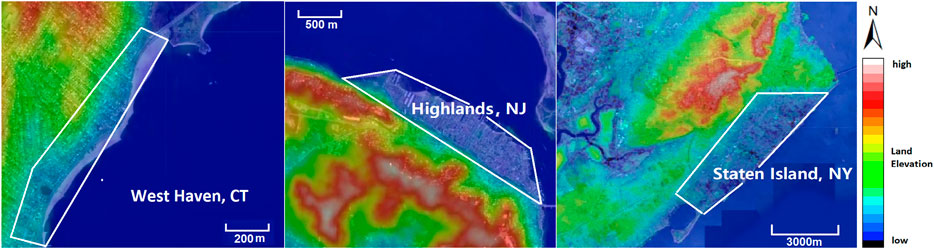
FIGURE 1. Digital Elevation Model of low-lying CLaNs in Highlands, New Jersey; West Haven, Connecticut and Staten Island, New York (images from Wikimedia).
Studies often evaluate risk reduction measures using only a single design storm (e.g., the 100-year flood), but the broader storm climate ranging from frequent to extremely rare events (e.g., 1,000 years or worse) can also be important due to the aforementioned implications for residual risk. Storm climate is the combination of a series of regional features that reflect and impact the storm processes and is typically studied using a long record of historical storm data. The main features include storm tracks, wind speeds, and storm surge magnitudes and frequencies (Pore and Barrientos 1976; Lin and Shullman 2017; Miao 2019). It is controlled by various factors and complex interactions such as geography, meteorology, latitude, longitude, and tides. Few studies have examined the efficacy of different flood adaptations on a wide variation of storm climates (e.g., for wetlands; Liu et al., 2013; Sun and Carson 2020). The difference between the 100-year and 1,000-year extreme water level is particularly important for the residual risk once the defense is overtopped. Zhang et al. (2020) showed that the difference between the water level for a 100-year flood and a 1,000-year flood in New York is approximately 1.7 m, whereas in the Netherlands it is approximately 0.6 m. New Orleans, Louisiana, is more hurricane-prone and has an even greater difference between the 100-year to 1,000-year water level of 3.1 m. The difference (reflecting the water level exceedance curve slope) in these areas is driven by the frequency of tropical cyclones, relative to extratropical cyclones.
Looking to the future, climate change and sea-level rise (SLR) will increase the vulnerability of low-lying floodplains. For instance, Arns et al. (2017) found that for shallow coastal areas, SLR amplifies wave amplitude, wave period, and tidal range. Marsooli et al. (2019) showed SLR increases storm surge heights along the US East Coast due to changes in the tropical cyclone meteorology. Also, the long-term flood risk of CLaNs can be exacerbated by the increasing probability of the overtopping of hard defenses. Retreat is often regarded as a good long-term adaptation to the rising sea level (California Coastal Commission 2015; Aerts 2018), due in part to the dangers of walling in coastal neighborhoods. Apart from strategically relocating structures and residents, retreat also involves banning development in hazard zones, and/or abandoning land (Neal et al., 2005). It has the advantage of being able to impede the continuous urbanization trend in the hazardous coastal zones. It is also the only type among five SLR adaptation approach categories (protection, accommodation, advance, retreat, and ecosystem-based adaptation) that can completely avoid residual risk (Oppenheimer et al., 2019).
In the United States, benefit–cost analysis (BCA) uses flood monetary damages as the primary guide in decision-making on flood adaptation, and mortality risk is not quantified. In 1986, the US Water Resources Development Act required that loss of human life associated with coastal storm events shall be displayed in the BCA of planning. However, the United Army Corps of Engineers (USACE) presently only use monetary costs and benefits in ranking adaptation alternatives (e.g., USACE 2016; USACE 2019). It has been demonstrated that this leads to inequity by favoring the protection of wealthier neighborhoods (Loeb 2021). Recently, the USACE has been directed to consider a wider range of metrics in their studies, including other social effects such as mortality (USACE 2021). A wide variety of flood mortality models are available based on mechanical considerations or empirically on historical flood events (Di Mauro et al., 2012; Yin et al., 2016) and can also be applied to study the efficacy of flood adaptation efforts.
The goal of this study is to explore and compare risk reduction measures for low-lying CLaNs based on the CLaNs’ morphological and climatological vulnerability. This goal is achieved by simulating flood conditions in idealized CLaNs under the protection of different risk reduction approaches under various sea-level scenarios. In this study, berm protection and managed retreat of an approximately equal cost are studied to focus attention on the processes and consequences affecting mortality risk reduction. The effect of differing CLaN morphologies is investigated through simulating floods for a range of CLaN aspect ratios. The influence of storm climate on risk and adaptation benefits is studied with three different storm sets ranging from more uniform storms, typically extratropical cyclones (e.g., the Netherlands and the Gulf of Maine), and up to locations at risk from major hurricanes (e.g., Louisiana, US). Different categories of mortality models are applied and compared to evaluate the consequences of mortality risk. This study is organized as follows: section 2 introduces the methods used in this study; section 3 presents results and sensitivity analyses carried out in this study; and section 4 discusses the findings and draws conclusions.
In this study, flood conditions are simulated using hydrodynamic flood modeling of idealized low-lying neighborhoods protected by different adaptation plans both for present-day and under different sea-level rise scenarios. The Stevens Estuarine and Coastal Ocean Model (sECOM) is a hydrostatic, free-surface, terrain-following, structured grid numerical ocean model (Blumberg et al., 1999; Orton et al., 2016). It is used here in its two-dimensional mode (sECOM-2D) to simulate the process of ocean water flooding the coastal neighborhoods. Waves are neglected, but the potential effects of wave overtopping and run-up are discussed in section 4. The model has been improved in recent years to include flooding and drying processes important for the present study (Blumberg et al., 2015) and applied in subsequent flood forecasting and research (e.g., Jordi et al., 2019; Orton et al., 2020).
The sECOM-2D model is applied to a series of idealized CLaN domains with uniform shoreline lengths of 1,000 m and a 2-m resolution. The different aspect ratios are achieved by the varying width of the CLaNs. CLaNs with length-to-width ratios of 3:1 and 11:1 are compared (Figures 2B,C), mimicking the aspect ratios of neighborhoods like Staten Island eastern shore in New York and Highlands in New Jersey, and a baseline aspect ratio of 1:1 (Figure 2A) as well. Model plan views in Figures 2A–C depict low-lying CLaNs with a berm on the ocean side and elevated landforms on the back and sides. Figure 2C is a schematic cross-sectional diagram of the aspect ratio 3:1 case, where the berm is located from 500 to 600 m and the CLaN from 600 to 900 m along the y-axis. The housing blocks shown in yellow in the elevation planforms in Figure 2 are elevated to 10 m to completely resist water from flowing inside or overtopping the houses. The sensitivity to this approach is further discussed in section 3.3.1.
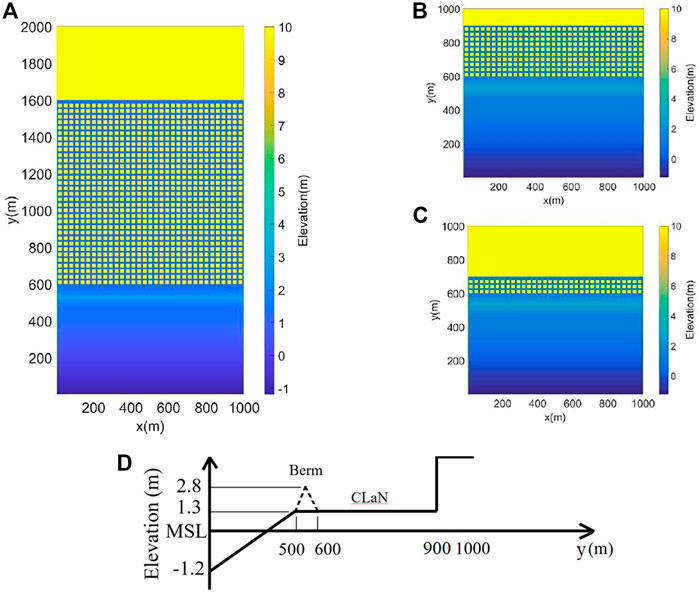
FIGURE 2. Land elevation planform for idealized model grids with CLaNs’ aspect ratio of (A) 1:1, (B) 3:1, and (C) 11:1. (D) Schematic cross-sectional diagram of AR 3:1, with the dotted line denoting the berm as one option for adaptation. Berm protection is shown as a dashed line and retreat is not shown (the CLaNs are fully populated).
The CLaNs are simulated with idealized arrangements of housing and streets to imitate the features of urbanized neighborhoods, roughly mimicking average spacings observed in relatively urbanized CLaNs in the New York Bight region. An important ratio is that of the length of open space across streets (including front yards) to enclosed spaces of homes that infill more slowly during a flood event with the density of 0.001 houses per square meter (Staten Island, NY housing density). The idealized, developed blocks are assumed to have a 20-m by 20-m square shape and are evenly spread in the idealized CLaN. These blocks account for houses, garages, and other relatively impermeable or slowly filled areas (e.g., courtyards). Spaces between blocks in both the x- and y-axial directions are 10 m wide which include streets, yards, and other open spaces. Modeling buildings as obstructed areas and only allowing flow down streets is a common assumption of high-resolution hydrodynamic flood modeling (e.g., Wang et al., 2014; Blumberg et al., 2015), but the sensitivity of the results to this approach is assessed in section 3.3.1. The Manning roughness coefficient for streets, berms, and open water benthic substrates is taken as 0.02, common for smooth surfaces (Mattock and Forbes, 2008).
The open boundary of this model is set at the ocean side [along the x-axis (y=0) of the model grids shown in Figure 2]. Only water elevation is applied as a boundary condition due to the idealized modeling setup used in this study, which renders conditions outside these boundaries irrelevant. The offshore boundary condition water elevation for each storm is a simplified sinusoidal wave time series, thus it enters the domain and propagates in the positive y direction. The wave has an amplitude equaling the storm tide peak elevation and a period of 12 h. Rising over a 6-h surge onset time, the water level reaches its maximum and subsequently falls. This onset time is based on the median onset time of 30 extratropical and eight tropical historical storm tide events (Orton et al., 2016) at the Battery, New York City (NYC). Flood onset time can vary depending on locations and storm types (e.g., extratropical vs. tropical cyclone floods, tide-dominated vs. surge-dominated floods, fast-moving storms vs. slow-moving storms). However, due to the important contribution of semi-diurnal tides to peak water levels in storms for many areas (e.g., for the entire U.S. Atlantic Coast), and the fairly typical surge rise time of 5–10 h during hurricanes, the flooding process can be well represented with a 6-h rise to peak water level. The sensitivity of the results to the assumed 6-h onset time is assessed in section 3.3.2.
The storm tide (sinusoid) amplitudes (simulation temporal maxima) for return periods from 1 to 10,000 years in this study are similar to the NYC data, with a relatively gradual increase in amplitudes for return periods from 1 year to 100 years reflecting relatively frequent extratropical cyclones, and sharper increases for higher return periods reflecting rare hurricane storm surges (Orton et al., 2016). Boundary condition sinusoid amplitudes based on the flood return period can be found in section 2.2.
sECOM provides water output of water depth and velocity for various adaptation measures and the future without adaptation (FWOA) scenario as a baseline (this term is used for both near-future or “present,” and future sea-level scenarios). The rate at which water rises (rise rate, in m per hour), which is also the water depth change rate, is computed using the water depth time series data. In this study, water physics, including water depth
This study uses three idealized hazard curves (HC) representing three different types of storm climates ranging from those dominated by hurricanes (or more generally meaning severe tropical cyclones) to those dominated by extratropical cyclones (Figure 3). The central case (HC2) is typical of the New York Bight region, with a “mixed storm climate” comprising a mixture of frequent extratropical cyclones and rare moderate hurricanes with storm intensities and surges limited by cool mid-latitude waters (e.g., Orton et al., 2016). Case HC1 represents an “extratropical cyclone dominated storm climate” typical of Boston, MA (or the Netherlands), that has moderate storm tides annually from extratropical cyclones but little or no influence on storm tide probabilities from hurricanes (e.g., Talke et al., 2018; NOAA 2021, station 8443970). Case HC3 represents an “extreme storm climate” typical of Gulf Coast locations like Pensacola, FL, where the curve is controlled by tropical cyclones, but many years have no storms and low maximum water levels (e.g., NOAA 2021, station 8729840).
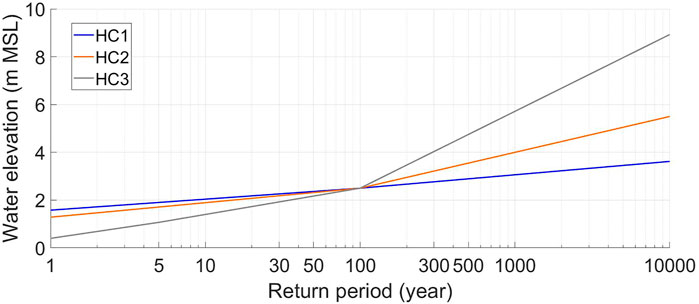
FIGURE 3. Water level vs. return period curves for the three idealized hazard curves.
The three idealized curves intersect at the 100-year flood water level (of 2.6 m) so thatso that the applied berm height is the same for all three cases and the modeling is rendered more tractable (fewer different landscapes). However, this is not unrealistic, given that NOAA estimates of 100-year water elevations for Boston, New York, and Pensacola are in the range of 2.4–2.9 m (NOAA, 2021). One aspect of the idealized curves is a change in curve slope at the 100-year return period. For lower return periods, flood risk is dominated by tides and/or extratropical cyclones (if present), whereas for longer return periods hurricanes (if present) drive the overall risks (e.g., Orton et al., 2016).
Climate change effects are applied to the hazard curves only as an increase in water levels due to 0.5 and 1.0 m of sea-level rise. Here, the more complex effects of changes to tropical and extratropical cyclones, which are relatively less well understood due to the small size of storms relative to climate model resolution, are not considered. Simulations of changes to extratropical cyclones show unclear trends and substantial variations across different climate models (Lin et al., 2019). The one widely applied approach to downscaling climate model projections to study future changes to tropical cyclones recently showed that the changes are also spatially highly variable (Marsooli et al., 2019), which would add complexity to any effort to incorporate it into the idealized hazard curves in this study. However, comments on the potential effects of these changes are provided in section 4.1.
A simplified probabilistic risk framework is applied to produce the main quantitative result—Expected Annualized Fatality (EAF) from floods. This is done by simulating a range of events from 1-year to 10,000-year storm-driven floods and integrating the human life loss for these events over their probability. The numerical integration uses the trapezoidal rule to compute annualized consequences (Olsen et al., 2015):
where T is the return period (years); i ranges from 1 to 9, denoting 9 trapezoids from 10 return periods of flood; and F is fatality. The numerical integration approach was proven to generate similar results as other two annualized consequence calculation methods (simulated time series and analytical solution) in the comparison of expected annual consequence computation methods (Olsen et al., 2015) and thus is considered reliable.
The adaptation measures simulated include 1) a berm with the same length of the CLaN and an elevation equaling the 100-year flood elevation plus a 30-cm (1 ft) freeboard1 and 2) managed retreat of a number of homes that adds up to an equal cost to the berm. Homes closest to the shorefront are subject to retreat first. Homes retreated are moved out of the interest area, and thus, the DEMs at the retreated home footprints are made at the same level as the land elevation. The following points summarize the assumptions regarding the cost of building berms and buyouts:
1) The unit cost of building a berm is M$ 27 per kilometer length per meter elevation (Jonkman et al., 2013)2.
2) The value of the houses in the CLaN is assumed to be uniform, and the value is M$ 0.3 according to the American Housing Survey (AHS) median home value estimate of New York State for the year 2017.
3) Each adaptation measure is updated as the sea level rises, to maintain the protection against the rising 100-year flood (but with corresponding cost increases).
Table 1 summarizes the cost of berms aimed at protecting from floods with a 100-year return period and larger flood height and the number of rows of house that can be retreated at the same cost. Note that at the cost of a berm with a 100-year return period of flood design height, all houses are retreated in the CLaN with an 11:1 aspect ratio even with no sea-level rise.
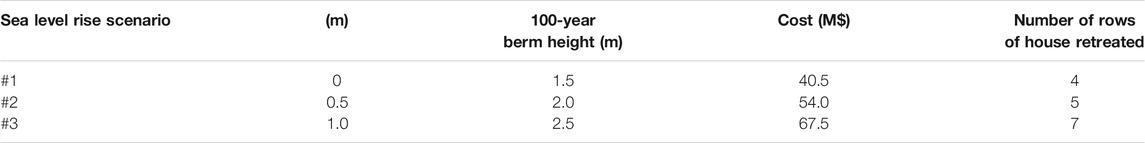
TABLE 1. Dimensions and costs of berm and retreat.
A common way of estimating the effectiveness of flood risk reduction measures is by benefit–cost analysis (BCA). However, due to the assumption that the building of berms and the implementation of buyouts (retreats) are compared at equal costs, in this study only the relative fatality reduction benefit is evaluated.
A limited number of mortality models are available for coastal flood life loss estimation. This is partly due to limited historical flood mortality data as well as the complex life loss causes and mechanisms. Several published models for mortality (Waarts 1992; two models for Typhoon Jane and Typhoon Isewan separately in Mizutani 1985, quoted in Tachi personal communication and can be found in: Jonkman 2007; Boyd 2010; Jonkman 2007; Jonkman et al., 2009; Zhang et al., 2020) as a function of physical flood conditions are applied to derive the life loss consequences. The selection of these mortality models in this study is based on two principles. First, they were derived from coastal flood events instead of river flood events, and thus are applicable to coastal flood conditions that are modeled in this study. Also, a common feature these functions share is that none of them are based on independent variables (such as traditional demographic factors, e.g., age, sex, race, disability, income, and education level) other than basic water characteristics (water depth, horizontal water speed, and the rate at which water rises). There are other more complex mortality models (e.g., LifeSim; HEC FIA) and agent-based models (e.g., BC Hydro’s LSM) that incorporate not only the same water physics but also socioeconomic factors (e.g., physical mobility, population density, warning, evacuation, and shelter).
The life loss risks are evaluated using these mortality models with an ensemble perspective, with each model being equally weighted. Among these adopted models, the data from which the models were derived are distinct in many aspects. For instance, the number of flood events involved ranged from 1 to 6. Also, the spatial unit varies from as small as a model grid cell of ∼200 m2 (e.g., Zhang et al., 2020) to large units such as the sizes of cities or towns (hundreds of square kilometers, e.g., Mizutani 1985). Only the model of Zhang et al. (2020) was developed using data only from a CLaN. In this study, results of all available and appropriate models are analyzed to reduce the potential for a biased model-specific perspective due to climatic and morphologic features and other potential factors on mortality estimation.
The mortality results are classified and compared based on three types: models that 1) only depend on water depth
Mortality at each time step of each grid cell is computed by feeding water depth, speed, and rise rate output from the hydrodynamic model sECOM to the mortality models. Then the mortality of the whole domain in each modeled scenario is the spatial mean value in the CLaN of the temporal maximum mortality of each grid cell. Building spaces are excluded from the mortality computations, which is typical for mortality modeling. Although the loss of lives not only happens in open areas, but people also lose lives inside their homes in flood events, the mortality models adopted in this study were derived to capture life losses in the whole study area.
In this research project and study, it was found that the Zhang et al. (2020) model (model F4) is an outlier among the set of mortality models, and this could arise because it was developed with data for only one neighborhood during one storm event. Therefore, conditions may have been different for this one event from the conditions used in developing other mortality models. The model likely oversimplifies the processes behind flood mortality to only one variable because it included a relatively small number of mortalities (18) relative to other studies (200–4,000). However, the model specifically focused on a CLaN during a 300-year return period hurricane-hybrid storm (Orton et al., 2016), and thus it is included in this study for its specificity to the conditions of interest here. Other models captured different geographies (e.g., an entire low-lying city for Katrina; Jonkman et al., 2009), nontropical cyclone events, or a wider range of conditions.
The results from these mortality models are displayed by the EAF reduction results in the form of the fatality reduction benefit as a fraction of control case without adaptation (hereafter RFR, i.e., Relative Fatality Reduction benefit). For example, the RFR of berms is a fraction computed as
Expected Annualized Fatalities (EAFs) per capita for the baseline present-day conditions are given in Table 2. The order-of-magnitude EAF of 10 per 10,000 population is very high but results from the assumption that no adaptation (or evacuation) exists, and the neighborhood is subject to flooding. However, the baseline serves as a necessary contrast to adaptation decisions that can be made for such an endangered neighborhood. It also enables one to compare baseline risk for CLaNs with different aspect ratios and storm climates. Model F1 gives similar EAF per capita predictions across aspect ratios regardless of storm climate. Results by models F2 and F3 show that when a neighborhood has a narrower width, it can have a higher EAF per capita (e.g., AR 3:1 verse 1:1 case, or AR 11:1 verse 1:1 case). Results by model F4 indicate even larger increases in EAF per capita with the increase in aspect ratio (e.g., a 36 and 65% larger EAF per capita for AR 3:1 and 11:1 cases, respectively, compared to the AR 1:1 case). Places with rare but extreme hurricanes (HC3) have lower EAF per capita than places with the mixed storm climate (HC2), and places with no hurricanes (HC1) but frequent moderate storms have the most EAF per capita.
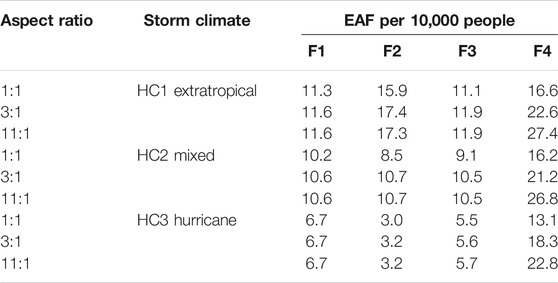
TABLE 2. EAF (per capita) for present-day without adaptation to reduce flooding.
Hereafter, the study will focus on the benefits of the adaptation measures in terms of relative fatality reduction (RFR). Section 3.1 broadly addresses the mortality risk reduction and its changes with sea-level rise. This section about mortality risk is further brought down to two separate subsections: the influences of aspect ratio and storm climate on mortality risk reduction are presented in section 3.1.1 and section 3.1.2, respectively. Section 3.2 explains fundamental aspects of flood water dynamics in CLaNs and how they impact results in terms of aspect ratio and adaptation choices for reducing mortality. Lastly, section 3.3 analyzes the sensitivity of results to the methods and assumptions used in this study.
The RFR results for berm and retreat for all aspect ratios under three different sea-level scenarios and central storm climate (HC2) are shown in Figure 4. Focusing first on berms, the positive RFR results from F1, F2, and F3 indicate that they reduce mortality for all the scenarios (Figure 4A). However, no significant influence of SLR on mortality has been found in the results calculated by F1, F2, and F3—they all show a nearly constant relationship between SLR and mortality benefit, which is unsurprising given that the berm height increases with SLR (see section 2.2 for adaptation assumption details).
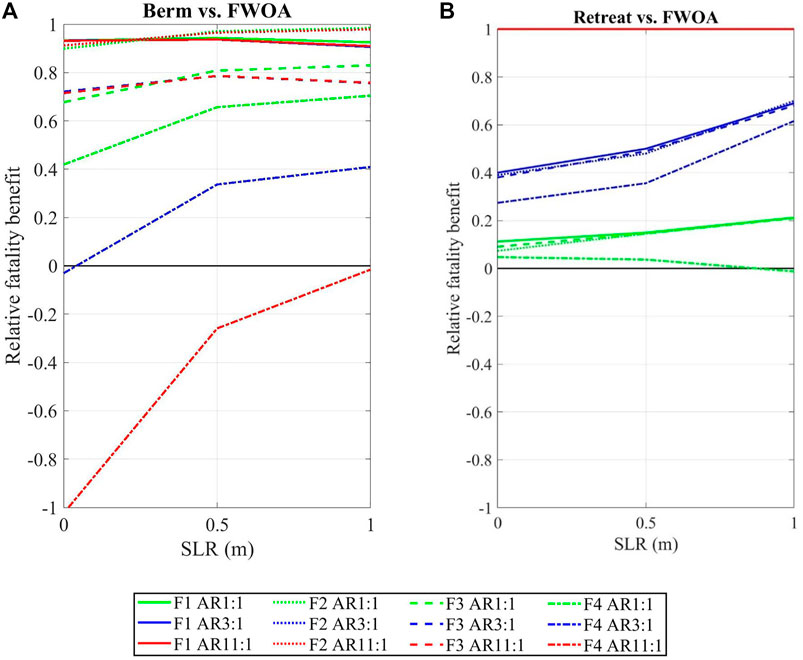
FIGURE 4. Relative fatality reduction (RFR) between FWOA and risk reduction measures (A) berm and (B) retreat, for CLaNs with different aspect ratios (AR). Four different line types represent results calculated by four different mortality models
In contrast to the first three models, F4 produces distinctive results for berm protection. Rather than providing risk reduction, F4 depicts a picture where berms can cause more life losses under some circumstances (a negative RFR). All cases can have lower RFR for present-day than future SLR scenarios. The effect of berms leading to more deaths than FWOA attenuates gradually with SLR. Thus, it is found that berms become protective and start to reduce mortality from 0.5 m SLR in the aspect ratio 1:1 case and from 1 m SLR in the 3:1 case.
Next, focusing on retreat, the RFRs are always positive (except for one near-zero case of AR 1:1 under 1 m SLR that will be discussed in section 3.1.1), meaning that retreat always reduces mortality (Figure 4B). The AR 11:1 is a special case where all houses are retreated even for the present-day (0 SLR) and thus has no mortality and a RFR of 1. In most cases, as sea level rises, an increasing or flat trend in RFR in retreat adaptations is found, a similar overall pattern to that of berms. This trend is also correlated with AR, as will be further discussed in section 3.1.1.
For retreat adaptation (Figure 4B), it is agreed by all four mortality models that the aspect ratio predominantly drives the mortality results; retreat is most effective for mortality risk reduction for CLaNs with a larger length-to-width ratio because it moves most or all people out of the floodplain. As mentioned earlier, the AR 11:1 is a special case where all houses have retreated even for present-day (0 SLR). However, as for the other two AR cases, mortality models F1, F2, and F3 all suggest that RFR increases with SLR. Water depth change in the CLaN in retreat cases is negligible (F1, F2, and F3 are mainly water depth–dependent models); thus, this is only due to the population change caused by retreat.
Mortality model F4 is again an outlier, as it suggests a decreasing trend of RFR with SLR in the AR 1:1 case. This is due to an increase in the water rise rate, which is the only influential factor of model F4. As the sea level rises, more rows of houses are retreated from the neighborhood, leading to lower resistance due to obstruction by houses that prevents water from entering the CLaN and thus increases the water rise rate. RFR increases with SLR in the AR 3:1 case; however, an increasing trend in the water rise rate is also seen. This is because the change in AR and exposed population in the AR 3:1 case, is not as significant as in the AR 1:1 case.
For berm adaptation (Figure 4A), the results are strongly model-dependent, with a trend toward lower mortality risk reduction from models F1, F2 (∼0.9–1.0 RFR), F3 (∼0.7–0.8), and F4 (−1 – 0.7). F4 is also the only one among the four mortality models which suggests that aspect ratio is a strongly influential variable in determining mortality. The RFR of berms in the aspect ratio 3:1 case is 72–152% larger and is 116–551% larger in the 11:1 case than in the 1:1 case. This is due to the significant difference in the water rise rate in CLaNs with different aspect ratios mentioned in section 3.1. Although water depth is not the only variable in F2 and F3, it still dominates in determining mortality (see equations of F2 and F3 in the Supplementary Material; w and v determine equation segments, while h is the predictor variable in the equations). The percentage difference in water depth during overtopping events in berm-protected CLaNs with three different aspect ratios is less than 10%; therefore, no relationship between mortality and rise rate has been found using F1, F2, or F3 (see section 3.2 for more details).
Given the strong risk reduction of retreat for large aspect ratio CLaNs and the imperfect risk reduction of berm protection (particularly with models F3 and F4), retreat tends to be more effective for reducing fatality in CLaNs with large aspect ratios. Also, retreat in CLaNs with larger aspect ratios tends to better reduce mortality than CLaNs with smaller aspect ratios in terms of both short-term and long-term planning. Concerns over scenarios with higher sea level rise, though lower probability, warrant consideration of 2 m SLR (e.g., the 90th percentile estimation of SLR in NYC by 2100 is 1.9 m; Horton et al., 2015). At the extreme case, the entire neighborhood in the CLaN with a 11:1 AR can be retreated at the same cost of the designed berm, even for the present-day.
The four mortality models yield results (Figure 4B) with smaller discrepancies in the retreat cases than in the berm cases. The RFR difference among the four mortality models in the AR 1:1 case is 3–105% and is 5–59% in the AR 3:1 case. Apart from the 1% increase of fatality in the AR 1:1 CLaN under the 1 m SLR scenario predicted by F4, it is suggested by all models that retreat always reduces fatality. Fatality rises instead of drops in that one case despite the partially-retreated population because water rise rate gets increased by SLR.
These effects of aspect ratio on mortality risk reduction are relatively unaffected by storm climate. The plots comparing RFR of CLaNs with different aspect ratios across all storm climates can be found in Supplementary Figure SA. Mortality with models F1, F2, and F3 is primarily or completely governed by water depth, and the results of these three models typically have similar trends (e.g., Table 2). Therefore, only F3 and F4 model results are shown in Supplementary Figure SA.
For the same reason mentioned above, only results of F3 and F4 are analyzed in the comparison of the three circumstances with different hazard curves. For berms, both F3 and F4 (Figures 5A,C) indicate that the ranking of RFR for berm cases is HC1 > HC2 > HC3. In other words, a berm reduces more fatalities and also a higher fraction of fatality for locations subject only to extratropical cyclones. Negative cases of RFR with model F4 with HC2 and HC3 imply that berms can become harmful under certain SLR scenarios by increasing fatalities for areas with hurricane flood hazards.
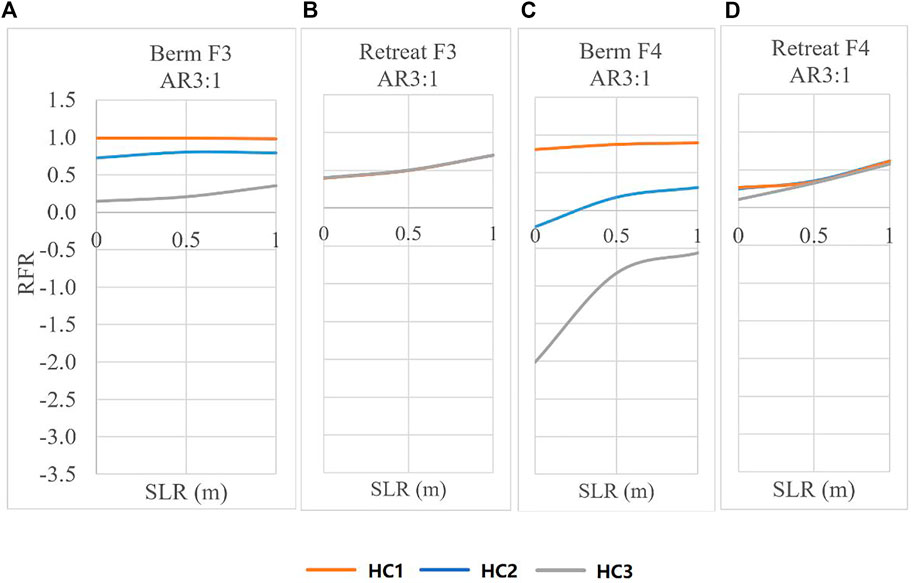
FIGURE 5. Relative fatality reduction (RFR) under three storm climatology scenarios. (A,C) are berm results; (B,D) are retreat. (A,B) are results by model F3; and (C,D) are by F4. In (B,D) lines are not distinguishable due to overlapping.
Figures 5B,D indicate that storm climate has at most a minor influence on the effectiveness of retreat. Contrasting berms and retreat, all mortality models agree that berms are relatively ineffective for areas with extreme storm climates. Specifically, for the AR 3:1 case (only the intermediate aspect ratio case is discussed, and the reasons are explained in the next paragraph), the HC3 cases in Figure 5B exceed the HC3 cases in Figure 5A, meaning retreat is more beneficial in reducing mortality than berms. However, HC1 and HC2 curves in Figure 6A are significantly higher than the HC1 and HC2 curves (overlapped with the HC3 curve) in Figure 5B. F4 results displayed in Figures 5C,D further support (and amplify) this pattern.
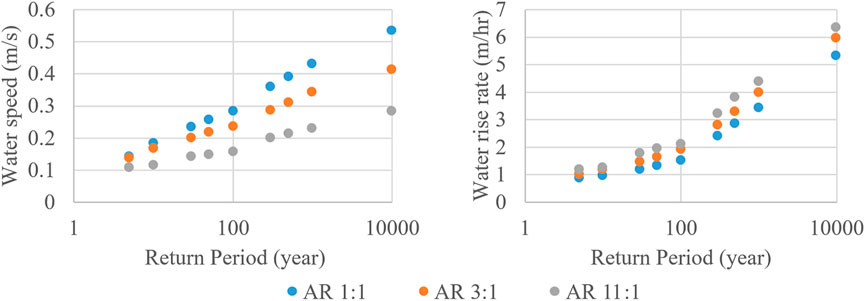
FIGURE 6. Water speed (left) and rise rate (right) of baseline (no adaptation) with no SLR. Values are the spatial average of temporal maxima within CLaNs, although mortality was computed using spatially varying data (section 2.4).
For berm adaptation, the impact of aspect ratio on RFR for any storm climate is more subtle (less than 0.1) (Supplementary Figure SA). However, for retreat, a larger aspect ratio leads to higher RFR (as explained in section 3.1.1). This only influences the specific storm climate in which retreat is equally beneficial to berms, but the general finding is maintained, which is that retreat is more beneficial than berms in regions with storms of a higher intensity.
To better understand the performance of flood adaptations in reducing mortality risk, water physics during the flooding of the neighborhood is also analyzed. First, viewing the FWOA conditions to understand the baseline flood conditions driving mortality risk, the model outputs of this study show opposite responses of horizontal water speed and vertical rise rate to the changes in aspect ratio. For instance, water speed decreases while the rise rate increases with the increase in the CLaN’s aspect ratio. An example shown in Figure 6 illustrates how the 1:1 aspect ratio (blue dots) leads to a larger water speed but a smaller rise rate than the 3:1 case (orange dots) and then the 11:1 case (gray dots). Floods with longer return periods further increase the water velocity (both horizontal and vertical) conditions among different aspect ratios.
Next, the time series of water depth and speed when a berm adaptation is overtopped is considered, and the results for the three aspect ratios are compared (Figure 7). In this case, a smaller aspect ratio leads to a wider neighborhood and a larger inundation area, thus leading to a slower temporal maximum rise rate. The rising flood water after overtopping the berm depicted in Figure 7 (left panel) demonstrates this pattern—the water depth curve in the 11:1 CLaN increases from time ∼125–∼140 min with the steepest slope and the largest water rise rate among the three aspect ratio cases, whereas the 1:1 CLaN has the flattest rising curve and the slowest rise rate. The model results suggest a 10–26% larger temporal maximum rise rate of 3:1 and a 19–50% larger rise rate of 11:1 than the 1:1 CLaN.
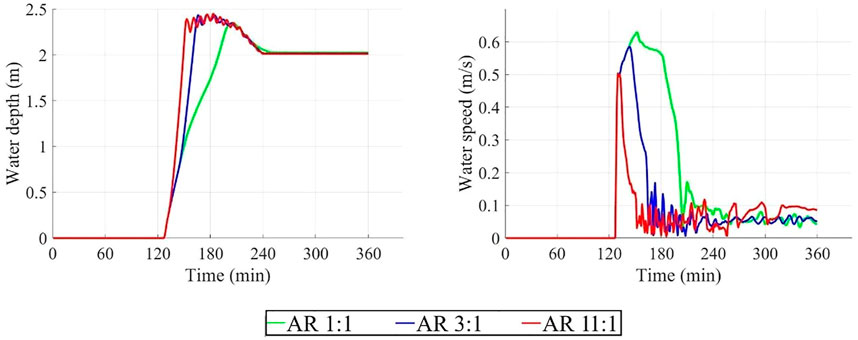
FIGURE 7. Time series plot of berm cases under the 300-year flood condition and 0.5 m SLR. Left panel is water depth and right panel is water speed of CLaNs protected by berms under 0.5 m SLR.
The difference among peak water depth across the full range of aspect ratios is always less than 10% with or without flood adaptation and regardless of SLR. For example, as shown for the berm overtopping, 300-year flood, and 0.5 m SLR in Figure 7 (left panel), the difference in peak water depth for cases with different aspect ratios is small. This further demonstrates the cause of the similar results of F1, F2, and F3 models shown in section 3.1.1.
Regarding the impact of aspect ratio on water speed, the modeled flood water rushes down longer streets which are perpendicular to the shoreline faster in CLaNs with smaller aspect ratios (see water speed shade plots in CLaNs in Figure 8 for the 300-year flood condition under 0.5 m SLR). This may arise because of the more rapid water rise rate in the 11:1 aspect ratio case, which leads to a higher water level and lower pressure gradient from the high berm to streets, thus driving a lower water speed. On the contrary, for the 1:1 case, water level in the low-lying CLaN stays low for longer due to its greater width, and the steeper gradient drives a higher water speed. The difference between water flowing progressively into a wider neighborhood and the immediate conversion of horizontal to vertical velocity for a narrower neighborhood that is rapidly filled contributes to the fact that a CLaN with a smaller aspect ratio has a larger maximum water speed.
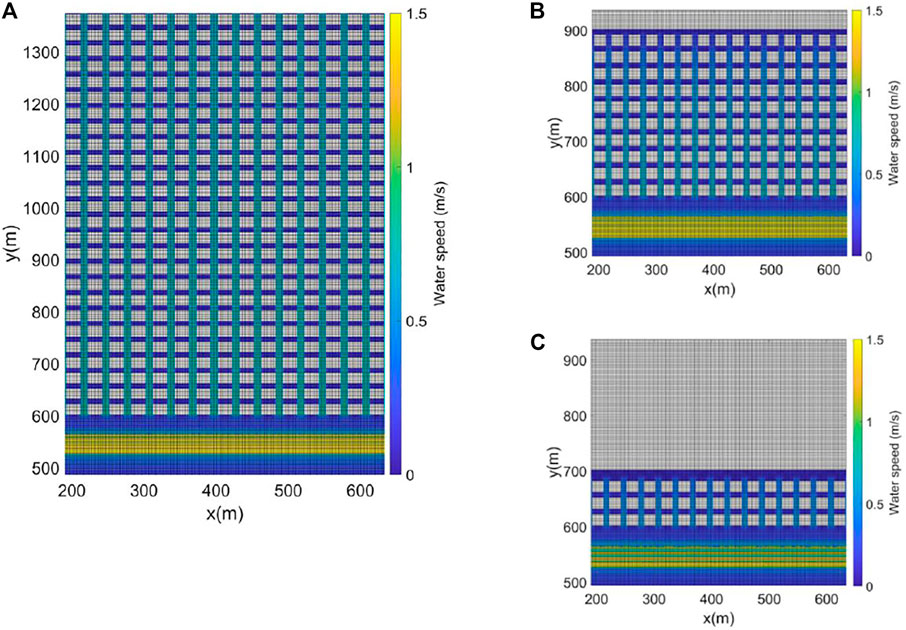
FIGURE 8. Temporal maximum water speed in parts of each CLaN when protected by a berm, with an aspect ratio of (A) 1:1, (B) 3:1, and (C) 11:1 under the 300-year flood condition and 0.5 m SLR.
Here, the sensitivity of results to several important assumptions of the model setup and parameters are tested.
The idealized setup of the model used in this study considers homes as impermeable elevated areas in the Digital Elevation Model (DEM). Water can only flow down streets in such models. The method used in this study was compared with an alternative high-resolution approach used in Beretta et al. (2018), which uses a “bare-Earth” (no buildings) DEM where footprints of homes are treated as a locally elevated roughness coefficient (Manning’s n = 10), enabling water to gradually flow onto their footprints. No significant change was observed in mortality calculated using the F1, F2, and F3 models. With model F4, the roughness approach led to a significant decrease in the water rise rate by 11–25% (across three aspect ratios and 10 return periods of flood) for berm cases, while causing no significant impact on FWOA and retreat cases. As a result, RFR computed by the F4 model for berm cases is increased by 8–72%. This means a less negative effect the berms have on mortality due to the amplification of the water rise rate, yet berms still lead to more EAF than FWOA. However, for all models, the effects of this alternative setup do not significantly influence the results of this study.
To evaluate the impact of differing rise flood onset times, the effect of setting the onset time to 3 and 12 h (also consulting the 38 historical events) for floods with the 300-year return period was tested. Only F4 model–derived mortality is sensitive to the flood onset time. A longer onset time leads to a slower rate of rising water, and lower mortality, with model F4. Another potential added area of complexity might be to consider the most extreme events, typically more extreme storms, to arise from faster storms with shorter onset times. If this were the case, with model F4, the shorter lead time would lead to higher mortality for berms. Together, these results suggest any sensitivity to flood onset time would not alter the general result of this study, that berms have a lower RFR for places with hurricanes (versus without), across all models.
To examine the influence on mortality due to the choice of the 30-cm freeboard height, two other cases were tested where the berm is set based on (1) the 100-year flood elevation without a freeboard and 2) the 100-year flood elevation plus a 90-cm freeboard. An increase in freeboard height leads to lesser residual risk and thus a larger RFR. Model F3 results show that compared to the cases without a freeboard, both the 30-cm freeboard and 90-cm freeboard increase RFR by a small amount in places with no hurricanes (HC1) or mixed storm climates (HC2) (e.g., 2 and 4%, respectively, for case AR 3:1 under 0.5 m SLR with HC2). However, for locations with only hurricanes (HC3), the 30- and 90-cm freeboard can increase RFR more significantly (e.g., 113 and 194% in the same AR and SLR scenario). Model F4, however, shows that the higher the freeboard, the faster the water rises, leading to a more dangerous situation and a lower RFR. Similar to model F3, the freeboard increases RFR more significantly in places with hurricanes. The influence of freeboard height on RFR comparisons for different aspect ratios is relatively unaffected (less than 10%). However, both the inexistence of the freeboard and the 90-cm height of the freeboard do not alter this study’s general results on the influence of storm climate on mortality.
This study utilizes idealized or conceptualized modeling to evaluate two different approaches for coastal adaptation for reducing mortality risks across a range of coastal neighborhood aspect ratios and storm climates. In this study, eight empirical mortality models were used to investigate three different aspect ratios (1:1, 3:1, and 11:1) of coastal neighborhoods and three different storm climates (extratropical cyclone–dominated climate, mixed storm climate, and extreme hurricane–dominated climate) under three different SLR scenarios (0, 0.5, and 1 m). Berm and retreat adaptations are executed and updated as sea level rises and always compared at equal costs pertaining to berm heights for the 100-year flood level plus freeboard.
The approach of exploring mortality using idealized modeling in this research is novel in two aspects. First, it has advantages in the convenience of control variables and being economic in computational power and time. Looking forward, this approach can be taken in subsequent studies with increased detail to enable broader exploration of the effectiveness of other adaptation plans (e.g., combination of berm and strategic partial retreat with wetland restoration) with a wide range of storm climates in coastal neighborhoods with a more extensive range of morphological features. Water physics is only one important constituent of flood mortality risk assessment, and other influential factors could be incorporated and studied, such as demographic (see section 2.4) and socioeconomic factors (e.g., trust in government warnings and facilities, home use for vacation, or primary dwelling) and topographical features (e.g., land surface gradient and frictional factor).
Application of the sECOM model in the simulation of flood physics is a simplified method by only considering storm surge but ignoring wave overtopping and runup at hard defenses. This approach is reasonable for many CLaN locations where waves are small due to limited wind fetch. For example, Highlands New Jersey in Sandy Hook Bay (Figure 1) has no wind fetch in predominant east and northeast winds conditions typical of coastal floods there. To conduct a more comprehensive study that captures wave effects would require a more detailed simulation of waves and interaction between waves and surges. Coupled models such as ADCIRC and SWAN (Dietrich et al., 2012) are capable of accurately simulating surge and wave hydrodynamics, and overtopping formulae have recently been coupled that can incorporate these water fluxes into the simulation (Van Der Meer 2002; Pullen et al., 2007; Hughes and Nadal 2009). Therefore, what is concluded in this study may only be applicable to cases with small waves.
This study focuses on a particular idealized neighborhood morphology—elongated coastal neighborhoods that are relatively low-lying compared to a high land elevation on their inland side. However, mortality risk could respond differently to adaptation for neighborhoods with the same kind of elongated shape that do not have the inland elevated boundary. For instance, barrier islands and barrier peninsulas are commonly seen in the United States East and Gulf Coasts. These parallel-to-coast islands and peninsulas are formed by sand deposition and have more than one side of waterfronts. Storm tides and spatially varying wave overtopping effects could inundate barrier islands from different directions in these cases, adding additional complexity to the flooding processes. This type of land morphology should be addressed with future more detailed modeling and research.
Future research should include a wider analysis of both monetary and mortality risk reduction, including comparing different measures using benefit–cost analysis. Here, a simple question is posed: what measure would provide the greatest mortality benefit, given equal monetary costs? If a study utilizes benefit–cost analysis (BCA), it can aim to compare measures that are equally justified or likely (through identical benefit–cost ratios). Such a study may raise additional complexities, however, by including monetization of mortality risk reduction or ecological benefits for retreat that are harder to quantify.
It was found that the fatality reduction effectiveness of hard defenses can vary significantly in regions with different storm climates. Comparing locations that are similar in morphology (aspect ratio, area, etc.) and have a similar 100-year flood water level (e.g., New York Harbor, Pensacola, and Boston), the places that are only subject to extratropical cyclones (HC1) benefit the most from berms in reducing mortality, greater than places with hurricanes (HC2, HC3). Similarly, areas with only weak hurricanes and a mixed storm climate (HC2) have a greater mortality reduction benefit than areas with rare extreme storms (HC3). However, SLR tends to reduce differences across aspect ratio and storm climate. No significant influence has been found for storm climate on the efficacy of retreat for fatality reduction.
The result that berm protection provides lower mortality risk reduction in areas with hurricanes is due to two reasons. First, berms provide less flood protection for frequent floods (with a return period from 1 year to 100 years in this study) where the water level is lower. Second, the residual risk for extreme flood events with a return period greater than 100 years is higher for regions with storms of a higher intensity. The residual risk can also be higher for these regions if there is no freeboard or a freeboard that is based on SLR, thus being similar nationwide and not reflecting the variation in the prevalence of extreme storms. Climate change influences on storms were neglected in this study but have the potential to further worsen the residual risk for storm climates HC2 and HC3 if the frequency of major hurricanes increases in these regions as has been demonstrated for some locations (Marsooli et al., 2019). Therefore, it is recommended that the height of the freeboard should be based on regional storm climate or a consistent probability of water level (e.g., a 500-year return period), and that climate change effects on hurricanes are considered as this information becomes more available.
The results show that the aspect ratio of coastal low-lying neighborhoods can affect flood mortality. This result further shows that in terms of fatality reduction, aspect ratio is an important factor when selecting flood adaptations between accommodation and resistance measures. In this study, the idealized modeling has demonstrated the effectiveness of retreat in reducing fatality in CLaNs with large aspect ratios and small populations. However, the assumption of a constant home value (M$ 0.3) is a limitation and does not capture variations in property value that are known to exist. Berm costs also likely vary due to prevailing wages, material costs, and availability of property for construction, but to a lesser extent. For places with higher home values, for example, urbanized cities or wealthier suburbs, retreat would become less effective than places with lower home values. This is because fewer homes could be bought out under the same cost of a berm, leaving more residents exposed to mortality risk. Berm adaptations gain more of an advantage relative to retreat in these areas.
There are other complexities to consider in the tradeoffs between berm protection and retreat. Retreat in some coastal regions can be challenging due to its complexities in economic, cultural, and other considerations (Robinson et al., 2018). As a matter of fact, coastal cities have been expanding for decades (Surjan et al., 2016), partly due to the instinct to migrate toward the ocean for improved environment and health (Wheeler et al., 2012), and because of other needs such as financial and personal development (Tibbetts 2002). In that event, for CLaNs with large aspect ratios and faced with significant residual risk, the study of a wide range of possible adaptations such as evacuation, proper zoning policy, and insurance policy is critical and urgent. Education on flood risk can also help increase evacuation rate and improve the implementation of management policies.
There are also challenges in the implementation of berms that are not quantified here, including 1) hard defenses such as berms and levees can lead to a levee effect by letting the guard down and creating a false sense of safety and increased development (Di Baldassarre et al., 2009; Lane and Landstrom 2011). This may result in more exposed populations and lower evacuation rates and thus increase mortality risk. 2) Although this study only considers the construction cost of berms in the comparison of berms and retreat at equal costs, there are other considerations and costs in the implementation of hard defenses that are neglected here. An example is the potential for structural (internal) and geotechnical (external) failure, as well as maintenance expenses to avoid such failures (Wu et al., 2011; Ozer et al., 2016), which can significantly increase berm costs and slightly reduce the risk reduction outcome. However, the complexity of defense failure mechanisms (e.g., hydraulics, local geology) is beyond the scope of this idealized study. Another neglected factor that would be considered in a detailed real-world assessment is environmental impact mitigation requirements (USACE 2016).
That mortality is not currently evaluated in benefit-cost analyses implicitly assumes that an 100-year berm protection is always equally protective of human safety. To the contrary, this research shows that mortality risk reduction can vary significantly for different storm climates or neighborhood aspect ratios. The idealized modeling approach and findings of the importance of neighborhood aspect ratios and regional storm climate in this study should spur more fundamental research into the factors that influence mortality risk. More practically, awareness of these important morphological and climatological factors could provide useful cues for flood adaptation designs. This study recommends the consideration and quantification of these relevant factors in Coastal Storm Risk Management studies.
The raw data supporting the conclusions of this article will be made available by the authors, without undue reservation.
FZ and PO collaborated on research design. FZ was responsible for conducting the experiment and wrote the manuscript. PO gave feedback on the research design, contributed to the manuscript revision, and read and approved the submitted version.
This research is supported by a National Oceanic and Atmospheric Administration’s (NOAA) Regional Integrated Sciences and Assessments (RISA) program (Awards NA10OAR4310212 and NA21OAR4310313) and National Science Foundation (NSF) Prediction and Resilience Against Extreme Events (PREEVENTS) (Award 1855037).
The authors declare that the research was conducted in the absence of any commercial or financial relationships that could be construed as a potential conflict of interest.
All claims expressed in this article are solely those of the authors and do not necessarily represent those of their affiliated organizations, or those of the publisher, the editors, and the reviewers. Any product that may be evaluated in this article, or claim that may be made by its manufacturer, is not guaranteed or endorsed by the publisher.
The Supplementary Material for this article can be found online at: https://www.frontiersin.org/articles/10.3389/fbuil.2021.769161/full#supplementary-material
1Freeboard height varies in different projects. A typical requirement of freeboard uses a threshold of 1 L/s/m of overtopping volumes (e.g., USACE’s Harbor and Tributaries Coastal Storm Risk Management Feasibility Study; USACE 2019). This study used 1 ft freeboard height according to the minimum height of freeboard in Coastal Texas Protection and Restoration Feasibility Study (USACE 2020). Sensitivity of results to freeboard is analyzed in section 3.3.3.
2A value of M$ 27 is used in this study in order to estimate berm costs and resulting numbers of houses for retreat scenarios.
Abuzied, S., Yuan, M., Ibrahim, S., Kaiser, M., and Saleem, T. (2016). Geospatial Risk Assessment of Flash Floods in Nuweiba Area, Egypt. J. Arid Environments 133, 54–72. doi:10.1016/j.jaridenv.2016.06.004
Aerts, J. C. J. H., Barnard, P. L., Botzen, W., Grifman, P., Hart, J. F., De Moel, H., et al. (2018). Pathways to Resilience: Adapting to Sea Level Rise in Los Angeles. Ann. N.Y. Acad. Sci. 14271, 1–90. doi:10.1111/nyas.13917
Arns, A., Dangendorf, S., Jensen, J., Talke, S., Bender, J., and Pattiaratchi, C. (2017). Sea-level Rise Induced Amplification of Coastal protection Design Heights. Sci. Rep. 7, 40171. doi:10.1038/srep40171
Beretta, R., Ravazzani, G., Maiorano, C., and Mancini, M. (2018). Simulating the Influence of Buildings on Flood Inundation in Urban Areas. Geosciences 82, 77. doi:10.3390/geosciences8020077
Blumberg, A. F., Georgas, N., Yin, L., Herrington, T. O., and Orton, P. M. (2015). Street-scale Modeling of Storm Surge Inundation along the New Jersey Hudson River Waterfront. J. Atmos. Oceanic Technology 328, 1486–1497. doi:10.1175/jtech-d-14-00213.1
Blumberg, A. F., Khan, L. A., and St. John, J. P. (1999). Three-Dimensional Hydrodynamic Model of New York Harbor Region. J. Hydraulic Eng. 1258, 799–816. doi:10.1061/(asce)0733-9429(1999)125:8(799)
Boyd, Ezra. C. (2010). Estimating and Mapping the Direct Flood Fatality Rate for Flooding in Greater New Orleans Due to Hurricane Katrina. Risk, Hazards & Crisis in Public Policy 13, 91–114. doi:10.2202/1944-4079.1017
Bureau of Meteorology of Australian Government Ruling the Waves: How a Simple Wave Height Concept Can Help You Judge the Size of the Sea. Available at: https://media.bom.gov.au/social/blog/870/ruling-the-waves-how-a-simple-wave-height-concept-can-help-you-judge-the-size-of-the-sea/(accessed Oct, , 2021).
California Coastal Commission (2015). California Coastal Commission Sea Level Rise Policy Guidance: Interpretive Guidelines for Addressing Sea Level Rise in Local Coastal Programs and Coastal Development Permits. California,US: California Coastal Commission.
Di Baldassarre, G., Castellarin, A., and Brath, A. (2009). Analysis of the Effects of Levee Heightening on Flood Propagation: Example of the River Po, Italy. Hydrological Sci. J. 546, 1007–1017. doi:10.1623/hysj.54.6.1007
Di Mauro, M., De Bruijn, K. M., Meloni, M., and Meloni, Matteo. (2012). Quantitative Methods for Estimating Flood Fatalities: towards the Introduction of Loss-Of-Life Estimation in the Assessment of Flood Risk. Nat. Hazards 63 (2), 1083–1113. doi:10.1007/s11069-012-0207-4
Dietrich, J. C., Tanaka, S., Westerink, J. J., Dawson, C. N., Luettich, R. A., Zijlema, M., et al. (2012). Performance of the Unstructured-Mesh, SWAN+ADCIRC Model in Computing Hurricane Waves and Surge. J. Sci. Comput. 52 (2), 468–497. doi:10.1007/s10915-011-9555-6
Elmoustafa, A. M., and Mohamed, M. M. (2013). Flash Flood Risk Assessment Using Morphological Parameters in Sinai Peninsula. OJMH 3 (3), 122–129. doi:10.4236/ojmh.2013.33016
Fischbach, J. R., et al. (2012). Coastal Louisiana Risk Assessment Model: Technical Description and Coastal Master Plan Analysis Results. Santa Monica, California, United States: Rand Corporation.
Foster, J. L., and Muller, B. (2009). Performance Evaluation of the New Orleans and Southeast Louisiana Hurricane Protection System, Vol. VIII–Engineering and Operational Risk and Reliability Analysis, Final Report of the Interagency Performance Evaluation Task Force. Washington, DC: US Army Corps of Engineers.
Horton, R., Little, C., Gornitz, V., Bader, D., and Oppenheimer, M. (2015). New York City Panel on Climate Change 2015 Report Chapter 2: Sea Level Rise and Coastal Storms. Ann. N.Y. Acad. Sci. 13361, 36–44. doi:10.1111/nyas.12593
Hughes, S. A., and Nadal, N. C. (2009). Laboratory Study of Combined Wave Overtopping and Storm Surge Overflow of a Levee. Coastal Eng. 563, 244–259. doi:10.1016/j.coastaleng.2008.09.005
Jonkman, S. N. (2007). Loss of Life Estimation in Flood Risk Assessment; Theory and Applications. PhD. Thesis: Delft University.
Jonkman, S. N., Hillen, M. M., Nicholls, R. J., Kanning, W., and van Ledden, M. (2013). Costs of Adapting Coastal Defences to Sea-Level Rise- New Estimates and Their Implications. J. Coastal Res. 2905, 1212–1226. doi:10.2112/jcoastres-d-12-00230.1
Jonkman, S. N., Maaskant, B., Boyd, E., and Levitan, M. L. (2009). Loss of Life Caused by the Flooding of New Orleans after Hurricane Katrina: Analysis of the Relationship between Flood Characteristics and Mortality. Risk Anal. Int. J. 295, 676–698. doi:10.1111/j.1539-6924.2008.01190.x
Jordi, A., Georgas, N., Blumberg, A., Yin, L., Chen, Z., Wang, Y., et al. (2019). A Next-Generation Coastal Ocean Operational System: Probabilistic Flood Forecasting at Street Scale. Bull. Am. Meteorol. Soc. 1001, 41–54. doi:10.1175/bams-d-17-0309.1
Lane, S. N., Landström, C., and Whatmore, S. J. (2011). Imagining Flood Futures: Risk Assessment and Management in Practice. Philos. Trans. A. Math. Phys. Eng. Sci. 369, 19421784–19421806. doi:10.1098/rsta.2010.0346
Lin, N., Marsooli, R., and Colle, B. A. (2019). Storm Surge Return Levels Induced by Mid-to-late-twenty-first-century Extratropical Cyclones in the Northeastern United States. Climatic change 1541, 143–158. doi:10.1007/s10584-019-02431-8
Lin, N., and Shullman, E. (2017). Dealing with hurricane Surge Flooding in a Changing Environment: Part I. Risk Assessment Considering Storm Climatology Change, Sea Level Rise, and Coastal Development. Stoch Environ. Res. Risk Assess. 319, 2379–2400. doi:10.1007/s00477-016-1377-5
Liu, H., Zhang, K., Li, Y., and Xie, L. (2013). Numerical Study of the Sensitivity of Mangroves in Reducing Storm Surge and Flooding to hurricane Characteristics in Southern Florida. Continental Shelf Res. 64, 51–65. doi:10.1016/j.csr.2013.05.015
Loeb, Penny. (2021). “Too Poor to Protect: When Cost-Benefit Analysis Leaves Towns to “Wash Away”.” the Daily Yonder. Available at: https://dailyyonder.com/too-poor-to-protect-when-cost-benefit-analysis-leaves-towns-to-wash-away/2021/04/29/(accessed July, 2021).
Marsooli, R., Lin, N., Emanuel, K., and Feng, K. (2019). Climate Change Exacerbates hurricane Flood Hazards along US Atlantic and Gulf Coasts in Spatially Varying Patterns. Nat. Commun. 101, 3785–3789. doi:10.1038/s41467-019-11755-z
Martín-Antón, M., et al. (2016). Review of Coastal Land Reclamation Situation in the World. J. Coastal Res. 75, 667–671.
Mattocks, C., and Forbes, C. (2008). A Real-Time, Event-Triggered Storm Surge Forecasting System for the State of North Carolina. Ocean Model. 25, 395–4119. doi:10.1016/j.ocemod.2008.06.008
Miao, Q. (2019). Are We Adapting to Floods? Evidence from Global Flooding Fatalities. Risk Anal. 396, 1298–1313. doi:10.1111/risa.13245
Neal, W. J., Bush, D. M., and Pilkey, O. H. (2005). Managed Retreat. Encyclopedia Coastal Sci. Editors M. L. Schwartz (Amterdam: Springer), 602–606.
NOAA (2021). National Oceanic and Atmospheric Administration (NOAA). NOAA Tides and Currents. Available at: https://tidesandcurrents.noaa.gov/(accessed July, 2021).
Olsen, A., Zhou, Q., Linde, J., and Arnbjerg-Nielsen, K. (2015). Comparing Methods of Calculating Expected Annual Damage in Urban Pluvial Flood Risk Assessments. Water 71, 255–270. doi:10.3390/w7010255
Oppenheimer, M., et al. (2019). Sea Level Rise and Implications for Low Lying Islands, Coasts and Communities. Cambridge, United Kingdom: Cambridge University Press, 126.
Orton, P. M., Hall, T. M., Talke, S. A., Blumberg, A. F., Georgas, N., and Vinogradov, S. (2016). A Validated Tropical-Extratropical Flood Hazard Assessment for New York Harbor. J. Geophys. Res. Oceans 12, 8904–8929. doi:10.1002/2016JC011679
Orton, P. M., Sanderson, E. W., Talke, S. A., Giampieri, M., and MacManus, K. (2020). Storm Tide Amplification and Habitat Changes Due to Urbanization of a Lagoonal Estuary. Nat. Hazards Earth Syst. Sci. 9, 2415–2432. doi:10.5194/nhess-20-2415-2020
Özer, I. E., Damme, M. V., and Sebastiaan, N. J. (2016). On the Importance of Analyzing Flood Defense failures.” E3S Web of Conferences. EDP Sci. 7, 9. doi:10.1051/e3sconf/20160703013
Pore, N. A., and Barrientos, C. S. (1976). “Storm surge.” MESA New York Bight Atlas Monograph 6. Stony Brook, NY: New York Sea Grant Institute.
Pullen, T., et al. (2007). EurOtop Wave Overtopping of Sea Defences and Related Structures: Assessment Manual.
Robinson, C. S., Davidson, R. A., Trainor, J. E., Kruse, J. L., and Nozick, L. K. (2018). Homeowner Acceptance of Voluntary Property Acquisition Offers. Int. J. Disaster Risk reduction 31, 234–242. doi:10.1016/j.ijdrr.2018.05.002
Sun, F., and Carson, R. T. (2020). Coastal Wetlands Reduce Property Damage during Tropical Cyclones. Proc. Natl. Acad. Sci. USA 11711, 5719–5725. doi:10.1073/pnas.1915169117
Surjan, A., Parvin, G. A., Rahman, A. u., and Shaw, R. (2016). “Expanding Coastal Cities: an Increasing risk.” Urban Disasters and Resilience in AsiaButterworth-Heinemann, 79–90. doi:10.1016/b978-0-12-802169-9.00006-9
Talke, S. A., Kemp, A. C., and Woodruff, J. (2018). Relative Sea Level, Tides, and Extreme Water Levels in Boston Harbor from 1825 to 2018. J. Geophys. Res. Oceans 1236, 3895–3914. doi:10.1029/2017jc013645
Tibbetts, J. (2002). Coastal Cities: Living on the Edge. Environ. Health Perspect. 110-11, A674–A681. doi:10.1289/ehp.110-a674
USACE (2020). Appendix D Engineering Design, Cost Estimates and Cost Risk Analysis. US: US Army Corps of Engineers Galveston District Southwestern Division, Coastal Texas Protection and Restoration Feasibility Study.
USACE (2019). New York-New Jersey Harbor and Tributaries Coastal Storm Risk Management Interim Report, 134. New York: US Army Corps of Engineers New York District.
USACE (2021). POLICY DIRECTIVE – Comprehensive Documentation of Benefits in Decision Document. US: US Army Corps of Engineers, MEMORANDUM FOR COMMANDING GENERAL.
USACE (2016). “Draft Integrated Hurricane Sandy General Reevaluation Report and Environmental Impact Statement.” US Army Corps of Engineers, East Rockaway Inlet to Rockaway Inlet and Jamaica Bay Reformulation Study. New York: US Army Corps of Engineers New York District.
Van der Meer, J. W. (2002). Technical Report Wave Run-Up and Wave Overtopping at Dikes. Tech. Advis. Comm. on Flood Def, Delft, Netherlands. Technical Report, 43.
Waarts, P. H. (1992).Methoden voor de bepaling van het aantal doden als gevolg van inundatie. TNO rapport B-91-1099 voor TAW TAW EE 92, 11.
Wang, H., Loftis, J., Liu, Z., Forrest, D., and Zhang, J. (2014). The Storm Surge and Sub-grid Inundation Modeling in New York City during Hurricane Sandy. Jmse 21, 226–246. doi:10.3390/jmse2010226
Weixia, J., and Han, y. (2016). Review on Methods for Estimating the Loss of Life Induced by Heavy Rain and Floods. Prog. Geogr. 352, 148–158.
Wheeler, B. W., White, M., Stahl-Timmins, W., and Depledge, M. H. (2012). Does Living by the Coast Improve Health and Wellbeing? Health & Place 185, 1198–1201. doi:10.1016/j.healthplace.2012.06.015
Wu, W., Sánchez, A., and Zhang, M. (2011). An Implicit 2-D Shallow Water Flow Model on Unstructured Quadtree Rectangular Mesh. J. Coastal Res. 59, 15–26. doi:10.2112/si59-003.1
Keywords: coastal flood, mortality risk, berm, retreat, sea-level rise, geomorphology, storm climate, idealized modeling
Citation: Zhang F and Orton PM (2022) Importance of Neighborhood Aspect Ratio and Storm Climate to Adaptation Efforts to Reduce Coastal Flood Mortality. Front. Built Environ. 7:769161. doi: 10.3389/fbuil.2021.769161
Received: 01 September 2021; Accepted: 30 November 2021;
Published: 07 January 2022.
Edited by:
Nobuhito Mori, Kyoto University, JapanReviewed by:
William James Pringle, Argonne National Laboratory (DOE), United StatesCopyright © 2022 Zhang and Orton. This is an open-access article distributed under the terms of the Creative Commons Attribution License (CC BY). The use, distribution or reproduction in other forums is permitted, provided the original author(s) and the copyright owner(s) are credited and that the original publication in this journal is cited, in accordance with accepted academic practice. No use, distribution or reproduction is permitted which does not comply with these terms.
*Correspondence: Philip M. Orton, cGhpbGlwLm9ydG9uQHN0ZXZlbnMuZWR1
Disclaimer: All claims expressed in this article are solely those of the authors and do not necessarily represent those of their affiliated organizations, or those of the publisher, the editors and the reviewers. Any product that may be evaluated in this article or claim that may be made by its manufacturer is not guaranteed or endorsed by the publisher.
Research integrity at Frontiers
Learn more about the work of our research integrity team to safeguard the quality of each article we publish.