 Silvio Carta
 Luigi Pintacuda
 Tommaso Turchi
94% of researchers rate our articles as excellent or good
Learn more about the work of our research integrity team to safeguard the quality of each article we publish.
Find out more
ORIGINAL RESEARCH article
Front. Built Environ., 16 November 2021
Sec. Urban Science
Volume 7 - 2021 | https://doi.org/10.3389/fbuil.2021.767779
This article is part of the Research TopicPathways to Resilient Zero Carbon CitiesView all 9 articles
This study presents a novel workflow to define how resilient communities can be analysed and improved through the optimisation of sustainable design principles through quantitative methods. Our model analyses successful sustainable communities extracting information about daily routines (commuting, working, use of buildings etc.). From these routines, we infer a set of key successful aspects based on location, density and proximity. We then model a resilient community and analyse it using a combination of clustering techniques to find patterns and correlations in the success of existing communities. The proposed workflow is applied to the city of Copenhagen as a case study. The aim of the proposed model is to suggest to designers and city-level policy makers improvements (with manipulation of variables like density, proximity and location of urban typologies) to help them to achieve different levels of sustainable goals as set out by the United Nations Global Challenges including integration inclusiveness and resilience. By using a clustering technique, patterns of proximity have been identified along with density and initial correlations in the observed urban typologies. Some of these correlations were used to illustrate the potential of this novel workflow.
This study presents a novel workflow to define how resilient communities can be analysed and improved through the optimisation of sustainable design principles through quantitative methods. Our model analyses successful sustainable communities (e.g., Gui and MacGill. 2018; Boswell et al., 2019; Shandiz et al., 2021) extracting information about daily routines (commuting, working, use of buildings etc.). From these routines, we infer a set of key successful aspects based on location, density and proximity. We then model a resilient community and analyse it using a combination of clustering techniques to find patterns and correlations in the success of existing communities.
The proposed workflow is applied to the city of Copenhagen as a case study. The aim of the proposed model is to suggest to designers and city-level policy makers improvements (with manipulation of variables like density, proximity and location of urban typologies) to help them to achieve different levels of sustainable goals as set out by the United Nations Global Challenges including integration (Stafford-Smith et al., 2017), inclusiveness (Leal Filho et al., 2019), and resilience (Caputo et al., 2015).
Several studies have been conducted on rationalising urban and resilient communities with quantitative measures and frameworks, such as, Caputo et al. (2015); Nist (2015); Sharifi (2016); Jankovic (2018); Nguyen and Akerkar (2020) provided a critical overview on tools that can be used to assess the resilience of communities, defined as CRA (Community Resilience Assessment) tools. Sharifi analysed 36 different tools with different scope and geographical application, with 15 out of 36 developed for the north American context (Sharifi, 2016:634). One of the relevant considerations resulting from Sharifi’s work is that CRA tools in general do not consider the impact of change and the dynamic nature of resilience (as a reaction from communities) across time and geographical scales. Furthermore, that resilience is a moving target that should be viewed alongside a degree of uncertainty (Sharifi. 2016:644). A positive contribution toward the points raised by Sharafi’s work has been made by Petrescu and colleagues. Their R-Urban, a framework generated to “mobilize the agency of citizens and grassroots organizations via a network of self-managed collective hubs in a transition to dynamic sustainability” (Petrescu et al., 2020:2). This framework proposes a way to evaluate the resilience in communities and their capital worth, quantifying impact and economic growth in urban communities.
In general terms, the majority of the studies to date refer to a framework (or a combination of them) where many aspects, from socio-cultural to economic, are considered. Successful examples of such frameworks developed by global corporations and charities include the Oxfam GB Multi-Dimensional Approach to Measuring Resilience (Hughes and Bushell, 2013), the City resilience Index (CRI) (ARUP and Rockefeller Foundation, 2014), and the United Kingdom Department for International Development’s Measuring Resilience report (Sturgess, 2016). Such frameworks based on indictors and approaches are very useful to understand and contextualise specific geographical, socio-political and urban questions. However, in more practical terms, there is no consensus to date on a unique or holistic method to evaluate the level of resilience in communities quantitatively. With this work, we propose a method to quantitively assess the level of resilience of urban communities. In the case presented here, we suggest an equation that builds on existing work, adapting it to a case study.
Various successful attempts have been made to produce new ways of calculating urban resilience computationally (Cimellaro et al., 2015; Leykin et al., 2018; Yu and Baroud, 2019 among others). In his Designing Resilience of the Built Environment to Extreme Weather, Jankovic (2018) employed a random grammar approach (Kauffman, 1996), whereby a network model is applied to resilience at regional level. Jankovic’s model considers binary strings (0/1) to “represent raw materials, as well as transformations of these materials into processed resources. These transformations are carried out by models of artificial agents and the connectivity between the agents and the transformations of binary strings are governed by random grammar rules” (Jankovic, 2018:4).
A simple definition of resilience (R) is given by Bruneau et al. (2003) as “the ability of the system to reduce the chances of a shock, to absorb a shock if it occurs (abrupt reduction of performance) and to recover quickly after a shock (re-establish normal performance)” (Bruneau et al., 2003:736). Its mathematical formulation can be expressed as:
Where Qt relates to the quality of the infrastructure of a community which varies with time (t0 and t1) where an event against which a system reacts with resilience. The notation 1) refers to the version presented by (Koliou et al., 2020:135).
Santos and colleagues (2018) elaborated a method to model several factors that compound community resilience into a computational framework. Within this framework, they suggest a number of functions that model, by approximation, “particular hypotheses about the system’s resilience” (Santos et al., 2018:186). This method is particularly relevant to our aim, as it provides a way to “use social theories to compose these individual resilience functions into an umbrella resilience function, while providing qualitative analysis” (Santos et al., 2018:186). Santos and colleagues have modelled the problem of representing the cultural and social aspects (cultural fragments) as factors in resilient communities using Bayesian Knowledge Bases: a directed graph with instantiation nodes and support nodes, characterised by weighted correlations and conditional probability rules (Santos et al., 2018:188). Whilst Bruneau and colleagues have expressed the notion of a measurable resilience through a simple formula, Santos et al. have introduced a series of functions per each aspect that contribute to a more elaborated idea of resilience within a framework, and ultimately combined individual functions into a composite function (Santos et al., 2018:191).
Moreover, the recent work of Jankovic (2021) is also significant. Jankovic proposed a formulation of urban resilience that relates to the notion of redundancy R where:
In Eq. 2 N indicates the number of nodes in a network system. Nmin is the minimum number of nodes necessary to run a certain operation, while ΔN indicates the number of additional nodes in the system (Jankovic, 2021:2–3). This formula is used in our experiment to attribute values to each category of physical elements that contribute to the resilience of urban communities, for it allows us to quantitatively evaluate the redundancy level represented by each category. The Equation 2 has been used to in the evaluation of the quality scores (Table 1; Table 3). To note that we eventually derived 3) as a simplified version of Jankovic’s Equation 2 to adapt it to our specific case.
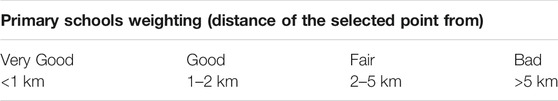
TABLE 1. Every sub-component weighting range was divided in different tiers according their performance: this classification was set following existing data and applying (2).
Over the past 30 years, the city of Copenhagen has experienced a significant upward transformation. In the 1990s the city was in decline and experienced 17.5% unemployment, a disappearing manufacturing sector, an out-immigration population, and an annual deficit of $750million. Today however, Copenhagen is considered and typically portrayed as a thriving and captivating, and considered one of the best cities in Europe to live in (Copenhagen resilience and liveability, 2018:30). Thanks to several innovative policy programmes which include social, climate, and economic policies, the declining neighbourhoods such as Nordhavn, Østerbro and Refshaleoen now offer its residents varied urban living with a clear sense of social fabric. Indeed, the city has managed to reverse the dangerous trend where declining financial resources and high social and infrastructure maintenance expenditure would result in both urban sprawl and overly dense and chaotic urbanisation (Sorensen and Jacob 2020:218). Copenhagen’s revitalisation programme which focused on “building a liveable city” is according to Veolia “aligned with what is generally meant by resilience” (“Copenhagen: resilience and liveability” 2018:30).
Copenhagen was able to achieve transformative resilience through a complex layering of infrastructure and planning initiatives. For example, the city transferred vast amounts of public land to a new publicly owned, privately managed corporation and with it, was able to reassign land — primarily in the old harbour and an undeveloped area between the airport and the downtown — for residential and commercial use. The revenues projected by smart zoning and asset management — not taxes — to finance cross-city transit infrastructure spurred the regeneration of core areas of the city. A vibrant, multi-purpose waterfront, world-class transit system which includes an envious reputation as a bicycle and pedestrian city with clean air, less noise, more space and healthier citizens (Baykal, 2018:5). Thousands of housing units have also been built for market and social purposes in accordance with energy-efficient standards. The most recent effects of this smart institutional model can be seen in the ongoing transformation of North Harbor (Nordhavn), only one of multiple sites under the corporation’s control (Katz and Noring, 2017). Furthermore, Copenhagen has been much-praised for its sustainability planning: it was awarded European Green Capital in 2014, it was recognized as a Green Economy Leader by the London School of Economics in 2014 and is the self-proclaimed Capital of Sustainable Development.
In order to develop a quantitative model that can be applied to any urban area, the following eight stages were followed. We designed the workflow below which allows to evaluate the level of resilience and crucially, suggest how to improve it:
1) Identify reliable frameworks for urban resilience in existing literature, and extract a workable framework to assess urban resilience quantitatively.
2) Identify communities with highest values of resilience (based on existing frameworks) focusing on routines (e.g., commuting, means of transportation, access to facilities etc.);
3) Generate a dataset to encode most successful routines and spatial characteristics;
4) Model the physical characteristics of the urban community as a list of distances and coordinates;
5) Assign (quantitative) values to physical characteristics;
6) Use clustering models to find patterns of urban distributions that emerge from the analysed network (in this case K-Means and T-SNE);
7) Analyse the patterns found and draw correlations;
8) Elaborate and suggest future steps: 1) use the model to evaluate resilience value for any urban area and 2) suggest (based on prediction) how to improve the resilience score of urban communities.
The first step of the modelling stage was to investigate the resilience framework. The main issue here is the ambiguity of the term resilience. According to Wang et al. (2018), resilience is the holistic capacity of an urban complex system comprised of different subsystems to absorb, adapt, and recover from a disruptive event. The unpredictable nature of these disruptions and the multitude of possible resilient reactions prompted us to describe this problem through a complex framework.
Before describing the framework in detail, the decision was taken to divide a complex system into multiple categories and sub-categories. This approach has been adopted by many researchers in order to identify the layers/categories before breaking them down into components (Da Silva and Morera, 2015; Wang et al., 2018). The choice to carry out such a study through a graphic approach was fostered by our final goal to communicate visually in a more effective, direct and synthetic way.
The comparative analysis of various proposed framework led us to identify our 4 main categories: Social Environment, Economic Environment, Physical Environment and Management, as shown in Figure 1. A comprehensive approach to any resilient community demands the investigation all of four categories, as their compresence and balance results in the foundation of resilience itself (cf. Figure 2).
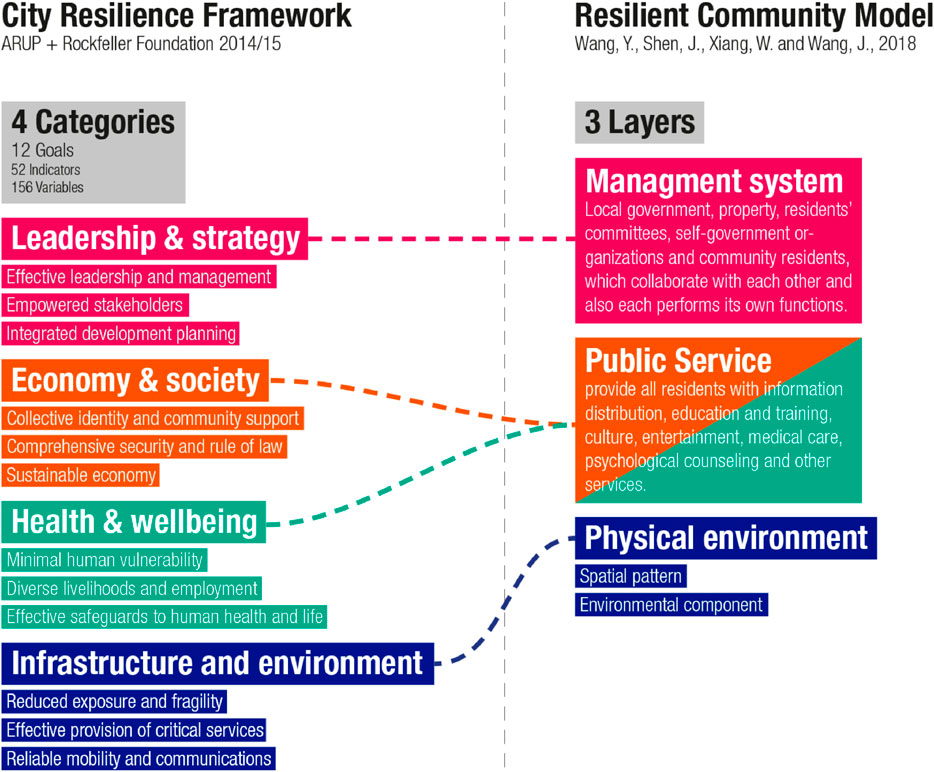
FIGURE 1. Graphical comparison between 2 different existing analysis: despite the use of different categories/layers, we can observe how both identify the same areas of analysis.
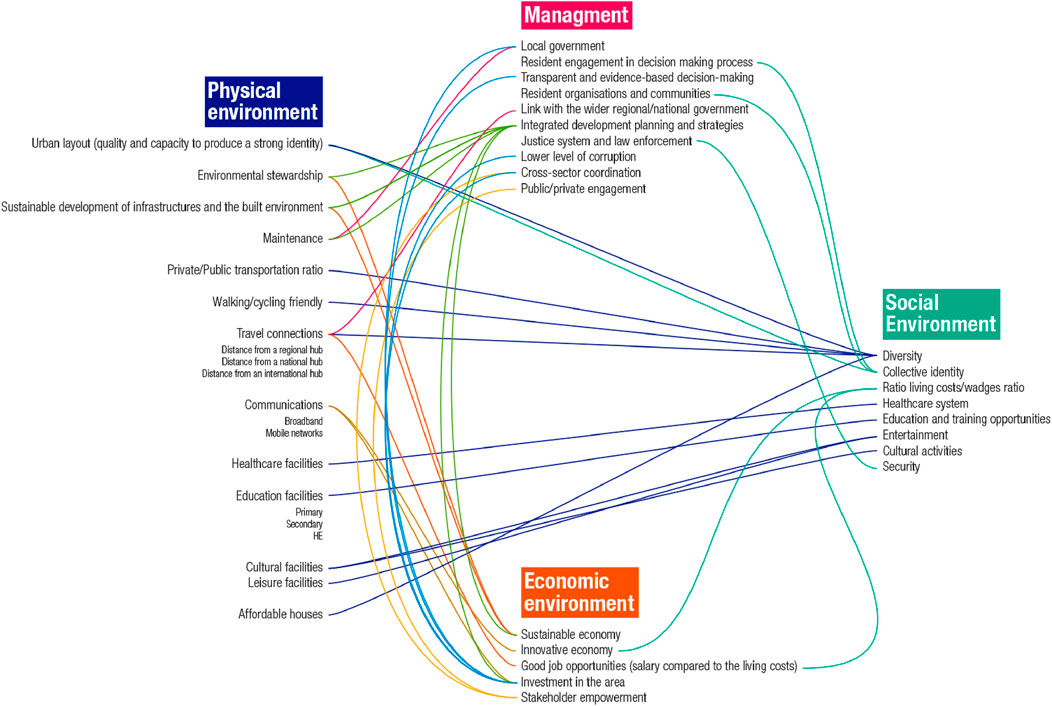
FIGURE 2. Diagram of the connections between sub-categories.
However, as for the complex nature of resilience, we can observe how different case studies have a different balance of the four categories: performing strongly in one could compensate for issues in another one.
An optimal concept of resilience would consider these four categories performing at their maximum. Nevertheless, any comprehensive analysis will not lead to a binary result: resilient, not resilient. Rather, it would lead to a resilient index wherein different case studies, categories and sub-categories have a different impact. Hence, the need for a complex modelling framework which is able to output detailed results.
By breaking down the categories in sub-categories, the framework of a complex structure becomes more evident, highlighting its multidisciplinary. As for the main categories, the identification of sub-categories has been carried out through a comparative analysis of different research and case studies. Weighting every component focusing of its localisation was useful to describe the influence on the final resilient index; while tracing cross-connections gave us back an organic and interconnected framework (Table 1).
This structure clearly illustrates how the alteration of a single component has the potential to impact on others, as depicted in Figure 3.
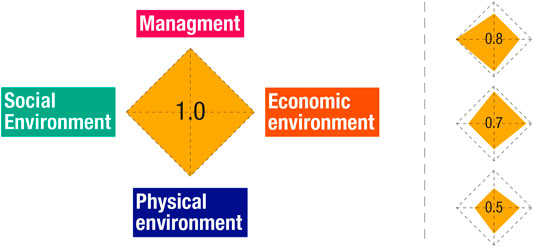
FIGURE 3. On the left the diagram of the ideal, but an oversimplified model of resilience. On the right a more real and detailed diagram with the 4 categories performing differently.
The diagram (Figure 2) reveals the connections between the main categories; or with greater detail which sub-category is likely to influence other sub-categories.
This multidisciplinary framework requires wider expertise. However, particular researchers could be focused on part of this framework (e.g., how one of these categories, or some components, influences the resilience index). Due to the type of data available for the selected case study, we decided to focus on aspects of the physical environment.
As such, the modelling and method described above was applied to the St. Kjeld Community in Copenhagen’s neighbourhood of Østerbro as one of the highest scoring resilient communities in the analysed frameworks and world ranking (Wang et al., 2018; Bizzotto et al., 2019).
The collection of data has been carried for the whole city of Copenhagen to analyse the wider Østerbro context. While the choice of the case study was chosen based on previous research, the motivation was also to source unbiased data. Moreover, the data was to be geo-localised to allow the analysis of spatial relations. The main source of data for this research was https://kbhkort.kk.dk/spatialmap: a web GIS (Geographic Information System) developed by the municipality of Copenhagen. On the very few occasions, this detailed GIS was integrated with other secondary sources (interpolating with data from GoogleMaps and from Open Data DK) where some data we needed were missing. The collected data were organised in thematic maps to scale using the graphics editor Illustrator. Each element was identified by a geo-localised point and a transparent circle indicating its area of influence. The radius of the circle was set following the component weighting using the highest performance range tier. This is shown in Figure 4 below.

FIGURE 4. Thematic maps. The Copenhagen city area is in white to highlight the superimposition of the different areas of influence. The grid over the map is 1 × 1 km to give us back a quick idea of the distances. The areas that remain white on the map are the ones.
The maps provided a clear picture of the Copenhagen / Østerbro and its resilience; however, these are static. The subsequent step was to import the collected data from Illustrator to Rhinoceros and Grasshopper. As the maps were vector graphic to scale, we were able to export data from Illustrator directly to Rhinoceros, maintaining all the layers and characteristic of every single element.
The table below (Table 2) illustrates the number of service buildings and other facilities in Copenhagen and their approximate distance from the centre of Østerbro.
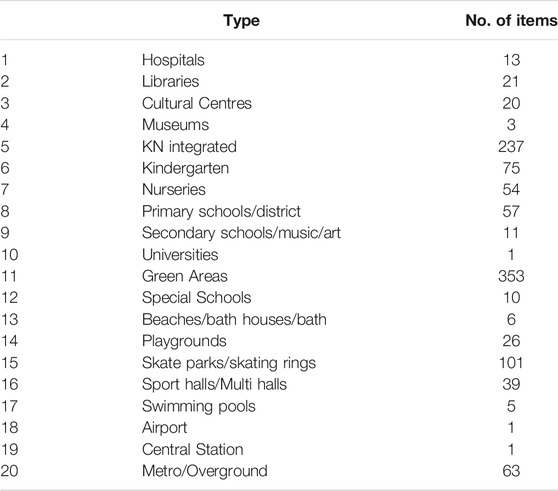
TABLE 2. Number of urban typologies.
The data were exported in a vectorial format and imported in Rhino/Grasshopper for some initial data analysis (Figure 5).
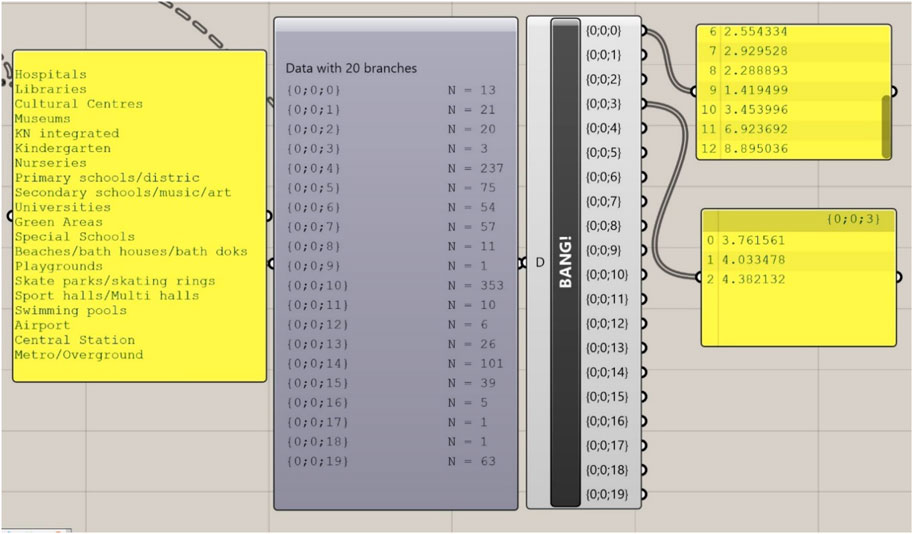
FIGURE 5. This figure illustrates part of the workflow where we structured the GIS data (no. of occurrence and geolocation) for each building type and service into separate lists.
For each of these twenty categories we retrieved GIS data and mapped all instances onto a bidimensional model in order to generate a spatial system to analyse mutual relationships (distances). The hospital category contains 13 elements (buildings), library has 21 locations, cultural centres contain 20 buildings etc. The full list is illustrated in Table 2; Figure 5.
Using the developed framework along with our definition 2), distances from the centre of the neighbourhood were used for an initial assessment of the degree of resilience as shown in Figure 6. Table 3 (below) shows the values attributed based on distances and Table 4 summarises the initial findings.
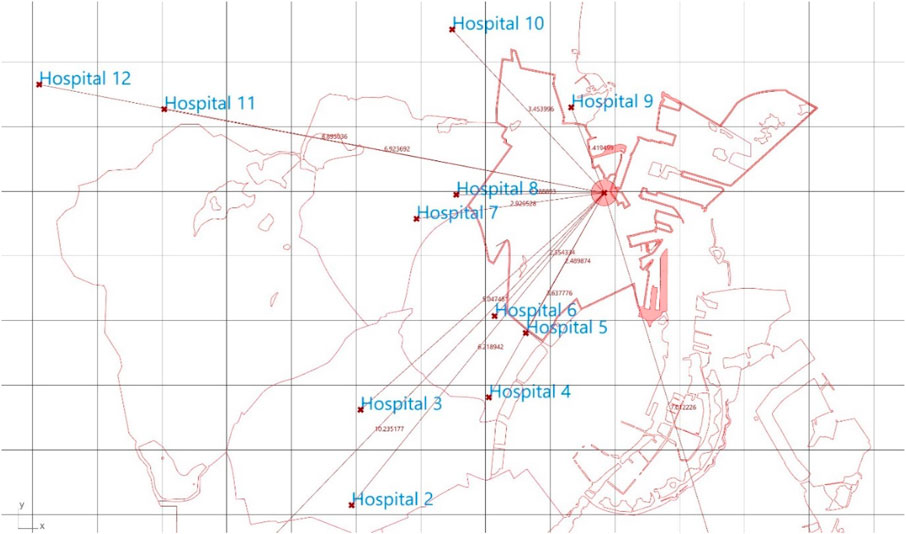
FIGURE 6. This figure shows the distances from the centre of Østerbro community to the 13 hospitals used in the dataset with respective values (e.g., Østerbro – Hospital 10 = 3.45 km).
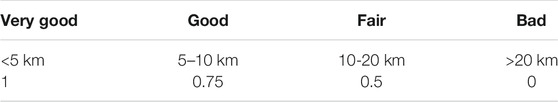
TABLE 3. Attribution of a resilience coefficient (
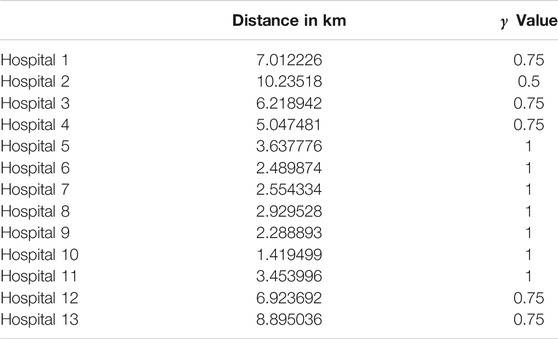
TABLE 4. Healthcare Facilities (distance from centre of community) and attribution of.
The final dataset consists of 1,098 data points (the total of all elements in the 20 categories) with their X and Y coordinates (relative to the centre point of the Østerbro community), the category, their relative distance from the centre of the community and their resilience value calculated using the following notation:
Where R is the resilience value of each element N (node) in the network, d is the distance of N from the centre of the community, and γ is a coefficient which express the quality of resilience based on distance and sparsity in the network. This coefficient should consider both number of elements of same type (e.g., hospitals) in its proximity and total number of elements in the same category. We are calling γ the resilience coefficient based on distance and sparsity in the network. Figure 7 below illustrates how Grasshopper has been used to compute 3) in a spatial environment.
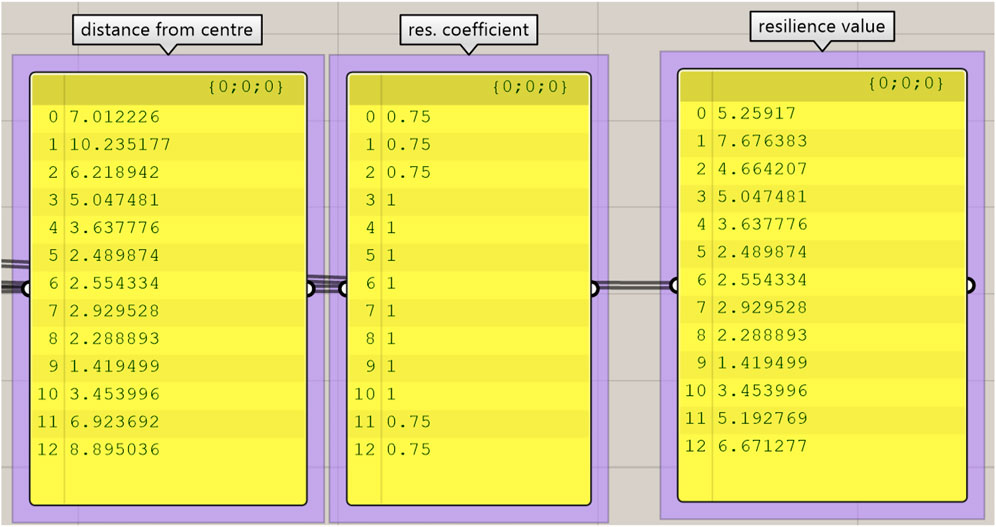
FIGURE 7. Application of Eq. 3 to points as output in Grasshopper.
This section describes how the model used some clustering methods to discover some meaningful patterns in the proximity of urban typologies. The aim of this stage is to learn insights on the proximity of urban typologies both from each other and from the centre of the community. By learning about proximities, we want to extract useful information about the physical characteristics of the community to assess the level of resilience.
As shown in Figure 4, the dataset was structured in a record table. Per each instance (building or urban type) geolocation was included as per GIS data (X and Y coordinated), along with the type of building, its distance from the centre of the community in Km, and the Resilience Value computed as per (3).
In order to simplify the calculations with Python’s Pandas Data Science library, the urban typologies (station, park, library etc.) were substitute with a natural number. The resulting remapping is illustrated in Table 4 below.
Clustering algorithms are sensitive to different feature scales, since more weight could be gained by features with larger variances and those features will impose more influence on the final cluster shape. Thus, the dataset was standardised to bring each feature’s mean to zero and standard deviation to 1.
Following preliminary testing with various clustering techniques, including DBSCAN and K-Means, the decision was made to use K-means as it was the most promising from the initial runs based on our domain knowledge and the suitability of this model for our specific case study, where proximities, distance and centres are important factors. K-Means is a clustering technique based on an unsupervised learning algorithm where several pre-determined number of clusters are given and a dataset is evaluated for proximity. The result is the evaluation of the points classified in the K given clusters, with K centroids as the centres of the clusters, as shown in Figure 8.
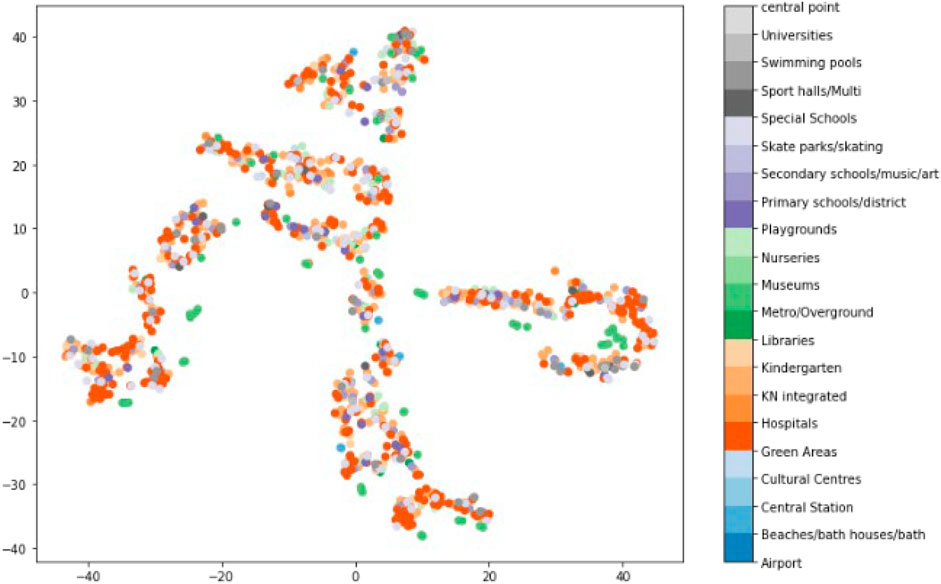
FIGURE 8. Initial run of the K-Means with no dimensional reduction. All urban types are visible, and the clusters are not meaningful.
As seen in Table 5, there are five dimensions to evaluate in this experiment. Clustering algorithms such as K-Means do not perform accurately when dealing with data of high dimensionality, namely with several features (Trunk, 1979). To determine cluster memberships, a Euclidean distance formula is used, and with a high number of dimensions the algorithm obtains similar distances and does not result in meaningful clusters. To address this issue, a dimensionality reduction technique, namely T-Distributed Stochastic Neighbour Embedding (t-SNE) (Van der Maate and Hinton, 2008) was employed, which is an appropriate algorithm for reducing dimensions with non-linear relationships.
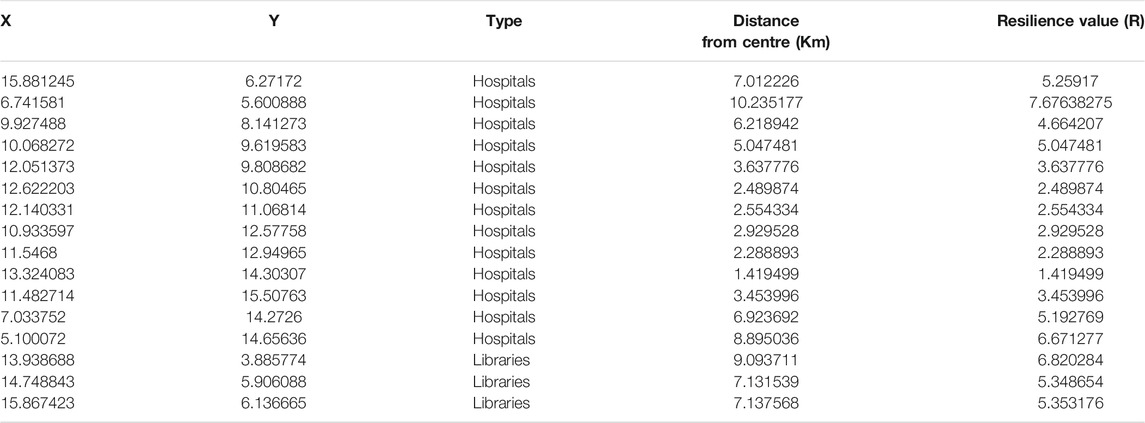
TABLE 5. Dataset showing points coordinates, their type, distance from the community and their resilience value (R).
It is necessary to specify a number of clusters in order to use K-Means. The Elbow method is a popular statistical technique for determining the optimal number of clusters, for it calculates the sum of squared distances from each point to its assigned centroid for each iteration of K-Means using a progressive number of clusters. The selected number of clusters should be at the elbow of the line chart, or with the fewest sum of squared distances at the lowest number of clusters. This results in the data inside each cluster are more tightly grouped. According to the results in Figure 9 the optimal number of clusters for our dataset is 4.
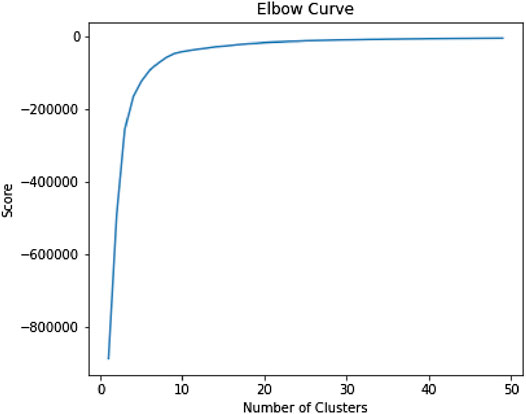
FIGURE 9. Elbow Curve to figure out how many clusters for K-Means algorithm.
The K-Means model was simulated with four clusters, and the results are shown in Figure 10 coloured by Resilience Value (red = more resilient and blue = less resilient). Figure 10 summarises some statistics from resulting clusters (type distributions are based on encoding found in Table 6).
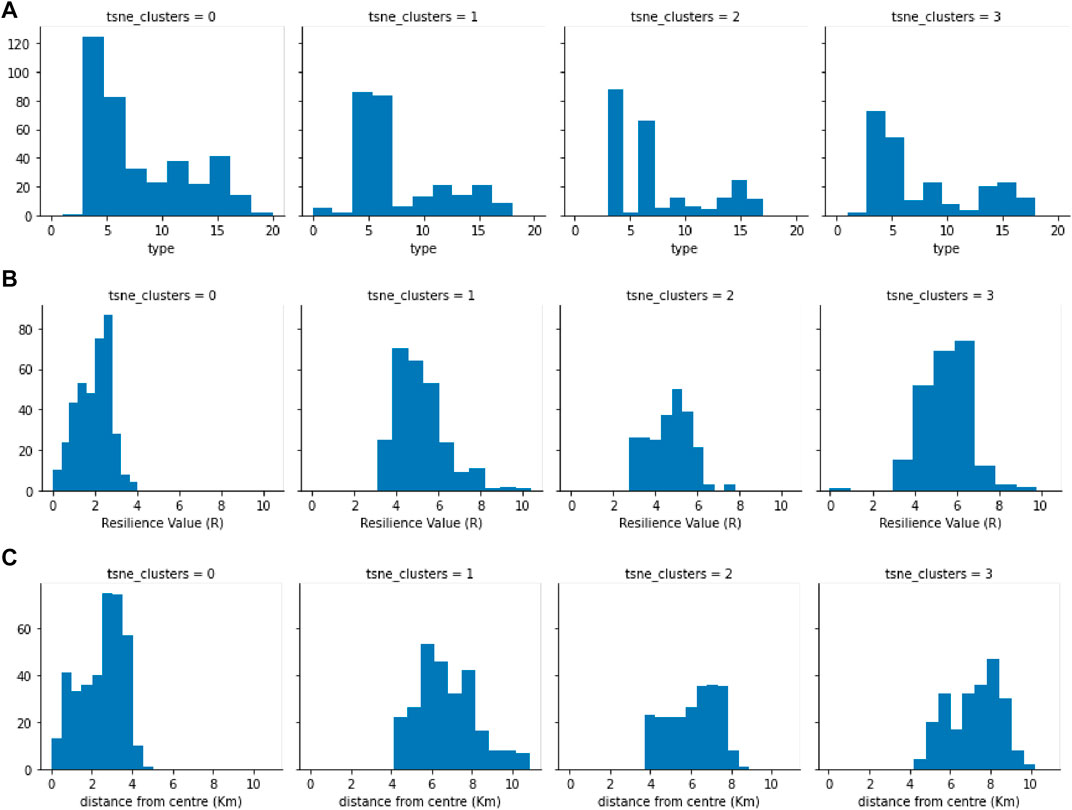
FIGURE 10. Clustering statistics by type (A), resilience value (B) and distance from the centre of the community (C).
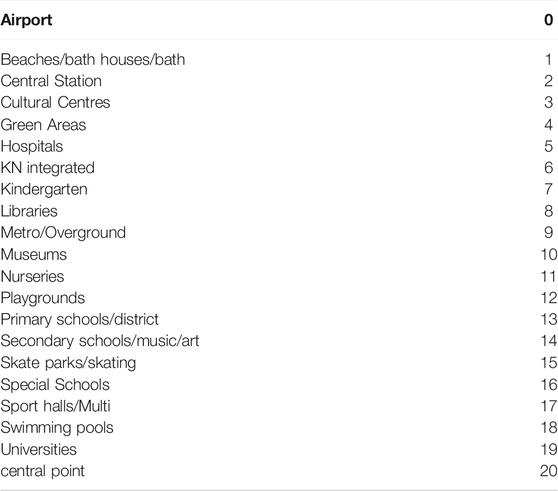
TABLE 6. Remapping of urban typologies to numbers.
The plot in Figure 11 depicts a non-trivial distribution of points and their clustering that makes use of all features. Different values of resilience are distributed in different clusters within the plot. In particular, the highest levels of resilience are distributed across three clusters (highlighted in bright orange/red colour) and are located far from the centroid in each of the three clusters. Concentrating on the highest-values cluster (Figure 12), Cluster two contains 6 metro stations, 3 nurseries, 1 library, 2 playgrounds, 3 primary schools, 12 skateparks, 4 sport halls, and a large number of green areas (50–100).
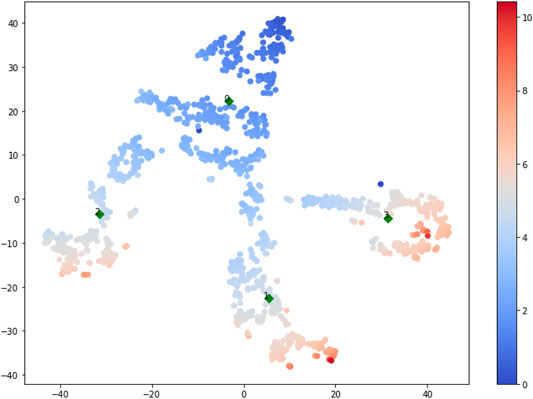
FIGURE 11. Clusters + Coloured by Resilience Value. To note that the X and Y axis in this plot indicate t-SNE dimension 1 and 2.
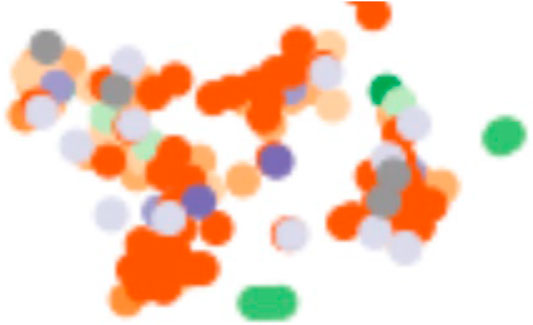
FIGURE 12. Zoom of one of the clusters with highest resilience value.
The combination of urban typologies in a highly resilient cluster is also illustrated in Figure 13, where the majority of types is no. 4 (green areas >80), followed by no. 6 (kindergarten >60) and no. 15 (skateparks >20). Similarly, the other high-scoring clusters (number 1 and 3) have high concentration of green areas, kindergarten and, on a lesser extent, hospitals. The 3 clusters (1, 2, 3) show also a high concentration of schools (both primary and secondary) and skateparks. Conversely, cluster 0 includes all points with R values lower than 4; yet with high number of instances. Cluster 0 contains a large number of points that score low in the resilience scale.
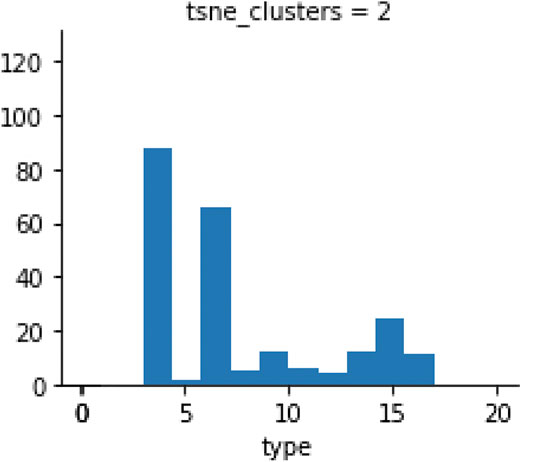
FIGURE 13. Clustering statistic by urban type (X axis). Y axis indicates the number of instances in the cluster.
The results suggest that communities that score higher in our study (considering Cluster 2 in particular) have a concentration of transportation facilities (metro stations in this case), education (libraries, nurseries and primary schools) and structures for sport and entertainment (skateparks, playgrounds, sport halls and green areas). Interestingly, the number of sport and entertainment facilities is significantly higher (83%) than the other 2 categories (8% for transport and 9% for education), as shown in Figure 14. Within the 83%, the majority of elements are green areas (50 over 66 in total).
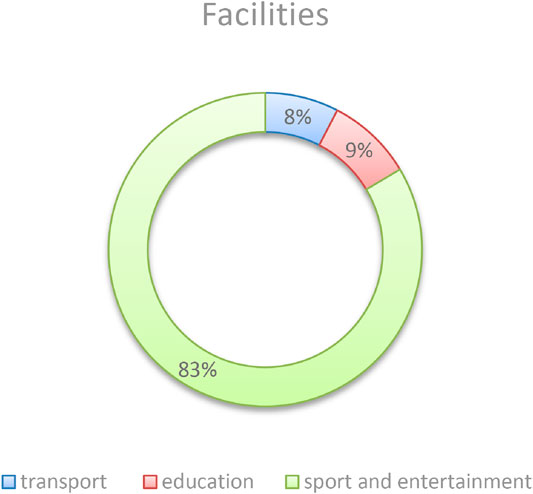
FIGURE 14. Relationship between categories of facilities in a highly resilient community.
This suggests that a high score in resilience can be directly related to the number and density of green areas in the local reach of the community. This is not surprising, considering that the city of Copenhagen has on average 25% of green areas (Cö mertler, 2017). However, from the data used in this study, we can infer that there is a strong correlation between the number and extension of green areas and the resilience value of a community.
The proposed model suggests a way to quantitatively evaluate the resilience of urban communities based on physical characteristics. Other components of existing theoretical frameworks (e.g., social and economic aspects) should be considered in future works. This model uses Østerbro as one of Copenhagen’s (and world’s) most resilient communities as a base case. The initial correlations between urban typologies, their concentration, distance from the community centre should not be considered as indications or design guideline for resilience. With this method, we simply laid the foundations for a more ambitious plan, where meaningful correlations will be drawn as the result of multiple iteration of this model and applications to different contexts.
The intention of this publication is to present initial progresses in the development of this workflow.
As an initial case study, the analysis of the resilience values of Copenhagen should be used as a base case. Our proposed method should be applied to other urban contexts and communities to evaluate their level of resilience. By comparison, our proposed method will help designers and urban scientists to: 1) evaluate the resilience of a given community and 2) find ways in which resilience can be improved (by intervening in the measures used here: position and density of urban typologies and their mutual proximity.
Future works for us will include the expanding the proposed model to include more metrics from our initial frameworks (from the Physical, Social and Economic Environments, and Management), as well as expanding the model to different communities in various global contexts.
By using a clustering technique, patterns of proximity have been identified along with density and initial correlations in the observed urban typologies. Such patterns were not directly visible or inferable from the map, nor from the resilience frameworks used. As such, some of these correlations were used to illustrate the potential of this novel workflow. However, once the workflow has been applied to several case studies and comparison are drawn, meaningful findings based on correlations of urban typologies data can be obtained. Although at its early stages of development, the proposed workflow shows promising results, as it can be used by designers to identify key aspects of the built environment that have a direct impact on the resilience of urban communities.
Publicly available datasets were analyzed in this study. This data can be found here: https://kbhkort.kk.dk/spatialmap.
Conceptualization, SC, LP; methodology: SC and TT; investigation: IO, LP, computations (Grasshopper): SC, (GIS) LP, ML and clustering: TT; writing: SC. and all, writing—review and editing: IO; project administration: SC. All authors have read and agreed to the published version of the manuscript.
This research received no external funding. Generous support was received from the School of Creative Arts of the University of Hertfordshire in respect of the preparation of material for this article.
The authors declare that the research was conducted in the absence of any commercial or financial relationships that could be construed as a potential conflict of interest.
All claims expressed in this article are solely those of the authors and do not necessarily represent those of their affiliated organizations, or those of the publisher, the editors and the reviewers. Any product that may be evaluated in this article, orclaim that may be made by its manufacturer, is not guaranteed or endorsed by the publisher.
The authors would like to thank Prof Jankovic for his precious advice on the measurement of resilience (R) in complex systems and overall guidance with the paper.
Baykal, E. (2018). Promoting Resilience through Positive Leadership during Turmoil. Int. J. Manag. Adm. 23, 34–48.
Bizzotto, M., Huseynova, A., and Vital Estrada, V. (2019). Resilient Cities, Thriving Cities: The Evolution of Urban Resilience. Bonn, German: ICLEI. Available at: https://iclei.org/en/publication/resilient-cities-thriving-cities-the-evolution-of-urban-resilience.
Boswell, M. R., Greve, A. I., and Seale, T. L. (2019). “Strategies for Creating Low-Carbon Communities,” in Climate Action Planning (Washington, DC: Island Press), 132–171. doi:10.5822/978-1-61091-964-7_5
Bruneau, M., Chang, S. E., Eguchi, R. T., Lee, G. C., O'Rourke, T. D., Reinhorn, A. M., et al. (2003). A Framework to Quantitatively Assess and Enhance the Seismic Resilience of Communities. Earthquake spectra 194, 733–752. doi:10.1193/1.1623497
Caputo, S., Caserio, M., Coles, R., Jankovic, L., and Gaterell, M. R. (2015). Urban Resilience: Two Diverging Interpretations. J. Urbanism: Int. Res. Placemaking Urban Sustainability 8, 222–240. doi:10.1080/17549175.2014.990913
Charani Shandiz, S., Rismanchi, B., Foliente, G., and Foliente, Greg. (2021). Energy Master Planning for Net-Zero Emission Communities: State of the Art and Research Challenges. Renew. Sust. Energ. Rev. 137, 110600. doi:10.1016/j.rser.2020.110600
Cimellaro, G. P., Renschler, C., and Bruneau, M. (2015). “Introduction to Resilience-Based Design (RBD),” in Computational Methods, Seismic protection, Hybrid Testing and Resilience in Earthquake Engineering (Cham: Springer), 151–183. doi:10.1007/978-3-319-06394-2_10
Cömertler, S. (2017). Greens of the European Green CapitalsIOP Conference Series: Materials Science and Engineering. IOP Conf. Ser. Mater. Sci. Eng. 245 (No. 5), 052064. doi:10.1088/1757-899x/245/5/052064
Copenhagen resilience and liveability (2018). “Field Actions Science Reports,” Special Issue 18, 30–33.
Da Silva, J., and Morera, B. (2015). City Resilience Framework”. London, United Kingdom: ARUP. [online] Available at: https://www.rockefellerfoundation.org/wp-content/uploads/City-Resilience-Framework-2015.pdf.
Gui, E. M., and MacGill, I. (2018). Typology of Future Clean Energy Communities: An Exploratory Structure, Opportunities, and Challenges. Energ. Res. Soc. Sci. 35, 94–107. doi:10.1016/j.erss.2017.10.019
Jankovic, L. (2018). Designing Resilience of the Built Environment to Extreme Weather Events. Sustainability 10, 141. doi:10.3390/su10010141
Jankovic, L. (2021). Resilience Potential, Robustness, and Edge of Collapse. Hatfield, United Kingdom: University of Hertfordshire Research. Archive [Preprint] available at: http://hdl.handle.net/2299/24230.
Katz, Bruce., and Noring, Luise. (2017). The Copenhagen City and Port Development Corporation: A Model for Regenerating Cities.
Kauffman, Stuart. (1996). At home in the Universe: The Search for the Laws of Self-Organization and Complexity. Oxford University Press.
Koliou, M., van de Lindt, J. W., McAllister, T. P., Ellingwood, B. R., Dillard, M., and Cutler, H. (2020). State of the Research in Community Resilience: Progress and Challenges. Sustainable resilient infrastructure 5, 131–151. doi:10.1080/23789689.2017.1418547
Leal Filho, W., Tripathi, S. K., Andrade Guerra, J. B. S. O. D., Giné-Garriga, R., Orlovic Lovren, V., and Willats, J. (2019). Using the Sustainable Development Goals towards a Better Understanding of Sustainability Challenges. Int. J. Sust. Dev. World Ecol. 26 (2), 179–190. doi:10.1080/13504509.2018.1505674
Leykin, D., Lahad, M., and Aharonson-Daniel, L. (2018). Gauging Urban Resilience from Social media. Int. J. Disaster Risk reduction 31, 393–402. doi:10.1016/j.ijdrr.2018.04.021
Nguyen, H. L., and Akerkar, R. (2020). Modelling, Measuring, and Visualising Community Resilience: A Systematic Review. Sustainability 12, 7896. doi:10.3390/su12197896
Nist (2015). Disaster Resilience Framework: 75% Draft for San Diego. Wiley and Sons. Available at: https://onlinelibrary.wiley.com/journal/17569338/
Petrescu, D., Petcou, C., Safri, M., and Gibson, K. (2020). Calculating the Value of the Commons: Generating Resilient Urban Futures. Hatfield, UK: Environmental Policy and Governance.
Santos, E. E., Santos, E., Korah, J., Thompson, J. E., Zhao, Y., Murugappan, V., et al. (2018). Modeling Social Resilience in Communities. IEEE Trans. Comput. Soc. Syst. 51, 186–199. doi:10.1109/tcss.2017.2780125
Sharifi, A. (2016). A Critical Review of Selected Tools for Assessing Community Resilience. Ecol. indicators 69, 629–647. doi:10.1016/j.ecolind.2016.05.023
Sørensen, Eva., and Jacob, Torfing. (2020). Co‐creating Ambitious Climate Change Mitigation Goals: The Copenhagen Experience. Australia: Regulation and Governance-Wiley and Sons.
Stafford-Smith, M., Griggs, D., Gaffney, O., Ullah, F., Reyers, B., Kanie, N., et al. (2017). Integration: the Key to Implementing the Sustainable Development Goals. Sustain. Sci. 12, 911–919. doi:10.1007/s11625-016-0383-3
Trunk, G. V. (1979). A Problem of Dimensionality: A Simple Example. IEEE Trans. Pattern Anal. Mach. Intell. PAMI-1, 306–307. doi:10.1109/tpami.1979.4766926
Van der Maaten, Laurens., and Hinton, Geoffrey. (2008). Visualizing Data Using T-SNE. J. machine Learn. Res. 9, 11.
Wang, Y.-c., Shen, J.-k., Xiang, W.-n., and Wang, J.-Q. (2018). Identifying Characteristics of Resilient Urban Communities through a Case Study Method. J. Urban Manag. 73, 141–151. doi:10.1016/j.jum.2018.11.004
Keywords: resilient communities, machine learning, net-zero communities, resilience, quantitative methods
Citation: Carta S, Pintacuda L, Owen IW and Turchi T (2021) Resilient Communities: A Novel Workflow. Front. Built Environ. 7:767779. doi: 10.3389/fbuil.2021.767779
Received: 31 August 2021; Accepted: 28 October 2021;
Published: 16 November 2021.
Edited by:
Tao Liu, Peking University, ChinaReviewed by:
Yiyong Chen, Shenzhen University, ChinaCopyright © 2021 Carta, Pintacuda, Owen and Turchi. This is an open-access article distributed under the terms of the Creative Commons Attribution License (CC BY). The use, distribution or reproduction in other forums is permitted, provided the original author(s) and the copyright owner(s) are credited and that the original publication in this journal is cited, in accordance with accepted academic practice. No use, distribution or reproduction is permitted which does not comply with these terms.
*Correspondence: Silvio Carta, cy5jYXJ0YUBoZXJ0cy5hYy51aw==
Disclaimer: All claims expressed in this article are solely those of the authors and do not necessarily represent those of their affiliated organizations, or those of the publisher, the editors and the reviewers. Any product that may be evaluated in this article or claim that may be made by its manufacturer is not guaranteed or endorsed by the publisher.
Research integrity at Frontiers
Learn more about the work of our research integrity team to safeguard the quality of each article we publish.