 Eva Quéheille
 Michel Dauvergne2
 Anne Ventura
94% of researchers rate our articles as excellent or good
Learn more about the work of our research integrity team to safeguard the quality of each article we publish.
Find out more
ORIGINAL RESEARCH article
Front. Built Environ., 06 October 2021
Sec. Sustainable Design and Construction
Volume 7 - 2021 | https://doi.org/10.3389/fbuil.2021.743948
This article is part of the Research TopicBuildings Sustainability Assessment Tools and MethodsView all 7 articles
Pyrometallurgical nickel industry in New Caledonia produces several tons of slag per year, which is stocked on site. There is no valorization today, except for a small transformation into sand. Pyrometallurgy highly consumes fossil-fuel energy and electricity for ore pre-treatment and nickel extraction inside electrical furnaces, which produces significant CO2 emissions. A new valorization approach is suggested to use these two local productions (slag and CO2) to mineralize slag and produce silico-magnesian cement for the construction sector. In order to ensure suitable environmental performances, many questions arise about the target valorized product: where and how to capture CO2 and produce cement, what constraints should be targeted for the mineralization process, can products be exported and where? Moreover, New Caledonia aims to develop renewable energies for electricity grid, which would mitigate local industries impacts in the future. A prospective Life Cycle Assessment (LCA) is used to define constraints on future product development. Two hundred scenarios are defined and compared as well as electricity grid evolution, using Brightway software. Thirteen scenarios can compete with traditional Portland cement for 12 of the 16 impacts of the ILCD midpoint method. The evolution of electricity grid slightly affects the performance of the scenarios by a mean of less than+/−25%, bringing a small difference on the number of acceptable scenarios. The main constraint requires improving the mineralization process by considerably reducing electricity consumption of the attrition-leaching operation. To be in line with scenarios concerning carbon neutrality of the cement industry by 2050, a sensitivity analysis provides the maximum energy consumption target for the mineralization process that is 0.9100 kWh/kg of carbonated slag, representing a 70% reduction of the current energy measured at lab scale. Valorization of nickel slag and CO2 should turn to carbon capture and utilization technology, which allows for the production of supplementary cementitious materials, another product for the construction sector. It will be the topic of a next prospective study.
Carbon Capture and Utilization (CCU) is a promising field to reduce upcoming climate change. Several capture technologies exist and various applications have been studied over the past 2 decades (Cuéllar-Franca and Azapagic 2015). Among the existing techniques, mineral carbonation allows the capture of CO2 inside rocks, such as serpentinite, or waste such as steel making slags and platinum tailings (Khool et al., 2011; Nduagu et al., 2012; Giannoulakis et al., 2014; Xiao et al., 2014; Ostovari et al., 2020). CCU is particularly interesting for industrial solid waste, allowing a double advantage by capturing carbon dioxide and offering waste valorization, despite high energy issues (Liu et al., 2021). To investigate the best balance between issues and benefits, it needs to find the most efficient scenario for the CCU project and Life Cycle Assessment (LCA) is an efficient tool for this. As studied by (Di Maria et al., 2020; Pedraza et al., 2021) to manufacture construction products with CCU of industrial solid waste, some technology and energy scenarios can be evaluated with LCA. Other characteristics of construction products can also be compared with LCA, such as chemical properties, which leads to investigate a wider set of scenarios, e.g. several dozens for (Shahmansouri et al., 2021).
The island of New-Caledonia, located 1,500 km from Eastern Australia, represents an interesting application site for mineral carbonation. As one of the five largest nickel producers in the world, New-Caledonia produces several million tons of slag per year, which is currently valorized in small quantities as sand. Pyrometallurgical facilities have indeed a high energy demand, especially for pre-drying, calcination and reduction by fusion (Bahers et al., 2020).
The ongoing Carboval research project is developing a process to capture CO2 from thermal power plants inside nickel slag in order to valorize the carbonated slag into construction products. The novelty of this project lies first in the feedstock choice, i.e. nickel slag, whereas steel slag is most commonly studied for CCU (Liu et al., 2021). Then, two main construction products can be obtained from the mineral carbonation of nickel slag: Supplementary Cementitious Materials (SCM) and silico-magnesian cement. Carbonated slag is dewatered, then dried. SCM is then obtained, which can be used to improve cement characteristics and partially substitute to silico-calcic Portland cement. A silico-magnesian cement can then be produced by calcinating SCM at low temperature (700°C) (Laniesse 2019). This operation yet burns magnesium carbonate and releases the captured CO2. Thus, the CO2 initially captured by mineralization in nickel slag is re-emitted into the atmosphere during the calcination process. Therefore, cement produced by this production chain cannot be qualified as CCU. However, the calcination process takes place at low temperature and can lead to a less energy intensive cement, compared to Portland cement calcinated at 1,500°C. Improving thermal efficiency is identified as one of the possible levers to lower GHG emissions by the cement industry (Cao et al., 2021).
This paper aims to determine the best conditions for the industrial development of the production of silico-magnesian cement from nickel slag to achieve suitable environmental performance. Indeed, a silico-magnesian cement is a more economically attractive product than SCM. Moreover, cement production is responsible of 6% of the worldwide CO2 emissions (Le Quéré et al., 2016; Andrew 2018) and the silico-magnesian cement would be an interesting way to reduce emissions from this sector. To fulfill this objective, a prospective Life Cycle Assessment (LCA) is used. The prospective aspect is due to the low Technology Readiness Level (TRL) of the process development (Julcour et al., 2020), and therefore, some important information is currently still missing. First of all, the production chain does not yet exist and must be projected on the territory’s slag and CO2 resources, as well as on the different scenarios of territorial implementation and the targeted economic markets. Secondly, the study must look ahead to different production time-horizons where the energy production context will have changed. And finally, the electricity demand of the mineralization process, which has been estimated at the laboratory scale, remains largely unknown at the industrial scale.
Our approach thus tests various combinations of scenarios concerning: CO2 capture technologies, location of industrial sites and economic markets in the context of nickel slag resources located in New Caledonia, and various production time-horizons involving different electricity mix. Part 2 of this paper describes the nickel slag mineralization project, including its process, the scenarios and the electricity grid supply evolution. The methodology for assessing the scenarios is presented in part 3. Based on the results given in part 4, two analyses are conducted in part 5. The most sustainable scenarios are identified. A sensitivity analysis is also conducted in order to define energy consumption targets for future process developments at the industrial scale, while respecting suitable environmental performance.
In order to mineralize CO2 into nickel slag, the used technological process is provided by a collaborative study (Bourgeois et al., 2020). Figure 1 gives an overview of the process.
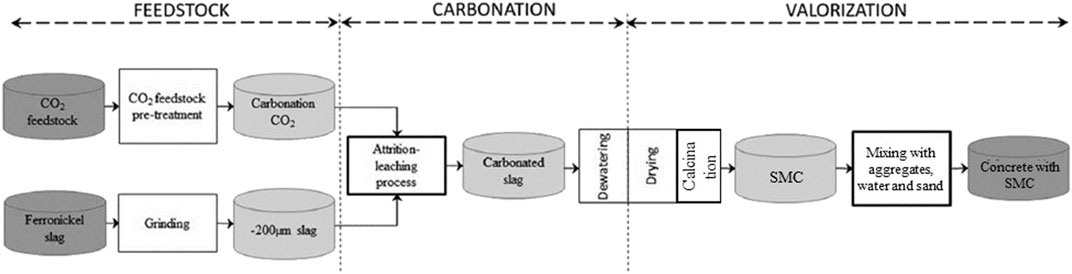
FIGURE 1. Integrated CO2 mineralization process for the production of SMC (silico-magnesian cement) from ferronickel slag—adapted from (Bourgeois et al., 2020).
CO2 feedstock is assumed to be a thermal power plant or any other facility that produces CO2 during operation. Pre-treatment requires two steps: CO2 capture and compression. While the latter is technologically ordinary, CO2 capture can be achieved by four different technologies. The first possibility is to capture and use industrial output gas streams directly, while the other three technologies are post-combustion, pre-combustion and oxy-fuel combustion (Cuéllar-Franca and Azapagic 2015). With post-combustion, CO2 is separated from output streams by a physical (e.g. membrane) or chemical (e.g. absorption, adsorption) reaction. Pre-combustion involves reforming the fuel into syngas and CO2 is separated upstream of the combustion. Oxy-fuel combustion, which is combustion with oxygen, produces gas output streams with high CO2 concentration which can be easily separated.
The carbonation feedstock is a magnesium silicate slag. The slag composition is in wt% amorphous magnesium silicate phase (MgSi2O5): 59%, Forsterite (Fe0.22Mg1.78SiO4): 39%, Chromite (FeCr2O4): 1.7% and Clinoenstatite (MgSiO3): 0.4% (Bourgeois et al., 2020). The slag is grinded to increase its specific surface area for carbonation.
In this process, carbonation is achieved by an attrition-leaching technology developed by (Julcour et al., 2015). Grinded slag and CO2 react with each other in an aqueous solution inside a stirred media mill. The reaction between the amorphous MgSi2O5 and CO2 brings the latter to mineralize inside slag as magnesium carbonate (MgCO3), according to Eq. 1 (Bourgeois et al., 2020).
At the time of this paper, the attrition-leaching technology still has some weaknesses, particularly to reduce attrition time. Currently, a 70% carbonation rate is globally obtained after 15 h attrition.
The research project involves two main companies of the nickel industry: in the north, KNS (Koniambo Nickel SAS) and in the south, SLN (Société Le Nickel). Each company has a pyrometallurgical facility, electrically powered by a thermal power plant. The KNS power plant is coal-fired while the SLN power plant is oil-fired, but is expected to be replaced by a gas-fired plant in the near following years. With a power of 260 and 160 MW respectively, these two thermal power plants are significant CO2 feedstocks. Direct output streams, post-combustion and oxy-fuel combustion technologies can be used on each plant, except for pre-combustion which was considered irrelevant because it would require new facilities and electricity-heat co-production (Le Bars et al., 2010).
New-Caledonia is also a major supplier of nickel slag. KNS and SLN companies produce several million tons of slag per year and recycle it poorly. The cumulated stock reaches 25 million tons for SLN (Réné 2018).
The potential markets for the products are local (i.e. New-Caledonia), and abroad, mainly Australia (1,500 km) and Japan (7,000 km). Shipping abroad would be exclusively by sea.
As a new sector, nickel slag valorization by mineralization requires decision-making on three main issues: technological issues (e.g. carbon capture technique), energy issues (e.g. fuel type, electricity source) and geographic issues (e.g. location of operations, market choice). Numerous scenarios can resolve these issues. Scenarios are built with a set of decision variables, described in Table 1.
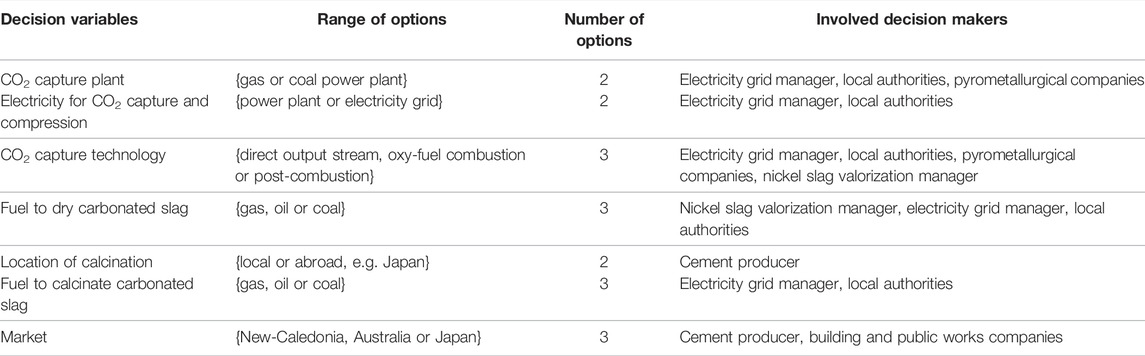
TABLE 1. Decision variables set for creation of the nickel slag valorization sector by mineralization of New-Caledonia.
Each scenario is composed with one option for each decision variables. The first scenario would then suggest capturing CO2 from a gas power plant using the power plant electricity and the direct output stream technology, then using gas for drying and calcination, achieving the latter locally and finally targeting the market of New-Caledonia. The second scenario would share the same options, except for the last decision variable, for which it would be suggested to target the Australian market. The third would suggest the Japanese market, and so on. The construction of the scenarios is made automatically and, with seven decision variables, it brings to produce 648 scenarios (i.e. multiplication of all the numbers of decision variables options).
The decision variables lead to 648 feasible scenarios to create a nickel slag valorization sector by mineralization in New-Caledonia. Two constraints are added to ensure scenarios consistency. The first constraint requires the same fuel for drying and calcination if both operations are located on the same site. The other operations (i.e. grinding slag, CO2 capture, mineralization and drying) are assumed to be performed at the same site. The second constraint requires to target the Japanese market if the calcination operation is located in Japan. The scenarios that do not respect these constraints are removed from the set. Then, the two constraints reduce the feasible scenarios to 216. An extract of the feasible scenarios set is available in Supplementary Appendix A.
The scenarios for the nickel slag valorization sector rely on short-term predictions for CO2 feedstock and electricity grid supply. Indeed, the scenarios already foresee the replacement of the SLN power plant by a gas-fired plant in the near future (estimation for the year 2022). As the SLN power plant is supposed to supply 29% of the island’s electricity grid, electricity high voltage production in New-Caledonia has to be adapted from the available 2019 overview (Direction de l’industrie, des Mines et de l’Energie de la Nouvelle-Calédonie (DIMENC), 2020).
Between these two production time-horizons, from 2022 to 2035, electricity grid in New-Caledonia is expected to increase renewable energies supply. The local government plans to achieve a 100% renewable public electricity by 2024, up from an initial target of 2030 (Gouvernement de la Nouvelle-Calédonie et al., 2019), and shows motivation to increase renewable supply for the nickel industry (Gouvernement de la Nouvelle-Calédonie, 2020). Then, assuming an average annual increase of 2%, renewable electricity is expected to evolve from 14 to 42% between 2022 and 2035. For the scenarios involving calcination operation located in Japan, Japanese electricity grid also needs to be adapted for the 2022 and 2035 horizons, based on the projections in (Direction Générale du Trésor 2018). Table 2 shows the electricity grid supply assumptions for the study.
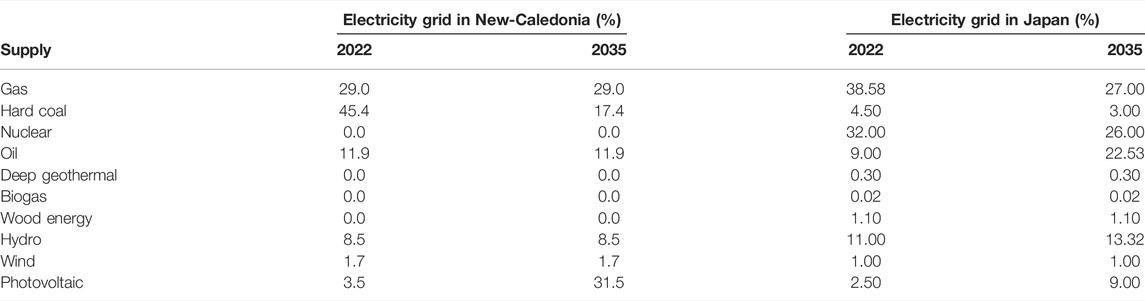
TABLE 2. Electricity grid supply assumptions for New-Caledonia and Japan at the two production time-horizons (2022 and 2035).
In this study, the objective is to evaluate the environmental impacts of cement production from mineralized nickel slag. The LCA system (Figure 2) transcribes the process described in part 2.1 until the cement is put on the market. Cement production requires several inputs, such as feedstocks (slag and CO2 with streams), energy (electricity or heat), reagents and water. Machines use is modelled for crushing & grinding and calcination operations. The remaining operations of the process also require machines and industrial facilities, but they are still not precisely defined (the mineralization process is still an on-going research). Therefore, these inputs are not yet included in the system. The slag extraction, as slag is a waste product from pyrometallurgical nickel industry, is considered outside of the system. All system operations from slag extraction to mineralization are assumed to be performed at the same site because pyrometallurgic industries produce slags and CO2 simultaneously. Thus, these steps require no transports. The calcination process is also assumed erected on-site except for a few scenarios for which calcination can occur in Japan (see part 2.2.2). In those specific scenarios, sea transport of mineralized slags to Japan is considered in addition to market delivery transport. Then, as the process is studied for New-Caledonia industries (part 2.2.1), transport of cement (for calcination or for delivery) is exclusively by sea if export.
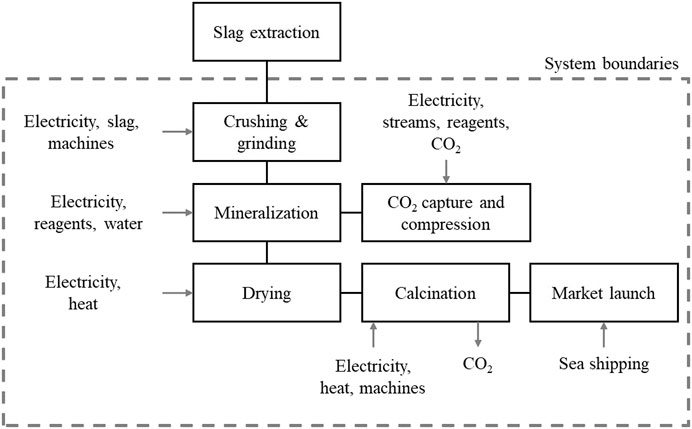
FIGURE 2. The LCA system for the nickel slag valorization sector.
The system is modelled with the Ecoinvent database, 3.7.1 cutoff version (Ecoinvent 2020), using the Brightway software (Mutel 2017). The functional unit is set to “1 kg of cement produced from nickel slag mineralization and delivered to market.”
To produce 14 tons/hour of cement (the mass flow rate of a flash calciner), 14 tons of nickel slag and 3.833 tons of CO2 are required per hour, which the nickel industry in New-Caledonia can easily provide. An energy assessment is performed to estimate the energy consumption for each operation of the process, based on assumptions, a literature review and a database for mining and mineral processing (InfoMine USA, Inc. et al., 2019), from which energy consumptions values are obtained from conversion of the operating cost values with the fuel price from the same database. The detailed LCI of each operation is available in Supplementary Appendix B.
Crushing and grinding are assumed, per kg slag, to consume 0.014752 kWh of electricity, then 0.006 MJ for mechanical handling (the process “diesel, burned in building machine” includes machines production). Since CO2 capture and compression can be done with several technologies (see part 2.2.2), inputs are defined for each alternative. Electricity consumption also depends on the streams’ molar composition and the power plant source. Table 3 summarizes electricity consumption for CO2 capture & compression alternatives (Kothandaraman 2010; IEAGHG 2012). For the post-combustion technique, 60% of the energy comes from the heat of the vapors produced by the power station. This part of the energy is expressed in the equivalent electricity that would have been produced with this steam.
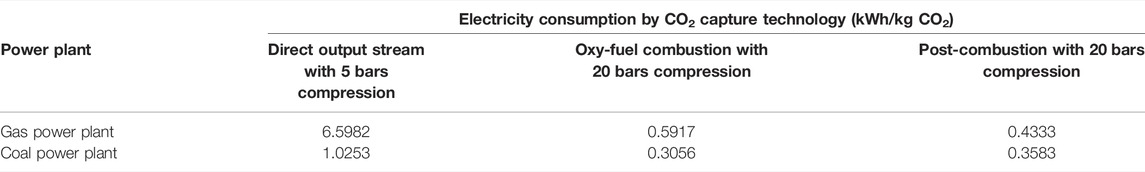
TABLE 3. Electricity consumption of CO2 capture & compression operation, by capture technology and power plant source.
Electricity for CO2 capture & compression also depends on the electricity source. A gas power plant is modelled as a combined cycle power plant with gas exclusively from Australia. As for a coal power plant, hard coal is assumed to be imported from Australia. The processes infrastructure is increased by 20% to model the CO2 capture & compression facility. If electricity grid supply is chosen, the process is modelled as described in Table 2. However, with the post-combustion technology, only 40% of the consumed electricity is to be immediately produced while the 60% remaining is from bypass of the power plant vapor. Thus, electricity source can only evolve for 40% of the consumption value.
Since capture with absorption is the most mature post-combustion technique (RECORD 2013; Anselmi et al., 2019), several reagents are added in the process, such as monoethanolamine, activated carbon and sodium hydroxide.
In the mineralization operation, carbonation rate of slag must reach 70%, which requires 15 h of resident time in the stirred media mill (Bourgeois et al., 2020). Energy and material consumptions (e.g. electricity, heat, water, reagents…) are calculated to produce about 20 tons/hour of wet carbonated slag. Pulping and pressurizing the two feedstocks into water sees electricity consumption evolve with the initial pressure of captured CO2, but the highest electricity consumption is by far ruled by attrition-leaching in the stirred media mill (3.2088 kWh/kg of carbonated slag). Considering the long term of this sub-operation (15 h), environmental impacts of the system are significantly worsened. As previously written (see part 2.1), this process is still in development and the team in charge aims to reduce energy consumption. The value of 0.2858 kWh/kg is chosen as an environmentally sound target (9% of the lab scale value), but this value is further tested with a sensitivity analysis.
According to the energy assessment, drying 1 kg carbonated slag has a coupled energy source with 0.495 MJ combustible (gas, oil or coal) to produce heat, and 0.00178 kWh electricity to run machines. Calcinating 1 kg carbonated slag is assumed to be equivalent to production of 1 kg traditional cement, as data from flash calcination for the studied process are yet unknown. A cement factory and heavy industrial machines model the infrastructure and equipment, according to the Ecoinvent process “cement production, Portland, RoW” (Ecoinvent 2020). Lubricating oil is added for equipment maintenance. Energy is again coupled with 0.64496 MJ combustible (gas, oil or coal) and 0.058 kWh electricity. As this calcination accounts for half of the heat required for a traditional cement factory, the combustible consumption is calculated from the energy assessment, then verified with the consumption of a traditional cement production (IEPF and Agence de l’efficacité énergétique du Québec 2012; Schorcht et al., 2013). The electricity consumption for traditional cement calcination has a mean of 0.1016 kWh/kg, obtained with three references (IEPF and Agence de l’efficacité énergétique du Québec 2012; Schorcht et al., 2013; Ecoinvent 2020). However, this value includes the consumption of grinding, which does not meet our process, as grinding was performed earlier. Then, 0.044 kWh (IEPF and Agence de l’efficacité énergétique du Québec 2012) is removed from the mean value, which gives 0.058 kWh of electricity consumption for carbonated slag calcination. 0.225 kg of fossil carbon dioxide is rejected in the air, as calcination frees carbonated CO2 from slag. With calcination, 14 tons of cement are obtained per hour. If necessary, sea freight for dry goods is modelled with the value according to the destination (1.5 ton. kilometers for Australia and 7 ton. kilometers for Japan).
The tested scenarios are assessed for the two production time-horizons with the ILCD 2.0 2018 midpoint method.
The environmental impacts of silico-magnesian cement obtained from nickel slag are compared to two references. First, a comparison is made with production of 1 kg Portland cement (cement production, Portland, RoW), assuming that nickel slag cement offers the same characteristics, which is still to confirm with the continuation of the Carboval project. Secondly, for future development, achieving a better environmental performance than Portland cement is not a reasonable objective given the climate change issue. To meet the objectives of the COP agreements, France (and New-Caledonia by extension) aims to reduce 81% of greenhouse gas (GHG) emissions from all industries by 2050 compared to 2015 (Ministère de la transition écologique et solidaire, 2020). Producing silico-magnesian cement is a part of the possible identified levers of the cement industry, to reduce GHG emissions by improving thermal efficiency. According to a recent report concerning USA, India and China (Cao et al., 2021), the current thermal average efficiency of cement production ranges from 3,264 to 3,768 MJ/ton of cement. Improving thermal efficiency can lead to decrease the energy consumption between 3,000 and 3,400 MJ/ton of cement (Cao et al., 2021). This represent at most 20% reduction. Accordingly, this is the target that we can set as a minimum for our silico-magnesian cement.
The results are analyzed in two steps. First, assuming a low energy consumption value for the mineralization process, all combined scenarios regarding technology choices, location of industrial sites and markets are compared to Portland cement for each environmental indicator. Scenarios that perform worse than Portland cement are eliminated for each indicator, narrowing the set of preferred scenarios based on the broadest spectrum of indicators. Then, energy consumption of the mineralization process is varied and compared to both cement Portland and France policy target.
Figures 3, 4, 5 show respectively scenarios results distributions for ecosystem, health and resources impacts.
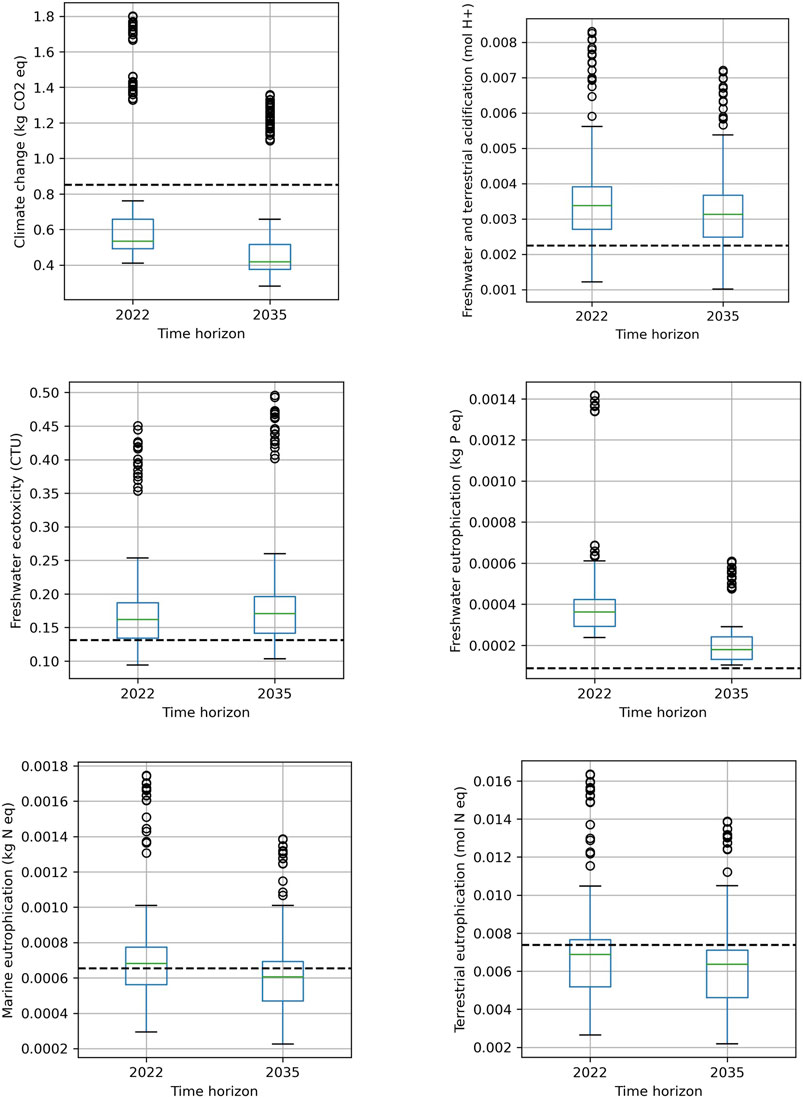
FIGURE 3. Scenarios distribution for midpoint impacts on the ecosystem with the two production time-horizons—the dashed line shows the impact of 1 kg of Portland cement.
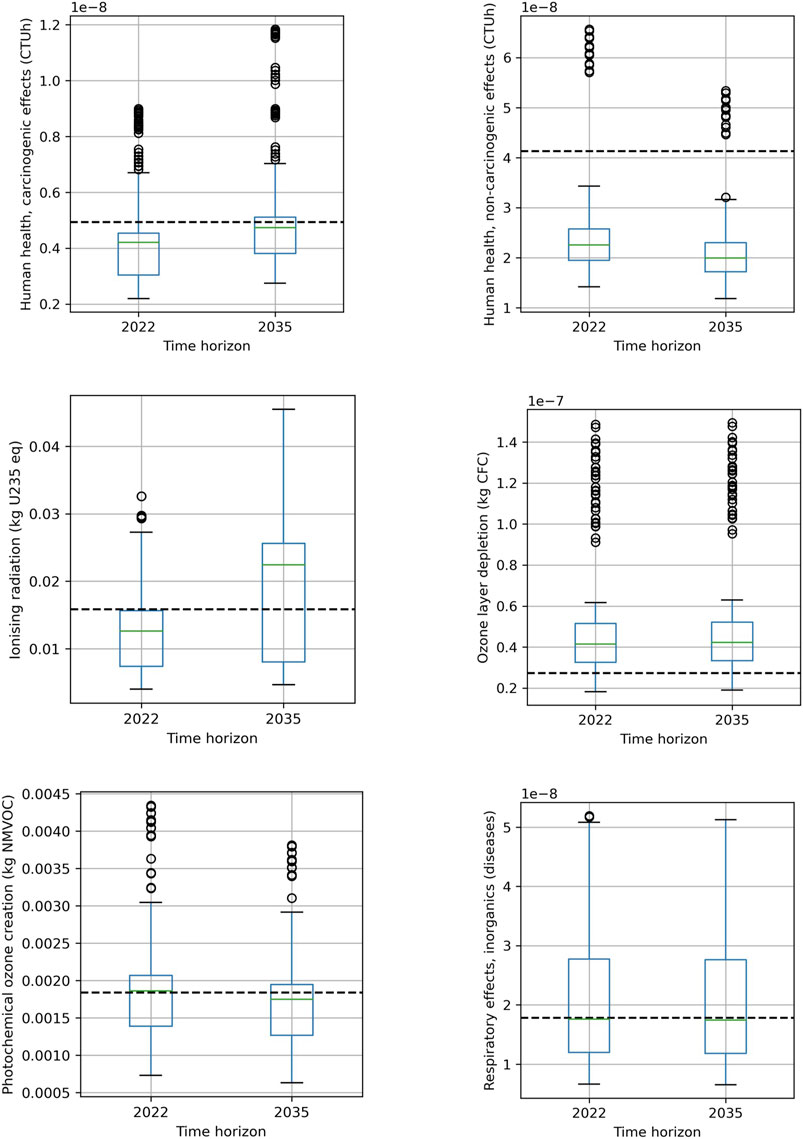
FIGURE 4. Scenarios distribution for midpoint impacts on human health with the two production time-horizons—the dashed line shows the impact of 1 kg of Portland cement.
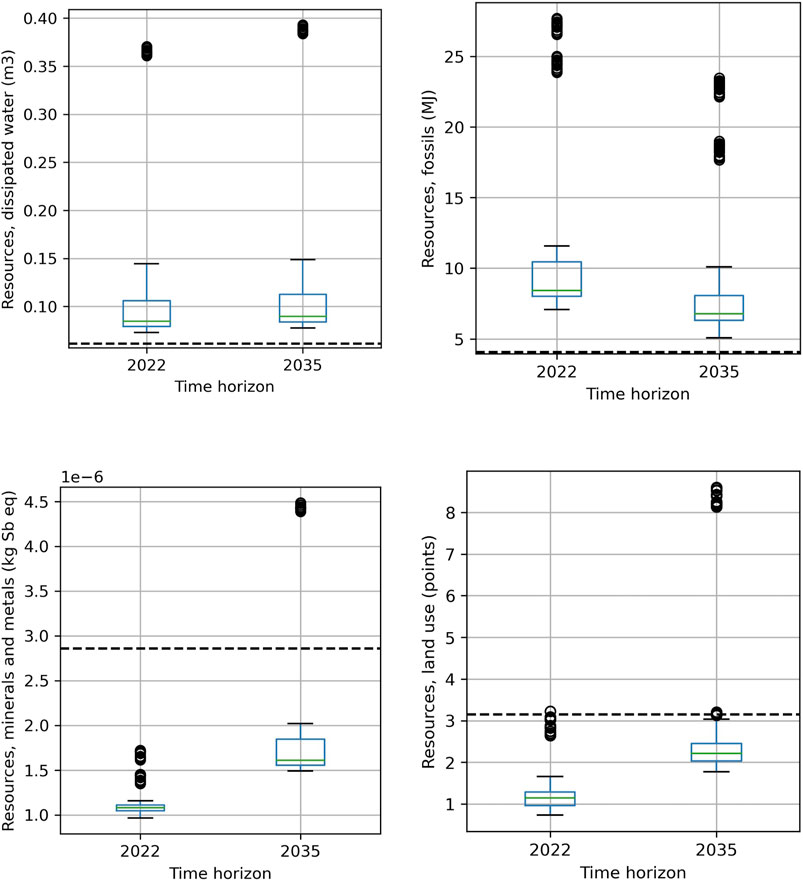
FIGURE 5. Scenarios distribution for midpoint impacts on resources consumption with the two production time-horizons—the dashed line shows the impact of 1 kg of Portland cement.
Cement from nickel slag valorization is particularly efficient for climate change, terrestrial eutrophication, cancer and non-cancer effects on human health, mineral and metal resources and land use. For these impacts, only the maximal (highest line of the boxplot) and extreme scenarios (outliers of the boxplot) exceed the Portland cement impact. Half of the scenarios are under the Portland cement for marine eutrophication, ionizing radiation, photochemical ozone creation and respiratory effects. Only a few scenarios enable nickel slag cement to be advantageous on freshwater and terrestrial acidification, freshwater ecotoxicity and especially ozone layer depletion, as only the lowest part of the boxplots passes under the Portland cement line. Then, for freshwater eutrophication, dissipated water and fossil resources, no scenario reaches the Portland cement performance.
Electricity grid supply evolution in 2035 would affect the scenarios performance. Results decrease for 9 impacts (climate change, freshwater and terrestrial acidification, freshwater, marine and terrestrial eutrophication, non-cancer effects on human health, photochemical ozone creation, respiratory effects, fossil resources) while it increases for 7 impacts (freshwater ecotoxicity, cancer effects on human health, ozone layer depletion, dissipated water, mineral and metal resources, land use). The negative impact of electricity grid evolution is mainly due to the increase of renewable energies in New-Caledonia, more specifically photovoltaic open ground installation, with a greater need of land and metals.
Nevertheless, electricity grid evolution slightly affects scenarios results. Results means do not exceed+/−25% difference with the 2022 horizon time for most impacts (Table 4). In terms of comparison with Portland cement, electricity grid evolution has also a slight effect on the set of acceptable scenarios (i.e. scenarios that perform better than Portland cement). No changes appear for impacts whose scenarios are completely inefficient (freshwater eutrophication, dissipated water, fossil resources), whose results are almost unchanged between the two production time-horizons (e.g. ozone layer depletion, which has 2% mean evolution at the 2035 horizon) or for which only the extreme scenarios are unacceptable, far from the boxplots (climate change, non-carcinogenic effects on human health). For the other impacts, the number of acceptable scenarios evolves in the opposite trend to the scenarios results evolution: it decreases if the results increase. The highest decrease is for radiations, which had 169 acceptable scenarios at the 2022 horizon and keeps 97 at the 2035 horizon (almost 50% loss). On the other hand, the highest benefit is for marine eutrophication which had 90 acceptable scenarios at the 2022 horizon and increases to 141 at the 2035 horizon (more that 50% gain).
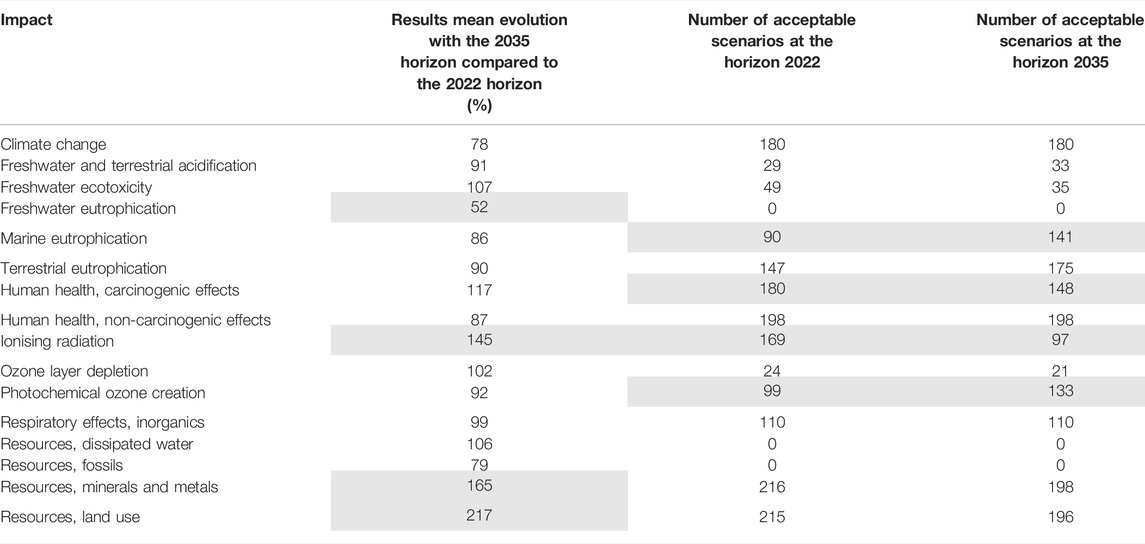
TABLE 4. Scenarios mean results and acceptable scenarios evolution with the two production time-horizons comparison–grey cells represent largest evolutions.
Figure 6 shows the mean contribution of the nickel slag valorization operations (regarding all the scenarios) for the 16 ILCD midpoint impacts at the 2035 production time-horizon. Most impacts follow the same ranking of contributors. Mineralization and calcination are the largest contributors, followed by CO2 capture & compression, drying, then market launch and crushing & grinding, which is the lowest contributor. Only the climate change impact operates differently. Calcination is the highest contributor by far, due to demineralized CO2 that is released into the atmosphere. The second largest contributor is CO2 capture & compression. The lowest contributors are, drying, then market launch and finally crushing and grinding. Mineralization compensates the impact, thanks to CO2 capture into nickel slags.
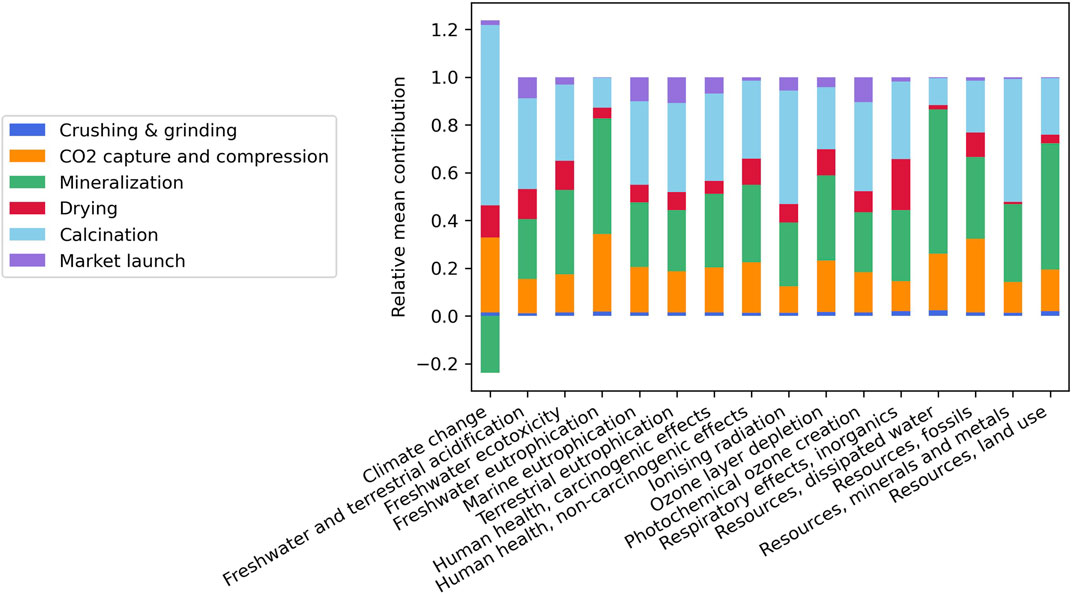
FIGURE 6. Mean contribution of the nickel slag valorization operations for ILCD midpoint impacts at the 2035 production time-horizon.
To achieve a sustainable nickel slag valorization sector by the production time-horizon 2035, we search for the acceptable scenarios for as many impacts as possible, i.e. scenarios that perform better than Portland cement for as many impacts as possible. As seen previously (see part 4), no such scenarios exist for freshwater eutrophication, dissipated water and fossil resources impacts and the ozone layer depletion impact would be hardly fulfilled. The search for acceptable scenarios is therefore limited to the remaining 12 impacts. Of the 216 scenarios set, only 13 remain. The 13 acceptable scenarios are 7 for a coal power plant and 6 for a gas power plant. Since the objective is to create the sector in New-Caledonia using on site plants (i.e. a coal and a gas power plant), we keep this two sets for discussion. Scenarios description is presented in Table 5.
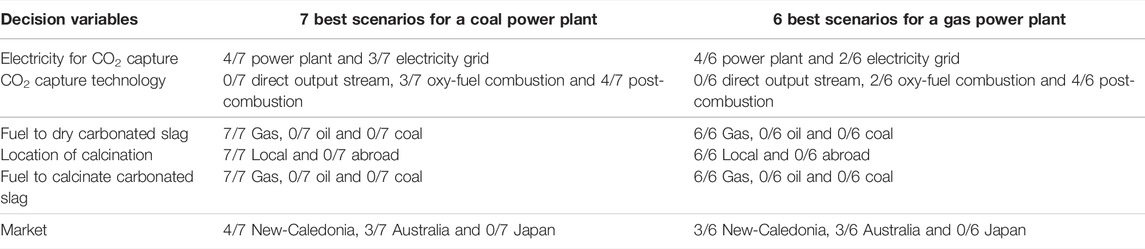
TABLE 5. Best 13 scenarios options of the nickel slag valorization sector at the 2035 production time-horizon.
Scenarios have a slight preference for power plant electricity for CO2 capture rather than electricity grid. This is a direct consequence of photovoltaic increase, which is more impactful for 7 environmental indicators. A criticism can be made of these results because the Ecoinvent’s photovoltaic power generation model dates from 2012 and passed its validity in 2017. It is however quite certain that photovoltaic power generation has improved since then, as the photovoltaic electricity cost has been decreased for several years (Fu et al., 2018).
CO2 capture technology is diversified between oxy-fuel combustion and post-combustion, with direct output stream technology being deleted because of the exceptional energy requirement for compression (see part 3.2). Even capturing direct output streams from a coal power plant is to prohibit, although the energy requirement is lower than for a gas power plant by a factor of 6. Indeed, output streams are poor of CO2 (3.5% from a gas power plant and 13.5% from a coal power plant), as the other capture technologies produces steams up to 95% of CO2.
However, the two sets agree with each other for the following three decision variables: gas to dry and calcinate, local calcination. Choosing gas as heat source is indeed the less impactful option. Finally, to reduce the impact of shipping, near markets are preferred, which also explains the preference for calcination in New Caledonia rather than in Japan.
For the climate change impact, 11 scenarios are in the top twenty and the remaining scenarios are 21th and 27th. Having acceptable scenarios for most impacts does not guarantee the best performance on climate change. Indeed, for this impact, many scenarios perform better than Portland cement (Table 4), which brings more diversity to the results. Then, on the contrary of global optimization, choosing electricity grid for capture & compression is an advantage for climate change. Two facts may explain this. First, the operation “CO2 capture and compression” is the second largest contributor (Figure 6) and the options for this operation have more influence on the results. Secondly, on climate change, electricity grid is less impactful than electricity from gas or coal power plant. The decrease is up to 52% for oxy-fuel combustion on a coal power plant. The best scenario for climate change on a coal power plant is then to capture CO2 with oxy-fuel combustion and, on a gas power plant, to capture CO2 with post-combustion.
If the optimization search is extended to the ozone layer depletion impact, the set of 13 acceptable scenarios is reduced to 2 acceptable scenarios. These two scenarios barely perform better than Portland cement (ranked 11th and 21th with a 2–3% impact decrease). Of the unsuitable scenarios, five scenarios increase the impact by less than 15%. The remaining eight scenarios increase the impact by up to 59%.
The two acceptable scenarios are exclusive on a coal power plant, with the following decision options: consumption of the power plant electricity, gas for drying and calcination, local calcination and target market in New-Caledonia. One scenario suggests oxy-fuel combustion and the other one suggests post-combustion. On climate change, the oxy-fuel combustion scenario is the 11th and the post-combustion scenario is the 21th.
The 13 best scenarios in part 5.1 are assessed with several values of attrition-leaching electricity consumption, from 3.2088 kWh/kg (100%) to 0.2858 kWh/kg (9% of the lab scale value), for each environmental impact. A regression line is drawn to find the consumption that would achieve at least the same impacts as Portland cement (Table 6).
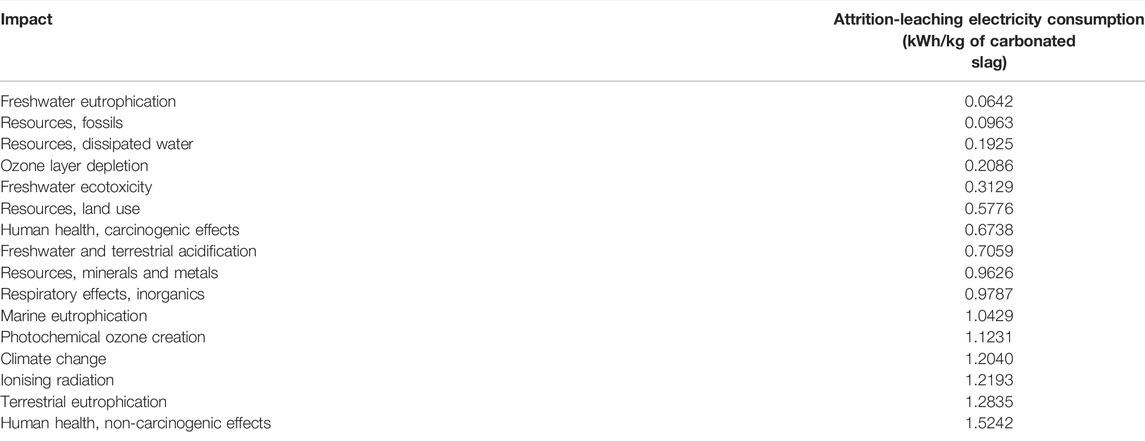
TABLE 6. Attrition-leaching electricity consumption to achieve the Portland cement impacts, ranked with a decreasing difficulty.
Half of the impact targets would be achieved by decreasing at least the consumption to 0.9626 kWh/kg (i.e. 30% of the lab scale value), a lighter optimization than that targeted in the LCA system, and therefore more plausible for future industrial developments. However, the remaining half of the impacts would require much greater efforts. Moreover, four impacts would need greater optimization than the LCA target, i.e. a consumption less than 0.2858 kWh/kg. The ozone layer depletion impact is in this group, although two scenarios perform better than Portland cement. The regression line, as a mean of the 13 best scenarios, explains that slight discrepancy. Climate change is, fortunately, one of the easiest impacts to achieve: it is the fourth out of the 16 impacts. The cement from nickel slag can efficiently compete with traditional Portland cement on climate change.
Electricity grids would continue to increase renewable energy supply, but the comparison of the two production time-horizons (see part 4) shows that it has only a slight effect on results.
Figure 7 shows the effect of energy reduction on climate change indicator, for the two selected references: Portland cement, and the French policy target. The black dashed line represents the current Portland cement so its intersection with the regression line (in blue) gives a minimal consumption of 1.2040 kWh/kg (i.e. 37.5% of the lab scale consumption) for the nickel slag cement to reach an identical performance on the climate change indicator (Table 6).
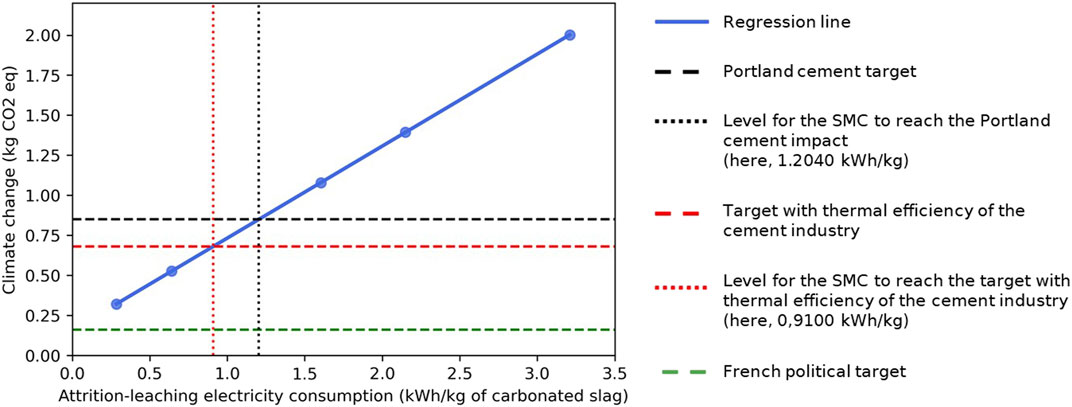
FIGURE 7. Assessment of the attrition-leaching electricity consumption depending on the climate change impact objective—the regression line is blue, the black dashed line is the impact of 1 kg of Portland cement and the black dotted line is the consumption to reach the Portland cement, the same is for the red lines, representing the case of thermal efficiency of the cement industry with a 20% reduction target, and the green dashed line is the 81% reduction target that should be reached in 2050 according to the French policy target.
By aiming for a 20% impact reduction as the best possible improvement due to thermal efficiency for the cement industry, electricity consumption of attrition-leaching must be set at less than 0.9100 kWh/kg (i.e. at least 30% of the value obtained at lab scale for the mineralization process). The decrease required by French policy objectives is also indicated with green dashed line in Figure 7. This target would be hardly difficult to reach with the current mineralization equipment.
The cement sustainability is then highly dependent with the laboratory in charge of the mineralization development. Moreover, the low Technology Readiness Level (TRL) of the process needs assumptions, which leads to use these prospective LCA results with care. A sustainable cement from nickel slag is possible, however it is not known which consumption reduction the laboratory can reach and if the same issues would occur again when converting the process from the laboratory to the industrial scale. Achieving the next TRLs, such as TRL 6 with a prototype in a relevant environment, are mandatory steps to demonstrate the industrial interest for this process. SCM, a second product which can be produced from mineralization (see part 2.1), should also be considered with another prospective LCA study. Some process assumptions would remain, but SCM, on the contrary of cement, does not need calcination. The process thus retains captured CO2, which qualifies it as CCU. Further research is planned to assess this subject.
This study shows how LCA can help to design circular economy projects at early stage of development, given a territorial context. A prospective Life Cycle Assessment is achieved to assess the implantation in New-Caledonia of a nickel slag valorization sector into cement using mineral carbonation. This application is totally new: by the waste considered as well as by the attrition/carbonation process and there is thus no comparison possible with existing data. As the main process (mineralization) is a low TRL, the study focuses on other technologic, territorial and economic market issues, leading to assess 216 feasible scenarios. Electricity grid of the model is adapted according to the two selected production time-horizons, 2022 and 2035, with 2035 as the most plausible year for the sector to settle.
Among the 216 initial scenarios, 13 scenarios are able to have lower environmental impacts than with traditional Portland cement for 12 of the 16 impacts of the ILCD midpoint method. Climate change is one of the easiest impacts to fulfill. The 4 remaining impacts (freshwater eutrophication, ozone layer depletion, dissipated water and fossil resources) are hardly, even impossible to reach. To obtain a sustainable sector, it is clearly recommended to exclude carbon capture from direct output streams, because of a higher energy demand. Drying and calcination of mineralized slag should use gas as fuel. Finally, local production and closest markets are preferable. There is no strict preference for the CO2 capture plant and the electricity source for CO2 capture and compression.
Future electricity grid, by increasing renewable energy supply, has distributed advantages and disadvantages for the sector in terms of environmental impact. Nevertheless, electricity grid evolution affects slightly the scenarios performance, less than+/−25% in mean. However, more recent and detailed inventories would be required, especially for photovoltaic power generation, to confirm these results.
Scenarios results are more affected by the electricity consumption of the mineralization process, especially of the attrition-leaching operation. For climate change, reducing energy consumption for the mineralization process to 37.5% at least of its current value at lab scale is mandatory to obtain a better result than Portland cement, but it must be reduced to 30% (i.e. a 70% reduction) to be in line with existing scenarios for reaching carbon neutrality of the cement industry. Electricity consumption is thus a major challenge and the success of this objective at an industrial scale is uncertain.
Supplementary cement materials should then be considered as another product from the nickel slag valorization sector by mineralization. SCM are the highest quality products after cement, and keep the advantage of a durable CO2 capture by avoiding calcination operation. It will be the topic of a next prospective LCA study.
The original contributions presented in the study are included in the article/Supplementary Material, further inquiries can be directed to the corresponding author.
MD performed the pre-LCA of the study process. Based on the pre-LCA, EQ performed the prospective LCA and carried out the calculations. EQ, AV, and MD performed the analysis of the results. EQ wrote the first draft of the manuscript. AV, EQ, and MD wrote sections of the manuscript. All authors contributed to manuscript revision, read, and approved the submitted version.
This work is part of the ongoing multi-disciplinary research effort CARBOVAL, co-funded by the New Caledonian Energy Agency ACE (grant #CS17-3160-00) and the French Environment and Energy Management Agency ADEME (grant #1894C0021).
The authors declare that the research was conducted in the absence of any commercial or financial relationships that could be construed as a potential conflict of interest.
All claims expressed in this article are solely those of the authors and do not necessarily represent those of their affiliated organizations, or those of the publisher, the editors and the reviewers. Any product that may be evaluated in this article, or claim that may be made by its manufacturer, is not guaranteed or endorsed by the publisher.
The Supplementary Material for this article can be found online at: https://www.frontiersin.org/articles/10.3389/fbuil.2021.743948/full#supplementary-material
Andrew, R. M. (2018). Global CO2 Emissions from Cement Production. Earth Syst. Sci. Data 10 (1), 195–217. doi:10.5194/essd-10-195-2018
Anselmi, H., Mirgaux, O., Bounaceur, R., and Patisson, F. (2019). Simulation of Post‐Combustion CO 2 Capture, a Comparison Among Absorption, Adsorption and Membranes. Chem. Eng. Technol. 42 (4), 797–804. doi:10.1002/ceat.201800667
Bahers, J.-B., Higuera, P., Ventura, A., and Antheaume, N. (2020). The "Metal-Energy-Construction Mineral" Nexus in the Island Metabolism: The Case of the Extractive Economy of New Caledonia. Sustainability 12 (6), 2191. doi:10.3390/su12062191
Bourgeois, F., Laniesse, P., Cyr, M., and Julcour, C. (2020). Definition and Exploration of the Integrated CO2 Mineralization Technological Cycle. Front. Energ. Res. 8, 17. doi:10.3389/fenrg.2020.00113
Cao, Z., Massanet, E., Tiwari, A., and Akolawala, S. (2021). “Decarbonizing Concrete: Deep Decarbonization Pathways for the Cement and Concrete Cycle in the United States, India, and China.” in Industrial Sustainability Analysis Lab - Climateworks Foundation. Available at: https://www.climateworks.org/report/decarbonizing-concrete/.
Cuéllar-Franca, R. M., and Azapagic, A. (2015). Carbon Capture, Storage and Utilisation Technologies: A Critical Analysis and Comparison of Their Life Cycle Environmental Impacts. J. CO2 Util. 9, 82–102. doi:10.1016/j.jcou.2014.12.001
Di Maria, A., Snellings, R., Alaerts, L., Quaghebeur, M., and Van Acker, K. (2020). Environmental Assessment of CO2 Mineralisation for Sustainable Construction Materials. Int. J. Greenhouse Gas Control. 93 (February), 102882. doi:10.1016/j.ijggc.2019.102882
Direction de l’industrie, des Mines et de l’Energie de la Nouvelle-Calédonie (DIMENC) (2020). Bilan Énergétique de La Nouvelle-Calédonie 2019 - Chiffres Clés.
Direction Générale du Trésor (2018). “Le Mix Énergétique Du Japon – Situation Actuelle et Perspectives,” in Ministère de l’économie, Des Finances et de La Relance. Available at: https://www.tresor.economie.gouv.fr/Articles/2018/07/13/le-mix-energetique-du-japon-situation-actuelle-et-perspectives-2018 (Accessed July 13, 2018).
Ecoinvent (2020). Ecoinvent Cut-Off. version 3.7.1. Available at: https://www.ecoinvent.org/. Accessed Date: January 18, 2020.
Fu, R., Feldman, D., and Margolis, R. (2018). U.S. Solar Photovoltaic System Cost Benchmark: Q1 2018. NREL/TP-6A20-72399. Golden, CO: National Renewable Energy Laboratory.
Giannoulakis, S., Volkart, K., and Bauer, C. (2014). Life Cycle and Cost Assessment of Mineral Carbonation for Carbon Capture and Storage in European Power Generation. Int. J. Greenhouse Gas Control. 21, 140–157. doi:10.1016/j.ijggc.2013.12.002
Gouvernement de la Nouvelle-CalédonieDirection de l’Industrie, des Mines et de l’Energie de la Nouvelle-CalédonieAgence calédonienne de l’énergie (2019). Rapport d’activité 2019 Relatif à La Mise En Œuvre Du Schéma Pour La Transition Énergétique de La Nouvelle-Calédonie 52.
Gouvernement de la Nouvelle-Calédonie (2020). Coup d’accélérateur Pour Le Renouvelable. Gouvernement de La Nouvelle-Calédonie. Available at: https://gouv.nc/actualites/26-08-2020/coup-daccelerateur-pour-le-renouvelable (Accessed August 26, 2020).
IEAGHG (2012). CO2 Capture at Gas Fired Power Plants. Report 2012/8 prepared by Parsons Brinckerhoff for IEAGHG. Report 2012/8 prepared by Parsons Brinckerhoff for IEAGHG 294.
IEPF, Agence de l’efficacité énergétique du Québec (2012). Les Fiches Techniques PRISME (Programme International de Soutien à La Maîtrise de l’Energie) : Le Diagnostic Énergétique d’une Cimenterie Par l’Institut de l’énergie et de l’environnement de La Francophonie 8.
InfoMine USAInc.CostMine DivisionAventurine Engineering, Inc. (2019). Mine and Mill Equipment Costs. An Estimator’s Guide. Available at: https://www.costmine.com/.
Julcour, C., Bourgeois, F., Bonfils, B., Benhamed, I., Guyot, F., Bodénan, F., et al. (2015). Development of an Attrition-Leaching Hybrid Process for Direct Aqueous Mineral Carbonation. Chem. Eng. J. 262, 716–726. doi:10.1016/j.cej.2014.10.031
Julcour, C., Cassayre, L., Benhamed, I., Diouani, J., and Bourgeois, F. (2020). Insights into Nickel Slag Carbonation in a Stirred Bead Mill. Front. Chem. Eng. 2 (November), 588579. doi:10.3389/fceng.2020.588579
Khoo, H. H., Bu, J., Wong, R. L., Kuan, S. Y., and Sharratt, P. N. (2011). Carbon Capture and Utilization: Preliminary Life Cycle CO2, Energy, and Cost Results of Potential Mineral Carbonation. Energ. Proced. 4, 2494–2501. doi:10.1016/j.egypro.2011.02.145
Kothandaraman, A. (2010). Carbon Dioxide Capture by Chemical Absorption: A Solvent Comparison StudyMassachusetts. Etats-Unis: MASSACHUSETTS INSTITUTE OF TECHNOLOGY.
Laniesse, P. (2019). Les Scories de Ferronickel : Minéralisation et Valorisation Dans Les Matériaux de Construction. Rapport bibliographique. Toulouse, France: Laboratoire Matériaux et Durabilité des Constructions LMDC: Université de Toulouse, INSA/UPS Génie Civil.
Le Bars, Y., Faugère, E., and Menanteau, P. (2010). “Le Captage et Le Stockage Géologique Du Gaz Carbonique.,” in L’énergie Dans Le Développement de La Nouvelle-Calédonie (Marseille, France: IRD Editions), 205–223.
Le Quéré, C., Andrew, R. M., Canadell, J. G., Sitch, S., Peters, G. P., Manning, A. C., et al. (2016). Global Carbon Budget 2016. Earth Syst. Sci. Data 8 (2), 605–649. doi:10.5194/essd-8-605-2016
Liu, W., Teng, L., Rohani, S., Qin, Z., Zhao, B., Xu, C. C., et al. (2021). CO2 Mineral Carbonation Using Industrial Solid Wastes: A Review of Recent Developments. Chem. Eng. J. 416 (July), 129093. doi:10.1016/j.cej.2021.129093
Ministère de la transition écologique et solidaire (2020). “Stratégie Nationale Bas-Carbone - La Transition Écologique et Solidaire Vers La Neutralité Carbone. Synthèse 32.
Mutel, C. (2017). Brightway: An Open Source Framework for Life Cycle Assessment. Joss 2 (12), 236. doi:10.21105/joss.00236
Nduagu, E., Bergerson, J., and Zevenhoven, R. (2012). Life Cycle Assessment of CO2 Sequestration in Magnesium Silicate Rock - A Comparative Study. Energ. Convers. Manage. 55 (March), 116–126. doi:10.1016/j.enconman.2011.10.026
Ostovari, H., Sternberg, A., and Bardow, A. (2020). Rock 'n' Use of CO2: Carbon Footprint of Carbon Capture and Utilization by Mineralization. Sustain. Energ. Fuels 4 (9), 4482–4496. doi:10.1039/d0se00190b
Pedraza, J., Zimmermann, A., Tobon, J., Schomäcker, R., and Rojas, N. (2021). On the Road to Net Zero-Emission Cement: Integrated Assessment of Mineral Carbonation of Cement Kiln Dust. Chem. Eng. J. 408 (March), 127346. doi:10.1016/j.cej.2020.127346
RECORD (2013). “Les Procédés de Capture Du CO2,” in Cas Des Unités de Traitement et de Valorisation Thermique Des Déchets (Villeurbanne, France: Etat de l’art), 11–0236/1A.
Réné, C. (2018). Comment Le CO2 Rejeté Par Les Usines va Aider à Valoriser Les Scories. Les Nouvelles Calédoniennes. Available at: https://cnrt.nc/actualites/presse-comment-le-co2- rejete-par-les-usines-va-aider-a-valoriser-les-scories-art-ln-du-191018/(Accessed October 19, 2018).
Schorcht, F., Kourti, I., Roudier, S., and Delgado Sancho, L. (2013). Best Available Techniques (BAT) Reference Document for the Production of Cement, Lime and Magnesium Oxide: Industrial Emissions Directive 2010/75/EU (Integrated Pollution Prevention and Control). JRC83006. Luxembourg: Publications Office of the European Union. Available at: http://eippcb.jrc.ec.europa.eu/reference/BREF/CLM_Published_def.pdf.
Shahmansouri, A. A., Akbarzadeh Bengar, H., and AzariJafari, H. (2021). Life Cycle Assessment of Eco-Friendly Concrete Mixtures Incorporating Natural Zeolite in Sulfate-Aggressive Environment. Constr. Build. Mater. 268 (January), 121136. doi:10.1016/j.conbuildmat.2020.121136
Keywords: life cycle assessment, CO2 utilization, waste valorization, construction materials, decision-making, design for environment
Citation: Quéheille E, Dauvergne M and Ventura A (2021) Prospective Life Cycle Assessment at Early Stage of Product Development: Application to Nickel Slag Valorization Into Cement for the Construction Sector. Front. Built Environ. 7:743948. doi: 10.3389/fbuil.2021.743948
Received: 19 July 2021; Accepted: 20 September 2021;
Published: 06 October 2021.
Edited by:
Audrey Tanguy, Ecole des Mines de Saint-Etienne, FranceReviewed by:
Georgios Bartzas, National Technical University of Athens, GreeceCopyright © 2021 Quéheille, Dauvergne and Ventura. This is an open-access article distributed under the terms of the Creative Commons Attribution License (CC BY). The use, distribution or reproduction in other forums is permitted, provided the original author(s) and the copyright owner(s) are credited and that the original publication in this journal is cited, in accordance with accepted academic practice. No use, distribution or reproduction is permitted which does not comply with these terms.
*Correspondence: Eva Quéheille, ZXZhLnF1ZWhlaWxsZUB1bml2LWVpZmZlbC5mcg==
Disclaimer: All claims expressed in this article are solely those of the authors and do not necessarily represent those of their affiliated organizations, or those of the publisher, the editors and the reviewers. Any product that may be evaluated in this article or claim that may be made by its manufacturer is not guaranteed or endorsed by the publisher.
Research integrity at Frontiers
Learn more about the work of our research integrity team to safeguard the quality of each article we publish.