 Takuma Akaki
 Tomoyuki Gondo
- Department of Architecture, Faculty of Engineering, University of Tokyo, Tokyo, Japan
The purpose of the present study is to grasp the situation of construction sites easily by distinguishing the movements of construction workers at construction sites from the accelerometer data attached to their waists. For the construction manager to accurately perceive the active or inactive state of his workers, their movements were classified into three distinct categories: walking, standing, and sitting. We tracked and observed two rebar workers for 5 days at a large building construction site. Their movements were classified by two-axis plots of (1) the difference between the maximum and minimum absolute values and (2) the value of acceleration at each second, and visualized by a heatmap among others for this trial. The results showed that despite the difficulty in distinguishing rebar work without a total body movement while sitting, the accuracy of discrimination was 60–80% in walking and sitting. From this analysis, we were able to identify repetitive tasks and the differences between morning and afternoon tasks. Furthermore, by applying simple visualization, we could concisely represent changes in work intensity over a relatively long period.
Introduction
Construction workers and their productivity are routinely monitored to improve results and safety at construction sites. Visual observation is the conventional method to analyze work productivity. However, a visual analysis is timeconsuming, subjective to judgments, and error prone (Costin et al., 2012). Furthermore, it is hard to apply in some cases, including dangerous work areas, dark construction sites, and busy worksites with many moving obstacles to observe, compared with analyses on open-air outdoor work (Cheng et al., 2011; Park and Brilakis, 2012). Few studies have acquired and analyzed data from actual construction sites. A method that can obtain information regardless of construction site conditions is badly needed. Construction projects often suffer from a waste of waiting time for crews, rework, unnecessary movement and handling of materials, unused inventories of workspaces and materials, etc. (Sacks et al., 2010). The lack of orderly progress, a significant condition at construction sites, leads to projects going off schedule and financial loss. It is also the big difference from analyzing worker movements in a controlled laboratory setting. Since 2000, new technologies, such as biometric sensors (Hwang et al., 2016), image recognition (Kim et al., 2009), motion capture (Yu et al., 2019), and Artificial Intelligence (AI) (Peddi, 2008), have been developed to monitor human movement. These technologies focus primarily on how detailed and precise the discrimination of work can be, although cost and other factors are additional evaluation indicators in preparing for widespread use (Sanhudo et al., 2021). Some of these methods present problems, including prohibitive costs of data acquisition, labor for analysis, and psychological burden on the operator. Improved approaches are underway. Construction managers often contend with rough or slightly inaccurate information when managing big projects with large crews over long construction periods (Kim et al., 2013; Moselhi et al., 2020). There are limits to the amount of data that can be accurately absorbed when many people or tasks appear on the construction site. Furthermore, if the data is collected over several days or months for dozens or even hundreds of people, the time and effort required to conduct a detailed analysis and the time and effort necessary for the on-site manager to understand the information become problematic (Navon and Shpatnitsky, 2005). It indicates a limitation of perception. In addition, when a large amount of data is acquired in this way, adding to the direct classification of work and productivity analysis, there is the added possibility of revealing some worker movement characteristics by analyzing data over long periods. Based on this concern, Gondo and Miura (2020) attached a 3-axis acceleration sensor to the waist of a worker at construction sites, clarifying the degree of movement by using a simple program to distinguish between two types of workers: active and inactive. The present study aims to develop and improve the method for differentiating worker’s activity, and to validate the effectiveness of data acquisition and discrimination. We had workers of the same occupation wear the accelerometer for 1 week (5 days) to see what kind of characteristics or tendencies of workers’ performances could be captured by the acceleration data.
Review
Monitoring Workers on Construction Sites
Visual observation and analysis are methods used to understand the movements of construction site workers. Industrial Engineering is the standard classification method for work measurement and analysis. In Japan, the Work Efficiency Measurement Guidelines provide a standard for analyzing building construction work efficiency (AIJ (Architectural Institute of Japan), 1990). Implementing measurement methods improves productivity, reduces costs, and shortens construction periods. With proper classification, current productivity can be evaluated and compared with other methods. Notably, the productivity of the construction industry is lower than that of other industries (Mckinsey Global Institute, 2017). Improving productivity is a significant priority, especially in regions with severe worker shortages, such as Japan (Labour Force Survey, 2020). In recent years, visual work analysis has been developed using new technologies. A typical example is the attempt to grasp movement via image recognition. Zhu et al. (2017) used construction site video data, simultaneously detecting and tracking multiple workers and equipment. The wireless real-time video monitoring system (WRITE) analyzed image sequences of workers on a bridge construction site while classifying their work as effective, contributory, or ineffective (Kim et al., 2009; Bai et al., 2012). There have been studies using Radio Frequency Identification (RFID) tags and accelerometers with Bluetooth Low Energy (BLE) to identify the location and movements of multiple workers at a construction site (Lim et al., 2016). Wireless technology measuring the location of objects and people at construction sites has been around since the 2000s. Navon and Shpatnitsky (2005) used Global Positioning System technology to automatically measure earth-moving performance by identifying equipment locations at regular intervals, calculating the data into project productivity. Zhao et al. (2019) and Zhao et al. (2021) applied BLE beacons for real-time tracking of construction workers in three case projects to collect location- and time-based worker information. Efforts are ongoing to acquire various kinds of information beyond images or locations to gain a more precise understanding of worker conditions. For example, Hwang et al. (2016) attached a photoplethysmography biometric sensor embedded in wristband-type trackers to analyze the heart rates of seven construction workers in the field to avoid excessive workload. Gatti et al. (2014) compared the breathing rates and heart rates of construction workers at rest and during routine activities. Still, a high hurdle exists for system installation due to privacy and other issues surrounding image recognition. In addition, the amount of data is massive when targeting multiple workers or workers over long periods, although individual analysis of a person and specific movement is possible.
After the data acquisition, proper classification is necessary. The conventional method identifies them by human observation, but this is time-consuming and costly. AI is also being used to classify worker movement from images and videos. Peddi (2008) captured the poses of workers from image sequences at construction sites and used AI to categorize them as effective, ineffective, or contributory work. Luo et al. (2018) distinguished the work status of multiple workers from low-quality video by using convolutional networks to interpolate image information from surveillance cameras. With respect to video research focusing on specific body movements, Kim and Cho (2020) measured construction worker movements by recognizing the position of each joint through motion sensors and motion recognition and analyzing it with the Long Short-Term Memory network. Such image recognition has the potential to discriminate work more directly and precisely. On the other hand, unlike factory workers, construction site workers may move around looking for things, especially at indoor construction sites where there are many obstacles, and it may be dark. However, due to the large number and variety of workers working on construction sites, it is impossible to make a comprehensive identification.
Many new technologies apply to analyzing work productivity, however implementing them in the field is a different story. It is necessary to reduce the cost of data collection and analysis by narrowing the targets. Measures are developing to grasp construction status more indirectly, using beacons with approximately 10-m accuracy to determine the room or floor where the construction workers work (Zhao et al., 2019). These methods are more effective for repetitive tasks. The current study uses accelerometers to collect data and is an indirect way to identify movement. Since it only detects the acceleration of the workers’ body, and construction work consists of repetitive movements, we can assume the workers’ movements to a certain extent.
Work Analysis Using Accelerometers
According to Godfrey et al. (2008), motion analysis using accelerometers has been around since the 1950s. Initially, researchers faced challenges regarding the cost and accuracy of the equipment. Researchers focused on the problem again in the 1970s with microelectromechanical systems (MEMS) technology. By now, MEMS has become a commonly used behavior analysis method because accelerometers have advantages in quantitatively measuring human movement at a lower cost. Therefore, accelerometers were widely accepted as beneficial and practical sensors for wearable devices to measure and assess physical activity (Yang and Yeh-Liang, 2010). In a context more closely related to people’s daily lives, Hendelman et al. (2000) conducted a study with 25 people to determine how much data they needed to measure the intensity of real-life behavior. In another study, Matthews et al. (2002) conducted a physical activity analysis using accelerometers for 122 subjects for 3 weeks to shed light on behaviors in real-life situations. In this research, the differences in activities, such as according to the day of the week, were clarified. As a study of office workers, Cha et al. (2018) achieved high accuracy in classifying seven common office activities such as ‘keyboard typing’ and ‘mouse-clicking’ based on accelerometer data attached to the back of the subject’s dominant hand.There have been efforts to install accelerometers to capture worker movements or other objects at construction sites. Joshua and Varghese (2011, 2014) investigated the feasibility of using wearable accelerometers attached to masonry workers’ waists for automated activity classification. In the civil engineering field, it is easier to detect whether machinery is moving or not. Akhavian and Behzadan (2015) used smartphones to verify the operational status of civil engineering and construction equipment. Another approach applied a wristband-type activity tracker to discriminate masonry workers’ hand movements in the laboratory (Ryu et al., 2019). Several researchers applied sensors at construction sites to determine the safety of construction workers in severe conditions. Cheng et al. (2013) applied a wideband wireless position sensor and a biometric sensor to continually monitor the location and physiological status of workers to help them avoid unsafe behaviors. Valero et al. (2017) developed inertial measurement unit (IMU) devices to detect awkward postures to decrease the risk of musculoskeletal disorders and validated it by bricklaying tasks. In a similar study, a wearable IMU was created to estimate the balance of construction workers to prevent falls (Jebelli et al., 2016) and validated by rebar tying tasks (Umer et al., 2018). In another approach, Yantao et al. (2019) introduced an automatic workload assessment method to assess workers’ joints using image-based 3D posture-capturing smart insoles.
For human activity classification, deep learning methods such as convolutional neural networks have been applied. Zheng et al. (2018) compared four methods of data preprocessing when using deep learning for human activity recognition and found that the multichannel method showed the best performance. These studies attempted to classify the movements into several types. In order to classify more complex motions, Sanhudo et al. (2021) conducted an indoor circuit experiment using 10 common construction activities including non-productive activities, and showed that the accelerometer data on both wrists and the dominant leg could classify these motions with high accuracy. Again, there are a large number of workers and occupations working on construction sites. Each worker has many activities to execute. In addition to aiming for detailed discrimination, there is also the possibility of collecting data over long periods, or targeting multiple people at once to gain a general understanding of the situation at the construction site, even if the accuracy of the discrimination is somewhat reduced.
Bouten et al. (1997) developed a portable unit to record acceleration and distinguish between active and rest states. Mathie et al. (2003) also categorized daily activities into active and inactive states and developed a program to identify them. Gondo and Miura (2020), referring to Mathie et al. (2003), attached accelerometers to workers at construction sites of houses and buildings and classified them into two states: active and inactive. By doing so, Gondo and Miura (2020) were able to detect abnormal values, which coincided with the failure. However, we were unable to conduct a systematic analysis of the building because of the different job types, such as rebar, carpenter among others. As a method for simple visualization of data over a relatively long period of time, as in this study, and for reflecting it sequentially in health management, Sun et al. (2020) proposed a method for collecting several kinds of data including the blood pressure and heart rate among others of workers in a factory and using it for lean management. In building construction industry, there is a need for a similar approach to acquire data on the movements and situations of workers on-site over a relatively long period of time, and then simply visualize them and make improvements from there. As Calvetti et al. (2020) point out, in order to envision an information-based construction industry such as construction 4.0, “Craft-workforce-centered” technology should be adopted.
Gaps in the Existing Literature
In addition to conventional visual observation, various recent technological developments can be applied to analyzing construction site operations. They include image recognition and biometric sensors. These methods need to be used in different ways according to their purpose. For example, in determining the work details, methods that acquire a large amount of information per time, such as image recognition (Kim et al., 2009; Bai et al., 2012) and biometric sensors (Gatti et al., 2014; Hwang et al., 2016), are effective but carry the hurdle of increased data acquisition. In addition, by increasing the number of discriminating types of work, it is possible to grasp the content of the work more precisely. However, this may increase the time and effort required for analysis and complicate visualizing the results. The significance of detailed work analysis is enormous. When considering the information necessary for construction site managers, it is critical to grasp how the construction site operates in general while avoiding spending time and money on analysis. As Kim et al. (2009) pointed out, one of the limitations of these measurement technologies is the difficulty for engineers and managers in ongoing construction sites to analyze and use the results. In this regard, analysis automation is effective, as is the method of collecting location information over a long period with as little time as possible spent on data acquisition, and the mode of deliberately limiting the analysis to simple data, as in the case with Mathie et al. (2003). In the manufacturing industry, there are attempts to collect data over a relatively long period of time and reflect it in management in a sequential manner, such as Sun et al. (2020). In addition, as Calvetti et al. (2020) point out, in the construction industry, from the construction manager’s point of view, it is not only a question of how to increase productivity, or how to get craftsmen to work, but also a question of how to improve the situation of construction sites from a broader perspective, including productivity, based on how workers work. However, although there are many studies aimed at improving the accuracy of discrimination and detecting safety hazards, there are few studies that analyze the characteristics of the movements of workers at construction sites with the help of information technology.Based on our awareness of the underlying problems, we analyze the construction site work using an acceleration sensor. Compared with image recognition and biometric sensors, accelerometers are easier to install, require less data, and place less of a psychological burden on the subject. As Ryu et al. (2019) pointed out, the only use of a single sensor can reduce the burden to carry multiple sensors while also reducing computational cost and memory. In the analysis, we discriminate only three types of movements, namely, standing, walking, and sitting, to distinguish the most common movement of future workers. The present study is a continuation of Gondo and Miura (2020). While Miura’s data collection took only 1 or 2 days for a specific type of work, and they encountered difficulties standardizing the content of the work, the current study records similar work, with the same type of rebar worker, over 5 days. In Gondo and Miura’s study, records divide into two categories, namely, activity and inactivity. The present study is novel. It revisits the classification method, distinguishes three categories, and attempts several analyses and visualizations based on new information.
Methods
Accelerometer
In the present study, a single-function accelerometer was affixed to the worker. In another approach, an accelerometer built into a smartphone or smartwatch has been used in several studies (Akhavian and Behzadan, 2015).However, APIs that can analyze acceleration data have not become widespread, andtheanalysis can be difficult because different people carry their smartphones in different ways. Moreover, the continuous acquisition of acceleration data may affect the original use of the device, such as increasing battery consumption. Based on these issues, a single-function accelerometer was affixed to the worker in this study. From another viewpoint, this study used data-storing accelerometers, because of the stability of data acquisition in conjected construction sites, compared with the data transmission accelerometers, even which type is smaller than data-storing ones.
Based on the above discussion, we used MicroStone’s 3-axis acceleration sensor in the current study. This sensor can acquire XYZ 3-axis acceleration data with a period of 5–200 Hz. The accelerometer had a built-in recording medium, and data was collected after the survey. Its battery life is good for up to 50 h of continuous surveying and was recharged daily during our trial. Accelerations were recorded throughout the entire working period. Most of the previous studies using accelerometers attached the sensor to the waist primarily because the waist is close to the body’s center of gravity. Body movements are quantified more accurately in this position. Similarly, in the present study, the acceleration sensor was attached to the operator’s belt at the waist (Figure 1).

FIGURE 1. Accelerometer (Left: Accelerometer, Center: Location, Right: Rebar Worker).
Construction Site
Our 5-days field survey (October 12–16, 2020) took place at a large office building construction site (over 100,000 m2). The accelerometer recorded 10 rebar laborers working on floor reinforcement, 2 workers per day (one skilled and one unskilled). Only on Day 3, skilled workers replaced the unskilled workers as unskilled labor was unavailable. The workers attached the acceleration sensors to their belts (on the right side of their waist) before starting the work. Two investigators recorded each day with a video camera. To synchronize the time between the accelerometer and the video camera, characteristic movements were made while recording the accelerometer with the video camera. The time was synchronized with the recording time of the movements. Both apparatuses continued filming and recording without interruption until the end of the workday, except for break times (due to the hindrance of the accelerometer and the battery life of the video camera). The workday broke down into four work periods, with a 1-h lunch break and two 30-min breaks during the day, one in the morning and one in the afternoon. The first work period was from 7:30 to 9:00, the second was from 9:30 to 11:00, the third was from lunch to the afternoon break, 12:00 to 14:00, and the fourth was after the afternoon break, from 14:30 to 16:00. Every day, we videotaped one skilled worker. Although accelerometers were attached to both workers, one skilled and one unskilled, it was impossible to film both simultaneously due to the frequent walking around on the large worksite. Therefore, the accurate discrimination analysis described below focused on one skilled worker each day.
Movement Discrimination
After the field survey was over, a portion of the filmed work was extracted from the video camera data and judged visually. We extracted 5 min at the 30–35-min mark after the start of each work term. Because, at the beginning and the end of each work period, movements that differed from the usual work, such as work preparation and cleanup, were not appropriate for discrimination. The reason that a portion of the work was used rather than the full scope of the day is the amount of time required to render an accurate (visual) judgment of the operation. The process took approximately 10–20 min per 5-min video extraction.
The floor reinforcement work required the following actions. First, move around the site, and take out the appropriate rebar from the rebar storage area. Carry the rebar to its placement location, and drop the rebar on the floor while standing. If the rebar does not fall into the proper position, squat down, and rearrange it correctly. After a fixed area of rebar is laid out, tie the rebar together by bending or crouching because it is necessary to use a hacker to wrap the tying wire around the intersection of the rebar. Stand still during short rest breaks during work or when consulting with other workers or giving instructions. However, due to the variable flooring condition at the worksite, the body is always in slight motion. Based on the above movement prompts, the visual analysis classified the worker’s movements into three types: 1) walking. Walking occurs due to the worker’s movements and the movement of the rebar. 2) Standing. Standing occurs when the worker communicates with other workers, consulting and giving them instructions. Motionless time and resting time are also classified as standing. 3) Sitting. Sitting occurs when the worker lays out rebar and ties reinforcement.
Discrimination Program
In the present study, we used a two-axis scatter plot for discrimination. First, the x-axis is defined as the difference between the maximum and minimum absolute values of acceleration in 1 s. It makes it possible to discriminate by the change of acceleration during 1 s, especially the degree of sudden change.
Next, similar to a previous study (Gondo and Miura, 2020), the value of acceleration at each time is added together and used as an index. The frequency means the number of acceleration data per second. In the field study, we acquired acceleration data every 0.01 s, or 100 Hz, so frequency = 100.
In this study, we took the following steps to discriminate behaviors. First, we determined the magnitude of the acceleration. In the field study, we acquired acceleration data every 10 ms or 100 Hz. The 100 data acquired after t seconds from the start of the experiment are named
Next, we performed discrimination using a scatter plot of the two axes. First, the X-axis is defined as the difference between the maximum and minimum absolute values of acceleration in 1 s. It makes it possible to discriminate by the change of acceleration during 1 s, especially the degree of sudden change. The frequency in this experiment is 100.
Next, similar to a previous study (Gondo and Miura, 2020), the value of acceleration at each time is added together and used as an index.
Next, we set up a classification function on the scatter plot that was optimized for the visual classification results (Figure 2). The reason for using scatter plots is that in addition to being able to discriminate in a relatively simple and visually comprehensible form, the number of parameters was increased from 1 to 2 in order to increase the number of classifications from 2 to 3 compared to Gondo and Miura (2020), referring to several programs for predicting motion by acceleration that are available on the Internet (Paul, 2015). The Validation of discrimination Validation of Discrimination explains this function.
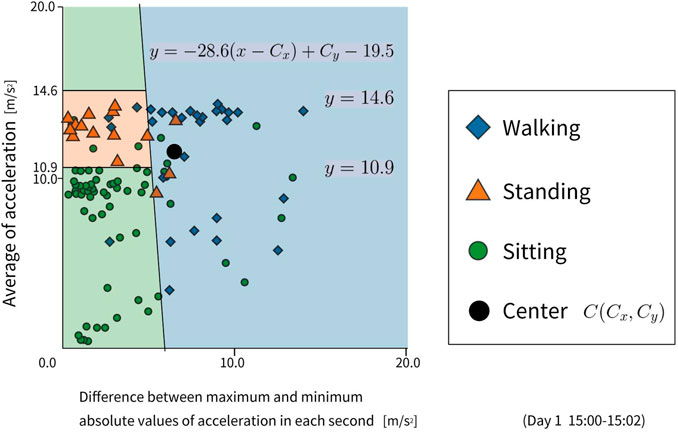
FIGURE 2. Scatter plot (Day1 15:00–15:02).
In the current study, the F-value is the index measuring the degree of agreement between the classification result and the visual judgment of the motion. The F-value is calculated by the harmonic mean of the rate of conformity and the reproduction rate. The rate of conformity is the percentage of items in a given classification that perform that behavior. For example, if 100 s of walking behavior is classified, and 60 s of it is actual walking, then the rate of conformity is 60%. Reproduction rate means the percentage of the actual behavior that fits a certain classification. For example, if 100 s of walking is classified as a walking action, and the actual walking action is 200 s, the reproduction rate is 50%.
The classification was corrected by extracting workflows that do not occur in the usual work (Figure 3). For example, “sitting only for 1 s” can be analyzed from the classification function, but such action never actually occurs. The classification accuracy improves by extracting and removing such transitions as noise, which cannot occur in normal body movements. Therefore, we used the following two methods to remove noise. First of all, only the sitting work has a very different body posture from the other two actions. Therefore, if there is another movement in the 1 s interrupted by the sitting work, it is regarded as a sitting, and 1 s of sitting interrupted by the other movement is corrected to that classification (standing, walking). In addition, the other 1-s movements sandwiched between two or more seconds of another movement are considered as the longer-time movement.
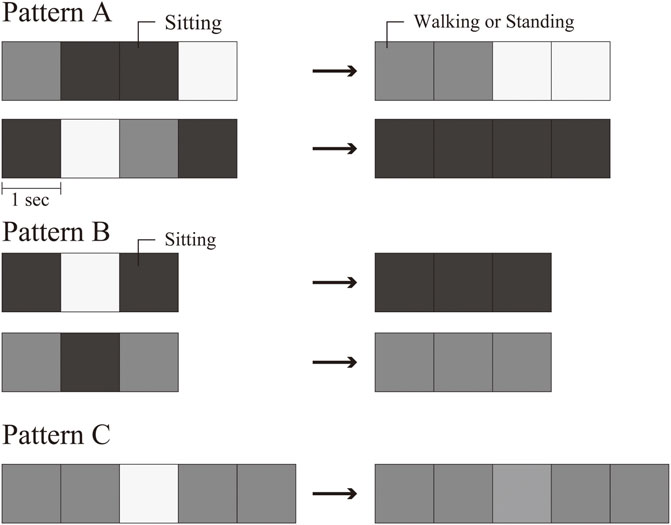
FIGURE 3. Noise correction method.
Result
Validation of Discrimination
We acquired 5 min of video four times a day (work terms), over 5 days for visual classification purposes. Due to a glitch with the video camera on the fourth day, the fourth work term was not fully captured. However, we did capture 5,700 s (5 min by 19 times) of the fourth day’s video, which was classified visually (Table 1). As a result, there were 936 s, or 16% of the total, where the worker’s movement was not visible on the screen, and visual judgment was impossible. Either the worker was in a blind spot at the site, the worker was on a different floor, or the worker was moving so frequently that the filming could not keep up.
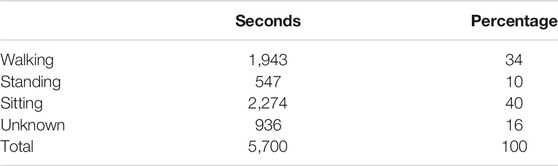
TABLE 1. Discrimination by video camera.
We set up a classification function on the scatter plot to classify the motion from the distribution of each point. First, we consider the function for extracting the gait. For the convenience of variables, we set the following function based on point C where (Cx, Cy) = (5, 15). C is an arbitrary point where the classification function is roughly considered to pass through a neighborhood.
The variable θ was set as the angle between the x-axis and a1, so that a1 would change its value by changing the variable θ. Considering the shape of the graph, the following definition regions were set.
The function expressed by this formula is illustrated in Figure 4.
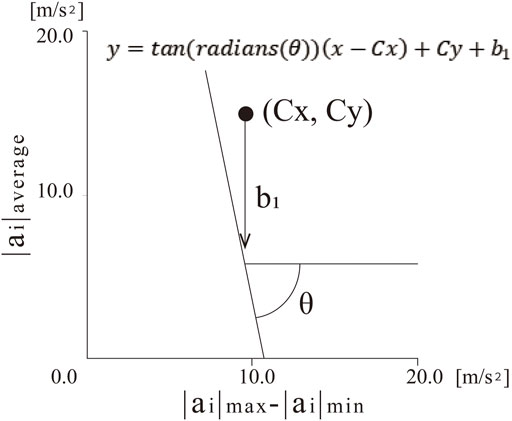
FIGURE 4. The function of discrimination.
Next, we search for θ and b1 where the F-value is the maximum. Here, we find the maximum value of the F-value by changing the values of θ and b1 little by little, finding the F-value of each. Due to the limitation of computational cost, we first calculate θ and b1 in a wide range of definitions and then narrow the range again near the value where the F-value reaches the maximum. For each definition range, we first defined the definition range of θ and b1 from the graph as follows. θ was varied from −50° to −95° every 5°, and b1 was varied from −25 to 20 every 5°, to find the θ and b1 that maximized the F-value of walking in 10 × 10 combinations. The F-values were obtained from the total walking time for 5 days. The results are presented in Table 2.
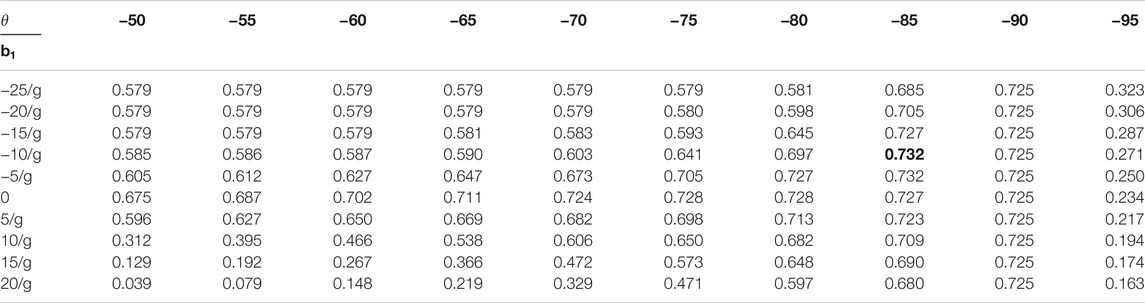
TABLE 2. Variables and F-value (the bold value is maximum)..
From Table 2, we found that the F-value is maximum at (θ, b1) = (−85°, −15). To fine-tune the parameters further, we narrowed the range of θ (by 1°, −89° < θ < −80°) and b1 (−19.5 < b1 < −6, b1 by 1.5) and calculated 10 × 10 combinations again as follows. In the same way, we obtained θ and b1 where the F-value of walking is maximum. The results are presented in Table 3.

TABLE 3. Variables and F-value (the bold value is maximum).
We applied denoising to the result derived from the discrimination function. The results are presented in Table 4. Compared with the classification results by the classification function alone, the noise removal increased the F-value of walking classification by 1.7% and that of sitting by 2.6%. In particular, the conformity rate of walking and reproduction rate of sitting were improved. However, the F-values for standing were unchanged. By removing the noise, the ambiguous time between walking and sitting was delineated clearly, likely improving the accuracy.
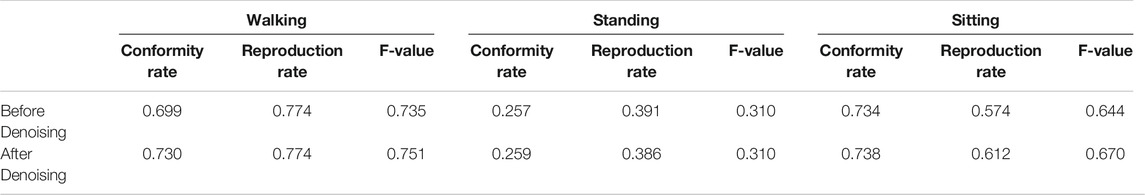
TABLE 4. F-value after denoising.
Result of Discrimination
Figure 5 shows the ratio of various tasks to the total daily work time of each worker. All workers walked, stood, and sat at roughly consistent rates. There was no difference in walking (approximately 36%) between skilled and unskilled workers. Skilled workers spent 7.1% less time standing and 6.6% more time sitting. In other words, the skilled workers spent less time resting and consulting and more time placing and tying on average.
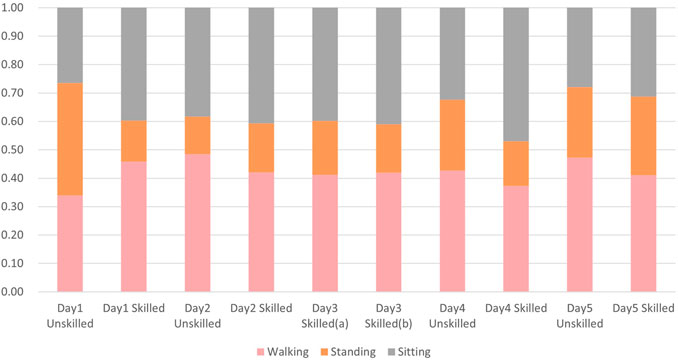
FIGURE 5. The ratio of various tasks to the total daily work time of each worker.
Next, we investigated the transition of the ratio of various tasks in a day. As for the work terms of each day, the first and second work terms performed in the morning are the morning activities, and the third and fourth work terms performed in the afternoon are the afternoon activities. The transition of the ratio of walking time was presented in a line graph (Figure 6). The average percentage of walking time for all workers was 42%. The graph shows that for nine out of 10 workers, walking time in the afternoon decreased for those with an above-average walking time in the morning. On the other hand, for those whose walking time in the morning was below average, walking time in the afternoon increased.
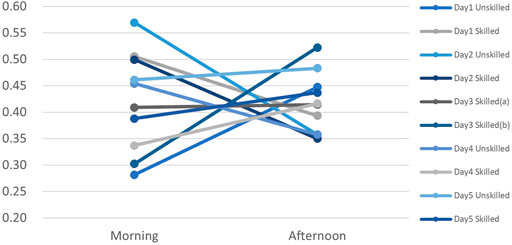
FIGURE 6. The ratio of walking in morning/afternoon activities.
To understand the transition of work within each work term, we divided each work term time into four parts and obtained the work time in each time range. The reason for such division was that the transportation and placement of rebar was repeated within a work term during the observation of the construction site. The values 1–4 on the x-axis indicate not the work term but the order in which the work terms were divided into four. Among them, the six work terms that showed characteristic changes were extracted and displayed in a line graph (Figures 7, 8). The characteristics of these work terms are that walking time is high immediately following the start of the work and walking decreases as the work reaches the halfway point. The ratio of sedentary work increases at the same time. As the work reaches the 3/4 mark, the percentage of walking increases, and sitting decreases. As the work approaches the end, walking decreases. Thus, a cyclic behavioral pattern is visible within a single work term. The reinforcement work was performed twice in these work terms. In other words, the combination of transporting the rebar and then tying it repeats twice, which was also confirmed by the video camera. On the morning of the fourth day, the rebar was transported after the start of the workday. The rebar’s placement proceeded 26 min after the work began, and the tying work started 30 min after the work began. Fifty-3 minutes after the work started, the rebar transport restarted, and the tying work was done in 78 min. The inspection was done 86 min after the work started, and work was interrupted after 90 min for a rest break.
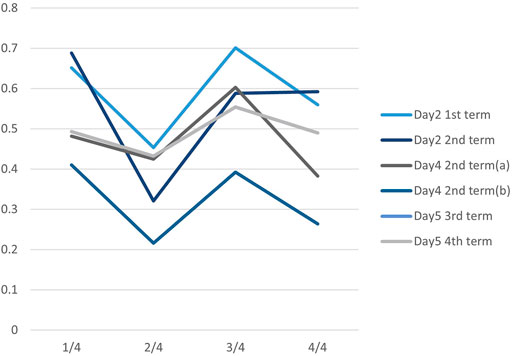
FIGURE 7. The transition of the ratio of walking.
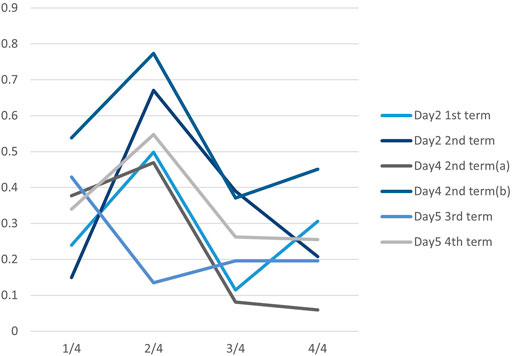
FIGURE 8. The transition of the ratio of sitting.
Next, we roughly analyzed how the work activity changed in total. In this section, the level of work activity is defined as the percentage of walking. Since walking requires more body movement than standing or sitting work, people actively move their bodies when they walk. Therefore, to determine which time of the day was the most active, we divided the work time into 5-min segments and calculated the percentage of walking in each segment. Colors were then determined with the walking percentage and arranged in chronological order (Figure 9). The left end of Figure 9 corresponds to 7:30, the work start time, and the right end corresponds to 16:00, the work end time. Since the work was sometimes finished before 16:00, the color scheme is white after the acceleration data was interrupted. The color scheme is set so that the higher the percentage of walking, the closer the color is to red, and the lower the percentage, the closer the color is to blue. In other words, the periods with cold colors show gentle movement with a small percentage of walking, whereas the periods with warm colors show active work with a focus on more vigorous walking.
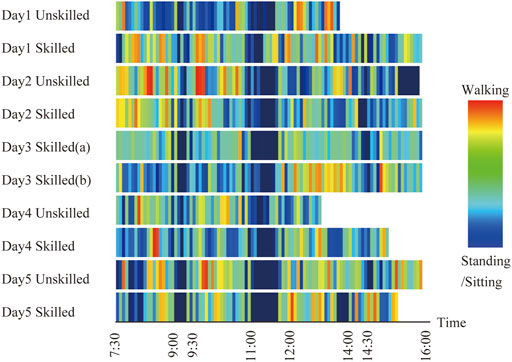
FIGURE 9. The heat map (changes of the ratio of walking).
The heat map provides an understanding of the operating characteristics of individual workers. Going by the walking percentage, it reveals that afternoon rest time varies more than morning. Similarly, it shows abnormalities and work delays. For example, the morning of Day 5 is blue, unlike the other days, because the work was significantly delayed. In another example, if we look at the red part of the color, there is a period where the unskilled workers of Day 1 and the unskilled workers of Day 5 are dark red. It shows that there are times when workers continue to work by walking. Overall, warm colors are more prevalent in the mornings, whereas cold colors are more prevalent in the afternoons. It may be because people tend to spend more time walking in the morning when they have more energy. On the other hand, for the skilled worker on Day 3, warm colors are more prevalent in the afternoon than in the morning. This afternoon, to start work on the upper floor the next day, one skilled worker was marking the area to be constructed and so on, whereas another skilled worker was carrying materials from the lower floor to the upper floor.
Discussion
Validity of the Method
In the present study, we developed a method to classify the work in construction sites using an accelerometer from the study by Gondo and Miura (2020). Specifically, we classified the rebar worker’s movements into three types: walking, standing, and sitting. The accelerometer data was divided every second and classified by using three types of linear functions in a 2-axis scatter plot. The difference between the maximum and minimum absolute values of acceleration in 1 s was the x-axis, and the average of the absolute values of acceleration was the y-axis. The classification accuracy was achieved with F-values of 0.735, 0.310, and 0.644 for walking, standing, and sitting, respectively. The operation was performed to remove them as noise. As a result, the conformity rate of walking and the reproduction rate of sitting have improved after denoising and the F-values of walking and sitting work increased by 1.7 and 2.5%, respectively (Table 4). This indicates that the addition of a simple discrimination rule, such as not standing or sitting in one second, even in a state where the waist is not considered to be moving much while sitting, showed the possibility of improving the accuracy of discrimination.
While the accuracy of the results for standing was low, the results for walking and sitting, while not perfect, were sufficient to analyze the fieldwork. In the analysis by Gondo and Miura (2020) with movements using accelerometers, there were two types of classification: active and inactive. The degree of agreement between multiple people on the visual classification results was approximately 67%. Note that the agreement rate is the sum of the number of correctly classified actions and the number of correctly classified non-actions against the total number of actions. When the agreement rate was calculated using the parameters in the present study, it was 79% for walking, 80% for standing, and 71% for sitting. The agreement rate was not used as an index in the current study because it is greatly affected by the percentage of each classification element. The accuracy of the accelerometer analysis was equal to or higher than that of visual discrimination compared with previous studies.
Application to Future Construction Management
The following two recommendations can be helpful to future construction management. The first is to visualize the situation of the construction site like a heat map (Figure 9). Doing so makes it possible to detect abnormalities. For example, while the morning break occurs at a fixed time, the afternoon break varies from day to day and person to person. Thus, from this data, the construction manager can determine whether the work is progressing as planned and whether workers are taking appropriate breaks. By judging this in combination with the rate of walking and other factors, it would be possible to estimate whether the work is progressing as planned and whether the load concentrates on particular workers. In addition to grasping short-term problems such as temporary stagnation of work, various analyses will be possible by increasing the period or the number of workers to be targeted, such as weekly comparisons. Second, as revealed in our survey, rebar workers have a work cycle (Figures 7, 8). By combining it with the work output, there is a possibility of its use in progress management. In assembling the steel bar reinforcements, especially, it was possible to estimate the approximate time and work cycle since we went back and forth at regular intervals between where the materials were placed and the work location. Thus, the significance of this paper lies in the fact that it was a trial analysis to see if any characteristics could be found in the activities and movements of the rebar workers, in addition to detect errors or wastes in construction sites or to record the health status of construction workers. In a related study to find the characteristics, Gondo and Miura (2020) compared skilled and unskilled workers and pointed out that skilled workers tended to show less extreme increases and decreases in activity. The novelty of this study lies in the fact that although the sample size was small, it was analyzed from several new perspectives, such as the change in activity between morning and afternoon, and the cycle of walking and working during the working hours, and revealed new tendencies. By analyzing these characteristics of workers’ behavior in construction work, we can find a direction for worker-centered construction sites where workers can appropriately demonstrate their abilities (Calvetti et al., 2020).
Limitation and Future Study
The limitations of the study and the future research needed as found from the survey and analysis are as follows. First, in the analysis, the accuracy of the walking and sitting tasks was higher than that of the standing task. It may be partly due to the shorter observation time for the standing position than for the other actions. In addition, 5,700 s was used as a sample for discriminating between video data and acceleration data, which is considered to be a sufficient sample size for discriminating between the targeted workers, but since individual differences among workers are also considered to be large, the number of samples needs to be increased in future studies. Particularly, it is hard to distinguish brief stops while walking from regular walking because acceleration may occur even though the person appears to be standing still. Furthermore, these classifications were challenging because walking involves a large number of waist movements, whereas standing and sitting both involve far less. In the rebar work, it was hard to grasp the content of the work with the accelerometers because it involved hand movements. However, if the work involves movement, vertical movement, or if each work unit can be clearly divided, there is a high possibility that it can be used for work management, and the sample should be expanded to include more target occupations in future research.
Second, in the present study, the waist was selected as the most representative part of the acceleration of the body. However, the accuracy of discriminating movements without moving the entire body may be improved by attaching sensors to other body parts, such as the wrist. On the other hand, as the number of sensors increases, the burden on the workers must be considered. Recently, small and lightweight wearable devices, such as smartwatches, can be used to record acceleration. In addition, workers’ movements are continuous and cannot be precisely labeled every second. There is an intermediate time between walking and sitting, although brief, and there is an intermediate movement between walking and standing still. If the worker’s movements are always defined by the superposition of such different movements, an analysis method that assumes the change and continuity of the movements (i.e., when a certain movement starts and ends) will be required in the future, rather than pursuing the correct classification of each second itself. For this purpose, it will be necessary to capture the features of the movement that trigger the action.
Third, in this study, there was repetition in the workers’ work appeared, but this was only a qualitative analysis. As a future study, a quantitative analysis by using time series data analysis methods such as recurrence quantification analysis could be applied. In addition, this study used a simple scatter plot that is easy to visualize the linear discrimination on two axes, but the authors would like to compare it with discrimination by nonlinear clustering or machine learning and apply it on a trial basis.
Conclusion
The present study verified a quantitative work analysis on rebar workers at actual construction sites using the 3-axis acceleration sensor. Our results showed that a certain level of discrimination was possible and the results of discrimination were improved from the previous study. Furthermore, based on the obtained data, we proposed several analysis methods to analyze the characteristics of the work at the construction site, and we analyzed them on a trial basis. Although the number of samples was small, the analysis revealed changes in work activity during the day, the morning, the afternoon, and between breaks. If data acquisition using acceleration sensors continues, it will be easier to acquire and analyze data for large numbers of people over long periods in dark and congested construction sites. Improvements in data analysis methods, promoting data acquisition, and analyzing occupations other than rebar workers are on the horizon.
Data Availability Statement
The raw data supporting the conclusions of this article will be made available by the authors, without undue reservation.
Ethics Statement
The studies involving human participants were reviewed and approved by the Research Ethics Committee, the faculty of engineering, the university of Tokyo. The patients/participants provided their written informed consent to participate in this study.
Author Contributions
All authors listed have made a substantial, direct, and intellectual contribution to the work and approved it for publication.
Funding
The authors declare that this study received funding from Kajima Corp., Obayashi Corp., Shimizu Corp., Taisei Corp., and Takenaka Corp. The funders were not involved in the study design, collection, analysis, data interpretation, the writing of this article, or the decision to submit this paper for publication.
Conflict of Interest
The authors declare that the research was conducted in the absence of any commercial or financial relationships that could be construed as a potential conflict of interest.
Publisher’s Note
All claims expressed in this article are solely those of the authors and do not necessarily represent those of their affiliated organizations, or those of the publisher, the editors and the reviewers. Any product that may be evaluated in this article, or claim that may be made by its manufacturer, is not guaranteed or endorsed by the publisher.
Acknowledgments
We appreciate all the support from the site managers and workers during the survey period.
References
Akhavian, R., and Behzadan, A. H. (2015). Construction Equipment Activity Recognition for Simulation Input Modeling Using mobile Sensors and Machine Learning Classifiers. Adv. Eng. Inform. 29, 867–877. doi:10.1016/j.aei.2015.03.001
Bai, Y., Huan, J., and Kim, S. (2012). Measuring Bridge Construction Efficiency Using the Wireless Real-Time Video Monitoring System. J. Manage. Eng. 28, 120–126. doi:10.1061/(asce)me.1943-5479.0000061
Bouten, C. V. C., Koekkoek, K. T. M., Verduin, M., Kodde, R., and Janssen, J. D. (1997). A Triaxial Accelerometer and Portable Data Processing Unit for the Assessment of Daily Physical Activity. IEEE Trans. Biomed. Eng. 44, 136–147. doi:10.1109/10.554760
Calvetti, D., Meda, P., Chichorro Goncalves, M., and Sousa, H. (2020). Worker 4.0: The Future of Sensored Construction Sites. Buildings (Basel) 10, 169. doi:10.3390/buildings10100169
Cha, S. H., Seo, J., Baek, S. H., and Koo, C. (2018). Towards a Well-Planned, Activity-Based Work Environment: Automated Recognition of Office Activities Using Accelerometers. Building Environ. 144, 86–93. doi:10.1016/j.buildenv.2018.07.051
Cheng, T., Migliaccio, G. C., Teizer, J., and Gatti, U. C. (2013). Data Fusion of Real-Time Location Sensing and Physiological Status Monitoring for Ergonomics Analysis of Construction Workers. J. Comput. Civ. Eng. 27, 320–335. doi:10.1061/(asce)cp.1943-5487.0000222
Cheng, T., Venugopal, M., Teizer, J., and Vela, P. A. (2011). Performance Evaluation of Ultra Wideband Technology for Construction Resource Location Tracking in Harsh Environments. Automation in Construction 20, 1173–1184. doi:10.1016/j.autcon.2011.05.001
Costin, A., Pradhananga, N., and Teizer, J. (2012). Leveraging Passive RFID Technology for Construction Resource Field Mobility and Status Monitoring in a High-Rise Renovation Project. Automation in Construction 24, 1–15. doi:10.1016/j.autcon.2012.02.015
Gatti, U. C., Schneider, S., and Migliaccio, G. C. (2014). Physiological Condition Monitoring of Construction Workers. Automation in Construction 44, 227–233. doi:10.1016/j.autcon.2014.04.013
Godfrey, A., Conway, R., Meagher, D., and ÓLaighin, G. (2008). Direct Measurement of Human Movement by Accelerometry. Med. Eng. Phys. 30, 1364–1386. doi:10.1016/j.medengphy.2008.09.005
Gondo, T., and Miura, R. (2020). Accelerometer-Based Activity Recognition of Workers at Construction Sites. Front. Built Environ. 6, 563353. doi:10.3389/fbuil.2020.563353
Hendelman, D., Miller, K., Baggett, C., Debold, E., and Freedson, P. (2000). Validity of Accelerometry for the Assessment of Moderate Intensity Physical Activity in the Field. Med. Sci. Sports Exerc. 32, S442–S449. doi:10.1097/00005768-200009001-00002
Hwang, S., Seo, J., Jebelli, H., and Lee, S. (2016). Feasibility Analysis of Heart Rate Monitoring of Construction Workers Using a Photoplethysmography (PPG) Sensor Embedded in a Wristband-Type Activity Tracker. Automation in Construction 71, 372–381. doi:10.1016/j.autcon.2016.08.029
Jebelli, H., Ahn, C. R., and Stentz, T. L. (2016). Fall Risk Analysis of Construction Workers Using Inertial Measurement Units: Validating the Usefulness of the Postural Stability Metrics in Construction. Saf. Sci. 84, 161–170. doi:10.1016/j.ssci.2015.12.012
Joshua, L., and Varghese, K. (2011). Accelerometer-Based Activity Recognition in Construction. J. Comput. Civ. Eng. 25, 370–379. doi:10.1061/(asce)cp.1943-5487.0000097
Joshua, L., and Varghese, K. (2014). Automated Recognition of Construction Labour Activity Using Accelerometers in Field Situations. Int. J. Prod. Perform. Manag. 63, 841–862. doi:10.1108/ijppm-05-2013-0099
Kim, C., Son, H., and Kim, C. (2013). Automated Construction Progress Measurement Using a 4D Building Information Model and 3D Data. Automation in Construction 31, 75–82. doi:10.1016/j.autcon.2012.11.041
Kim, K., and Cho, Y. K. (2020). Effective Inertial Sensor Quantity and Locations on a Body for Deep Learning-Based Worker's Motion Recognition. Automation in Construction 113, 103126. doi:10.1016/j.autcon.2020.103126
Kim, S., Yong, B., Luke, H., and Abhinav, B. (2009). “Measuring Construction Productivity Using the Write System,” in Construction Research Congress 2009, Seattle, Washington, April 5–8. doi:10.1061/41020(339)1410.1061/41020(339)14
Labour Force Survey (2020). Available at: https://www.stat.go.jp/data/roudou/(Accessed May 17, 2021).
Lim, J.-S., Song, K.-I., and Lee, H.-L. (2016). Real-Time Location Tracking of Multiple Construction Laborers. Sensors 16, 1869. doi:10.3390/s16111869
Luo, X., Li, H., Cao, D., Yu, Y., Yang, X., and Huang, T. (2018). Towards Efficient and Objective Work Sampling: Recognizing Workers' Activities in Site Surveillance Videos with Two-Stream Convolutional Networks. Automation in Construction 94, 360–370. doi:10.1016/j.autcon.2018.07.011
Mathie, M. J., Coster, A. C. F., Lovell, N. H., and Celler, B. G. (2003). Detection of Daily Physical Activities Using a Triaxial Accelerometer. Med. Biol. Eng. Comput. 41, 296–301. doi:10.1007/bf02348434
Matthews, C. E., Ainsworth, B. E., Thompson, R. W., and Bassett, D. R. (2002). Sources of Variance in Daily Physical Activity Levels as Measured by an Accelerometer. Med. Sci. Sports Exerc. 34, 1376–1381. doi:10.1097/00005768-200208000-00021
Mckinsey Global Institute (2017). Reinventing Construction: A Route to Higher Productivity. Available at: https://www.mckinsey.com/business-functions/operations/our-insights/reinventing-construction-through-a-productivity-revolution (Accessed May 17, 2021).
Moselhi, O., Bardareh, H., and Zhu, Z. (2020). Automated Data Acquisition in Construction with Remote Sensing Technologies. Appl. Sci. 10, 2846. doi:10.3390/app10082846
Navon, R., and Shpatnitsky, Y. (2005). Field Experiments in Automated Monitoring of Road Construction. J. Constr. Eng. Manage. 131, 487–493. doi:10.1061/(asce)0733-9364(2005)131:4(487)
Park, M.-W., and Brilakis, I. (2012). Construction Worker Detection in Video Frames for Initializing Vision Trackers. Automation in Construction 28, 15–25. doi:10.1016/j.autcon.2012.06.001
Paul, B. (2015). Running, Walking, Sitting or Biking? Motion Prediction with Acceleration and Rotationrates. Available at: https://github.com/MechLabEngineering/ActionClassification/blob/master/.ipynb_checkpoints/ClassifyActivity-checkpoint.ipynb (Accessed Oct 13, 2021).
Peddi, A. (2008). Development of Human Pose Analyzing Algorithms for the Determination of Construction Productivity in Real-Time. Lawrence, Kansas: M.S. Level, University of Kansas. 10 June 2008.
Ryu, J., Seo, J., Jebelli, H., and Lee, S. (2019). Automated Action Recognition Using an Accelerometer-Embedded Wristband-Type Activity Tracker. J. Constr. Eng. Manage. 145, 4018114. doi:10.1061/(asce)co.1943-7862.0001579
Sacks, R., Radosavljevic, M., and Barak, R. (2010). Requirements for Building Information Modeling Based Lean Production Management Systems for Construction. Automation in Construction 19, 641–655. doi:10.1016/j.autcon.2010.02.010
Sanhudo, L., Calvetti, D., Martins, J. P., Ramos, N. M. M., Mêda, P., Gonçalves, M. C., et al. (2021). Activity Classification Using Accelerometers and Machine Learning for Complex Construction Worker Activities. J. Building Eng. 35, 102001. doi:10.1016/j.jobe.2020.102001
Sun, S., Zheng, X., Gong, B., García Paredes, J., and Ordieres-Meré, J. (2020). Healthy Operator 4.0: A Human Cyber-Physical System Architecture for Smart Workplaces. Sensors 20, 2011. doi:10.3390/s20072011
Umer, W., Li, H., Lu, W., Szeto, G. P. Y., and Wong, A. Y. L. (2018). Development of a Tool to Monitor Static Balance of Construction Workers for Proactive Fall Safety Management. Automation in Construction 94, 438–448. doi:10.1016/j.autcon.2018.07.024
Valero, E., Sivanathan, A., Bosché, F., and Abdel-Wahab, M. (2017). Analysis of Construction Trade Worker Body Motions Using a Wearable and Wireless Motion Sensor Network. Automation in Construction 83, 48–55. doi:10.1016/j.autcon.2017.08.001
Yang, C.-C., and Hsu, Y.-L. (2010). A Review of Accelerometry-Based Wearable Motion Detectors for Physical Activity Monitoring. Sensors 10, 7772–7788. doi:10.3390/s100807772
Yu, Y., Li, H., Umer, W., Dong, C., Yang, X., Skitmore, M., et al. (2019). Automatic Biomechanical Workload Estimation for Construction Workers by Computer Vision and Smart Insoles. J. Comput. Civ. Eng. 33, 04019010. doi:10.1061/(asce)cp.1943-5487.0000827
Zhao, J., Pikas, E., Seppänen, O., and Peltokorpi, A. (2021). Using Real-Time Indoor Resource Positioning to Track the Progress of Tasks in Construction Sites. Front. Built Environ. 7, 661166. doi:10.3389/fbuil.2021.661166
Zhao, J., Seppänen, O., Peltokorpi, A., Badihi, B., and Olivieri, H. (2019). Real-time Resource Tracking for Analyzing Value-Adding Time in Construction. Automation in Construction 104, 52–65. doi:10.1016/j.autcon.2019.04.003
Zheng, X., Wang, M., and Ordieres-Meré, J. (2018). Comparison of Data Preprocessing Approaches for Applying Deep Learning to Human Activity Recognition in the Context of Industry 4.0. Sensors 18, 2146. doi:10.3390/s18072146
Keywords: accelerometer, construction sites, workers, motion, discrimination, rebar, heat map
Citation: Akaki T and Gondo T (2021) Rebar Worker Analysis Using a 3-Axis Accelerometer. Front. Built Environ. 7:721742. doi: 10.3389/fbuil.2021.721742
Received: 07 June 2021; Accepted: 17 November 2021;
Published: 03 December 2021.
Edited by:
Olli Seppänen, Aalto University, FinlandReviewed by:
Yihai Fang, Monash University, AustraliaAdel Francis, École de Technologie Supérieure (ÉTS), Canada
Joaquín Ordieres Meré, Polytechnic University of Madrid, Spain
Copyright © 2021 Akaki and Gondo. This is an open-access article distributed under the terms of the Creative Commons Attribution License (CC BY). The use, distribution or reproduction in other forums is permitted, provided the original author(s) and the copyright owner(s) are credited and that the original publication in this journal is cited, in accordance with accepted academic practice. No use, distribution or reproduction is permitted which does not comply with these terms.
*Correspondence: Tomoyuki Gondo, Z29uZG9AYXJjaDEudC51LXRva3lvLmFjLmpw