 Jamal Al-Qawasmi
 Muhammad Saeed
 Omar S. Asfour
 Adel S. Aldosary4
- 1Architecture Department, King Fahd University of Petroleum and Minerals, Dhahran, Saudi Arabia
- 2Architecture Engineering Department, Middle East University, Amman, Jordan
- 3Department of Global and Social Studies, King Fahd University of Petroleum and Minerals, Dhahran, Saudi Arabia
- 4Department of City and Regional Planning, King Fahd University of Petroleum and Minerals, Dhahran, Saudi Arabia
Urban quality of life (QOL) is a complex and multidimensional concept. A wide range of urban QOL assessment tools has been developed worldwide to measure and monitor the quality of urban life taking into account the particular conditions of cities/regions and the needs of their residents. This study aims to develop an urban QOL assessment tool appropriate for the context of Saudi Arabia (SA). For this purpose, this study developed and used a structured approach that consists of an in-depth analysis of 21 urban QOL assessment tools in use worldwide, combined with focus group analysis and feedback from a panel of experts. The results revealed that there is a lack of consensus among the existing tools regarding the usage of QOL indicators and domains, and that the majority of the tools demonstrate a lack of proper coverage of QOL subdomains. The results also show wide variations in the number of indicators used and that most of the examined tools are using objective measurable indicators. This study has identified 67 indicators distributed across 13 domains that constitute the core criteria of the proposed QOL assessment tool. The selected indicators and domains cover all the attributes of urban QOL and are evaluated by experts as important criteria to assess/measure QOL. Moreover, the results demonstrate the advantage of the developed framework and comprehensive list of criteria (CLC) as a structured and efficient approach to design better QOL assessment tools.
Introduction
Although quality of life (QOL) has been investigated extensively in the past few decades, QOL as a discipline is still embryonic (Friedman, 1997). The literature points out that QOL is still an obscured, amorphous, and contested concept (Prutkin and Feinstein, 2002; Schalock, 2004; Al-Qawasmi, 2019). However, there is agreement among researchers that QOL is a multidimensional construct that comprises subjective and objective dimensions which cover various aspects of life experience (McCrea et al. 2006; Lora et al. 2010; Von Wirth et al. 2015; Al-Qawasmi, 2020). Urban QOL can be defined as the general well-being of people and societies living in cities and the quality of the environment in which they live (Slavuj, 2011; Al-Qawasmi, 2020). From this perspective, urban QOL embodies both objective attributes (extraneous environmental and place attributes) and subjective attributes (individual insights and perception of the material and nonmaterial conditions). Subjective perception of the QOL is important because many crucial sides of people’s lives, such as the quality of the urban environment, feelings of security or social solidarity, sentimental attachment, and the quality of neighborhood relationships, are hard to measure through objective indicators (Lora et al. 2010). However, many studies have criticized the use of subjective indicators of QOL as being unreliable and in many cases misleading because respondents tend to have lack of information, specific cultural manifestation of reality and biases, habitual differences, and variance in aspiration factor (Lora et al. 2010).
Although the literature reveals a lack of agreement on the definition of QOL, it is easy to identify a general procedure adopted by the existing QOL assessment tools to assess and measure QOL. Indicator-based assessment tools are the most common method to measure/assess urban QOL (Delhey et al. 2002; Pacione, 2003; Al-Qawasmi, 2019). Typically, these tools assess/quantify the various attributes of life quality using sets of measurable variables (called indicators) organized in a hierarchical structure under domains and subdomains. QOL indicators are usually categorized into groups that represent the various themes/categories of QOL attributes being assessed or measured. These thematic groups of QOL indicators are usually called QOL domains. Each domain is composed of a set of related QOL indicators that are unique and distinct from those under other domains (Hagerty et al. 2001; Pacione, 2003; Al-Qawasmi, 2020). The QOL indicators, domains, and subdomains are usually related/linked together in hierarchical levels by a conceptual framework/model. The various QOL domains and subdomains are usually categorized under three QOL core dimensions: social, environmental, and economic (Streimikiene, 2015; Al-Qawasmi, 2019).
It is well established that the socioeconomic development plans and activities of local and central governments are materialized and manifested mainly in cities. Thus, there is growing interest in developing metrics and tools to monitor and assess QOL in these cities and evaluate the efficiency of the deployed social and economic development policies and their impact on people. Several assessment tools have been developed and used for assessing and measuring urban QOL in various regions/countries worldwide (Hagerty et al. 2001; Al-Qawasmi, 2019; Al-Qawasmi, 2020). Most of these assessment tools utilize a set of QOL criteria (i.e., indicators, domains, and subdomains) that quantify the various attributes of urban QOL (Swain and Hollar, 2003; Al-Qawasmi, 2019; Al-Qawasmi, 2020). The literature points out that QOL is a complex and multidimensional concept (see Kreitler and Kreitler, 2006; Lora et al. 2010; Potter et al. 2012; Von Wirth et al. 2015; Al-Qawasmi, 2019); thus, an inclusive and multidimensional tool is needed to capture its various dimensions. Many studies have criticized the existing tools for not being able to comprehensively assess/measure urban QOL.
Ample of research has examined and identified various conditions and criteria to guide the process of selecting sets of QOL indicators appropriate for a specific context (Button, 2002). However, despite all these efforts, there is still no consensus on what constitutes an appropriate set of indicators/domains for urban QOL or how to select such a set of indicators. The process of selecting appropriate QOL criteria is still highly debatable, arbitrary, and subjective (Jones and Riseborough, 2002; Schalock, 2004; Powell and Sanguinetti, 2010). The literature also underscored the lack of and need for a systematic and well-structured approach to design and develop theory-based, multidimensional QOL assessment tools (Kaklauskas et al. 2018; Al-Qawasmi, 2019). This study intends to bridge this gap in the literature through developing and utilizing a structured approach to develop a theory-based, multidimensional urban QOL assessment tool appropriate for SA cities. The data presented in this study are part of an ongoing research project titled “Develop a Tool to Assess and Monitor Urban Quality of Life in Saudi Arabia cities.”
Methodologically, there are two broad approaches to select QOL criteria (i.e., indicators and domains): the top-bottom (also called expert-driven) approach and the bottom-up approach. In the top-bottom approach, the selection of QOL criteria is usually based on a consensus process among a panel of experts equipped with rich information and experiences in the field (Chamaret et al. 2007; Khadka and Vacik, 2012; Musa et al. 2019). Feedback from experts is usually collected using surveys, interviews, or Delphi methods (Okoli and Pawlowski, 2004; Musa et al. 2019). The bottom-up approach, on the other hand, depends on the direct involvement of ordinary people from local communities (Chamaret et al. 2007). Feedback of local people/citizens on the attributes and aspects that affect their perception of quality of life is sought through surveys and/or other methods (Chamaret et al. 2007). The bottom-up approach suffers from several limitations such as subjectivity and lack of information/expertise of the participants which may result in a limited range of indicators. Due to the inherent complexity and multidimensionality of the QOL concept and the various limitations and difficulties associated with using the bottom-up approach, this study adopted the top-bottom, expert-driven approach.
Methodology
To develop a QOL assessment tool appropriate for the urban context of Saudi Arabia (SA), this study adopted a structured multimethod approach as outlined in Figure 1. The research method consists of five stages: 1) Select and analyze a sample of well-known urban QOL assessment tools to examine their structure in terms of indicators, domains, and subdomain and to identify key practices across these tools; 2) develop a theory-based framework that links/relates the various QOL criteria (i.e., indicators, domains, and subdomains) and ensures comprehensive coverage of all the attributes of urban QOL; 3) based on the framework developed in stage 2, develop a comprehensive list of QOL criteria (CLC) to provide a structured framework to guide the selection of a comprehensive list of indicators out of an extensive pool of indicators extracted from the 21 QOL tools; 4) based on a set of selection criteria, select a set of potential QOL indicators and their domains that are appropriate for the Saudi context and provide a comprehensive coverage of all the QOL attributes; and 5) based on the results of stage 4, establish a set of QOL indicators, their domains, and subdomains based on feedback from a panel of experts using an online survey.
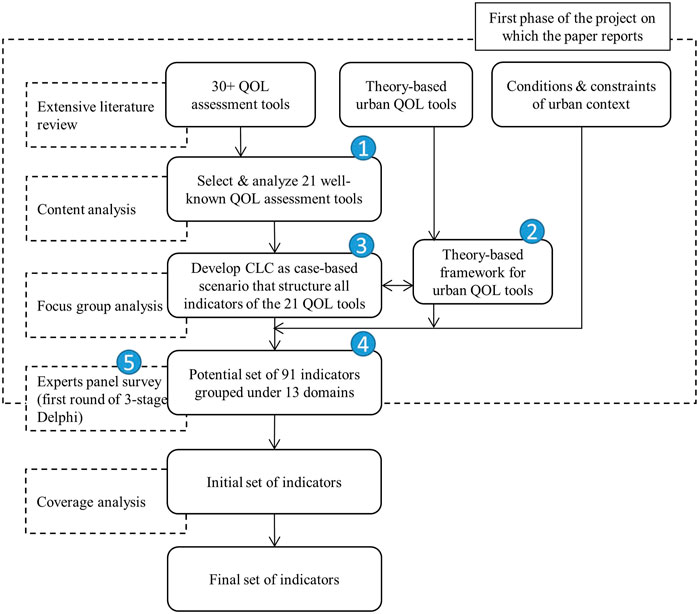
FIGURE 1. The multi-method research approach of the study.
The Sample of Urban QOL Assessment Tools
A sample of well-known urban QOL assessment tools has been selected for an in-depth analysis to identify the essential QOL criteria (indicators, domains, and subdomains) for potential use in the new tool being developed. The aim is to consolidate the strengths and best practices of these tools into a new QOL assessment tool for SA. The aim is to build on best practices, successes, and strengths of the existing QOL assessment tools, instead of starting from scratch.
An extensive review of the literature has been conducted to identify major urban QOL assessment tools for an in-depth analysis. Over 30 urban QOL assessment tools in use worldwide were identified, of which 21 well-established tools have been selected for the analysis. Purposive sampling has been used to select the set of tools to be analyzed. In purposive sampling, also called judgment sampling, the researchers by virtue of their judgment, knowledge, and experience select the appropriate sample for analysis (Tongco, 2007). Purposive sampling is used for the identification and selection of information-rich cases highly relevant to the phenomenon being investigated (Tongco, 2007; Palinkas et al. 2015). Using purposive sampling, the following criteria were used to select a sample of urban QOL assessment tools for analysis in this study: 1) It is a real-world tool in actual use rather than a proposed application as part of a research project; from this perspective, the tool has to be in use in real life with data collected and analyzed; 2) the tool was developed by specialized professionals using a set of guidelines in consultation with relevant stakeholders; 3) the selected set of tools should cover a range of regions across most continents of the world; and 4) the selected set of tools should cover the wide range of existing urban QOL assessment tools available (i.e., tools to assess QOL in one city vs. more than one city, or in one country vs. more).
Developing a Conceptual Model/Framework of Urban QOL
To develop a theory-based QOL assessment tool, the research team has developed a conceptual framework of urban QOL that takes into consideration the existing theory in the field of QOL. This framework links/relates the various QOL indicators, domains, and subdomains in a hierarchical structure and ensures the comprehensive coverage of all the aspects of urban QOL in light of the existing literature. The proposed theory-based framework is developed based on an extensive literature review including the in-depth analysis of the examined QOL assessment tools. According to this framework, urban QOL is conceptualized as composed of three hierarchy levels: core dimensions of QOL, QOL domains/subdomains, and QOL indicators, as depicted in Figure 2. This conceptual framework is adopted because there is a degree of consensus on it in the literature in the fields of urban QOL and urban sustainability (Flynn et al. 2002; Marans, 2015; Turkoglu, 2015; Al-Qawasmi, 2019). In this literature, urban QOL is conceptualized as composed of a wide range of attributes grouped into domains and subdomains that span three broad dimensions: environmental, social, and economic (Streimikiene, 2015; Al-Qawasmi, 2019).
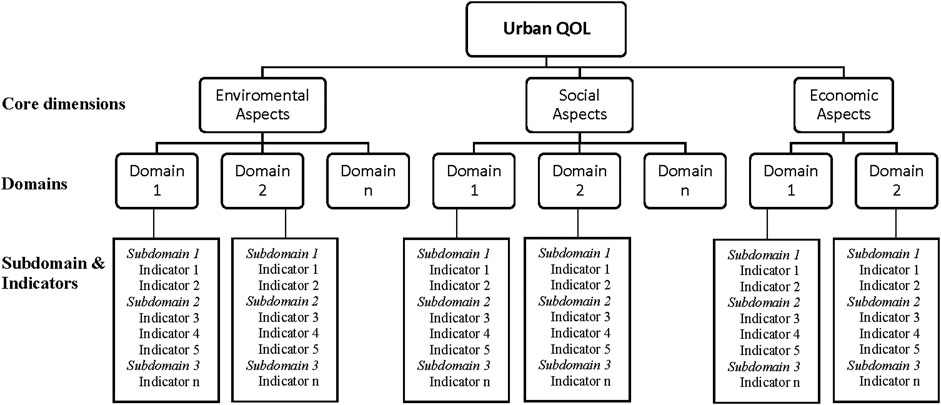
FIGURE 2. Conceptual framework of an urban QOL assessment tool.
Developing the Comprehensive List of Criteria and Using It as a Base-Case Scenario
Developing the Comprehensive List of Criteria
Based on the conceptual framework developed in the Section Developing a Conceptual Model/Framework of Urban QOL, the team developed what is called the comprehensive list of criteria (CLC) of urban QOL. The CLC is a comprehensive list of all the unique indicators extracted from the examined 21 assessment tools. As such, theoretically, the CLC provides a comprehensive list of indicators that cover all the aspects of urban QOL. The aim of compiling the CLC is to establish a base-case scenario to assess the level of coverage of QOL criteria/attributes in each assessment tool and in the new tool being developed. The CLC was formed as follows: First, based on an extensive literature review on urban QOL, existing QOL assessment tools, and the in-depth analysis of the examined QOL assessment tools, 19 QOL domains and 87 subdomains that cover all the aspects of urban QOL were identified as the core criteria of the CLC, as presented in the Analysis and Results section. These domains and subdomains are distinctive QOL attributes that cover all the aspects of the three core dimensions of urban QOL (i.e., social, environmental, and economic). Second, the identified 19 domains and 87 subdomains of the CLC are arranged in a hierarchical structure as per the conceptual framework/model developed earlier in the Section Developing a Conceptual Model/Framework of Urban QOL to ensure comprehensive coverage as per the exiting literature in the field. Third, the domains and subdomains of the CLC are checked for integrity using various content analysis sessions and finally through coverage analysis conducted for the 21 assessment tools as explained in the section Coverage Analysis. If the CLC is an appropriate and comprehensive base-case scenario, then the indicators of any examined tool should fit and comply with the CLC criteria. Details of the integrity check is outlined in this study and detailed in Al-Qawasmi (2019). Fourth, the indicators of the CLC were extracted from the examined 21 urban QOL assessment tools. Although a total of 1016 indicators were identified in the examined tools, only 803 unique indicators that assess distinctive QOL aspects are included in the CLC. Indicators in different tools are often operationalized and measured differently; thus, a specific procedure was used to check the uniqueness of indicators for the inclusion in the CLC. This procedure has been described in detail in another publication (Al-Qawasmi, 2019). Extracted from 21 QOL tools and structured according to the existing theory in the QOL literature, the developed CLC represents a list of consensual QOL criteria that provide comprehensive coverage of all the attributes of urban QOL. The CLC will be used later as a base-case scenario to 1) guide the selection of a potential list of indicators for the new tool under development and 2) check the comprehensive coverage of the indicators of the new tool through conducting coverage analysis that aims to evaluate the level to which the tool covers the various criteria of CLC as a comprehensive base-case, as per indicators’ selection criteria numbers 2 and 3 listed in the section Selection of Potential List of QOL Indicators.
Coverage Analysis
To better understand the structure of the examined QOL tools and the extensive number of indicators they include (i.e., 1016 indicators) and to ensure the selection of an appropriate and comprehensive list of QOL indicators for the new tool being developed, a coverage analysis is conducted using the coverage analysis approach developed by Al-Qawasmi (2019). In the coverage analysis, each one of the assessment tools is analyzed and examined against the criteria of the CLC to determine the level of its compliance with the CLC, that is, the extent to which the indicators, domains, and subdomains of the CLC are included (literally or using similar terms) in each tool. The coverage analysis is conducted at two levels/phases: 1) during the development of the CLC to check its integrity through examining and assessing the level of coverage of each one of the examined QOL tools, as explained earlier in the section Developing the Comprehensive List of Criteria, and 2) during the design and the development of the new assessment tool to ensure that the selected indicators for the tool provide comprehensive coverage for all the QOL attributes as defined by the CLC as a base-case scenario.
Selection of Potential List of QOL Indicators
The results of the coverage analysis are used to select a set of potential QOL criteria (indicators, domains, and subdomains) for the new tool being developed to ensure the comprehensive coverage of all the QOL attributes. The CLC has enabled us to restructure and present the QOL criteria of the 21 examined tools in a comprehensive, theory-based model. The focus group used the predefined selection criteria to identify potential indicators for inclusion in the new assessment tool from the comprehensive list of criteria (CLC). The selection criteria include the following: 1) The indicators should match the conditions, constraints, and needs of the SA urban context; 2) the indicators should cover all the QOL domains and subdomains listed in the CLC to ensure a theory-based assessment tool; and 3) priority is given to indicators and domains that are more frequently used in the existing tools, given that they met the above two conditions. These conditions are intended to ensure that the selected potential indicators are appropriate for the SA urban context and provide comprehensive coverage of all the QOL domains.
Expert Panel and the Online Survey
A panel of 92 experts participated in an online survey to select a set of QOL indicators and domains appropriate for the SA cities. The expert panel has been provided with a list of 91 potential QOL indicators extracted from the examined 21 QOL assessment tools in the previous stage. By using the potential set of indicators that follow the proposed CLC as input for the survey, we have implicitly incorporated the comprehensive theoretical framework of QOL underlying the CLC. The survey was designed to solicit the opinion of local expert groups on the relative importance of 91 potential QOL indicators selected for the SA context. Among other questions, participants were asked to rate the importance of each indicator for assessing urban QOL in SA cities on a 7-point Likert scale that ranges from extremely unimportant to extremely important. Participants were given the chance to add, exclude, or modify the provided list of potential indicators and domains.
This part of the research project is designed as an online survey-based Delphi procedure. However, this study reports on the results of the first phase of the online survey. Although representative sampling is not required in the Delphi method, the literature underscores the need to select a panel of experts who are knowledgeable and have enough experience in the field (Okoli and Pawlowski, 2004; Hsu and Sandford, 2007; Musa et al. 2019). Many studies in various fields have used survey-based Delphi techniques in selecting sets of relevant indicators (Loukaitou-Sideris, 2000; Musa et al. 2019; Abreu and Mesias, 2020). Accordingly, we included three groups of experts in the study: academicians, policy- and decision-makers (municipal level), and practicing professionals (architects and engineers). Participants have at least 7 years of experience in the area of urban QOL or its major domains, and have lived for at least 5 years in one or more of the three large cities of SA: Riyadh, Jeddah, and Dammam. Potential participants were invited through an invitation email to several email lists, including mailing lists extracted from websites of relevant entities in SA such as universities, planning departments, municipalities and local governments, NGOs, and Saudi Council of Engineers, among others. An invitation email was sent to 397 potential experts to participate. Over 100 responded, of whom 92 are included in the analysis.
Analysis and Results
Results of Analyzing the Selected Sample of QOL Assessment Tools
Characteristics of Examined Tools
The basic characteristics of the analyzed urban QOL assessment tools are summarized in Table 1. The 21 examined tools are real-life QOL assessment applications in use during the past 10 years as reflected in the version of the tools, as shown in Table 1. Each tool is used to assess QOL in one or more cities/metropolitan areas. While most of the analyzed tools (n = 14) are used to assess QOL in a single city, the rest of the tools are used to assess QOL in several cities at the national (n = 1), subnational (n = 4), or international (n = 2) levels. For the tools used to monitor and assess QOL at one city, the population size of these cities ranges between 100,000 and around 10 million.
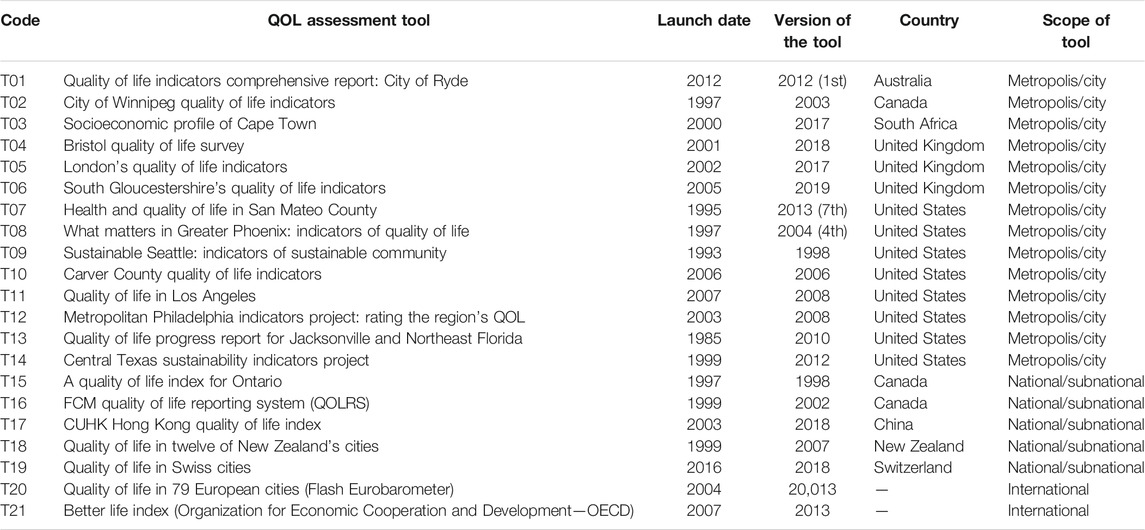
TABLE 1. Summary of the examined 21 urban QOL assessment tools.
The Analysis of Examined Tools
The 21 tools were analyzed to examine their structure in terms of QOL indicators, domains, and subdomains. The results of the analysis are presented in Tables 2–5, and some aspects of the data in these tables are also highlighted in Figures 3–6.
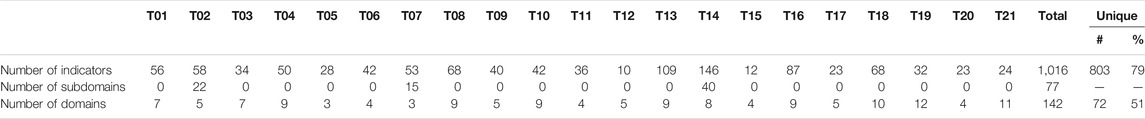
TABLE 2. Number of QOL indicators, domains, and subdomains in the examined tools.
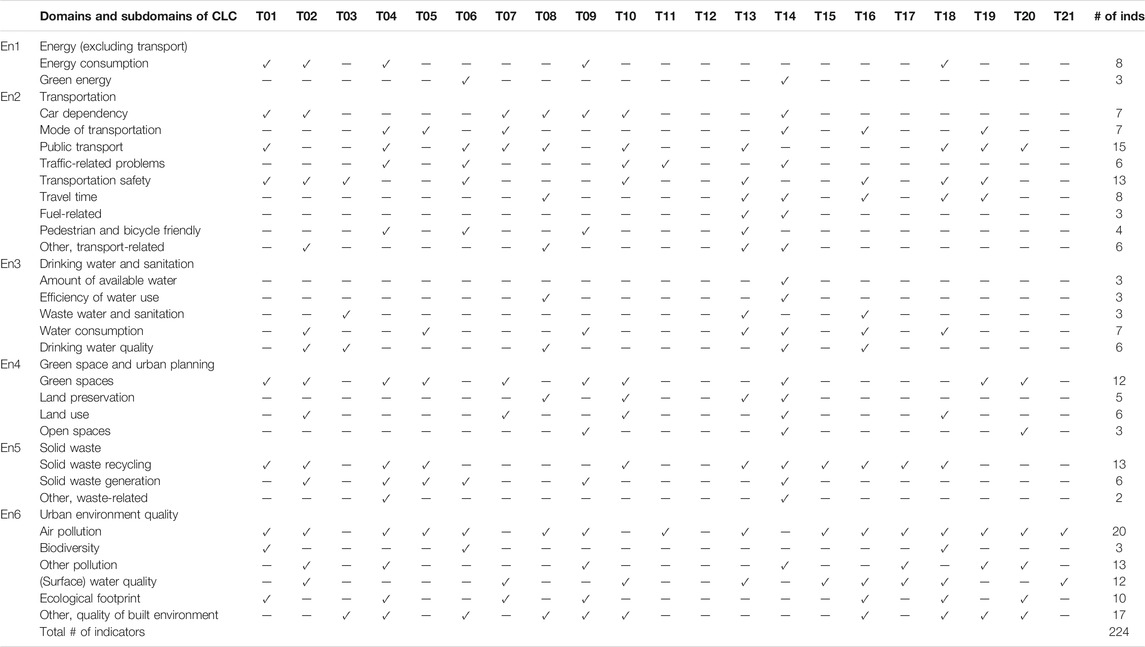
TABLE 3. Coverage analysis of the 21 tools relative to QOL CLC–environment-related criteria.
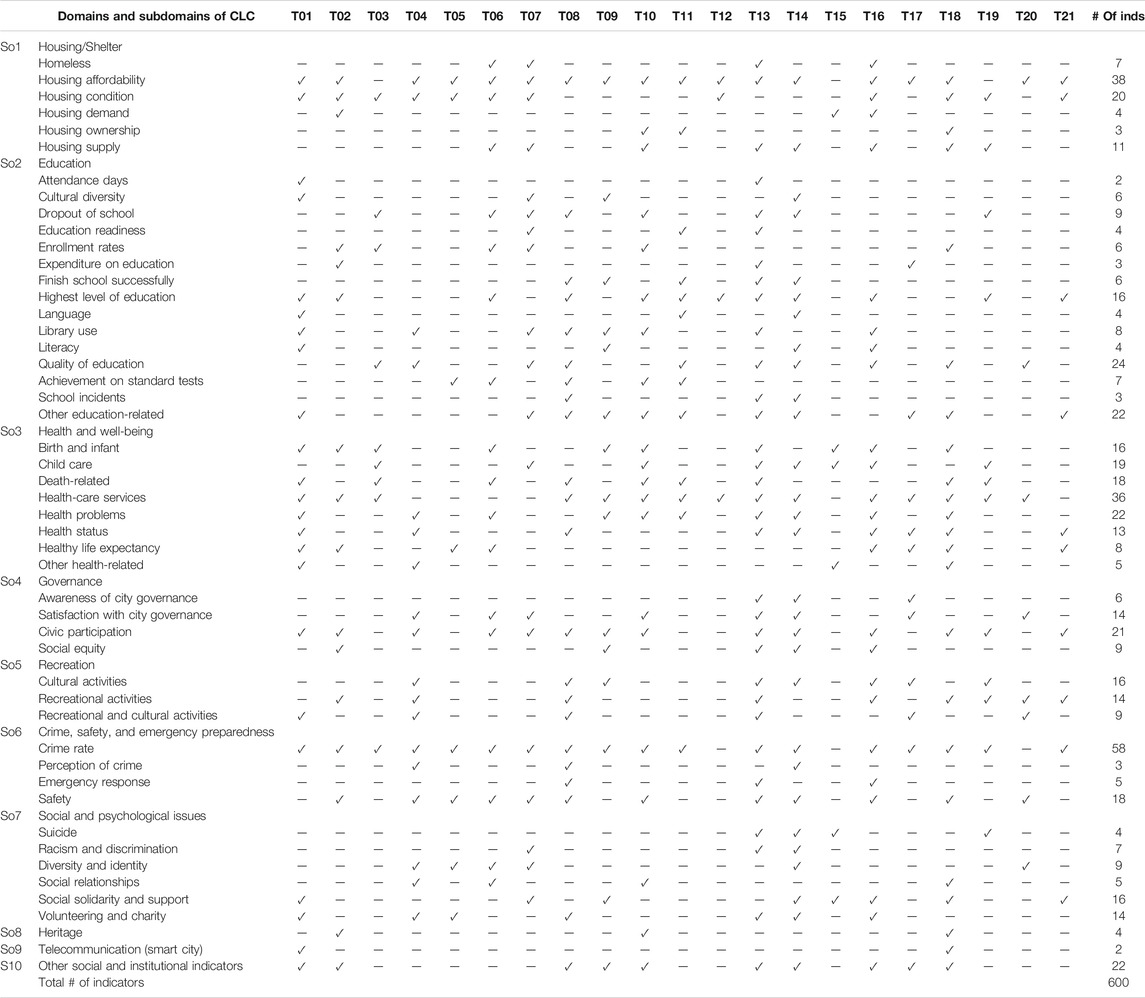
TABLE 4. Coverage analysis of the 21 tools relative to QOL CLC–social-related criteria.
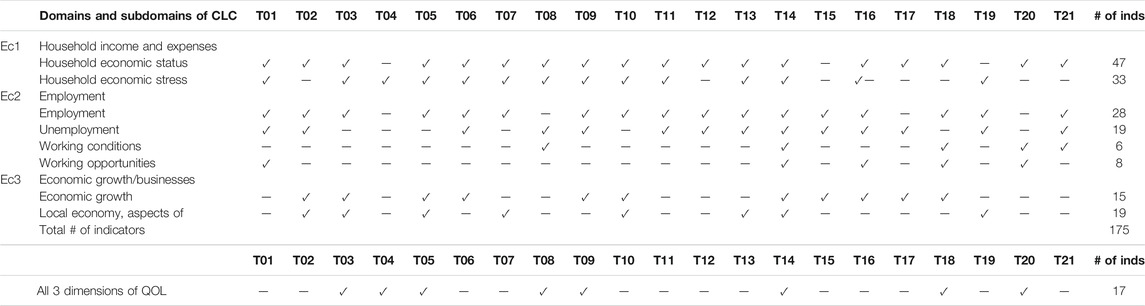
TABLE 5. Coverage analysis of the 21 tools relative to QOL CLC—economic-related criteria.
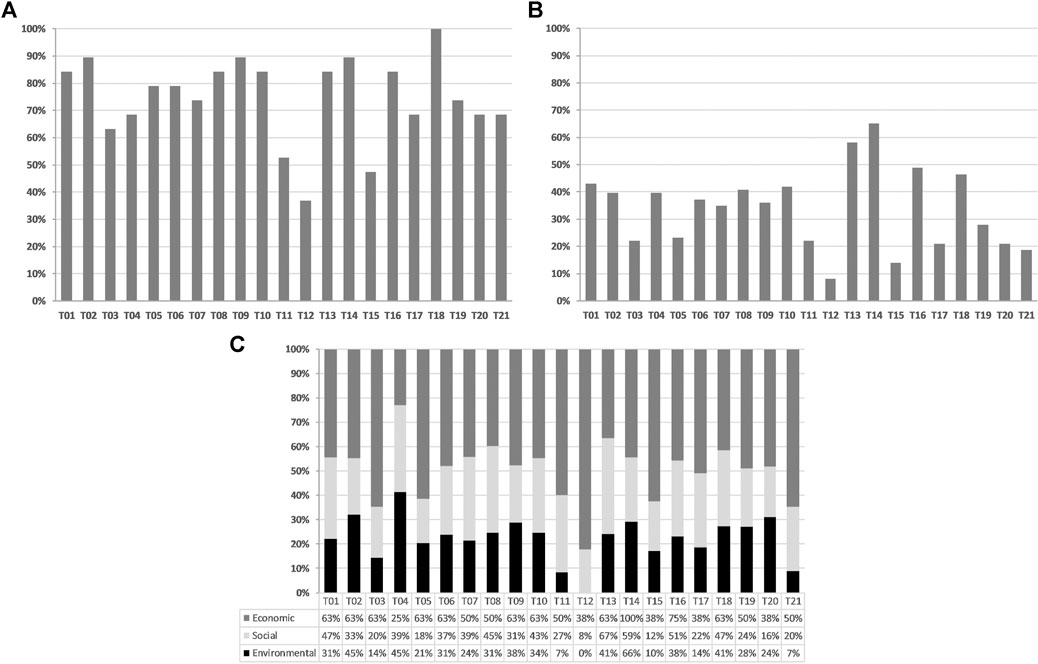
FIGURE 3. Coverage analysis: coverage of domains and subdomains in examined tools. (A) Percentage of domains included in each tool relative to CLC domains, (B) percentage of subdomains included in each tool relative to CLC subdomains, (C) percentage of subdomains included in each core dimension of QOL (bar height is normalized for ease of comparison).
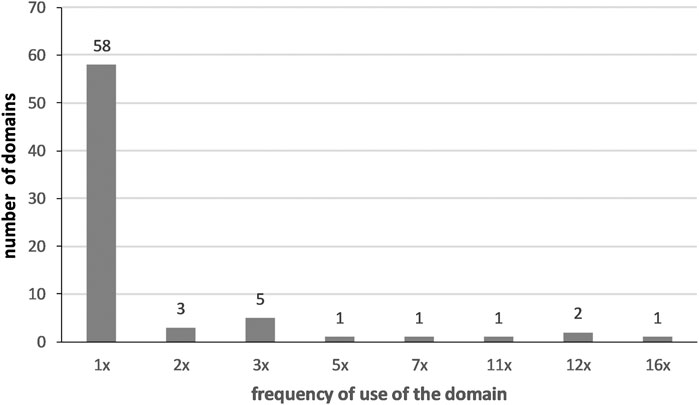
FIGURE 4. Frequency of use of the 72 unique QOL domains (1x, 2x, 3x, … nx = the domain is used in 1, 2, 3, … n tools).

FIGURE 5. List of most frequently used domains in the examined tools and their usage frequency (i.e., number of tools in which a domain is used).
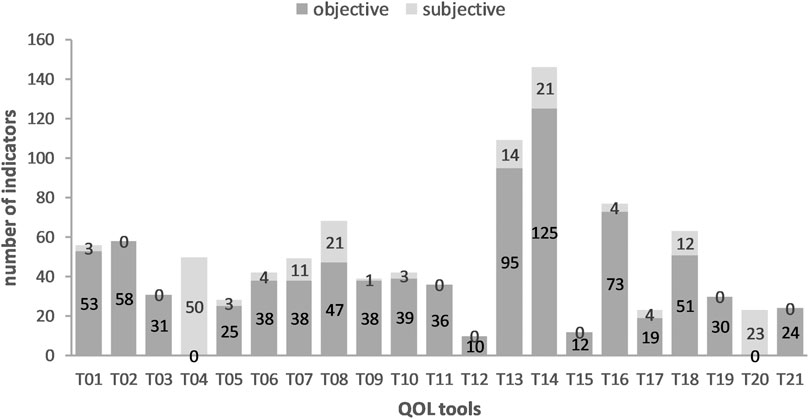
FIGURE 6. Structure of the examined tools: objective vs. subjective.
Table 2 presents a summary of the number of QOL indicators, domains, and subdomains found in the examined assessment tools. As shown in Table 2, the tools contain a total of 1,041 indicators, of which 25 are demographic statistics. Since our study focuses on indicators strictly intended to measure urban QOL, the 25 demographic-related indicators are excluded; thus, only 1016 QOL indicators are included in the analysis.
Tables 3–5 and Figure 3 present the results of the coverage analysis of the examined tools relative to the comprehensive list of criteria (CLC). As shown in Tables 3–5, the coverage analysis is conducted as follows: First, the criteria of the CLC (i.e., 19 domains and 87 subdomains) were listed in the leftmost column of the table; then, for each examined tool (which is listed at the top row of the table), the indicators were mapped to respective domains and subdomains of CLC; and finally, each individual tool, including the tool under development, was evaluated to determine to which level it covers the various domains and subdomains of the CLC as a comprehensive base-case scenario of a QOL tool. In Tables 3–5, the assessment tool that includes indicators, literally or using similar terms, in specific CLC domain/subdomain is denoted by “√,” while the tool that did not include indicators in any CLC domain/subdomain is denoted by “—.” For instance, Table 3 shows that the “green spaces” subdomain is denoted by “√” placed opposite to assessment tool “T05” and by “—” placed opposite to tool “T06,” which means that the assessment tool “T05” includes indicator(s) that assess “green spaces,” while the tool “T06” does not.
The 1,016 indicators extracted from the 21 tools were mapped to the various QOL domains and subdomains of the CLC.
Figure 3 illustrates some of the results of the coverage analysis. In Figure 3A, the height of the bar segment represents the percentage of CLC domains covered in each assessment tool, while the 100% represents full coverage of all the CLC domains. In Figure 3B, the bar height represents the percentage of CLC subdomains covered in each tool, while the 100% represents the full coverage of all the CLC subdomains. In Figure 3C, the height of the bar segment represents the percentage of CLC subdomains covered by each tool categorized according to three core dimensions of urban QOL, while the 100% represents the total number of subdomains covered by the indicators in each tool.
Figures 4, 5, in addition to Table 2, show the frequency of using various QOL indicators and domains across various assessment tools. As shown in Table 2 and Figure 4, in total, 80.6% of the unique domains (58 out of 72 unique domains) are used in only one tool. Only six unique domains (out of 72 unique domains) are used in five or more tools. On the other hand, Table 2 shows that 89.5% of the unique indicators (719 out of 803 unique indicators) are used in only one tool. Only 84 unique indicators (out of 803 unique indicators) are used in two or more tools. Figure 5 presents a list of most frequently used domains in the examined tools, while Figure 6 presents the composition of the various examined tools in terms of objective vs. subjective indicators.
The Proposed QOL Assessment Tool and Feedback of Experts
Figure 2 outlines the proposed conceptual framework of the urban QOL assessment tool. In this framework, urban QOL is conceptualized as composed of three hierarchy levels: core dimensions, domains/subdomains, and indicators of QOL.
The domains and subdomains of the comprehensive list of criteria (CLC) have been developed based on the hierarchical structure of this QOL framework/model to ensure comprehensive coverage of all the attributes of urban QOL as per the exiting literature. The CLC has enabled the team to restructure and present the QOL criteria—indicators, domains, and subdomains—of the examined tools in a comprehensive, theory-based model, as shown in Tables 3–5. Based on the three selection criteria specified in the Methodology section, the research team through several focus group meetings selected a potential set of 91 indicators grouped under 13 domains, as presented in Figure 7. The adopted selection criteria ensured that the selected potential list of indicators are appropriate for the SA context, cover all the aspects of QOL as defined in the CLC base-case, and follow the proposed theory-based framework of urban QOL. The distribution of the potential 91 indicators across CLC domains and subdomains is depicted in Supplementary Tables S1–S3 along with other examined tools for the ease of comparison. The three Supplementary Tables S1–S3 show how the list of selected potential indicators provides comprehensive coverage of almost all the domains/subdomains of the CLC.
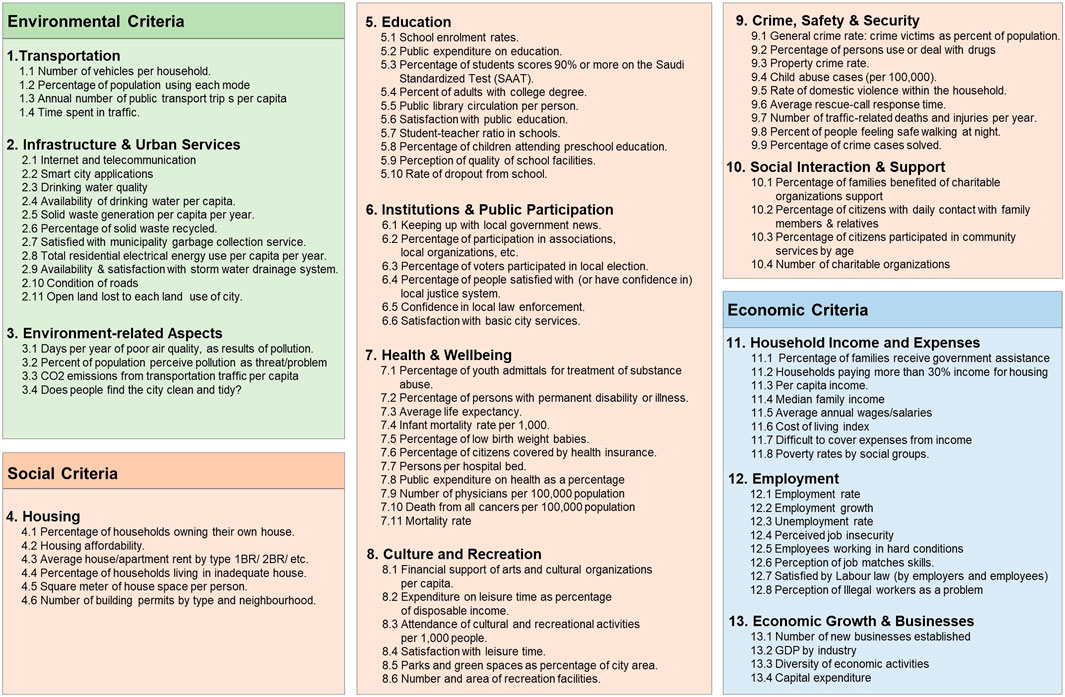
FIGURE 7. Potential list of QOL indicators and domains selected based on CLC.
To establish the final set of indicators and domains for the proposed tool, a panel of local experts reviewed and evaluated the set of potential indicators and the domains that join them. The experts were asked to rate the importance of each indicator and domain for assessing urban QOL in the SA context on a 7-point Likert scale ranging from “unimportant at all” to 7 = “very important.” Tables 6,7 present the answers given by the experts on the importance of the potential 91 indicators and 13 domains, and the analysis of the consensus on the level of importance.
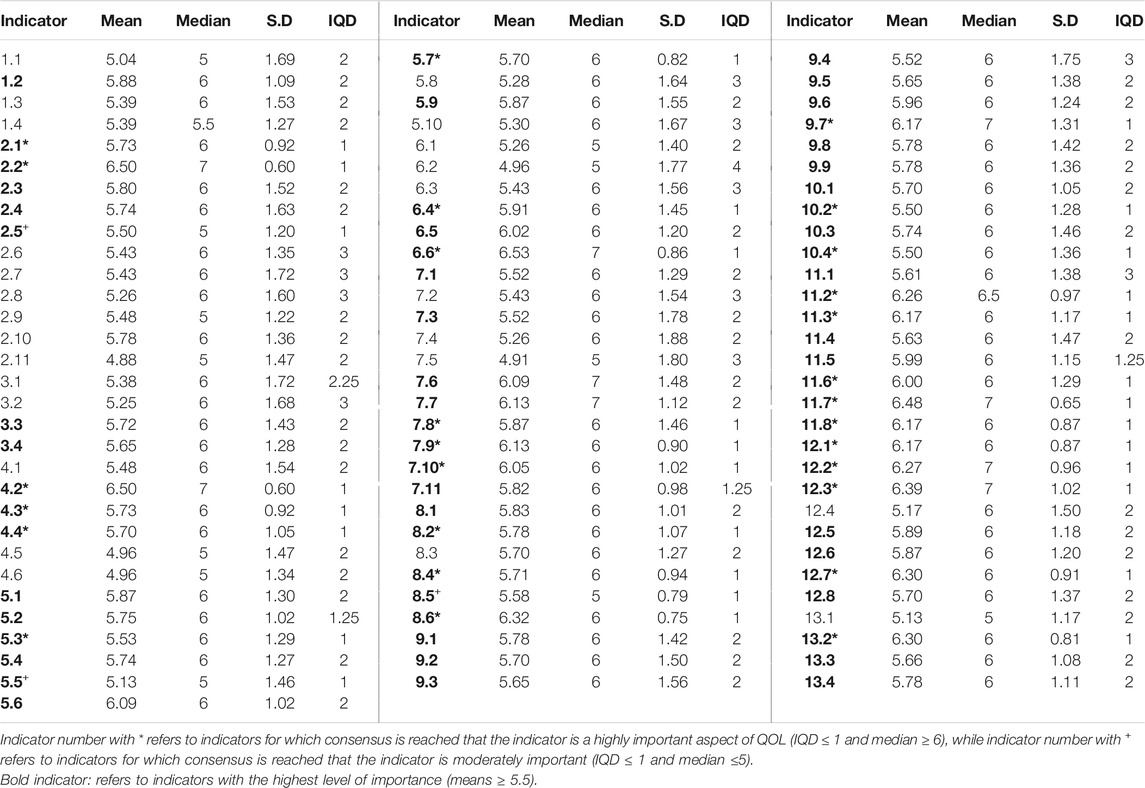
TABLE 6. Rating of the importance of the 91 indicators and the consensus level.
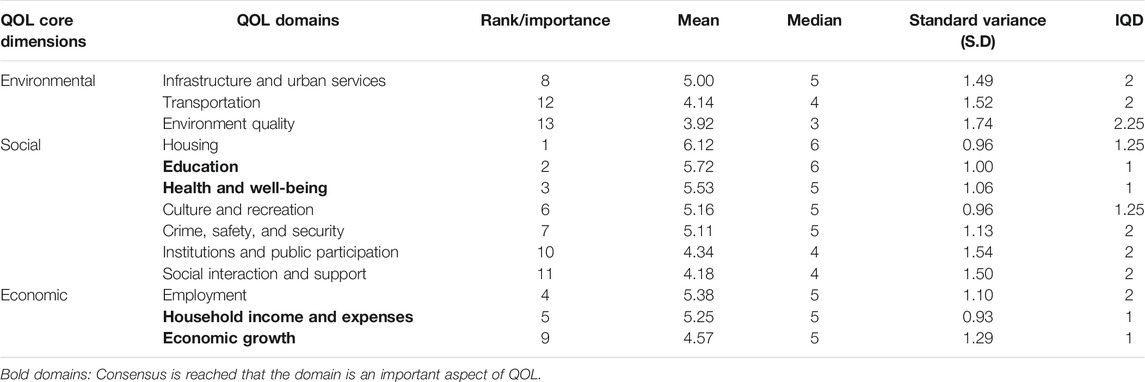
TABLE 7. Rating of the importance of the 13 domains and the consensus level.
Median and interquartile deviation (IQD) scores were used to determine the level of consensus/agreement on the importance of an indicator or domain. Median was used instead of mean because mean is more sensitive to extreme values and is thus less appropriate to determine the presence of consensus (Hsu and Sandford 2007). IQDs are commonly used to determine consensus, with a smaller IQD indicating larger consensus (De Meyrick 2003; Hsu and Sandford 2007). An IQD ≤ 1 is considered an indication of good consensus on a 7-point Likert scale (Brouwer et al. 2008). We classified three cases regarding the agreement and consensus of the expert panel: 1) consensus that an indicator/domain is highly important (IQD ≤ 1 and median ≥ 6); 2) consensus that an indicator/domain is less or moderately important (IQD ≤ 1 and median ≤ 5); and 3) no consensus is reached that an indicator/domain is important (IQD > 1).
Findings and Discussion
This study aims to develop an urban QOL assessment tool appropriate for SA using a structured approach. Analyzing a sample of 21 tools resulted in several findings that have direct implications on developing QOL assessment tools. Findings related to lessons learned from analyzing the 21 tools and their implications for developing the proposed tool will be discussed first, followed by the results related to the proposed QOL tool.
Lessons Learned From Analyzing Tools
Number of Indicators
The results show wide variations in the number of used indicators across examined QOL assessment tools. Although the CLC includes 803 unique indicators (out of 1016 total number of indicators), only a very small number of these indicators are used in each tool. As shown in Table 2, the number of indicators used in a tool varies between 10 and 146.
Optimal Number of Indicators
The wide variation in the number of indicators used makes it difficult to decide on the optimal number of indicators to adopt in a new QOL assessment tool under development. Using 10–25 indicators, as found in T12, T15, and other tools, is very low and thus the ability of such tools to reliably and comprehensively assess urban QOL is greatly questionable. On the other hand, 146 indicators seem on the high end for many municipalities. The result of this analysis does not provide a solid conclusion regarding the optimal number of indicators to be used in a QOL assessment tool. More work is needed to develop an approach that facilitates the selection of a minimal number of indicators that can reliably assess all the attributes of QOL. Several studies have pointed out the need for such an approach and the challenges facing such an attempt (Al-Qawasmi, 2019).
Type of Indicators: Objective vs. Subjective
Results show that most of the examined tools are using objective measurable indicators. As shown in Figure 6, only two tools (i.e., T04 and T20) are limited exclusively to subjective indicators. The rest of the tools are either using only objective indicators (7 tools) or using mainly objective indicators combined with a limited number of subjective indicators in varying proportions (12 tools). This finding may suggest a direction toward the type of indicators to use in developing new tools. Here, it is pertinent to mention that the literature highlights that mixed indicator tools suffer from a lack of interconnection between the subjective and objective indicators whether in the same domain or across other domains (Lora et al. 2010).
Frequency of Indicator Use
The findings show that the tools include 803 unique QOL indicators (out of 1,016 total indicators), as shown in Table 2. The results show that in total, 89.5% of the unique indicators (719 out of 803) are used in only one tool. This result clearly indicates a lack of consensus among the existing tools regarding the use of QOL indicators. An indicator used in only one tool (out of 21 tools) suggests that the majority of the examined tools do not consider it an important attribute or measure of QOL. Only 10·5% (84 out of 803) of the unique indicators are used in more than one tool.
Number and Frequency of Use of Domains and Subdomains
As shown in Table 2, the number of unique QOL domains used across all the 21 tools is 72 domains. Figures 4 and 5 show that, in total, 80.6% of the unique domains (58 out of 72) are used in only one tool. Only 6.9% of the unique domains (5 out of 72 unique domains) are used in seven tools or more. This result clearly indicates a lack of agreement on common practice regarding the use of QOL domains. As shown in Figure 5, the domains that used more frequently (in 7 tools or more out of 21) are housing, education, health, environment, social, and economic. The last three domains (i.e., environment, social, and economic) are very general ones that may include many other domains in other tools. The health domain, which is the most used domain, is included in 16 (out of 21) tools.
Coverage of QOL Domains
Figure 3A shows that 85.7% (18 out of 21) of the tools cover more than 63% of all the domains specified in CLC and that 9 of those domains cover over 80% of CLC domains. This result suggests that most of the tools (18 out of 21) demonstrate reasonable coverage of QOL domains, although none of the tools have demonstrated full coverage of all the CLC domains. The other three tools (T11, T15, and T12) cover only 53, 47, and 37% of CLC domains, respectively. A closer look at the T12 (Philadelphia) tool, which demonstrates the least coverage of QOL domains, illustrates that it excludes over 63% (12 out of 19) of all the CLC domains including all the environmental domains. This severe lack of coverage of major QOL domains suggests that such a tool is not a holistic or comprehensive assessment tool. On the other hand, comparing T17 (Hong Kong) tool with T11 (Los Angeles) shows that T17 is more efficient in achieving more coverage of domains using fewer indicators. As illustrated in Tables 3–5; Figure 3A, the T11 (Los Angeles) tool covers 8 domains (out of 19) using 36 indicators, while the T17 (Hong Kong) tool covers 16 domains using 23 indicators. This finding indicates that proper distribution of indicators across domains/subdomains is more important than increasing their number to ensure comprehensive and effective coverage of QOL attributes.
Coverage of QOL Subdomains
The results indicate that most of the examined tools demonstrate a lack of proper coverage of QOL subdomains. Figure 3B shows that 90% (19 out of 21) of the analyzed tools demonstrate low coverage of subdomains, as each one of these tools covers less than 50% of all the subdomains listed in CLC. Only T13 (Jacksonville) and T14 (Central Texas) tools cover over 50% of CLC subdomains; each covers 58 and 65%, respectively. This means that in almost every examined tool, more than 50% of CLC subdomains are not covered by any indicator. Almost half of the examined tools (10 out of 21) cover only one-third or less of the 87 subdomains in the CLC. The minimal coverage of QOL subdomains raises major concerns about the ability of these tools to comprehensively assign/measure urban QOL.
Coverage of QOL Core Dimensions
Examining the coverage of domains and subdomains at the level of the three core dimensions of QOL (environmental, social, and economic) rather than at the level of the tool reveals other tendencies. The results indicate that the examined tools have covered more economic-related QOL subdomains than the environment and social subdomains. As shown in Figure 3C, 76.2% (16 out of 21) of the analyzed tools include indicators that cover more than 50% of the economic subdomains of the CLC. On the other hand, only three tools (T13, T14, and T16) cover more than 50% of the social subdomains, and only one tool (T14) covers more than 50% of the environment subdomains. The number of tools that cover less than 50% of CLC subdomains in the economic-, social-, and environment-related subdomains, and thus suffer from severe lack of coverage of subdomains in these QOL dimensions, is 5, 18, and 20 tools, respectively. This result suggests that the environment subdomains have the least coverage of subdomains relative to the economic- and social-related ones.
This result can be explained by the fact that most, if not all, of the existing urban QOL tools/applications are not based on the theory-based conceptual model of urban QOL. The literature points out that these tools are guided by pragmatic reasons such as data availability and policy relevance rather than by the theory-based conceptual model (Al-Qawasmi, 2019).
The Developed Urban QOL Tool
Analyzing the 21 tools resulted in several findings that have direct implications on developing the proposed QOL assessment tool. All the findings and conditions highlighted in the section Lessons Learned From Analyzing Tools were consolidated in and guided the development of the new assessment tool. Using an online survey, a panel of experts was asked to select the most important/significant QOL indicators appropriate to comprehensively measure/assess urban QOL in SA from a set of 91 potential indicators provided as input. The following is a discussion of the findings from the online survey.
Indicators
The results show that out of the 91 indicators used as input for the survey, local experts have rated 67 indicators as important/significant (mean ≥5.5). However, consensus on the importance of the indicators in assessing QOL was reached for only 31 indicators. As shown in Table 6, there was consensus among the expert panel that 28 indicators are highly important (IQD ≤1 and median ≥ 6), and 3 indicators are moderately important (IQD ≤ 1 and median ≤ 5). For instance, consensus and agreement were reached on the importance of the following indicators: 5 indicators (out of 8) in the “household income and expenditure” domain, 4 indicators (out of 6) in the “culture and recreation” domain, 4 indicators (out of 8) in the “employment” domain, and 3 indicators in each of one of the “infrastructure and urban services,” “housing,” “education,” and “health and wellbeing” domains. No consensus is reached on any indicator from the “environmental quality” and “transportation” domains.
As shown in Table 6, the mean of importance of the indicators in assessing QOL ranges between 4.88 and 6.53 (out of 7), while the median ranges between 5 and 7. However, the panel of experts did not reach a consensus on the importance of 60 (out of 91) indicators. Thus, no final conclusion can be reached regarding the importance of these indicators for assessing/measuring QOL without conducting a second or third round of the Delphi procedure to examine if consensus can be reached, which will be done in the coming publication. To select a final set of indicators, we will be looking for indicators that have the highest mean ratings on which consensus/agreement is reached that they are highly important.
Domains
The focus group has identified 13 domains that cover the various urban QOL attributes based on the CLC and literature review. As shown in Table 7 and Figure 7, the 13 domains are transportation; infrastructure and urban services; environmental quality; housing; education; institutions and public participation; health and well-being; culture and recreation; crime, safety, and security; social interaction and support; household income and expenses; employment; and economic growth and businesses. The 19 domains of the CLC were consolidated in the 13 domains for simplicity and ease of use by ordinary people. Table 8 shows the mapping of the selected 13 domains to the domains of the CLC.
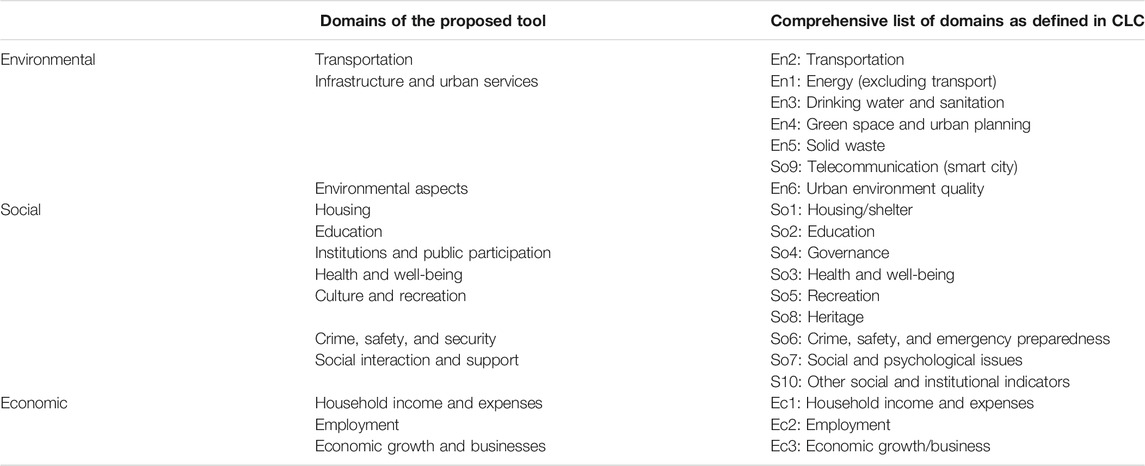
TABLE 8. Mapping of the 13 selected domains to CLC domains.
As shown in Table 7, all the 13 domains are evaluated as important attributes of urban QOL. The top 5 rated important domains are housing, education, health and well-being, employment, and household income and expenses. The mean of importance/significance of the QOL domains ranges between 3.92 and 6.12 (out of 7). However, consensus on the importance of the domains in assessing QOL was reached for only 4 domains out of 13 (IQD ≤ 1 and median ≥ 5). The four domains on which consensus was reached are education, health and well-being, household income and expenses, and economic growth. There is a need for another round or two to finalize the agreement/consensus on the importance of the domains as attributes for urban QOL. Here, it is worth mentioning that in addition to the descriptive analysis (central tendency and variance) and analysis of consensus level on the importance of indicators and domains, other statistical analyses were conducted such as correlation analysis across indicators and domains, and reliability analysis. However, they are not reported here as they are beyond the scope of this study.
Since the selected set of QOL criteria (i.e., 67 indicators and 13 domains) covers all the CLC domains, one can claim that they provide comprehensive assessment of urban QOL. Although we have benchmarked with QOL assessment tools that are not based on the theory and lack the comprehensive coverage of all the QOL criteria as the literature and the analysis of these tools revealed, the developed comprehensive list of criteria (CLC) has enabled us to restructure and present the QOL criteria (i.e., indicators, domains, and subdomains) of these tools in a comprehensive, theory-based model. By using the potential set of indicators that follow the developed CLC as input in the survey, we have implicitly incorporated the comprehensive theoretical QOL framework underlying the CLC (Al-Qawasmi, 2019). The use of the CLC enabled us to better understand the usage patterns of QOL criteria across the examined tools and detect missing criteria in each tool, and thus enabled us to design a better QOL assessment tool that takes into consideration the strengths of the existing tools and ensures the coverage of all the dimensions of urban QOL. The main advantage of this approach is its ability to rate the level of comprehensive coverage of the various QOL criteria in the examined tools and in the new tool being developed.
Conclusion
The in-depth analysis of the 21 assessment tools resulted in several findings that have direct implications on developing the proposed QOL assessment tools. The results show that there is a lack of consensus regarding the selection and use of QOL indicators and domains. The fact that 89.5% (719 out of 803) of the indicators and 33% (7 out 21) domains are used in only one assessment tool indicates that the examined tools are adopting almost incompatible sets of the QOL criteria. The results also show wide variations in the number of indicators used and that most of the examined tools are adopting and using objective measurable indicators.
The results reveal that while most of the examined tools (18 out of 21) demonstrate reasonable coverage of QOL domains (i.e., cover more than 63% of all the CLC domains), the majority of these tools demonstrate a lack of proper coverage of QOL subdomains where most of the tools (90% or 19 out of 21) cover less than 50% of all the subdomains specified in CLC. This means that in almost every examined tool, more than 50% of the CLC subdomains are not covered/assessed. The lack of coverage of a wide range of QOL subdomains raises major concerns about whether these tools are providing comprehensive or holistic coverage of urban QOL. The findings also suggest that we should consider the adequate distribution of indicators across QOL domains/subdomains, rather than increasing their number, to achieve comprehensive coverage of QOL attributes. The results also reveal unbalanced coverage of core dimensions of QOL. The results show that the economic-related attributes are the most covered subdomains followed by the social-related subdomains, while the environment-related subdomains are the least covered QOL domains. All these findings were considered and incorporated in the design and development of the new assessment tool to ensure the development of a comprehensive QOL assessment tool.
The study has identified 67 indicators and 13 domains that are important to assess/measure urban QOL in SA. Local experts have evaluated these indicators and domains as important/significant attributes of urban QOL in the SA context (mean of ratings ranged between 4.88 and 6.53 for indicators and between 3.92 and 6.12 for domains). These criteria (i.e., indicators and domains) will form the core of the QOL assessment tool being developed for the SA context. However, the findings show that consensus on the importance of the indicators/domains in assessing QOL was attained for only 31 indicators and 4 domains. The findings reveal that while the selected criteria (67 indicators and 13 domains) cover all the criteria of the CLC, thus providing comprehensive coverage/measure of urban QOL, the criteria on which consensus is reached do not provide comprehensive coverage. More rounds with experts are needed to reach a final agreement on the final list of indicators and domains.
The results demonstrate the advantage of the comprehensive list of criteria (CLC) and the adopted/used approach as a structured framework for developing new QOL assessment tools. The literature underscored the lack of and need for a structured and systematic approach to design and develop theory-based assessment tools that comprehensively assess urban QOL. The proposed approach/framework contributes significantly to bridge this gap in the literature. Benchmarking with the indicators extracted from the well-known QOL assessment tools in use worldwide provided a solid base for the approach. However, although the proposed CLC has shown several advantages as a structured approach to developing a new QOL assessment tool, it still reflects some limitations such as the lack of ability to suggest/identify a minimal set of indicators that could comprehensively cover all, or most of, the attributes of urban QOL; and not reaching consensus/agreement on the importance/significance of selected indicators/domains. More work is needed to further develop and improve the proposed structured approach for designing and developing new QOL assessment tools, which will be addressed in future articles of this research project. This study reports on one phase of a research project that aims to develop a new QOL assessment tool. The next phase will be to further refine the QOL assessment tool through using the 3-round Delphi approach and coverage analysis to identify a minimal list of QOL criteria that are able to comprehensively measure/assess urban QOL.
Data Availability Statement
The original contributions presented in the study are included in the article/Supplementary Material. Further inquiries can be directed to the corresponding author.
Author Contributions
JA-Q is the main author of the manuscript, and wrote the project proposal and awarded the fund. Other authors (MS, OA, and AA) helped in writing and editing the manuscript.
Funding
The authors extend their appreciation to the Deputyship for Research & Innovation, Ministry of Education in Saudi Arabia for funding this research work through the project number SS-302 (through the initiative of social sciences number of the contract 4600000110).
Conflict of Interest
The authors declare that the research was conducted in the absence of any commercial or financial relationships that could be construed as a potential conflict of interest.
Acknowledgments
The authors extend their appreciation to the King Fahd University of Petroleum and Minerals.
Supplementary Material
The Supplementary Material for this article can be found online at: https://www.frontiersin.org/articles/10.3389/fbuil.2021.682391/full#supplementary-material
References
Abreu, I., and Mesias, F. J. (2020). The Assessment of Rural Development: Identification of an Applicable Set of Indicators through a Delphi Approach. J. Rural Stud. 80, 578–585. doi:10.1016/j.jrurstud.2020.10.045
Al-Qawasmi, J. (2019). Exploring indicators coverage practices in measuring urban quality of life. Proc. Institut. Civil Eng. Urban Design Plan. 172 (1), 26–40. doi:10.1680/jurdp.18.00050
Al-Qawasmi, J. (2020). Measuring quality of life in urban areas: toward an integrated approach. Int. J. Env. Sci. Nat. Res. 25 (2), 67–74. doi:10.19080/IJESNR.2020.25.556158
Brouwer, W., Oenema, A., Crutzen, R., de Nooijer, J., de Vries, N. K., and Brug, J. (2008). An Exploration of Factors Related to Dissemination of and Exposure to Internet-Delivered Behavior Change Interventions Aimed at Adults: A Delphi Study Approach. J. Med. Internet Res. 10 (2), e10. doi:10.2196/jmir.956
Button, K. (2002). City Management and Urban Environmental Indicators. Ecol. Econ. 40 (2), 217–233. doi:10.1016/s0921-8009(01)00255-5
Chamaret, A., O'Connor, M., and Récoché, G. (2007). Top-down/Bottom-up Approach for Developing Sustainable Development Indicators for Mining: Application to the Arlit Uranium Mines (Niger). Ijsd 10, 161–174. doi:10.1504/ijsd.2007.014420
De Meyrick, J. (2003). The Delphi Method and Health Research. Health Edu. 103, 7–16. doi:10.1108/09654280310459112
Delhey, J., Böhnke, P., Habich, R., and Zapf, W. (2002). Quality of Life in A European Perspective: The Euromodule as a New Instrument for Comparative Welfare Research. Soc. Indicators Res. 58, 163–176. doi:10.1023/a:1015783800462
Flynn, P., Berry, D., and Heintz, T. (2002). Sustainability and Quality of Life Indicators: toward the Integration of Economic, Social and Environmental Measures. J. Soc. Health 1 (4), 23–36. doi:10.1080/15357449.2002.11069150
Friedman, Myles. I. (1997). Improving the Quality of Life: A Holistic Scientific Strategy. USA: Praeger Publishers.
Hagerty, M. R., Cummins, R. A., Ferriss, A. L., Land, K., Michalos, A. C., Peterson, M., et al. (2001). Quality of Life Indexes for National Policy: Review and Agenda for Research. Soc. Indicators Res. 55 (1), 1–96. doi:10.1023/a:1010811312332
Hsu, C. C., and Sandford, B. A. (2007). The Delphi Technique: Making Sense of Consensus. Pract. Assess. Res. Eval. 12 (10), 1–8. doi:10.7275/pdz9-th90
Jones, A., and Riseborough, M. (2002). Comparing Quality of Life Research – International Lessons. Birmingham, UK: Centre for Urban and Regional Studies, CURS, School of Public Policy, University of Birmingham.
Kaklauskas, A., Zavadskas, E. K., Radzeviciene, A., Ubarte, I., Podviezko, A., Podvezko, V., et al. (2018). Quality of City Life Multiple Criteria Analysis. Cities 72, 82–93. doi:10.1016/j.cities.2017.08.002
Khadka, C., and Vacik, H. (2012). Comparing a Top-Down and Bottom-Up Approach in the Identification of Criteria and Indicators for Sustainable Community Forest Management in Nepal. Forestry 85 (1), 145–158. doi:10.1093/forestry/cpr068
Kreitler, S., and Kreitler, M. M. (2006). Multidimensional Quality of Life: A New Measure of Quality of Life in Adults. Soc. Indic Res. 76 (1), 5–33. doi:10.1007/s11205-005-4854-7
Lora, E., Powell, A., van Praag, B., and Sanguinetti, P. (2010). “Preface,” in The Quality of Life in Latin American Cities: Markets and Perception. Editors E. Lora, A. Powell, B. M. S. van Praag, and P. Sanguinetti, (Washington DC: The Inter-American Development Bank), xix-xxiv.
Loukaitou-Sideris, A. (2000). Transit-Oriented Development in the Inner City: A Delphi Survey. J. Public Transportation 3 (2), 75–98. doi:10.5038/2375-0901.3.2.5
Marans, R. W. (2015). Quality of Urban Life & Environmental Sustainability Studies: Future Linkage Opportunities. Habitat Int. 45 (1), 47–52. doi:10.1016/j.habitatint.2014.06.019
McCrea, R., Shyy, T.-K., and Stimson, R. (2006). What Is the Strength of the Link between Objective and Subjective Indicators of Urban Quality of Life? Appl. Res. Qual. Life 1, 79–96. doi:10.1007/s11482-006-9002-2
Musa, H. D., Yacob, M. R., and Abdullah, A. M. (2019). Delphi Exploration of Subjective Well-Being Indicators for Strategic Urban Planning towards Sustainable Development in Malaysia. J. Urban Manag. 8 (1), 28–41. doi:10.1016/j.jum.2018.08.001
Okoli, C., and Pawlowski, S. D. (2004). The Delphi Method as a Research Tool: an Example, Design Considerations and Applications. Inf. Manag. 42 (1), 15–29. doi:10.1016/j.im.2003.11.002
Pacione, M. (2003). Urban Environmental Quality and Human Wellbeing-A Social Geographical Perspective. Landscape Urban Plann. 65 (1–2), 19–30. doi:10.1016/s0169-2046(02)00234-7
Palinkas, L. A., Horwitz, S. M., Green, C. A., Wisdom, J. P., Duan, N., and Hoagwood, K. (2015). Purposeful Sampling for Qualitative Data Collection and Analysis in Mixed Method Implementation Research. Adm. Pol. Ment Health 42 (5), 533–544. doi:10.1007/s10488-013-0528-y
Potter, J., Cantarero, R., and Wood, H. (2012). The Multi-Dimensional Nature of Predicting Quality of Life. Proced. - Soc. Behav. Sci. 50, 781–790. doi:10.1016/j.sbspro.2012.08.080
Powell, A., and Sanguinetti, P. (2010). “Measuring Quality of Life in Latin America’s Urban Neighborhoods: a Summary of Results from the City Case Studies,” in The Quality of Life in Latin American Cities: Markets and Perception. Editors E. Lora, A. Powell, B. M. S. van Praag, and P. Sanguinetti, (Washington DC: The Inter-American Development Bank), 31–64.
Prutkin, J. M., and Feinstein, A. R. (2002). A History of Quality of Life Measurements. Yale Medicine Thesis Digital Library, 424. Available at: http://elischolar.library.yale.edu/ymtdl/424.
Schalock, R. L. (2004). The Concept of Quality of Life: what We Know and Do Not Know. J. Intellect. Disabil. Res. 48 (3), 203–216. doi:10.1111/j.1365-2788.2003.00558.x
Slavuj, L. (2011). Urban Quality of Life - a Case Study: the City of Rijeka. Hrv. Geogr. Glas. 73 (1), 99–110. doi:10.21861/HGG.2011.73.01.07
Streimikiene, D. (2015). Environmental Indicators for the Assessment of Quality of Life. Intellect. Econ. 9 (1), 67–79. doi:10.1016/j.intele.2015.10.001
Swain, D., and Hollar, D. (2003). Measuring Progress: Community Indicators and the Quality of Life. Int. J. Public Adm. 26 (7), 789–814. doi:10.1081/pad-120019247
Tongco, M. D. C. (2007). Purposive Sampling as a Tool for Informant Selection. Ethnobot. Res. App. 5, 147–158. doi:10.17348/era.5.0.147-158
Turkoglu, H. (2015). Sustainable Development and Quality of Urban Life. Proced. Soc. Behav. Sci. 202, 10–14. doi:10.1016/j.sbspro.2015.08.203
Keywords: quality of life, quality of urban life, assessment tools, urban development, urbanism, cities
Citation: Al-Qawasmi J, Saeed M, Asfour OS and Aldosary AS (2021) Assessing Urban Quality of Life: Developing the Criteria for Saudi Cities. Front. Built Environ. 7:682391. doi: 10.3389/fbuil.2021.682391
Received: 18 March 2021; Accepted: 19 April 2021;
Published: 25 May 2021.
Edited by:
Tao Liu, Peking University, ChinaReviewed by:
Yiyong Chen, Shenzhen University, ChinaYuanyuan Zhu, Central China Normal University, China
Copyright © 2021 Al-Qawasmi, Saeed, Asfour and Aldosary. This is an open-access article distributed under the terms of the Creative Commons Attribution License (CC BY). The use, distribution or reproduction in other forums is permitted, provided the original author(s) and the copyright owner(s) are credited and that the original publication in this journal is cited, in accordance with accepted academic practice. No use, distribution or reproduction is permitted which does not comply with these terms.
*Correspondence: Jamal Al-Qawasmi, amFtYWxxQGtmdXBtLmVkdS5zYQ==