 Mohamadreza Sheibani
 Ge Ou
Ge Ou
94% of researchers rate our articles as excellent or good
Learn more about the work of our research integrity team to safeguard the quality of each article we publish.
Find out more
ORIGINAL RESEARCH article
Front. Built Environ., 04 May 2021
Sec. Earthquake Engineering
Volume 7 - 2021 | https://doi.org/10.3389/fbuil.2021.677560
This article is part of the Research TopicArtificial Intelligence-powered Methodologies and Applications in Earthquake and Structural EngineeringView all 5 articles
Regional damage simulation is a promising method to prepare organizations for the unforeseeable impact of a probable seismic natural hazard. Nonlinear time history analysis (NLTHA) of the finite element models (FEM) of the buildings in a region can provide resembling results to the actual buildings’ damages and responses. This approach requires large-scale computational resources, and to improve efficiency, parallel processing and representing building FEM models with lumped mass models are proposed. However, the computing complexity is still far-reaching when high-performance computing is not available. The building inventory of a region consists of numerous similar buildings with a limited number of distinct structures. In this paper, we propose a data-driven method that runs the NLTHA for the distinct structures exclusively and infers the damage and responses of other buildings using a surrogate model. Considering the skewed distribution of the buildings in a region, a novel informative sample selection method is proposed that is designed for bimodal sampling of the input domain. We use the Gaussian process regression as the surrogate model and compare the performance of different sample selection methods. The proposed method is able to approximate the results of the regional damage simulation regarding total economic loss estimation with 98.99% accuracy while reducing the computational demand to about 1/7th of the simulation processing time.
Modeling the consequences of a major earthquake in a region can help us identify the vulnerabilities of buildings and communities, as well as plan emergency responses to reduce the expected loss (Afkhamiaghda et al., 2019). There have been two major methodologies to simulate the regional building damage and loss due to earthquakes. The first category is concerned with a probabilistic approach, where fragility functions are developed to fit the response of different building classes using historical data and expert judgment (Lantada et al., 2009; Erdik et al., 2011). The probability of different damage levels and limit states can then be obtained by inputting an intensity measure (IM) of the earthquake, such as peak ground acceleration (PGA), spectral acceleration, etc., to the function. Although fragility functions can provide damage approximations relatively quickly, the lack of available historical data for some regions and modifications to structural design based on new seismic codes narrows the applicability of these methods (Lu et al., 2021).
Another state-of-the-art earthquake damage simulation approach is through nonlinear time history analysis (NLTHA) of finite element method (FEM) models of individual buildings. With NLTHA, one can obtain the full response of a structure model under seismic loading, which closely represents the actual building’s response under the same loading. High fidelity FEM models of the entire building inventory in a region are difficult to create and very computationally demanding to run. A proposed method used in the workflow developed by (Lu et al., 2020) maps each building into a lumped mass shear model to reduce the required computational time of running regional simulations (Zeng et al., 2016). However, the computational demand is still too high if high-performance computing is not available.
There are numerous buildings that share similar attributes and are located in the proximity of each other in a large metropolitan area. Considering the lost details such as maintenance programs, construction quality, environmental effects, etc., when projecting a building into a lumped mass shear model, we may find repetitions of the same models in the simulation workflow. Furthermore, during a seismic event, buildings located in proximity of each other experience close to similar input loading. Due to the lack of a high-resolution spatial distribution of ground motions considered for a regional simulation, a coarse-grained grid of ground motions is usually considered for regional simulations (Petersson and Sjogreen, 2017; Rodgers et al., 2018). Therefore, considering each building model and its associated input loading as a single case, the workflow undergoes a large number of NLTHAs for similar cases in the simulation of a region.
Building upon the existing resemblances in the simulation procedure, one can run the simulation solely for a sparse number of carefully identified unique cases and extend the results to the entire building inventory. The inference of the excluded cases’ responses can be achieved by training a surrogate model based on the input-output pairs obtained from the simulation of the selected cases. Therefore, by training a nonlinear regression model using the input-output relations, the outputs of the excluded cases can be inferred. It was shown that a well-designed Gaussian process regression (GPR) model could be used as the surrogate model to make the inferences with high accuracy (Sheibani and Ou, 2020).
The sampling of a dataset should aim at selecting the most informative datapoints to train a surrogate model so that a minimal generalization error is obtained under a certain budget limitation. An informative datapoint is representative of a large number of other datapoints while it does not overlap with other representatives. Informative data sampling is well-studied for classification methods Ertekin et al. (2007), Cai et al. (2017), Kumar and Gupta (2020), where samples should be located close to the classification boundaries for the optimum training of the model. On the other hand, in the case of regression, to obtain the lowest generalization error, the sampling methods aim at the exploration of the input domain. The representative sampling of a dataset for regression can be achieved using two different approaches, passive selection methods, and active selection methods. While passive selection methods are based only on the characteristics of the input domain, active learning methods utilize the label observation data to suggest informative datapoints. Various active selection methods have been suggested in the literature, such as the active learning Mackay (ALM) MacKay (1992), Mutual Information Krause et al. (2008), Sheibani and Ou (2021), and by diversifying the output in training sets such as the GSy and iGS methods (Wu et al., 2019). However, due to the massive number of datapoints in the regional damage simulation problem, the high computing complexity of active sampling methods makes them a lower priority. Moreover, passive selection methods can provide sample suggestions before the learning procedure, and consequently, the required label queries can be performed in parallel for a higher efficiency (Lu et al., 2014). Therefore, we will not include active learning methods in this paper.
Passive selection methods use the geometry features of the input domain to select the most representative and diverse datapoints from a dataset. A greedy sampling (GS) approach was proposed in Yu and Kim (2010) that sequentially selects datapoints that are located at the furthest distance (usually calculated as the Euclidean distance in the input domain) from previously selected datapoints. This method was later improved by selecting the first sample as the closest to the center of the input domain and named as GSx in (Wu et al., 2019). A clustering-based approach was also proposed that sequentially partitions the input domain and selects the next datapoint from the largest cluster with no observed data in it (Wu, 2018). A variety of methods such as query by committee (QBC) Vandoni et al. (2019), expected model change maximization (EMCM) Cai et al. (2016), or GS can then be used to select the most informative datapoint from that cluster.
For the specific case of regional damage simulation, the input dataset consists of a highly skewed distribution of datapoints. The majority of datapoints representing typical residential buildings are located close to the mode of the distribution, while a sparse number of uncommon buildings are also present in the distribution. The current state-of-the-art sampling methods are designed to avoid extreme datapoints, as in most applications, the so-called outlier data affects the model adversely. However, for the regional damage simulation problem, the extreme datapoints are as important as any other datapoint and should be considered in the data sampling process. In this paper, we propose a framework that significantly reduces the computational cost of the regional seismic damage simulation by carefully selecting the input-output pairs to train the surrogate model. The framework creates a dataset consisting building variables and characteristics of the input ground motion for each datapoint. A novel bimodal sampling strategy then selects the most informative cases from the dataset and allocates them for training purposes. The sampling method is able to train the surrogate model for the bulk of similar buildings as well as the extreme datapoints in the inventory. Based on the simulation results of the selected candidates, a Gaussian process regression (GPR) model is trained to infer the damage labels for the entire building inventory. Using the proposed method, the desired damage labels are obtained with a promising accuracy while demanding a significantly lower computational expenditure.
In this section, we propose surrogate modeling with an informative sampling approach to the regional damage simulation problem. The objective of a regional earthquake simulation is to provide damage intensity estimations for individual buildings in the region, which can be used in the subsequent risk assessment analysis. Through a quantitative analysis of the building inventory of the seismically vulnerable San Francisco city area, the bimodal sampling methodology is developed. The workflow presented by NHERI SimCenter Lu et al. (2020) is used for the simulation of a hypothetical M7.0 earthquake. As a result of this simulation, the economic loss ratio and the safety tag of individual buildings affected by the earthquake are estimated. The following sections explain the distribution of buildings in a typical region, details of the simulation process, and the general framework that is proposed in this article.
The regional damage simulation targets the estimation of damage intensity for individual buildings as well as the total economic loss that is caused by a natural hazard such as an earthquake. In most regions, there is usually a skewed distribution of building types, where the low-rise residential buildings are located at the mode, and a limited number of high-rise uncommon buildings exist at the tail of the distribution. As an example, the distribution of 152,603 buildings in the San Francisco city area, obtained from Urbansim Waddell (2002), are shown in Figure 1 based on different variables, including location, age, structural type, occupancy type, and height. Quantities of structural type and occupancy types are also shown in Table 1. We can observe the sparse number of uncommon buildings in the northeast downtown area while the majority of the buildings in other areas of the city show similar variables.
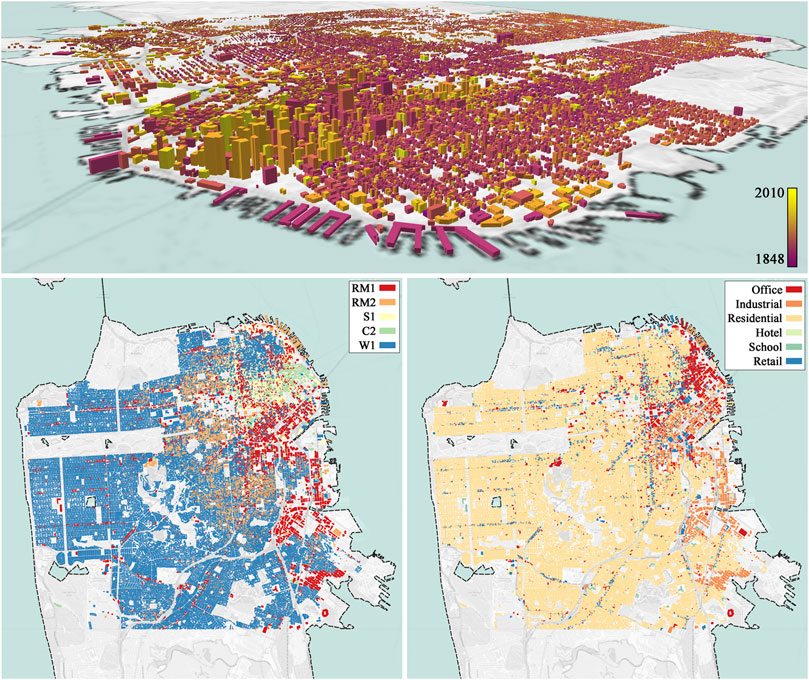
FIGURE 1. Visualization of the geographical distribution of building variables in the San Francisco city area. Top) Buildings heights and year built. Bottom left) Structural types. Bottom right) Occupancy types.
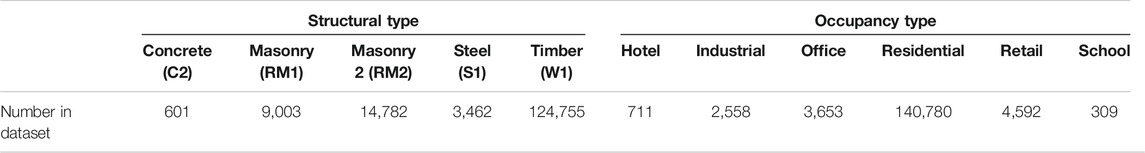
TABLE 1. Number of buildings in different categories of structural type and occupancy.
To examine the multi-dimensional distribution quantitatively, we perform a principal component analysis (PCA) on the building variables. PCA projects the dimensions of the dataset into perpendicular new dimensions with decreasing explained variance. Therefore, the first principal component can describe the dataset on the most explained variance direction. Figure 2 shows the distribution of the dataset on its first principal component. It can be seen that datapoints located within the 75th percentile are densely packed in one side of the distribution, while the last 1% of datapoints are widely scattered.
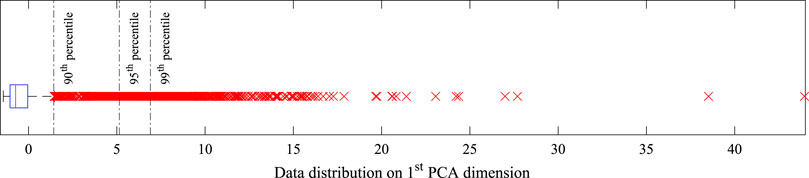
FIGURE 2. Distribution of the building variables on the first PCA dimension. The box plot indicates that a limited number of datapoints are located far from the majority of datapoints accumulated near the median values.
We can conclude that the bulk of the building inventory is comprised of similarly attributed buildings. Therefore, we can select a number of representative datapoints from that range for NLTHA simulation and infer the response of the rest of the datapoints within the same range using a surrogate model. While this method can provide high-quality inference for datapoints in the bulk, since no representative is selected from the tail of the distribution, the surrogate model may not yield accurate estimations in that range. Although in most surrogate modeling approaches the outlier data is ignored, in the regional building inventory database, datapoints located further from the bulk of data are usually the more important uncommon buildings. Neglecting the impact of these buildings may cause a high divergence in the total loss estimation.
In our proposed methodology, we train the surrogate model using a limited number of NLTHA simulations, selected by the sampling method, and bypass the simulations for the majority of the buildings. This approach starts with gathering a dataset consisting building and ground motion variables in an attribute table. The sampling module is then responsible for allocating the most informative datapoints to the training set and the rest to the testing set. Subsequently, the NLTHA is performed for the cases in the training set, and the input-output pairs are used to train the surrogate model, as shown in Figure 3. Therefore, the sampling method can significantly influence the overall predictive performance of the surrogate model. As we mentioned previously the sampling method needs to select from both ordinary buildings as well as the limited uncommon buildings. If implemented successfully, this approach will return accurate damage estimations while reducing the computational demand of the regional damage and loss assessment considerably. The desired sampling strategy is developed in the next section.
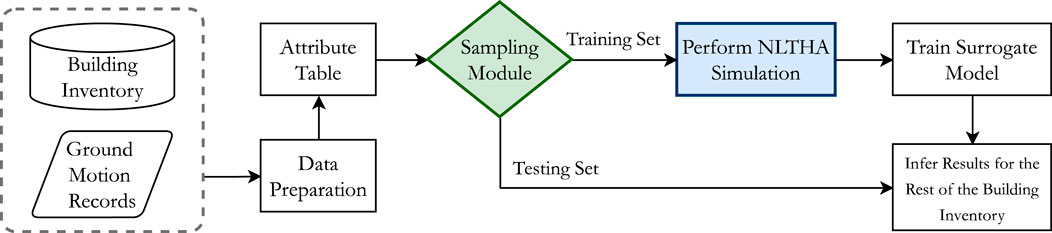
FIGURE 3. The proposed accelerated simulation for regional post-earthquake damage assessment.
In this section, the basic theories of the methods required for the accelerated regional damage simulation with surrogate modeling are described. The formulation of the GPR model, serving as the surrogate model for damage and loss inference, is reviewed, and the current passive sampling methods, along with the proposed method used in this article, are discussed next.
GPR (also known as kriging in geostatistics) is a probabilistic regression method that is capable of mapping the nonlinear relations of data with promising accuracy (Rasmussen and Williams, 2006; Schulz at al., 2018). Considering the set of all datapoints as
where
In this study, the automatic relevance determination (ARD) type of the rational quadratic (RQ) covariance function is used as kernel since it was shown to be able to model a wide range of nonlinear relations (Sheibani and Ou, 2020). Considering the input vectors
where
A number of criteria should be considered when the goal of sampling a dataset is to minimize the regression generalization error. Samples should be informative so they can improve the regressor’s performance when added to the training set. The notion of improving the regressor performance is usually considered as the rate of change in the regressor’s parameters, such as in EMCM method. However, an outlier can also change the parameters of the regressor significantly, which is a misleading change and results in a worse overall predictive performance. Therefore, we should also consider the representativeness criterion, which favors the datapoints that represent others, i.e., the datapoints that are closely surrounded by a large number of other datapoints. This criterion reduces the chances of picking outliers. Finally, a picked sample should not contain the information that the regressor has already learned. The diversity condition assures that the selected datapoints are located in distance from previous points and therefore reduces the amount of information overlap.
Passive sampling methods rely solely on the characteristics of the input space to select the informative datapoints. Therefore, since the information from the observed output data is not used, the sampling can occur with low computational complexity before the label query starts. Three passive selection methods, namely the GSx and the representativeness and diversity (RD) method, and the RD with greedy sampling RD-GS method, are considered for this study which will be covered next.
• GSx: This method is based on a greedy and efficient heuristic that considers the uncertainty of a datapoint as its distance to the closest datapoint in the training set. Therefore, to maximize the uncertainty of the sampling points, new samples are picked at the furthest distance from the previously selected samples in a sequential approach. Algorithm 1 describes the steps of the GSx method.
• RD: The representativeness and diversity are two of the most important criteria for picking a sample. The RD method begins with choosing
• RD-GS: This method is the same as the RD method for the most part, however, at each step, instead of picking the centroid of the largest cluster for sampling, similar to the GSx method, the sample that is the furthest from the previously seen datapoints is chosen from the cluster. It was shown that this method presents a better performance in comparison with other heuristics of choosing a sample from the largest cluster (Wu, 2018)
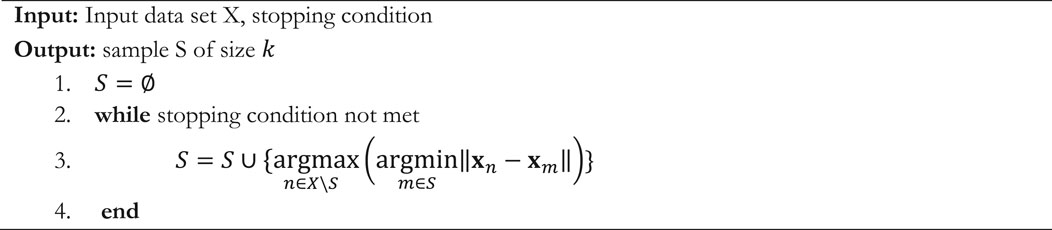
Algorithm 1. –GSx (Wu et al., 2019)
Algorithm 2 explains the steps of the RD and RD-GS methods.
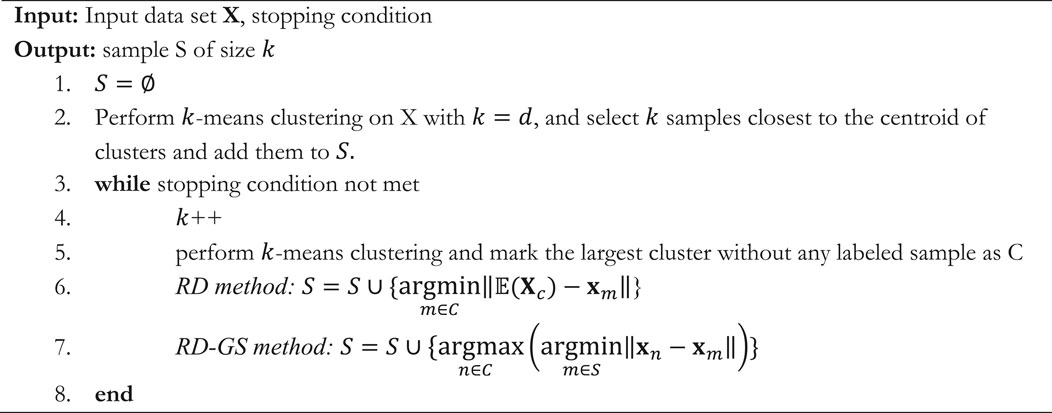
Algorithm 2. –RD/RD-GS (Wu, 2018)
The mentioned passive sampling methods in the previous section are aimed at certain objectives, which may not be optimum for the regional damage simulation problem. Generally, the GSx, GSy, iGS, and ALM methods seek the maximization of the diversity in the training set that practically results in the sampling of the datapoints located near the boundary of the input domain. These datapoints do not contain useful information as they provide insight into the outside of our domain of interest. Moreover, since they are located far from the bulk of data, it is highly likely that they are outliers as well. On the other hand, the RD and RD-GS methods focus on the representativeness before diversity which leads to sample selection biased towards the center of the input domain as they favor larger clusters at each step. Therefore, the chance of sampling outliers is highly unlikely.
Taking advantage of the benefits of passive sampling methods, we propose a method that performs the sampling using the RD method and the GSx method in series. Since the resources and available time can be limited for a region-wide seismic damage simulation, we start the sampling using the RD method to train the regressor for the bulk of data and bring the estimations to an accurate level for the majority of datapoints. As the rate of improvements declines by selecting similar datapoints from the bulk of data, we switch the sampling method to GSx and select the uncommon datapoints to be included in the training set. The process continues with GSx until we reach the stopping criterion. The steps of this method, called the RD-GSx hereafter, are explained in Algorithm 3.
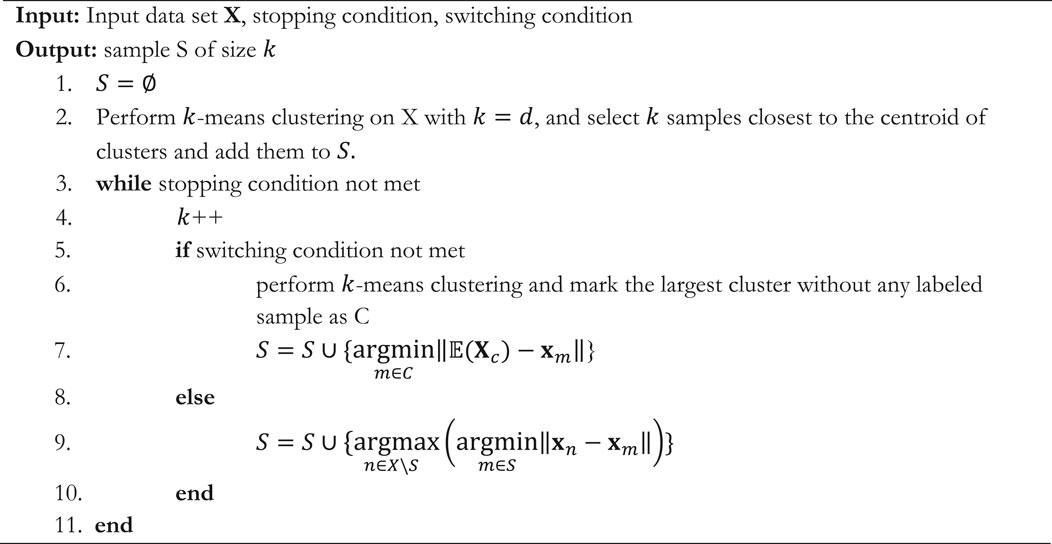
Algorithm 3. –RD-GSx
A comprehensive regional damage assessment as a result of a hypothetical M7.0 earthquake was recently published in (Lu et al., 2020). For this event, a grid of ground motions is generated using SW4 Petersson and Sjogreen (2017) method, and using a k-dimensional tree, the nearest ground motion is assigned to each building. The geographical distribution of the ground motions and their associated PGA are shown in Figure 4. The simulation method proposed by SimCenter is a modular workflow that includes six main applications. The applications are briefly described below:
• Create BIM: The Create BIM application gathers the basic building information such as the number of stories, structural type, age, etc., from the building inventory.
• Create Event: Based on the ground motion database for the earthquake, this application assigns a ground motion to each building based on its geographical location.
• Create SAM: This application creates a structural model for the nonlinear time history analysis based on the information provided by the Create BIM and Create SAM applications.
• Create EDP: A list of engineering demand parameters such as maximum absolute acceleration, maximum drift ratio, and residual displacement is stored for each building.
• Perform Simulation: The SAM model is analyzed using the nonlinear time history analysis in OpenSees, and the appropriate EDPs are recorded for further analysis.
• Create DL: Finally, this application uses the method of FEMA P-58 FEMA (2012) to determine the economic loss and probability of the safety tag for each building.
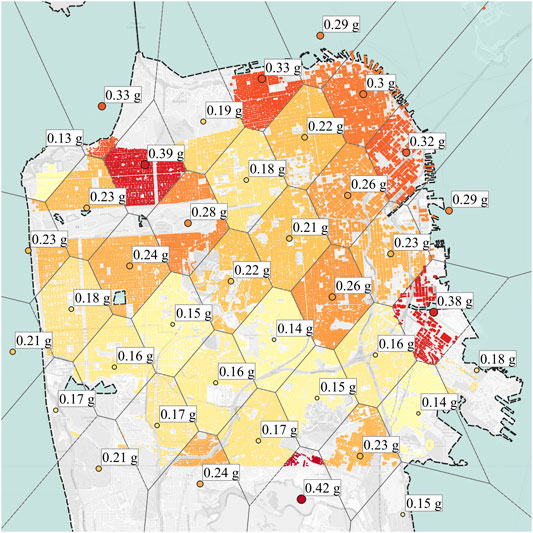
FIGURE 4. The geographical distribution and PGA values of the considered ground motions in the region.
Considering the cumulative economic losses of the affected buildings, the estimated total economic loss can be calculated. The time-consuming part of the SimCenter’s damage simulation workflow is running the Perform Simulation application, where the NLTHA is conducted for each individual building. Same as the discussion in Quantitative Assessment on Model Feature Distribution, we consider a building inventory with 152,603 buildings in the San Francisco city area for this simulation. We use the MDOF-LU application for modeling the FEM of the buildings and the Dakota-FEM application for the Loss calculations. For every building, a set of five different samples randomized by their linear stiffness coefficient, damping coefficient, and story height are created, and the EDPs are used for the generation of 1,000 loss realizations, based on a different number of structural and non-structural elements, per EDP set. The simulation process on a PC with an Intel Core-i5 7,500 processor took about 184 h (7.5 days), i.e., ∼4.3 s per building on average.
To perform the accelerated simulation using the proposed method, we gather a dataset of inputs, and a sampling method selects the training points for NLTHA simulation and consequently training the surrogate GPR model. The gathered dataset consists of building variables and a wide range of ground motion intensity indices as listed in Table 2. These features are used as input and the economic loss ratio and unsafe placard probability of buildings as output to train the GPR model.
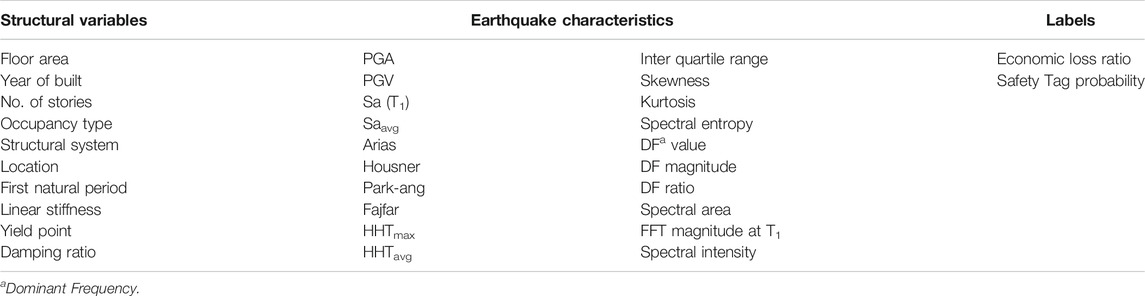
TABLE 2. List of features and labels for the regional damage assessment dataset.
In this section, we compare the sampling behavior of the GSx and RD methods as they pursue different objectives in passive sampling. The RD method picks the most representative datapoints at centers of clusters, while the GSx method selects the furthest points from the previously observed datapoints on the boundary of the input domain. Figure 5 shows the distances between the selected points and the center of the input domain for the GSx and RD methods for up to 1,000 sampling points. To measure the distances between the datapoints to the center of the input domain, we use the following equation
We can see that the GSx method has favored eccentric datapoints over datapoints with high representativeness. On the contrary, the RD method avoided datapoints far from the center of the domain and selected more representative datapoints.
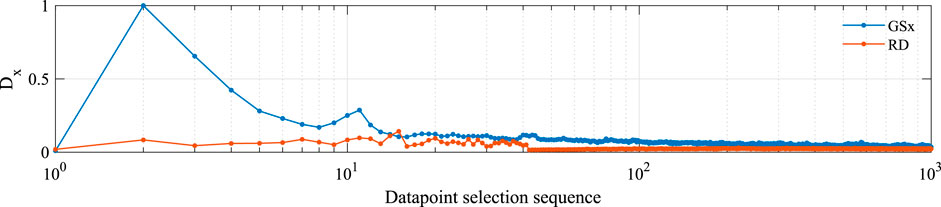
FIGURE 5. Sequence of the selected datapoints by the GSx and RD methods based on their distance from the center of the input domain.
To break down the predictive performance of the surrogate model trained with samples selected by these methods, we compare the prediction accuracy of the datapoints based on their distance from the center of the input domain. Figure 6 compares the accuracy of prediction for individual datapoints between the GSx and the RD methods after selecting 1,000 training points based on the relative error formula as
It can be observed that the RD method has a significant advantage over the GSx for predicting datapoints near the center of the input domain. However, as we focus on datapoints that are located further away from the center, the GSx method outweighs the predictive performance of the RD method. This behavior can be seen in the results of both labels and is caused by the fact these methods follow opposite objectives, as explained above.
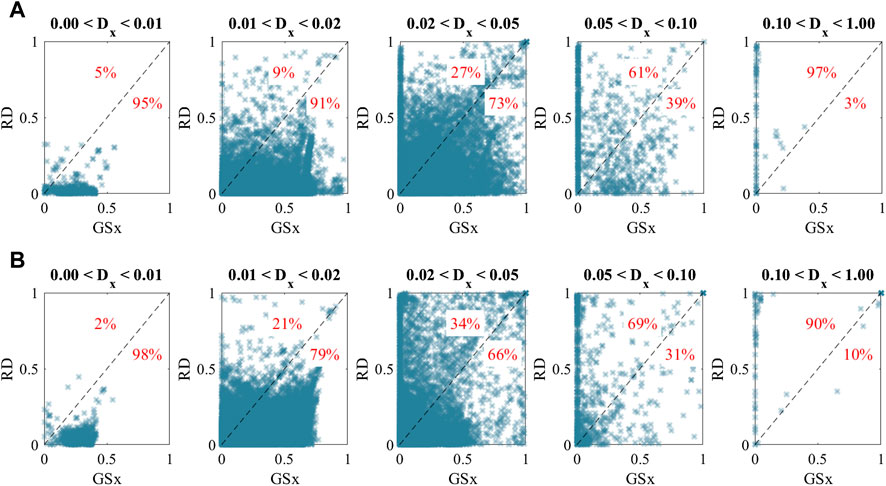
FIGURE 6. Point by point comparison of the prediction accuracy obtained from GSx and RD methods. The percentages of the datapoints located in each triangle are shown for quantitative comparison. (A) Loss ratio label. (B) Safety tag label.
The RD method may be beneficial if the dataset is noisy and outlier datapoints exist and should not be selected in the training set. However, in the regional damage simulation problem, we are not concerned about picking outliers, and in fact, datapoints located far from the center of the domain are usually the more important eccentric buildings. However, to achieve high predictive performance with a minimal number of label queries, priority should be given to the representative datapoints. Therefore, since there is a sparse number of these eccentric buildings in a region, it is advantageous to add them to the training set at a later stage and refrain from training the surrogate model for any probable extreme input as it would be costly to do so.
With this intuition, we propose to use the RD-GSx method, which takes advantage of the immediate improvements of the RD method, and as the progress rate plateaus, it switches to the GSx method for adding the eccentric datapoints to the training set and further improves the overall predictive performance of the surrogate model. In order to observe the predictive behavior of the RD-GSx method in terms of
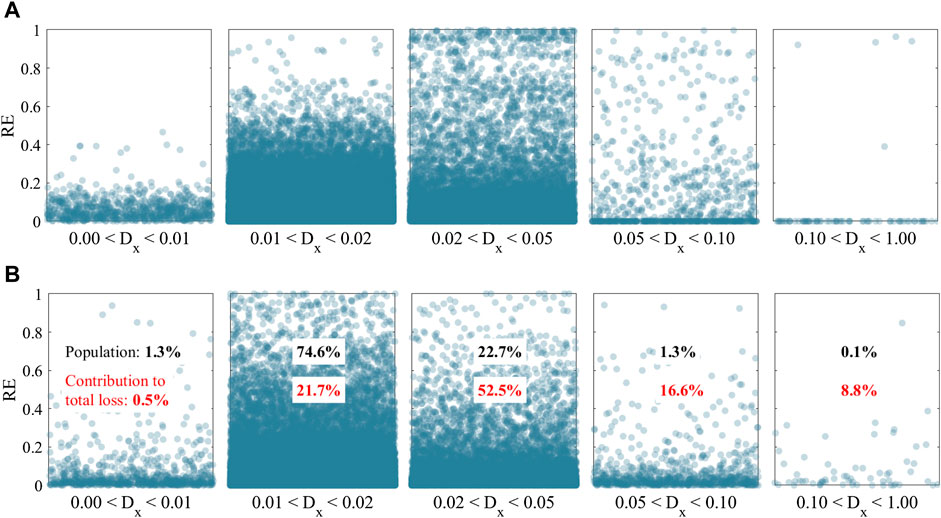
FIGURE 7. Visualization of the predictive behavior of the RD-GSx method based on the distance of datapoints from the center of the input domain. Datapoints in each bin are distributed randomly along the x-axis. (A) Loss ratio label. (B) Safety tag label.
The percentage of datapoints in each bin is also shown in Figure 7. Although buildings in the last bin of Figure 7 only make up about 0.1% of the dataset, they cause 10.7% of the total economic loss. At the same time, the majority of the datapoints are located in the second bin, and they comprise 21.2% of the total loss. This observations emphasizes the fact that the eccentric datapoints play a significant role in the results of the regional damage simulation, and they should not be excluded.
To enhance the regional damage simulation performance with a surrogate model, the accuracy of the surrogate model's results should closely replicate those of the simulation models. This section compares the obtained predictive performance of the surrogate model based on different sample selection methods introduced in Informative Sampling. In order to keep the evaluations independent of the final testing results, we shuffled the entire dataset and randomly picked 75,000 datapoints for development purposes and 77,603 datapoints for the testing set. This way, the distribution of the input and output spaces of both sets are kept similar to each other.
In the proposed damage estimation method, a pool of datapoints is available, and the sampling method selects a set of datapoints to train the surrogate model with. Therefore, it is most suitable to use a transductive learning approach for evaluating the sampling methods. In the transductive approach, the training samples are selected from the same pool of datapoints as the evaluation data. To have independent results from the pool of datapoints, each realization is run 64 times on 80% of the dataset (60,000 datapoints), called
The predictive performance is evaluated using the standardized mean square error (SMSE) as
In the training stage, every method is responsible for selecting 1,000 training points out of the 60,000 total datapoints in the
We evaluate the sampling methods based on the ability of the trained GPR model to predict the labels of the entire datapoints in our
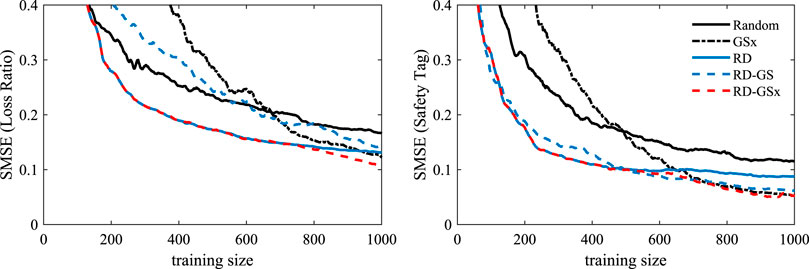
FIGURE 8. Comparison of sampling methods based on the improvements in SMSE.
Since computing complexity is consequential for large-scale simulation tasks, we compare the computational time of the sample selection methods in this section. Figure 9 shows the cumulative times that each algorithm spends on the sampling tasks.
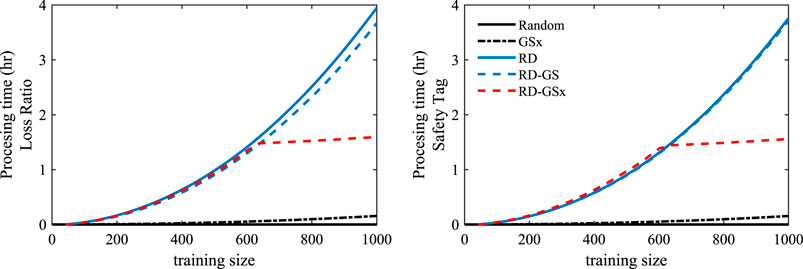
FIGURE 9. Comparison of computational demand between sampling methods.
We can see that the RD and RD-GS methods have a higher order of computing complexity as in each step, the entire input dataset should be partitioned using k-means clustering. On the other hand, GSx performs the fastest as it can keep the calculated distances at each step and reuse them partially in the distance calculations of the next step. The RD-GSx utilizes this behavior and reduces the computational demand to only 40.3 and 41.6% of the RD method’s processing time, as shown in Figure 9 for Loss Ratio and Safety Tag labels, respectively. Needless to say that the gap will widen if more training data is considered.
Furthermore, since one of the objectives of the post-earthquake regional damage assessment is to estimate the total economic loss caused by an earthquake, using the predicted loss ratios multiplied by the reconstruction costs of the individual buildings, the total economic loss can be calculated. Figure 10 shows the economic losses estimated by the surrogate model as a percentage of the loss estimated by the individual simulation of every building model. About 97.3% of the buildings in the development set are low-rize (1–3 stories), 2.4% are mid-rise (4–7 stories), and 0.4% are high-rise. Due to the large number of low-rise buildings, which mainly make up the bulk of data close to the center of the input domain, the RD and RD-GS methods present accurate predictions for low-rise buildings. The GSx method accurately predicts the losses of high-rise buildings but presents biased predictions for low and mid-rise buildings. Utilizing the advantages of these methods, RD-GSx presents more accurate predictions for low-rise buildings compared to the GSx method and lower error in the prediction of high-rise buildings compared to the RD and RD-GS methods.
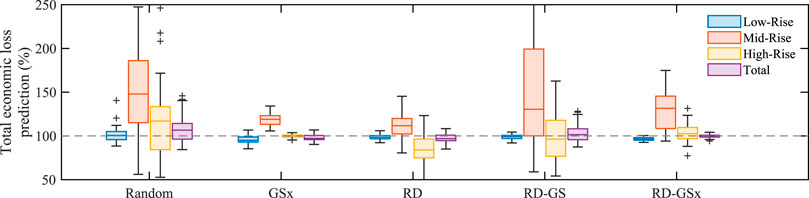
FIGURE 10. Estimation of the economic loss predicted by each method as a percentage of the true economic loss.
As a result, we can observe that the estimated total losses based on the predictions of the RD-GSx method have a median of 100.04% with narrow variations for different realizations. At the same time, neglecting the random selection method, other sampling methods show median values biased from 96.93 to 101.41% with higher variations. Therefore, it can be inferred that the RD-GSx method selects the set of samples that can most accurately reproduce the results of the inclusive individual simulations using the workflow.
Finally, we apply the surrogate model with the RD-GSx sampling method to estimate the damage and loss of the testing set. As mentioned before, the testing set has 77,602 datapoints that have been unseen so far. For the Loss Ratio label, the surrogate modeling achieved a final SMSE of 0.145 and an average RE of 0.067 after 1,000 datapoints were sampled and used to train the GPR model. The total economic loss for the testing set was estimated to be $5.96B by the simulation workflow, while the estimated amount from the predicted labels by the surrogate model was $5.9B (98.99% accuracy). The final SMSE was 0.057, and the average RE was 0.123 for the Safety Tag label. The simulated and predicted labels are compared on the maps shown in Figure 11.
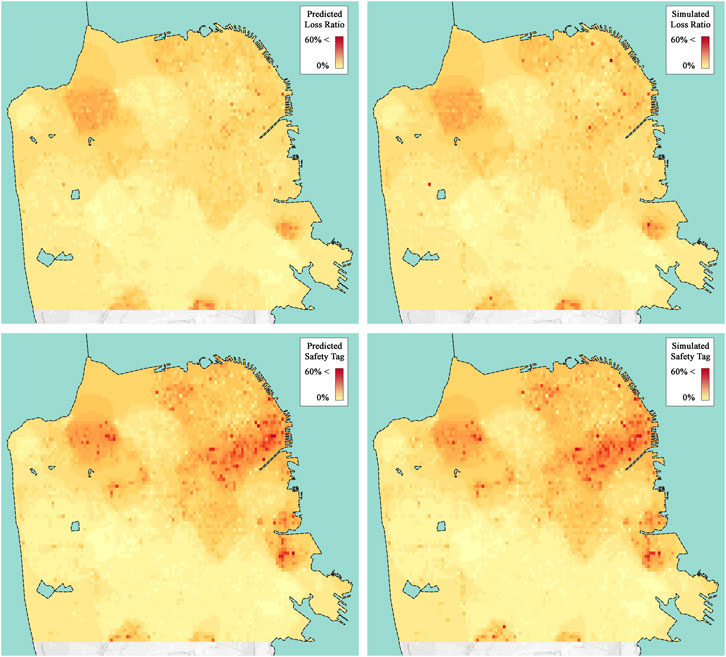
FIGURE 11. Visualization of the labels obtained from workflow simulation and RD-GSx prediction. Although labels are obtained for individual buildings, the results are shown in the form of interpolated values on grids of size ∼150 m × 150 m to protect privacy.
The simulation workflow takes about 93 h (3.87 days) to calculate the damage and loss of the buildings in our testing set using the PC mentioned in Regional Damage Assessment Example. On the same PC, the surrogate modeling took a total of 13.7 h, with the details of the spent time shown in Figure 12. Another advantage of the passive sampling techniques is that the samples can be used for both labels, which further reduces the required time of sampling.
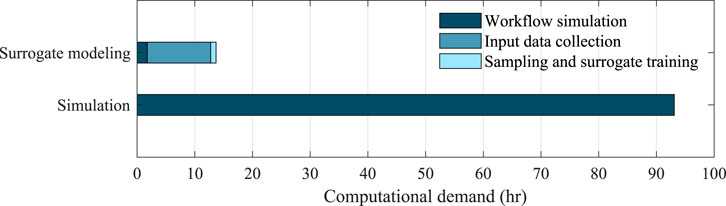
FIGURE 12. Comparison of the processing time required for the estimation of labels in the testing set using different approaches.
Although the presented strategy reduces the overall time and costs of the regional seismic damage assessment studies, further research is required to investigate different aspects of this problem. The bimodal sampling heuristic considers both representative datapoints and outliers. However, the results of the current strategy show a lower performance on the prediction of mid-rise buildings, which comprise about 2.4% of the dataset. Generally, the presented model predicts softer labels which can result in under-estimation of large loss ratios on some individual buildings, as can be seen in the north-east area of the maps shown in Figure 11. Therefore, multimodal sampling, different methods of representative sampling, and other surrogate models should be studied to further improve the performance of the presented strategy.
Regional damage simulation of an earthquake can provide valuable intuition into probable losses that a region might experience. In order to make large-scale NLTHA simulations accessible for PC use, a surrogate modeling method was proposed. Based on the skewed distribution of buildings in a metropolitan area, a bimodal sampling strategy was proposed that selects the samples needed to train the surrogate model from the most informative datapoints. The proposed RD-GSx sampling method initially selects representative samples using the RD method and, based on the threshold of the cross-validation accuracy on the training data, switches the sampling method to GSx, which selects uncommon datapoints. This strategy utilizes the immediate improvements of the RD method by providing representative datapoints for the majority of the testing set, which consists of similar residential buildings. As the progress rate of the predictive performance plateaus, the GSx method takes over to add the uncommon datapoints such as high-rize buildings to the training set. It was shown that the GPR model presents higher predictive performance when trained with samples provided by the RD-GSx method compared to other state-of-the-art passive sampling approaches. At the same time, the computational time was reduced to about 41% of the RD method for 1,000 samples. When evaluated on the testing set with 77,603 datapoints, the proposed surrogate modeling approach was able to estimate the total economic loss with 98.99% accuracy while reducing the overall processing time to 1/7th of the individual simulation time.
The raw data supporting the conclusions of this article will be made available by the authors, without undue reservation.
All authors contributed to manuscript revision, read, and approved the submitted version.
The material is based upon work supported by the University of Utah, and the National Science Foundation under award numbers 1839833 and 2004658. Any opinions, findings, and conclusions or recommendations expressed in this material are those of the author(s) and do not necessarily reflect the views of the National Science Foundation.
The authors declare that the research was conducted in the absence of any commercial or financial relationships that could be construed as a potential conflict of interest.
Afkhamiaghda, Mahdi., Afsari, Kereshmeh., Elwakil, Emad., and Rapp, Randy. (2019). An Approach to Simulating Construction Process in Post-Disaster Sheltering. 55th Annual ASC International Conference. University of Denver, Denver, Colorado April 10-13, 2019.
Cai, Wenbin., Zhang, Muhan., and Zhang, Ya. (2016). Batch Mode Active Learning for Regression with Expected Model Change. IEEE Trans. Neural networks Learn. Syst. 28 (7), 1668–1681. doi:10.1109/TNNLS.2016.2542184
Cai, Wenbin., Zhang, Yexun., Zhang, Ya., Zhou, Siyuan., Wang, Wenquan., Chen, Zhuoxiang., et al. (2017). Active Learning for Classification with Maximum Model Change. ACM Trans. Inf. Syst. (Tois) 36 (no. 2), 1–28. doi:10.1145/3086820
Erdik, Mustafa., Şeşetyan, K., Demircioğlu, M. B. U., and Zülfikar, C. (2011). Rapid Earthquake Loss Assessment after Damaging Earthquakes. Soil Dyn. Earthquake Eng. 31 (2), 247–266. doi:10.1016/j.soildyn.2010.03.009
Ertekin, Seyda., Huang, Jian., Leon, Bottou., and Lee, Giles. (2007). Learning on the Border: Active Learning in Imbalanced Data Classification. Proceedings of the Sixteenth ACM Conference on Conference on Information and Knowledge Management, Lisbon Portugal. November, 2007, 127–136. doi:10.1145/1321440.1321461
FEMA (2012). Seismic Performance Assessment of Buildings, FEMA P, 58-1. Redwood City, CA: Applied Technology Council.
Krause, Andreas., Singh, Ajit., and Guestrin, Carlos. (2008). Near-optimal Sensor Placements in Gaussian Processes: Theory, Efficient Algorithms and Empirical Studies. J. Machine Learn. Res. 9, 2.
Kumar, Punit., and Gupta, Atul. (2020). Active Learning Query Strategies for Classification, Regression, and Clustering: A Survey. J. Computer Sci. Technology 35 (4), 913–945. doi:10.1007/s11390-020-9487-4
Lantada, Nieves., Pujades, Luis. G., and Barbat, Alex. H. (2009). Vulnerability Index and Capacity Spectrum Based Methods for Urban Seismic Risk Evaluation. A Comparison. Nat. Hazards 51 (3), 501. doi:10.1007/s11069-007-9212-4
Lu, Xinzheng., Han, Bo., Hori, Muneo., Xiong, Chen., and Xu, Zhen. (2014). A Coarse-Grained Parallel Approach for Seismic Damage Simulations of Urban Areas Based on Refined Models and GPU/CPU Cooperative Computing. Adv. Eng. Softw. 70, 90–103. doi:10.1016/j.advengsoft.2014.01.010
Lu, Xinzheng., McKenna, Frank., Cheng, Qingle., Xu, Zhen., Zeng, Xiang., and Mahin, Stephen. A. (2020). An Open-Source Framework for Regional Earthquake Loss Estimation Using the City-Scale Nonlinear Time History Analysis. Earthquake Spectra 36 (2), 806–831.
Lu, Xinzheng., Xu, Yongjia., Yuan, Tian., Cetiner, Barbaros., and Taciroglu, Ertugrul. (2021). A Deep Learning Approach to Rapid Regional Post‐event Seismic Damage Assessment Using Time‐frequency Distributions of Ground Motions. Earthquake Eng. Struct. Dyn. 50, 1612–1627. doi:10.1002/eqe.3415
MacKay, David. J. C. (1992). Information-based Objective Functions for Active Data Selection. Neural Comput. 4 (4), 590–604. doi:10.1162/neco.1992.4.4.590
Petersson, N., and Sjogreen, B. (2017). Computational Infrastructure of Geodynamics.Sw4, Version 2.0
Rasmussen, Carl. Edward., and Williams, Christopher. K. I. (2006). Gaussian Processes for Machine Learning. the MIT Press.
Rodgers, Arthur. J., Arben PitarkaPetersson, N. Anders., Sjögreen, Björn., and McCallen, David. B. (2018). Broadband (0–4 Hz) Ground Motions for a Magnitude 7.0 Hayward Fault Earthquake with Three‐dimensional Structure and Topography. Geophys. Res. Lett. 45 (2), 739–747. doi:10.1002/2017GL076505
Schulz, Eric., Speekenbrink, Maarten., and Krause, Andreas. (2018). A Tutorial on Gaussian Process Regression: Modelling, Exploring, and Exploiting Functions. J. Math. Psychol. 85, 1–16. doi:10.1016/j.jmp.2018.03.001
Sheibani, Mohamadreza., and Ou, Ge. (2020). “The development of Gaussian process regression for effective regional post‐earthquake building damage inference.” Computer-Aided Civil and Infrastructure Engineering. 36, no. 3 (2021): 264–288. doi:10.1111/mice.12630
Vandoni, Jennifer., Aldea, Emanuel., and Le Hégarat-Mascle, Sylvie. (2019). Evidential Query-By-Committee Active Learning for Pedestrian Detection in High-Density Crowds. Int. J. Approximate Reasoning 104, 166–184.
Waddell, Paul. (2002). UrbanSim: Modeling Urban Development for Land Use, Transportation, and Environmental Planning. J. Am. Plann. Assoc. 68 (3), 297–314. doi:10.1016/j.ijar.2018.11.007
Wu, Dongrui., Lin, Chin-Teng., and Huang, Jian. (2019). Active Learning for Regression Using Greedy Sampling. Inf. Sci. 474, 90–105. doi:10.1016/j.ins.2018.09.060
Wu, Dongrui. (2018). Pool-based Sequential Active Learning for Regression. IEEE Trans. Neural networks Learn. Syst. 30 (5), 1348–1359. doi:10.1109/TNNLS.2018.2868649
Yu, Hwanjo., and Kim, Sungchul. (2010). Passive Sampling for Regression. IEEE International Conference on Data Mining. 13-17 Dec. 2010, Sydney, NSW, Australia, IEEE, 1151–1156. doi:10.1109/ICDM.2010.9
Keywords: regional earthquake simulation, Gaussian process regression, passive sampling, loss assessment, damage estimation, surrogate modeling
Citation: Sheibani M and Ou G (2021) Accelerated Large-Scale Seismic Damage Simulation With a Bimodal Sampling Approach. Front. Built Environ. 7:677560. doi: 10.3389/fbuil.2021.677560
Received: 07 March 2021; Accepted: 12 April 2021;
Published: 04 May 2021.
Edited by:
Xinzheng Lu, Tsinghua University, ChinaReviewed by:
Chen Xiong, Shenzhen University, ChinaCopyright © 2021 Sheibani and Ou. This is an open-access article distributed under the terms of the Creative Commons Attribution License (CC BY). The use, distribution or reproduction in other forums is permitted, provided the original author(s) and the copyright owner(s) are credited and that the original publication in this journal is cited, in accordance with accepted academic practice. No use, distribution or reproduction is permitted which does not comply with these terms.
*Correspondence: Ge Ou, Z2Uub3VAdXRhaC5lZHU=
Disclaimer: All claims expressed in this article are solely those of the authors and do not necessarily represent those of their affiliated organizations, or those of the publisher, the editors and the reviewers. Any product that may be evaluated in this article or claim that may be made by its manufacturer is not guaranteed or endorsed by the publisher.
Research integrity at Frontiers
Learn more about the work of our research integrity team to safeguard the quality of each article we publish.