 Jochen Steffens
 Tobias Wilczek
 Stefan Weinzierl
94% of researchers rate our articles as excellent or good
Learn more about the work of our research integrity team to safeguard the quality of each article we publish.
Find out more
ORIGINAL RESEARCH article
Front. Built Environ., 13 May 2021
Sec. Indoor Environment
Volume 7 - 2021 | https://doi.org/10.3389/fbuil.2021.676009
This article is part of the Research TopicAcoustics in the Built Environment: a Challenge for Improving the Quality of LifeView all 14 articles
Sound and music are well-studied aspects of the quality of experience in restaurants; the role of the room acoustical conditions, their influence on the visitors’ soundscape evaluation and their impact on the overall customer satisfaction in restaurants, however, has received less scientific attention. The present field study therefore investigated whether sound pressure level, reverberation time, and soundscape pleasantness can predict factors associated with overall restaurant quality. In total, 142 persons visiting 12 restaurants in Berlin rated relevant acoustical and non-acoustical factors associated with restaurant quality. Simultaneously, the A-weighted sound pressure level (LA,eq,15) was measured, and the reverberation time in the occupied state (T20,occ) was obtained by measurements performed in the unoccupied room and a subsequent calculation of the occupied condition according to DIN 18041. Results from linear mixed-effects models revealed that both the LA,eq,15 and T20,occ had a significant influence on soundscape pleasantness and eventfulness, whereby the effect of T20,occ was meditated by the LA,eq,15. Also, the LA,eq,15 as well as soundscape pleasantness were significant predictors of overall restaurant quality. A comprehensive structural equation model including both acoustical and non-acoustical factors, however, indicates that the effect of soundscape pleasantness on overall restaurant quality is mediated by the restaurant’s atmosphere. Our results support and extend previous findings which suggest that the acoustical design of restaurants involves a trade-off between comfort and liveliness, depending on the desired character of the place.
Anecdotal evidence suggests that the acoustic conditions in many catering establishments are problematic, particularly due to high noise levels. Indeed, a recent survey among 13,000 Americans identified noise as the most bothersome irritation in restaurants across the US (24%), followed by poor service (23%), high prices (12%), and parking problems (10%) (Herklots, 2018). This finding is corroborated by studies demonstrating detrimental effects of unwanted sound on mood, overall satisfaction and intended revisit (Novak et al., 2010) as well as on the ability to communicate and the actual behavior in the room (Navarro and Pimentel, 2007; Meng et al., 2018). That is, restaurant guests offended by noise levels are more likely to leave prematurely, and less likely to return to that venue. While owners and managers often seem to be aware of such effects, they are reluctant to use room acoustics measures not only because of the costs but because they fear they will compromise their restaurants’ liveliness by room-acoustical modifications. Or as simply put by a chef-entrepreneur: ‘the second worst thing to a restaurant that is too noisy is a restaurant that is too quiet.’ (Lindborg, 2016, p. 309). These concerns are understandable, given the positive effects of particular soundscapes, for instance including musical, natural, or human sounds, or the masking effect of background sounds, ensuring the privacy of one’s conversation in a restaurant (e.g., Astolfi and Filippi, 2004; Tarlao et al., 2021). In this paper, we therefore aim to clarify further the contribution of (room-) acoustical parameters, soundscape evaluation, and non-acoustical factors to overall quality evaluation of restaurants.
As noted by Lindborg (2015), restaurants are vibrant social places whose design is subject to competing requirements. Here, various practical demands and decisions driven by visual design can lead to room-acoustical disadvantages. For example, the need to attract customers can lead to large windows toward the street, increasing the reverberation time. This increase can lead to a decrease of speech intelligibility and thus to a perceived need to raise one’s voice, resulting in an overall loudness increase in the restaurant known as the Lombard effect (Lombard, 1911; Junqua et al., 1999). Similar effects can be attributed to the need to give an impression of cleanliness, leading to hard and acoustically reflective floors and tabletop materials (Lindborg, 2015).
The acoustical quality requirements in rooms differ depending on a room’s use and are set in national standards such as the German DIN 18041 (DIN German Institute for Standardization, 2016; Nocke, 2017). For example, the requirements for classrooms including hearing-impaired students have been set high, whereas short-term stay areas, such as restaurants, have not. However, the recommendations for the acoustic design of gastronomic rooms are sometimes far apart. For example, while the DIN 18041 suggests a reverberation time of 0.85 s for a restaurant with a volume of 300 m2 and a ceiling height of 2.8 m, Rindel (2018) recommends a much shorter reverberation time of 0.38 s for the same room.
Surprisingly, research in the hospitality industry has paid scant attention to the acoustics of restaurants and its perception (Ryu and Han, 2011; Ponnam and Balaji, 2014). Studies dealing with the influence of the acoustic environment on patrons have predominantly considered music as a relevant factor (e.g., Caldwell and Hibbert, 2002); only a few studies also considered a possible influence of ambient noise (Antun, et al., 2010; Bitner, 1992). One study explicitly focusing on acoustical comfort in restaurants surveyed 11 restaurants and 825 patrons, and obtained acoustical comfort by the four parameters Privacy, Comfort, Quietude and Communication and also measured reverberation time and background noise level as acoustical factors (Battaglia, 2014). The results show that reverberation time predicted each one of the four comfort parameters; also, comfort was predicted by the sound pressure level. Battaglia (2014) concludes that reverberation times of 0.5–0.7 s are within the optimal range for perceived acoustical comfort. However, his study did not include reverberation times under 0.5 s, so the question remains whether a further lowering of the reverberation time might increase acoustical comfort.
In general, findings from consumer and soundscape research and music and environmental psychology suggest a high potential of soundscape design on food taste, atmosphere, and overall restaurant quality. For example, North (2012) showed that the taste of wine as rated by restaurant visitors can reflect background music's emotional connotation. Another study by Yan and Dando (2015) let participants taste multiple concentrations of solutions of five prototypic tastants, during conditions with or without broad-spectrum auditory stimulation, simulating airline cabin noise. Their results revealed that sweetness was rated significantly lower under noisy conditions, while no difference in intensity rating was observed for salty, sour, and bitter tastants. In contrast, umami was rated higher under noisy conditions. Further sound-taste correspondences were observed by Crisinel et al. (2012), who found that identical cinder toffees were rated significantly more bitter, while listening to a soundtrack connoted with bitterness than when listening to a soundtrack connoted with sweetness.
Regarding the atmospheric effect of sound, North and Hargreaves (1998) observed a positive effect of background music on a student cafeteria's general atmosphere. For instance, playing classical music positively affected visitors' willingness to spend more money on the products offered. Caldwell and Hibbert (2002) tested the effect of the tempo and preference of music being played on patrons’ behaviors and found that the enjoyment of the music positively predicted total money spent, enjoyment of dining, and intention to return and to recommend; by contrast, musical tempo did not show any significant effects.
Concerning the relative contribution of various influencing factors on overall restaurant evaluations, the Attribute-Value theory assumes that consumers rate services such as a restaurant meal in terms of a set of attributes (Kassarjian and Robertson, 1991). Each of these attributes has a certain level of importance to the customer, which can vary considerably by market segment. For example, some consumers might be attracted by a restaurant’s low price, while others by a restaurant’s upscale image and its food quality. The overall value is weighed up according to the individual importance of attributes and finally leads to deciding which restaurant is chosen by the consumer (Johns and Pine, 2002).
However, within the foodservice research, there is no consensus on the definition and importance of the individual quality dimensions. In their literature review, Johns and Pine (2002) found the principal dimensions to be choice and quality of food and drinks, the price for value, service quality, atmosphere, location and convenience. By contrast, in their theoretical work, Antun et al. (2010) only identified three general quality domains: the restaurant’s food, service and atmosphere, whereby the authors added a social and a healthfulness dimension. Regarding the relative importance of those dimensions, research has provided conflicting evidence. Food quality is mainly considered the most critical factor for restaurant diners. For example, Pettijohn et al. (1997) found that food quality, cleanliness, price and value have the greatest impact on the customer’s perception in fast food restaurants. These factors were recognized as the fundamental requirements, while atmosphere and menu variety had a lesser impact on customer satisfaction. By contrast, other scholars argue that the perception of service quality is the most decisive factor for diners’ intentions to return (Blose et al., 2019).
Again, we believe that the literature has not yet paid enough attention to potential (non-musical) acoustical factors, particularly concerning the question of which acoustical factors contribute to overall restaurant quality, and how large the potential effect is compared to the above-discussed non-acoustical factors. Therefore, we conducted a field study in 12 Berlin restaurants to triangulate research from room acoustics, soundscape, as well as consumer and hospitality research. Our study considered subject-centred measures on soundscape evaluation and non-acoustical restaurant quality dimensions as well as object-centred acoustical parameters in terms of the A-weighted equivalent continuous sound pressure level measured over a 15 min time interval (LA,eq,15) and the reverberation time in the occupied state (T20,occ).
To clarify the interrelation between the two object-centred acoustical parameters, we first tested whether reverberation time influenced the LA,eq,15 beyond the higher gain that naturally comes with more reverberation, indicating a change in communication behavior (H1a). Moreover, we expected that this effect would be moderated by the number of patrons in the restaurant (H1b).
In line with previous findings (e.g., Battaglia, 2014; Gozalo et al., 2015), we further hypothesized that the LA,eq,15 would negatively predict soundscape pleasantness (H2a). Similarly, we expected a negative influence of T20,occ on soundscape pleasantness (H2b). Similar effects of the acoustical parameters on soundscape eventfulness were assumed, however, with an inverse effect direction (H3a, H3b). However, based on H1, we expected that the effect of T20,occ on soundscape pleasantness and eventfulness would be mediated by the LA,eq,15 (H2c, H3c). The above-mentioned hypotheses regarding the relationship between object- and subject-centred acoustical variables are illustrated in Figure 1.

FIGURE 1. Hypothesized relationships between object- and subject-centred acoustical variables obtained in our study.
Finally, regarding the influence of acoustical parameters, we hypothesized that the LA,eq,15 (H4a) and soundscape pleasantness (H4b) would predict overall restaurant quality. It was expected that these effects remain significant even when controlling for other influencing factors, such as atmosphere, food quality, and service. This assumption was tested by establishing a comprehensive structural equation model (SEM) that predicts overall restaurant quality and considers the respective acoustical and non-acoustical factors and potential interrelationships.
To address our research questions, we conducted a field survey in 12 randomly selected restaurants in Berlin. Randomly selected patrons dining in the particular restaurant were asked to fill out the questionnaire during a period of three to 4 h on a regular service day. Depending on the manager’s preference, they were approached either by the author or the restaurant’s staff. Participants filled out the questionnaire on a tablet PC.
Eight to 17 guests per restaurant filled out the questionnaire, resulting in a total of 142 participants (mean age: 34.7 years, SD = 13.0). Fifty-one participants were male, 88 were female, two ‘divers’, and one person preferred not to disclose their gender. Eighty-seven participants had an academic degree, 40 had a general qualification for university entrance, 11 had a general certificate for secondary education, and four persons had no official education certificate. For 56.7% of the patrons, it was their first visit to the respective restaurant, whereas 28.7% and 14.6% of them reported repeated or regular visits, respectively.
The questionnaire consisted of four sections and 55 items (see Supplemental Material):
• 10 person-related items (age, gender, education, noise sensitivity, hearing impairment, mealtime, visitation motifs, frequency of visits)
• 23 restaurant quality items (10 quality items each as ‘importance’ and ‘performance’, willingness to recommend the restaurant and repeat visit, recommendations)
• 16 soundscape items
• 6 personality traits items (Extraversion and Neuroticism)
Eight Soundscape parameters (i.e., pleasant, chaotic, vibrant, uneventful, calm, annoying, eventful, monotonous) were assessed using a self-translated German version of the ISO/FDIS 12913–2 soundscape standard. Robust values for soundscape pleasantness and eventfulness were then calculated using the formulas proposed in the ISO standard. Restaurant quality and visitation motives were obtained by a self-translated German version of the questionnaire by Ponnam and Balaji (2014). Finally, the Big Five personality traits Extraversion and Neuroticism were measured by the German short inventory BFI-S (Gerlitz and Schupp, 2005).
For the LAeq15’ measurements, a NTI XL2 acoustic analyzer with class 1 measurement microphone (M2210) was used. The acoustical scenes were recorded in first-order ambisonics format using a Sennheiser Ambeo VR Mic to allow for acoustical simulation of the restaurant soundscape in the laboratory. The microphones were both placed in the guest room, close to a regular table at head height.
As room-acoustical measurements in the occupied state would have led to a considerable disturbance of the guests and employees and a threat to the ecological validity of the soundscape assessments, they were conducted in empty condition outside the restaurants’ opening hours. This was done using a self-constructed omnidirectional source (with reverse-horn principle), ‘DBX DriveRack RTA-M’ microphone, ‘Focusrite Scarlett 2i2’ interface and ‘Room EQ Wizard 5.19’ software. The measurement signal was a logarithmic sweep with a length of 256 k samples at a sampling rate of 44.1 kHz. Cooling aggregates and other noise sources were switched off where possible. To obtain values of T20,m,empty, third-octave band measurements from 125 to 4000 Hz were arithmetically averaged. The reverberation time in occupied state T20,occ was then calculated for the occupied condition at the moment of the questionnaire’s completion according to DIN 18041-3:2016 (2016) and used for further statistical analyses. Therefore, also the number of guests was assessed by manual count approximately every 15 min. Depending on the fluctuation speed, the count interval was shortened to five or extended to 30 min. Occupancy between these measurement intervals was estimated through linear interpolation. Restaurant attributes including the averaged LA,eq,15, the T20,occ for 80% occupancy, and further room attributes are presented in Table 1.

TABLE 1. Restaurant attributes and requirements according to the DIN 18041-3:2016 and Rindel (2018).
Guests were asked to fill out the questionnaire during 3 to 4 h on a regular service day. Depending on the manager’s preference, they were approached by the second author or the restaurant’s staff. They filled out the questionnaire on a tablet PC provided by the authors or on their own smartphone using the browser-based platform LimeSurvey. LA,eq,15 measurements were conducted during the questionnaire distribution, and measurements of the room acoustics were performed before or after opening hours under empty conditions.
LA,eq,15 measurements failed in one restaurant (ID 1) due to technical problems, and one restaurant declined the room acoustical measurement (ID 6). Also, one restaurant (ID 8) turned out to be a mixture of food service, hotel lobby, and café with different activities and affordances compared to a classical restaurant. It therefore behaved differently than the rest of the sample, and was thus considered an outlier and excluded from the analysis.
For each participant who visited one of the remaining restaurants used in our analysis, the timestamp of the questionnaire transfer was assigned to the respective LA,eq,15. Similarly, the present occupancy and the particular restaurant’s room acoustical measures were assigned to each questionnaire.
The fact that soundscape evaluations were performed by multiple patrons in different restaurants, resulted in data with a two-level structure: evaluations (persons) nested within restaurants. Therefore, several linear mixed-effects models (LMM) taking into account the two-level structure were computed to test our hypotheses. These models included a random intercept for each restaurant, while LA,eq,15, reverberation time, and soundscape pleasantness constituted fixed effects. To test for a non-linear, U-shaped relationship, the LMM was calculated with T20,occ and T20,occ2 as fixed effects. Significance tests were carried out with Type III tests of fixed effects via Satterthwaite’s degrees of freedom method. Marginal R2 were computed to obtain the variance in the respective dependent variable explained by the fixed effects (Nakagawa et al., 2013).
Before testing our hypotheses, a principal component analysis (PCA) on the non-acoustical quality items in the questionnaire was carried out, using orthogonal Varimax rotation (see Table 2). The Kaiser-Meyer-Olkin measure of sampling adequacy (= 0.74) and Bartlett’s test of sphericity (χ2 [36] = 449.75.2; p < 0.001) indicated substantial correlations amongst items to warrant a PCA. The scree-plot and the Kaiser criterion suggested a three-factor solution that explained 65% of the overall variance. Based on the factor loadings, the three resulting factors were named ‘product’, ‘atmosphere’, and ‘service’. Also, a factor ‘overall restaurant quality’ was established employing a CFA, utilizing the input variables ‘willingness to recommend restaurant’, ‘repeat visit’, and ‘recommend’.

TABLE 2. Results of the Principal component analysis–Varimax-rotated factor loadings of the non-acoustical restaurant quality items on the observed three underlying dimensions.
To combine the results of the CFA with classical regression approaches and to test for direct and indirect effects between the manifest acoustical and latent non-acoustical variables, a comprehensive model on overall restaurant quality was then computed using Structural Equation Modeling (SEM) approach (Kline, 2011). Also here, the different restaurants served as cluster variable in the analysis.
Statistical analyses were carried out using R and R Studio, including the packages lavaan (Rosseel, 2012), lme4 (Bates et al., 2015), lmertest (Kuznetsova et al., 2017) and ggplot2 (Wickham, 2016).
In the first step, the expected relationship between the A-weighted sound pressure level LA,eq,15 (dependent variable) and the reverberation time T20,occ (independent variable, H1a), and the moderating effect of the number of guests NGuests (H1b) were investigated. A linear mixed-effects model (LMM) revealed both significant main effects of T20,occ and NGuests, and an interaction effect of T20,occ × NGuests, providing empirical support for both hypotheses (see Table 3). The model explains 53.4% of the variance of the LA,eq,15 values.

TABLE 3. Table of fixed effects from a linear-mixed-effects model predicting the A-weighted sound pressure level through reverberation time (T20,occ) and the number of restaurant guests (NGuests).
To clarify the relationship between the two soundscape dimensions, we computed a first LMM which revealed that soundscape eventfulness significantly predicted soundscape pleasantness, F (1,157.6) = 2.65, β= −0.176, p = 0.03. The low amount of shared variance (R2marginal = 0.032), however, warrants the independent consideration of the two dimensions in the course of the following analyses.
Concerning the relationship between acoustical parameters and soundscape dimensions, a second LMM revealed that the A-weighted sound pressure level constituted a significant negative predictor of soundscape pleasantness, confirming H2a, F (1.17.7) = 9.07, β= −0.034, p < 0.01. The LA,eq,15 explained 11.4% of the overall variance of the dependent variable (R2marginal = 0.114). The relationship between the two variables as obtained in the different restaurants is depicted in Figure 2.
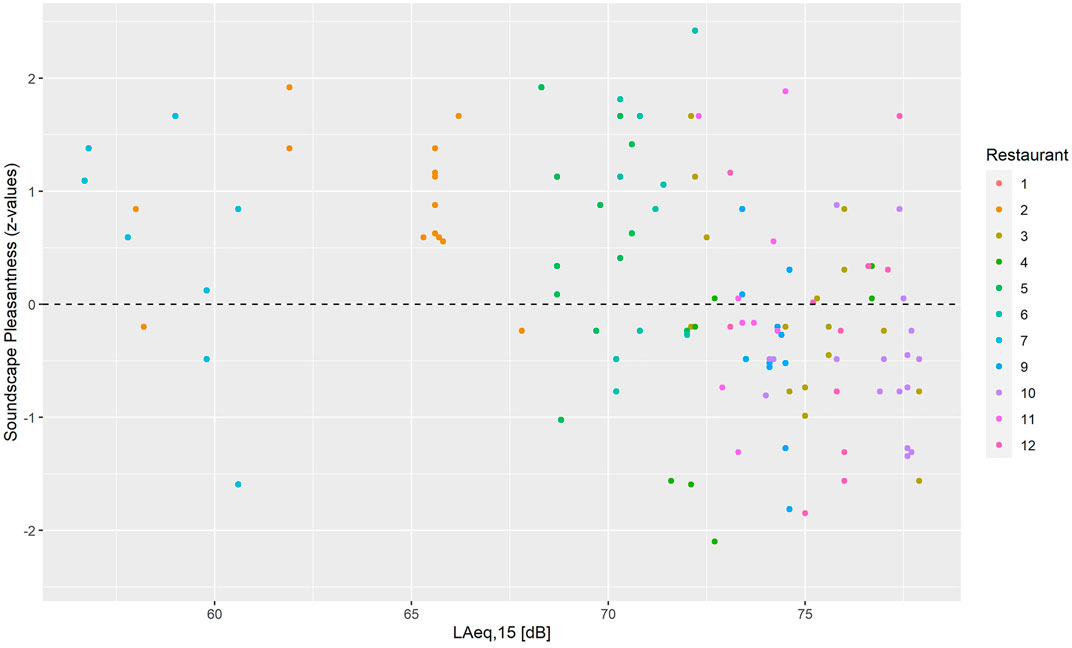
FIGURE 2. LA,eq,15 values and z-standardized soundscape pleasantness judgements.
Also, a third LMM utilizing T20,occ as independent variable showed a significant influence of reverberation time on soundscape pleasantness, confirming H2b, F (1.12.9) = 5.87, β= −0.040, p = 0.03. The T20,occ explained 8.5% of the overall variance of the dependent variable (R2marginal = 0.085). The relationship between the two variables as obtained in the different restaurants is depicted in Figure 3.
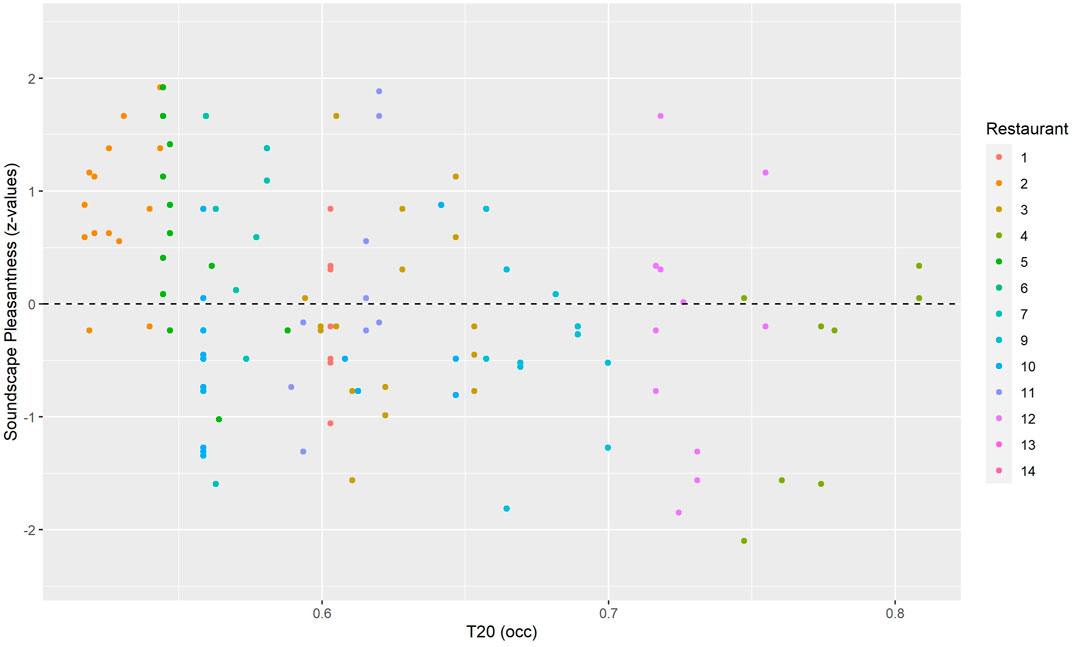
FIGURE 3. T20,occ values and z-standardized soundscape pleasantness judgements.
This effect of T20,occ, however, disappeared when controlling for LA,eq,15, suggesting no impact of reverberation beyond the amplification of the sound level given for physical reasons (H2c). Indeed, a mediation analysis confirmed our hypothesis, as illustrated in Figure 4. Following the approach by Preacher and Hayes (2004), we applied a bootstrapping approach for significance testing. Here, a bias-corrected bootstrapped confidence interval with 10,000 samples did not include zero for the effect of T20,occ on LA,eq,15, 95% CI [0.079 1.439], and of LA,eq,15 on soundscape pleasantness, 95% CI [−0.488–0.077], whereas it included zero for the non-significant direct effect of T20,occ on soundscape pleasantness, 95% CI [−0.559, 0.014].

FIGURE 4. Mediation analysis on acoustical parameters predicting soundscape pleasantness. Note: The estimates represent standardized regression coefficients β, and the asterisks indicate the significance of the respective effects, *p < 0.05, **p < 0.01, as obtained by the SEM routine of the Lavaan Package in R/RStudio.
Regarding the effect of acoustical parameters on soundscape eventfulness, another LMM confirmed our hypothesis H3a that the A-weighted sound pressure level positively predicts soundscape eventfulness, F (1,18.5) = 4.71, β= 0.50, p < 0.01, explaining 24.1% of the overall variance of the dependent variable (R2marginal = 0.241). By contrast, reverberation time did not show a significant effect on soundscape eventfulness. This was true in case of a model that only included the linear term of T20,occ, F (1, 17.2) = 1.69, β = −0.35, p = 0.21, but also for a model that tested for a non-linear, quadratic effect of reverberation time while controlling for a potential linear effect, T20,occ2, F (1, 49.3) = 0.00, β = 0.13, p = 0.97; T20,occ,F (1, 54.0) = 0.02, β = −0.49, p = 0.89. Therefore, our results failed to reject the null hypothesis associated with H3b.
Notwithstanding, due to the above shown, significant association between LA,eq,15 and T20,occ (H1a), we conducted another mediation analysis which suggests an indirect effect of reverberation time on soundscape eventfulness, mediated by the A-weighted sound pressure level (see Figure 5). Again, the bias-corrected bootstrapped confidence intervals did not include zero for the significant effects, T20,occ → LA,eq,15, 95% CI [0.079 1.439], LA,eq,15 → soundscape eventfulness, 95% CI [0.427 0.706]. By contrast, they included zero for the non-significant direct effect of T20,occ on soundscape eventfulness, 95% CI [−0.432, 0.026].

FIGURE 5. Mediation analysis on acoustical parameters predicting soundscape eventfulness. Note: The estimates represent standardized regression coefficients β, and the asterisks indicate the significance of the respective effects, *p < 0.05, **p < 0.01, as obtained by the SEM routine of the Lavaan Package in R/RStudio.
In the next step, we tested our fourth hypothesis stating that acoustical parameters, namely the sound pressure level (H4a) and reverberation time (H4b), would also predict overall restaurant quality. Therefore, we computed two further LMMs which revealed that the LA,eq,15 negatively predicted overall restaurant quality, F (1.20.3) = 7.27, β = −0.33, p = 0.01, confirming H4a. Here, LA,eq,15 explained 9.6% of the variance of overall restaurant quality as rated by the patrons (R2marginal = 0.096). Again, results did not provide any empirical support for a direct effect of reverberation time, T20,occ: F (1, 10.4) = 0.91, β = −0.16, p = 0.36, thus failing to reject the null hypothesis associated with H4b.
Finally, we conducted a third mediation analysis, which also suggests an indirect effect of reverberation time on overall restaurant quality, mediated by the A-weighted sound pressure level (see Figure 6). Again, the bias-corrected bootstrapped confidence intervals did not include zero for the significant effects, T20,occ → LA,eq,15, 95% CI [0.079 1.439], LA,eq,15 → overall restaurant quality, 95% CI [-0.437–0.116]. By contrast, they included zero for the non-significant direct effect of T20,occ on overall restaurant quality, 95% CI [--0.354, 0.402].

FIGURE 6. Mediation analysis on acoustical parameters predicting overall restaurant quality. Note: The estimates represent standardized regression coefficients β, and the asterisks indicate the significance of the respective effects, *p < 0.05, **p< 0.01, as obtained by the SEM routine of the Lavaan Package in R/RStudio. Structural equation model including acoustical and non-acoustical parameters.
The following analysis aimed to integrate object- and subject-centred acoustical parameters as well as non-acoustical quality factors in a comprehensive structural equation model (SEM) predicting overall restaurant quality. Concerning the non-acoustical quality factors, we utilized the items and the factor structure obtained by the PCA (see Section Data Analysis). We assumed that all three non-acoustical quality factors ‘atmosphere’, ‘service’, and ‘product’ measured by their assigned items would positively contribute to overall restaurant quality. Based on the results obtained in the previous sections, we further expected a direct influence of the A-weighted sound pressure level on both soundscape pleasantness and restaurant quality (H4a). Finally, we hypothesized a direct influence of soundscape pleasantness on restaurant quality (H4b). Conducting a first SEM model revealed insufficient model fits, χ2(78) = 859.3, p < 0.01, RMSEA = 0.097, SRMR = 0.120, CFI = 0.897 (robust measures). Accordingly, modification indices (mi) were obtained, which suggested removing the direct effect of soundscape pleasantness on restaurant quality (mi = 19.3) and instead adding a regression path to ‘atmosphere’ (mi = 24.0). Also, adding a path from ‘product’ to soundscape pleasantness was indicated (mi = 13.8). As all three steps were considered useful and are supported by the literature (e.g., North and Hargreaves, 1998; Antun et al., 2010; Yan and Dando, 2015), we computed a modified SEM. According to thresholds reported by Kline (2011), the SEM yielded acceptable to good model fit indices, χ2(78) = 859.3, p < 0.01, RMSEA = 0.072, SRMR = 0.095, CFI = 0.942. The model paths are illustrated by Figure 7. The final model thus confirms H4a regarding the effect of the LA,eq,15. By contrast, it does not provide empirical support for the assumed direct effect of soundscape pleasantness on restaurant quality (H4b); it rather suggests that this effect is mediated by the atmosphere of a restaurant.

FIGURE 7. Structural equation model predicting restaurant quality, including acoustical and non-acoustical factors. Note: The estimates represent standardized regression coefficients β, and the asterisks indicate the significance of the respective effects, *p < 0.05, **p< 0.01, as obtained by the SEM routine of the Lavaan Package in R/RStudio.
Finally, we explored whether the two obtained Big Five dimensions Extraversion and Neuroticism which have been shown to predict soundscape evaluations in previous studies (e.g., Steffens et al., 2017) would be associated with pleasantness and eventfulness judgements or the choice of a particular restaurant. Here, no LMM revealed a significant relationship between soundscape and Big Five dimensions (all ps > 0.05). By contrast, an ANOVA with the different restaurants (nominal scale) as independent and the patrons’ extraversion scores (interval scale) as dependent variable revealed that the extraversion scores significantly differ across restaurants, F (1,12) = 2.96, p < 0.01, R2 = 0.194. This finding suggests that individuals choose restaurants, which fit and/or support their personality. However, no such an effect was shown for the Big Five dimension ‘Neuroticism’ (p = 0.38).
In our study, we investigated the relationship between object- and subject-centred acoustical factors and non-acoustical quality parameters as well as their contribution to the overall evaluation of restaurants. One major aim of our study was to investigate whether soundscape pleasantness and eventfulness in restaurants can be predicted by acoustical measures, namely the A-weighted sound pressure level and the reverberation time in the occupied state. Results confirmed our assumptions that loudness-associated measures and room-acoustical conditions significantly predict both soundscape pleasantness and eventfulness. The negative effect of (unwanted) loud sounds on soundscape pleasantness is widely in line with previous studies (e.g., Novak et al., 2010; Herklots, 2018). However, they contradict findings by Tarlao et al. (2021) who observed a positive influence of sound level on soundscape pleasantness, but who also dealt with generally lower sound levels and music as predominant sound source in the restaurant. This discrepancy indeed suggests non-linear effects in terms of an inverted U-shape and an optimal sound level in the mid-range. Further investigating this optimal medium level depending on the predominant sound source and the character of the restaurant should thus be subject to future research.
Results further indicate that the reverberation time is effective only through the increase in sound level it triggers. This amplification can lead to patrons increasingly raising their speech level to ensure intelligibility, resulting in a negative feedback loop of amplification. This assumption is supported by the fact that, in our study, the effect of reverberation time on the LA,eq,15 was moderated by the number of patrons in the restaurant.
The second major aim was to study the influence of subject- and object-centred acoustical parameters on overall restaurant quality while considering other relevant non-acoustical parameters. The results of the SEM suggest that the LA,eq,15 constitutes a (direct) negative predictor of overall restaurant quality. This finding corroborates previous findings by Battaglia (2014) and highlights a potential sensory annoyance caused by high-noise restaurant environments leading to a worsened overall experience. Moreover, the final SEM suggests that soundscape pleasantness affects overall restaurant quality only indirectly, mediated by the atmosphere. This finding emphasizes the need to design actively the restaurant’s acoustical atmosphere beyond pure loudness reduction and to consider non-musical sounds when researching restaurant atmosphere.
Conversely, the results of the linear mixed-effects model suggest that, analogously to the above-mentioned effect on soundscape evaluation, the effect of reverberation time on restaurant quality was mediated by the A-weighted sound pressure level. This finding slightly contradicts previous results by Battaglia (2014) and Rindel (2018) who observed direct effects of reverberation time on restaurant quality, but who also did not control for potential mediation effects.
Based on the findings of object-centred acoustical parameters on soundscape and restaurant quality assessments, we argue that restaurants dealing with high sound pressure levels should consider room acoustical treatment. Here, personal communication with some Berlin restaurant owners who declined participation revealed that many managers are aware of acoustical problems, but they do not want to draw their guests’ attention to it. Notwithstanding, many restaurants, which would be considered problematic in the light of our results, seem to be running successful businesses. Hence, poor acoustics might not necessarily predict a lack of commercial success, but it is a decisive influencing factor of perceived overall quality and atmosphere. Of course, whether the acoustic atmosphere is an essential attribute mainly depends on the restaurant’s market segment. Does it deliver services or experiences? If selling service is prioritized, it may be more goal-oriented to invest resources in high quality of food and service. This approach may be adequate in fast-food services, bistros, or take-aways. If, however, the guest is meant to undergo a memorable experience during their visit, as indicated by a shift from service to experience economy (Pine and Gilmore, 1998), attention needs to be drawn to atmospherics, covering all the senses, including the auditory one. As suggested by our results, the preference for certain restaurants and its atmospherics might also be governed by person-related variables, such as Extraversion. Here, it could be assumed that an extraverted person might feel more comfortable in a lively as opposed to a calm restaurant environment. However, more research is needed to elaborate further on such relationships.
A couple of limitations associated with the study design have to be addressed. For example, our sample is biased by a non-random self-selection process. In particular, participants could only be picked from a group of people who chose to dine at one of the 12 restaurants. That is, persons disliking busy restaurants with high noise levels might be systematically underrepresented in our study. Moreover, as we could not manipulate any variables in this field study, we could only observe correlations, not allowing to draw definite causal directions. Thus, some observed effects could also be interpreted oppositely. For example, patrons who rate the overall quality of the restaurant highly might be more relaxed and happy, which might result in an overall more positive soundscape compared to an acoustical environment created by annoyed patrons. Thus the observed effects, as well as the established structural equation model, should be validated in the course of multiple laboratory studies, for instance, in a virtual environment. Finally, due to limited resources and time restrictions related to the questionnaire, we could not obtain more potentially relevant variables, such as behavioral measures (e.g., duration of stay or money spent) or acoustical and non-acoustical parameters, for example, speech intelligibility, privacy, the visual design, or the ‘hipness’ of a restaurant. Also, we did not consider psychoacoustical metrics or audio features which might be better suited to predict pleasantness and quality evaluations. However, increasing the number of variables in our models would also increase the required sample size to a considerable degree. Here, we experienced that convincing restaurants to participate is not an easy task, because, understandably, managers do not want to disturb their guests nor do they want to draw their attention to a potentially flawed aspect of their restaurant. This also led to limited statistical power, particularly related to observing small effects of the room acoustics beyond pure sound-amplification processes.
Notwithstanding, our results have demonstrated that high sound levels negatively affect both the pleasantness of the soundscape and the overall quality of a restaurant. As an ‘amplifier’ for the sound level in the room, also the reverberation time of the room has a significant influence on both variables. Thus, our study clearly demonstrates the value of an acoustical design of restaurants and the associated investments. Such design should be guided by the desired atmosphere, which our study found to be critical in determining how strongly and in what way soundscape pleasantness affects the perceived overall quality of a restaurant.
The raw data supporting the conclusion of this article will be made available by the authors, without undue reservation.
Ethical review and approval was not required for the study on human participants in accordance with the local legislation and institutional requirements. The patients/participants provided their written informed consent to participate in this study.
JS, TW, and SW designed the study. TW collected data. JS and TW developed and performed the statistical analysis. JS and TW wrote the first draft of the manuscript. All authors interpreted data, reviewed, and edited the manuscript, and approved the final version of the manuscript.
The authors declare that the research was conducted in the absence of any commercial or financial relationships that could be construed as a potential conflict of interest.
We thank all Berlin restaurants for taking part in the study and for allowing us to take the acoustical measurements.
The Supplementary Material for this article can be found online at: https://www.frontiersin.org/articles/10.3389/fbuil.2021.676009/full#supplementary-material
Antun, J. M., Frash, R. E., Costen, W., and Runyan, R. C. (2010). Accurately Assessing Expectations Most Important to Restaurant Patrons: The Creation of the DinEX Scale. J. Foodservice Business Res. 13 (4), 360–379. doi:10.1080/15378020.2010.524539
Astolfi, A., and Filippi, M. (2004). Good Acoustical Quality in Restaurants: a Compromise between Speech Intelligibility and Privacy. Proceedings of the International Congress on Acoustics (ICA), Kyoto, Japan.
Bates, D., Mächler, M., Bolker, B., and Walker, S. (2015). Fitting Linear Mixed-Effects Models Using Lme4. J. Stat. Softw. 67 (1). doi:10.18637/jss.v067.i01
Battaglia, P. L. (2014). Achieving Acoustical Comfort in Restaurants. in Proceedings of the 168th Meeting of the Acoustical Society of America. Indianapolis, IN, United States, 27–31 October 2014, 15001.
Bitner, M. J. (1992). Servicescapes: The Impact of Physical Surroundings on Customers and Employees. J. Marketing 56 (2), 57–71. doi:10.2307/1252042
Blose, J. E., Frash, R. E., and DiPietro, R. B. (2019). A Top Box Analysis of DinEX to Optimize Restaurant Resources. Int. J. Hospitality Tourism Adm. 20 (2), 156–181. doi:10.1080/15256480.2017.1359732
Caldwell, C., and Hibbert, S. A. (2002). The Influence of Music Tempo and Musical Preference on Restaurant Patrons' Behavior. Psychol. Mark. 19 (11), 895–917. doi:10.1002/mar.10043
Crisinel, A.-S., Cosser, S., King, S., Jones, R., Petrie, J., and Spence, C. (2012). A Bittersweet Symphony: Systematically Modulating the Taste of Food by Changing the Sonic Properties of the Soundtrack Playing in the Background. Food Qual. Preference 24 (1), 201–204. doi:10.1016/j.foodqual.2011.08.009
DIN German Institute for Standardization (2016). Acoustic Quality in Rooms - Specifications and Instructions for the Room Acoustic Design. DIN 18041-3:2016).
Gerlitz, J.-Y., and Schupp, J. (2005). Zur Erhebung der Big-Five-basierten Persoenlichkeitsmerkmale im SOEP: [On the measurement of the Big Five-based personality traits in the SOEP]. DIW Res. Notes 4, 2005.
Gozalo, G. R., Carmona, J. T., Morillas, J. B., Vílchez-Gómez, R., and Escobar, V. G. (2015). Relationship between Objective Acoustic Indices and Subjective Assessments for the Quality of Soundscapes. Appl. Acoust. 97, 1–10. doi:10.1016/j.apacoust.2015.03.020
Herklots, T. (2018). Zagat Releases 2018 Dining Trends Survey. Available at: https://zagat.googleblog.com/2018/01/zagat-releases-2018-dining-trends-survey.html (Accessed February 1, 2021).
Kassarjian, H. H., and Robertson, T. (1991). Perspectives in Consumer Behavior. 4th ed. (Englewood Cliffs (NJ): Prentice-Hall).
Johns, N., and Pine, R. (2002). Consumer Behaviour in the Food Service Industry: a Review. Int. J. Hospitality Manage. 21 (2), 119–134. doi:10.1016/s0278-4319(02)00008-7
Junqua, J.-C., Fincke, S., and Field, K. (1999). The Lombard Effect: a Reflex to Better Communicate with Others in Noise. In 1999 IEEE International Conference on Acoustics, Speech, and Signal Processing. Proceedings. ICASSP99, (2083–2086). IEEE. doi:10.1109/icassp.1999.758343
Kline, R. B. (2011). “Principles and Practice of Structural Equation Modeling,” in Methodology in the Social Sciences. 3rd ed. (New York: Guilford Press).
Kuznetsova, A., Brockhoff, P. B., and Christensen, R. H. B. (2017). lmerTest Package: Tests in Linear Mixed Effects Models. J. Stat. Softw. 82 (13), 1–26. doi:10.18637/jss.v082.i13
Lindborg, P. (2016). A Taxonomy of Sound Sources in Restaurants. Appl. Acoust. 110, 297–310. doi:10.1016/j.apacoust.2016.03.032
Lindborg, P. (2015). Psychoacoustic, Physical, and Perceptual Features of Restaurants: A Field Survey in Singapore. Appl. Acoust. 92, 47–60. doi:10.1016/j.apacoust.2015.01.002
Lombard, E. (1911). Le signe de l'elevation de la voix [The sign of voice raising]. Ann. Mal. De L'oreille Du Larynx 37, 101–119.
Meng, Q., Zhao, T., and Kang, J. (2018). Influence of Music on the Behaviors of Crowd in Urban Open Public Spaces. Front. Psychol. 9, 2763. doi:10.3389/fpsyg.2018.00596
Nakagawa, S., Schielzeth, H., and O'Hara, R. B. (2013). A General and Simple Method for obtainingR2from Generalized Linear Mixed-Effects Models. Methods Ecol. Evol. 4 (2), 133–142. doi:10.1111/j.2041-210x.2012.00261.x
Navarro, M. P. N., and Pimentel, R. L. (2007). Speech Interference in Food Courts of Shopping Centres. Appl. Acoust. 68 (3), 364–375. doi:10.1016/j.apacoust.2006.01.006
Nocke, C. (2017). German DIN 18041 Acoustic Quality in Rooms. The J. Acoust. Soc. America 141 (5), 3686. doi:10.1121/1.4988020
North, A. C., and Hargreaves, D. J. (1998). The Effect of Music on Atmosphere and Purchase Intentions in a Cafeteria1. J. Appl. Soc. Pyschol 28 (24), 2254–2273. doi:10.1111/j.1559-1816.1998.tb01370.x
North, A. C. (2012). The Effect of Background Music on the Taste of Wine. Br. J. Psychol. 103 (3), 293–301. doi:10.1111/j.2044-8295.2011.02072.x
Novak, C. C., La Lopa, J., and Novak, R. E. (2010). Effects of Sound Pressure Levels and Sensitivity to Noise on Mood and Behavioral Intent in a Controlled Fine Dining Restaurant Environment. J. Culinary Sci. Tech. 8 (4), 191–218. doi:10.1080/15428052.2010.535756
Pettijohn, L. S., Pettijohn, C. E., and Luke, R. H. (1997). An Evaluation of Fast Food Restaurant Satisfaction. J. Restaurant Foodservice Marketing 2 (3), 3–20. doi:10.1300/j061v02n03_02
Pine, B. J., and Gilmore, J. H. (1998). Welcome to the Experience Economy. Harv. Bus Rev. 76 (4), 97–105.
Ponnam, A., and Balaji, M. S. (2014). Matching Visitation-Motives and Restaurant Attributes in Casual Dining Restaurants. Int. J. Hospitality Manage. 37, 47–57. doi:10.1016/j.ijhm.2013.10.004
Preacher, K. J., and Hayes, A. F. (2004). SPSS and SAS Procedures for Estimating Indirect Effects in Simple Mediation Models. Behav. Res. Methods Instr. Comput. 36 (4), 717–731. doi:10.3758/bf03206553
Rindel, J. H. (2018). Suggested Acoustical Requirements for Restaurants, Canteens, and Cafeterias. In Baltic-Nordic Acoustics Meeting 2018, Reykjavik, Iceland, 15–18, April 2018.
Rosseel, Y. (2012). Lavaan: An R Package for Structural Equation Modeling and More. Version 0.5–12 (BETA). J. Stat. Softw. 48 (2), 1–36. doi:10.18637/jss.v048.i02
Ryu, K., and Han, H. (2011). New or Repeat Customers: How Does Physical Environment Influence Their Restaurant Experience? Int. J. Hospitality Manage. 30 (3), 599–611. doi:10.1016/j.ijhm.2010.11.004
Steffens, J., Steele, D., and Guastavino, C. (2017). Situational and Person-Related Factors Influencing Momentary and Retrospective Soundscape Evaluations in Day-To-Day Life. J. Acoust. Soc. America 141 (3), 1414–1425. doi:10.1121/1.4976627
Tarlao, C., Fernandez, P., Frissen, I., and Guastavino, C. (2021). Influence of Sound Level on Diners' Perceptions and Behavior in a Montreal Restaurant. Appl. Acoust. 174, 107772. doi:10.1016/j.apacoust.2020.107772
Keywords: comfort, gastronomy acoustics, soundscape, room acoustics, reverberation time, restaurant quality, restaurant acoustics, noise
Citation: Steffens J, Wilczek T and Weinzierl S (2021) Junk Food or Haute Cuisine to the Ear? – Investigating the Relationship Between Room Acoustics, Soundscape, Non-Acoustical Factors, and the Perceived Quality of Restaurants. Front. Built Environ. 7:676009. doi: 10.3389/fbuil.2021.676009
Received: 04 March 2021; Accepted: 27 April 2021;
Published: 13 May 2021.
Edited by:
Arianna Astolfi, Politecnico di Torino, ItalyReviewed by:
Catherine Guastavino, McGill University, CanadaCopyright © 2021 Steffens, Wilczek and Weinzierl. This is an open-access article distributed under the terms of the Creative Commons Attribution License (CC BY). The use, distribution or reproduction in other forums is permitted, provided the original author(s) and the copyright owner(s) are credited and that the original publication in this journal is cited, in accordance with accepted academic practice. No use, distribution or reproduction is permitted which does not comply with these terms.
*Correspondence: Jochen Steffens, am9jaGVuLnN0ZWZmZW5zQGhzLWR1ZXNzZWxkb3JmLmRl
Disclaimer: All claims expressed in this article are solely those of the authors and do not necessarily represent those of their affiliated organizations, or those of the publisher, the editors and the reviewers. Any product that may be evaluated in this article or claim that may be made by its manufacturer is not guaranteed or endorsed by the publisher.
Research integrity at Frontiers
Learn more about the work of our research integrity team to safeguard the quality of each article we publish.