 Jianyu Zhao
 Ergo Pikas
 Olli Seppänen
 Antti Peltokorpi
- Department of Civil Engineering, Aalto University, Espoo, Finland
Lean construction methods have demonstrated potential to improve construction productivity. For example, the location-based management system and the last planner system have increased the reliability of planning and control in construction production. However, these benefits are often reduced because of inaccurate manual data collection. To alleviate these problems, technologies for automated monitoring of workers have been developed to identify site events in chaotic environments. This paper aims to investigate whether a Bluetooth low-energy-based real-time indoor positioning system can monitor task progress from workers’ presence. Our findings suggest that the proposed system is a feasible solution for monitoring task-level progress when there are explicit dependencies between tasks. This method could automatically detect task start and finish times and estimate the hours required to complete a task. This enables the measurement of waste hidden inside tasks, which allows for interventions for improving flows and eliminating waste.
Introduction
Construction sites are often chaotic places, and any semblance of a smooth production workflow is frequently disrupted. These disruptions are often caused by the unreliable flow of work prerequisites, creating trade-offs to improvise and work under suboptimal conditions (known as making do) (Ballard, 2000; Bertelsen, 2003). These trade-offs can cause unplanned, wasteful activities, such as waiting for/after other workers, rework, and non-value-adding movements between work locations (Sacks et al., 2010). Frequent workflow disruptions also hinder a comprehensive understanding of the real-time situation on site (Sacks et al., 2010). According to the lean construction method, workflow variability is a key root cause for waste (Arashpour and Arashpour, 2015). Thus, to improve productivity and decrease waste, it is critical to measure and address variability.
Lean production principles and methods for construction production planning and control have been developed to address workflow variability (Thomas et al., 2002). For example, Takt planning and control (TPC) (Tarek et al., 2014), the last planner system (LPS), the location-based management system (LBMS), and their combinations (Seppänen et al., 2010) have demonstrated benefits in reducing the amount of non-value-adding time in construction processes, known as waste, and improving the utilization of resources (Seppänen et al., 2010, 2014; Heinonen and Seppänen, 2016).
In Takt planning and control, variability is reduced by decreasing the batch size and standardizing the process using small areas with consistent duration (Takt time) and making any deviations visible to all. To protect against remaining variability, capacity buffers are used in each Takt area. Case studies have reported improved productivity and resource utilization and reduced cycle times (Frandson and Tommelein, 2014; Frandson et al., 2015; Heinonen and Seppänen, 2016). The LPS was developed to support project teams in creating a network of commitments and reliable workflows through continuous learning and improvement, for example, by measuring the percent plan complete (PPC) and addressing any failures by using a root cause analysis (Ballard, 2000). The LBMS is used to plan continuous workflow to maximize learning effects and prevent the risk of waiting and additional mobilization. Furthermore, when data on actual production rates and labor consumption are collected, the LBMS can be used to predict and identify future clashes between tasks, which would potentially cause cascading delays (Kenley and Seppänen, 2009; Frandson et al., 2015). What is common to all these different methods is the goal of improving the reliability of construction production workflow. Progress monitoring is an essential part of these methods.
However, research has shown that the real-time data collection of accurate progress information is a key challenge in production control (Seppänen et al., 2014). First, the manual daily reporting of work progress by workers often results in incorrect judgments and human error (Goodrum et al., 2006; Costin et al., 2012). Second, direct observations by production personnel for data recording and collection are seldom able to provide useful and timely information to respond to rapidly changing site conditions (Akhavian and Behzadan, 2016). Third, the manual monitoring and progress control of construction work is resource-intensive in the context of many parallel works requiring a substantial amount of resources. For example, Kala et al. (2012) found that the full-scale implementation of the LBMS was time-consuming, resulting in an average of 9.2 h for data collection and progress reviews per week.
Decentralizing and automating progress data collection could help improve production control. Mobile applications for self-reporting the actual start and finish dates have been developed (Dave et al., 2014; Zhao et al., 2019), but workers or superintendents may not self-report accurately. Zhao et al. (2019) proposed that automated real-time progress monitoring of tasks and workers’ presence could improve construction production control activities. However, their analysis focused on the accuracy and coverage of the Bluetooth low energy (BLE) system and workers’ presence on the project level; a task-level analysis was left for further research (Zhao et al., 2019). The expected benefits of automated production control include (1) avoidance of errors caused by manual data collection and (2) rapid and accurate forecasts to facilitate the LBMS or other location-based methods by eliminating delays caused by manual data entry (Costin et al., 2012). Furthermore, automated progress monitoring could be used to estimate work effectiveness by looking at the patterns of workers’ uninterrupted presence (Zhao et al., 2019).
In the current study, we develop and implement an indoor positioning system that tracks workers’ locations to support data collection at the task level. This research aims to demonstrate the proof of concept by realizing the proposed method and expanding the discussion to other case types for elaboration in future research. Therefore, in this study, system development is confined to work locations with strict workflow dependencies. In the discussion, we address the developed method’s generalizability and opportunities to adopt the proposed method in other contexts of project types. Specifically, we aim to automate the identification of task start and finish times based on heuristics to estimate the variability of work processes. For that, workers’ uninterrupted presence in work locations is measured at the task level (e.g., bathrooms). The system is validated by comparing the results to original schedules and self-report progress data from workers.
Task Management and Production Control in Construction
The proper management of construction tasks for the effective utilization of resources is critical for the coordinated and timely delivery of construction projects (Lu and Li, 2003). Many theories and methods regarding task planning and control in construction projects have been developed. The critical path method (CPM), which has been used since its creation in the 1950s, has benefited the construction industry in some areas, such as planning and controlling projects and communicating plans (Castro-Lacouture et al., 2009). However, researchers have called for a shift from monthly CPM schedule updates to more real-time control (Seppänen et al., 2010).
As a partial solution, location-based approaches based on weekly control have been proposed (Kenley and Seppänen, 2009) to optimize task schedule and enforce a continuous workflow (Frandson et al., 2015) by requiring details about actual crew sizes, quantities, and start and finish dates, along with suspensions for each task at each location (Seppänen et al., 2010). Typically, a weekly interval for control actions is used to ensure continuity. Researchers have also proposed focusing on look-ahead planning (make tasks ready for execution) on the specification of the hand-offs between trades, and on prioritizing the completion of tasks that require a large space for material laydown and work execution (Seppänen et al., 2013). Often, production problems are revealed only on a weekly basis (e.g., in Seppänen et al., 2013) because the chosen resolution of production control is a 1 week time frame. A weekly frequency of production control also delays the information on task progress needed to make production management decisions.
A weekly frequency is insufficient to evaluate factors impacting productivity because this requires understanding how time is spent when conducting an activity. Traditionally, productivity has been investigated with observations (Costin et al., 2012); however, human inspections and observations are tedious and not feasible for conducting continuously on a construction site due to the slow process of data collection and analysis (Akhavian and Behzadan, 2016). In order to automate tracking, researchers have explored the use of computer vision-based techniques (Yang et al., 2016; Luo et al., 2018; Konstantinou et al., 2019).
Current state-of-the-art vision-based techniques support the identification of several types of activities and the detection of task completion levels (Luo et al., 2018). The limitation of vision-based approaches is that they require large datasets for training the system (Zhao et al., 2019). Furthermore, problems of false negatives and false positives, such as occlusion, remain in state-of-the-art solutions (Park and Brilakis, 2016). It is critical to estimate the time resources engaged in value-adding and non-value-adding activities for production control purposes. In many cases, non-value-adding activities require the sensing of movement. In order to detect movement with a vision-based system, the system needs to address both detection and tracking because detection itself cannot differentiate resources of the same type. Thus, movement trajectory data are unavailable from detection-only methods (Park and Brilakis, 2016). This limitation can be solved by tracking methods. Still, the initiation of the vision-based tracking function demands the location of the tracked resources to be determined on their first appearance in the view. Therefore, compared with indoor positioning methods, the mismatch error of the tracking based on vision technologies can be propagated and affect later matching of other pairs (Zhang et al., 2018), which potentially hinders task start and finish recognition when it comes to task progress management. Also, existing vision-based tracking methods lack applicability because they usually require human operators to calibrate monitoring when encountering congestion. Construction workers often need to wear specific clothes, such as hi-vis apparel, to create a necessary tracking environment for image recognition (Konstantinou et al., 2019).
Alternatively, apart from vision-based approaches that usually rely on site cameras, mobile-based applications have been used to recognize and classify workers’ activities onsite (Akhavian and Behzadan, 2016). In these instances, data collection has been conducted by embedded accelerometers and gyroscope sensors to capture the body movement of workers and enable automated activity recognition (Akhavian and Behzadan, 2016). These approaches have similar limitations, requiring large training datasets for each activity type. Additionally, they require workers to carry phones onsite at all times and keep them at adequate battery levels.
Some of these limitations can be addressed by resource positioning technologies, which allow for the automatic tracking of workers’ and other asset positions. For example, the use of radio-frequency identification (RFID) (Costin et al., 2012; Park et al., 2016), magnetic field (Park et al., 2016), ZigBee (Liu et al., 2007), Ultra-Wideband (UWB) (Cheng et al., 2013), and BLE (Olivieri et al., 2017; Park et al., 2017; Zhao et al., 2017) have been successfully used to reduce data collection efforts while still assuring accuracy and providing real-time data through the automated detection of workers. For example, researchers proposed a passive RFID solution to estimate workers’ travel and wait times for site elevators in a high-rise building (Costin et al., 2012). However, this research had several limitations: (1) the study did not consider the different tasks of workers; (2) researchers used the passive RFID tags, which have no self-reporting capability due to the data storage capacity of approximately 128–256 bytes; and (3) a limited detection range from 4 to 10 m, which may be further attenuated in proximity to metal surfaces (Costin et al., 2012).
Lin et al. (2013) studied a ZigBee-based tracking solution for the development of a real-time monitoring system to understand workers’ behavior on large dam construction sites. This could potentially provide a task progress management of workers in practice. Using the dynamic wireless sensor network, consisting of a mesh communication tree, workers’ tracking accuracy was reported to be 3–5 m. However, the study did not address the indoor construction environment. Furthermore, Cheng et al. (2013) introduced the integrated UWB (for monitoring the real-time spatial and temporal data of workers) and physiological status monitor (PSM) (for remotely tracking the posture of the workers) system to measure the proportion of the value-adding contribution of construction tasks. However, the research’s objectives were to automatically detect and characterize site geometries and estimate the direct work time rate by classifying the types of workers’ activities, such as wrench time, material time, travel time, and rest time. Task differences in a multi-task environment were not considered, and the research questions did not include determining when workers switched to a different task.
When compared with other technologies, BLE has several advantages in terms of the indoor tracking environment: (1) BLE technology is reliable and reasonably accurate for indoor tracking of workers, and (2) the solution is cost-efficient and easy to set up and use. In the previous study, it was demonstrated that BLE beacons are promising tracking technology for proximity detection because Bluetooth beacons are light, resistant to dynamic weather conditions, and have a satisfactory battery life with minimal false negative alerts (Park et al., 2016). In another study, where a BLE tracking solution was applied in three construction cases for project-level presence analysis of workers, it was reported that BLE beacons were cost efficient (four EUR per beacon), took half a day to install, and needed only 1 or 2 h of weekly maintenance (Zhao et al., 2019). Therefore, BLE technology could be a suitable technology for resource tracking and progress monitoring of construction works (Zhao et al., 2019). Furthermore, recent research has shown that the sensor network powered by BLE technology achieves a location accuracy of 5–10 m in construction, and the portable BLE beacons, with easy deployability and good stability (Gómez-de-Gabriel et al., 2019), enable the possibility of identifying working patterns, thus quantifying productivity (Mohanty et al., 2020). However, researchers using BLE tracking methods have not used the technology to estimate workers’ task-level presence and discover opportunities for improving productivity and eliminating waste.
The concept of uninterrupted presence was proposed by Zhao et al. (2019). Uninterrupted presence as an efficiency metric is calculated when workers are continuously present in one work location without moving to another. In three case projects, the uninterrupted presence of more than 10 min in work locations was found to occur 24.5–35.5% of the time. This indicates a substantial amount of movement between work locations and a seemingly inefficient process. However, Zhao et al. (2019) did not investigate uninterrupted presence at an individual task level. Instead, they estimated an overall share of uninterrupted presence at the whole project level (i.e., project-level presence indices). With project-level data, it is impossible to identify the root causes of problems or figure out improvement interventions at the task level. Furthermore, the project-level presence indices consider the productivity of the whole project but do not consider the workflow of tasks. Specifically, the project-level presence indices did not consider the production schedule and dependencies between different tasks. A task-level measurement of uninterrupted presence opens new and interesting research questions and opportunities. For example, what is the common duration of uninterrupted presence on the level of individual tasks? Do different types of tasks have unique characteristics in terms of the variation in uninterrupted presence, which would potentially account for task inefficiency? Are workers following the production schedule (i.e., conducting the right work in the right location)? How is work conforming to planned requirements and predictions? How much buffer is included in planned work durations? Also, if it is possible to evaluate the work performed at the task level in real time, it would enable a host of new services related to the short-cycle management of construction production. Therefore, considering task and location differences, workflow-specific metrics should be studied as complementary techniques to project-level uninterrupted presence indices. This, indeed, is the motivation of this study to develop a method for task-level progress monitoring.
To achieve the objective of the study, we first need to develop a method to automatically identify the uninterrupted presence of workers at a task level and detect the actual start and finish times of tasks at work locations. Second, we propose new KPIs that will allow novel insights (such as evaluating task-level uninterrupted presence against plans for schedule conformance) to be used for better planning and production control in construction. In the current paper, we apply a real-time tracking system similar to Zhao et al. (2019) but consider an uninterrupted presence analysis at the task level while using positioning data to monitor task progress. For this, we propose the following research questions:
(1). Can indoor positioning data be used to enable the automatic detection of the start and finish times of construction tasks?
(2). Does the uninterrupted presence at a task level provide new insights that can help identify and develop interventions for better production control in construction?
Materials and Methods
Research Process
We use the design science research methodology; the process of this research is divided into six stages (Peffers et al., 2007). Table 1 summarizes the main stages and key aspects of the stages. The first three stages are related to comprehending and understanding the problem: deep comprehension of the task management and production control, identification of a problem related to the automated detection of task progress, and design and development of the solution artifact. The latter three stages are related to analysis and development: examine the applicability of the solution, implement and test the solution, and analyze the theoretical contribution of the solution.
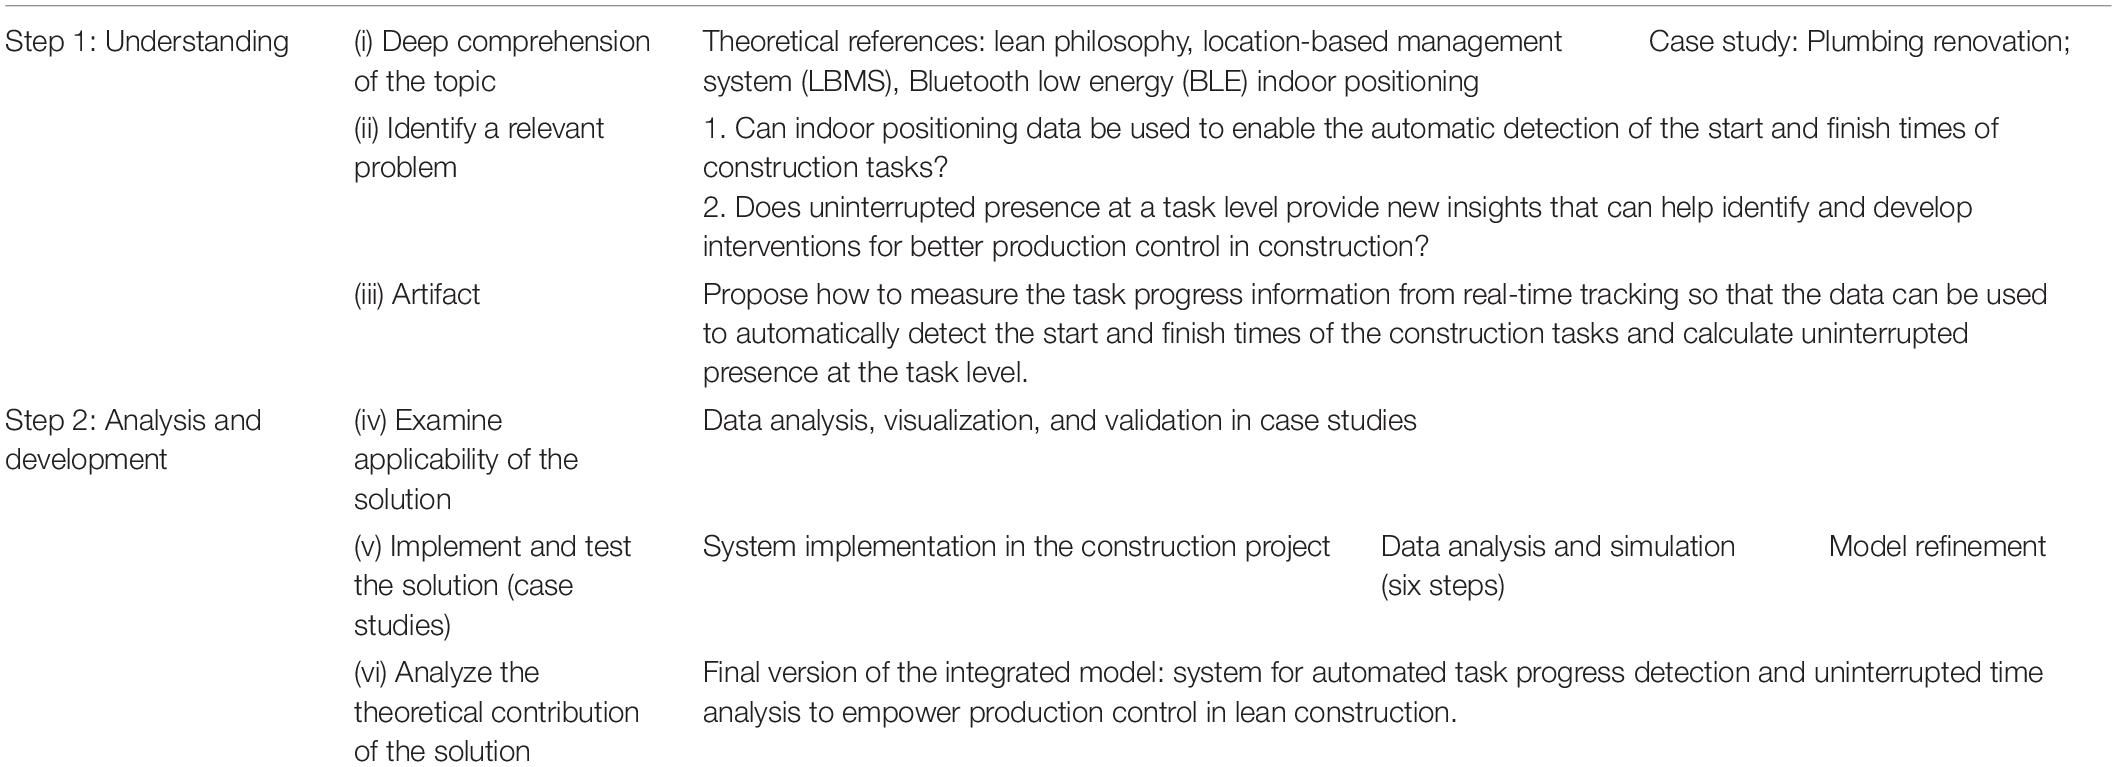
Table 1. Summary of research methods.
A case study research method was selected to investigate the phenomenon within a real-life context. Case studies are suitable for answering questions of “why” or “how” (Yin, 2018). The case study method was chosen to develop the performance of a new automated task-based progress monitoring system.
For implementing and testing the solution (stage V in Table 1), we followed six steps to increase the reliability of the research results. The first three steps were related to setting up the system and making sure that the system performed as expected: (1) acquiring access to the initial project information and site and setting up the tracking system; (2) verifying the accuracy of the tracking system based on the ground-truth data; and (3) verifying the coverage of the system based on the ground-truth data (Zhao et al., 2019).
The following three steps, which are connected to the main aim of the current research, were related to the development of an automated method for estimating the task start and finish times based on indoor positioning data: (4) identifying the start and finish dates based on the presence information of workers in a specific work location and planning information; (5) validating the automatically estimated task start and finish dates against the self-report start and finish data by construction workers and explaining any major differences; and (6) calculating the task-level presence of workers in different tracking locations and discussing the use of a task-level presence. We used the concepts of presence indices (PIs) and uninterrupted presence threshold when conducting the estimation of task-level presence. PIs denote the share of workers’ presence time of their entire operational day (from first detection in any location to last detection in any location on the same day). The uninterrupted presence threshold denotes the minimum duration that a worker must be present at one work location without interruptions to consider the presence value-adding (Zhao et al., 2019). We took the highest value (10 min) in Zhao et al. (2019) as the threshold for this case because we wanted to exclude potential non-value-adding time, such as walking around the site, as much as possible.
System Architecture
In the current research, we used the system architecture described previously by Zhao et al. (2019). Here, we briefly describe the main elements and relationships of this architecture. In this architecture (see Figure 1), BLE beacons that are assigned to specific workers are used to track them periodically (with approximately 1 s frequency), transmitting the media access control (MAC) address of the beacon to the gateways (Raspberry Pi) in specific locations and from gateways to the cloud. Specifically, the information on a unique MAC address of a beacon associated with the worker’s profile is collected, together with the time intervals for worker presence in the database. Periodic signals in the nearby gateways capture and transmit those signals using the Message Queuing Telemetry Transport (MQTT) protocol. The Received Signal Strength Indication (RSSI) from the beacons is measured by gateways together with their MAC address. The broker in the cloud pushes the tracking data to the clients, and the data analyzer module subscribes to a topic published by the clients from gateways.
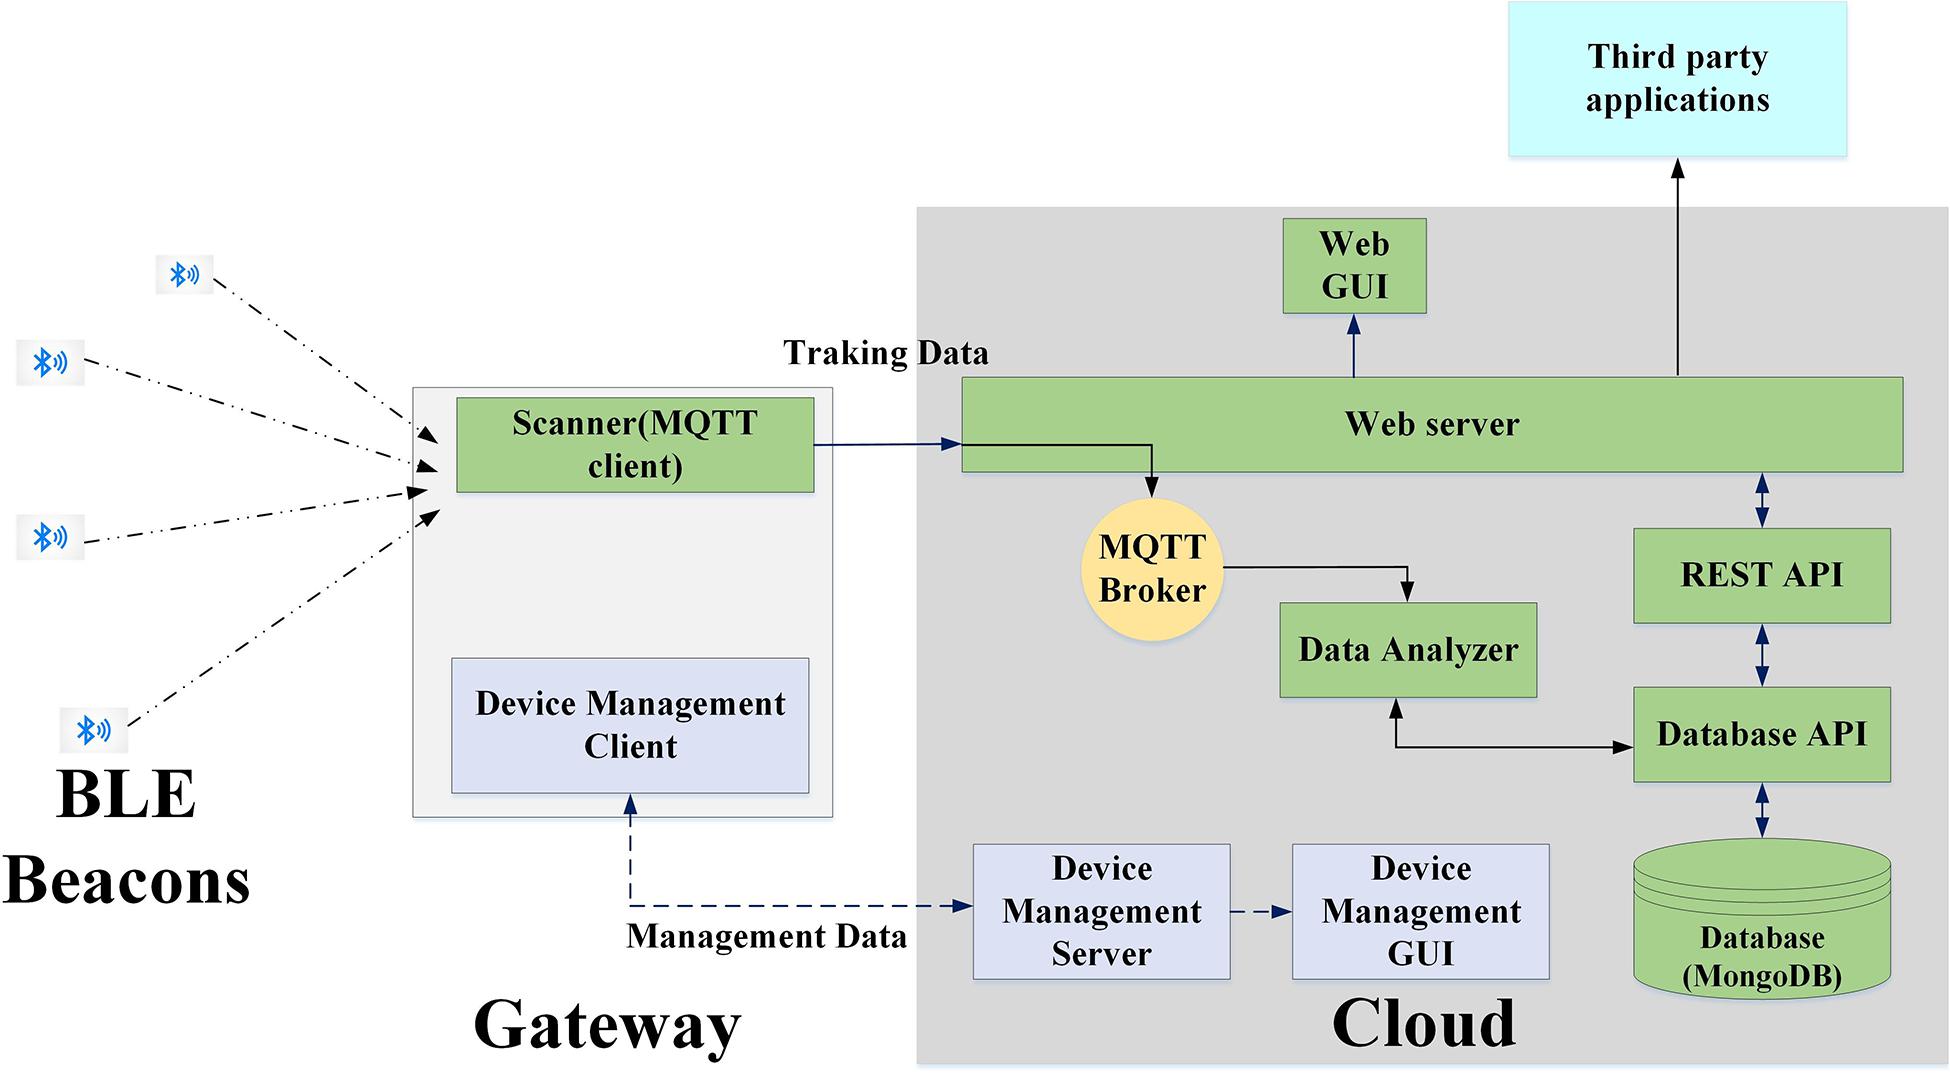
Figure 1. The architecture of indoor tracking application for a construction site (adapted from Zhao et al., 2019).
The data analyzer defines the location of beacons based on the magnitude of RSSI: the farther the beacons are from the gateways, the smaller the RSSI. That means the closest gateway can capture the beacon signals and determine the location of the beacon based on the event of the strongest signal (RSSI), which is compared and analyzed in the data analyzer module. The data analyzer can store the tracking data in the designed database, and a third-party application can utilize the data through a database application programming interface (API) module via representational state transfer (REST) (Zhao et al., 2019). Because RSSI is measured for closeness to the gateways, the value is dynamic under indoor construction conditions, resulting in potential flickering issues for detection. To solve this, the system utilized an array of N recent RSSI values of every beacon in every gateway, so the oldest values were pushed out when storing a new value in the data analyzer. Therefore, the last N value of RSSI is averaged, and the outlier values are eliminated from RSSI values so that the flickering problems are eased. In this study, data were downloaded from the cloud and then used for further analysis. The main elements and relationships of the system architecture are depicted in Figure 1 and are adapted from Zhao et al. (2019).
Case Description: System Set-Up and Selection of Tasks
For the purpose of the present research, a residential apartment renovation project located in Helsinki, Finland, was chosen as a case for two reasons: first, this type of project (plumbing renovation) had been measured with indoor positioning technology in a previous study (Zhao et al., 2019); and second, the researchers had access to the resource-loaded task-level schedule. The indoor positioning and tracking of workers took place from March 8 to June 1, 2018. The residential building had seven floors, with four apartments on each floor (see Figure 2).
Figure 2. Floor plan of the selected case study, with gateways marked.
The BLE beacons were assigned to eight workers, who gave informed consent to participate in the study. The BLE beacons can be attached to key chains or carried in the pockets of workers, so the potential disturbance to tasks was minimal. The BLE transmission range was set to the default value of 12 meters. The placement of nine gateways is illustrated in Figure 2. To place the gateways, we followed the guidelines developed in our previous study (Zhao et al., 2019). Three gateways were installed at the exit locations (two on the ground floor and one in the construction site office) and one in a selected apartment on each floor (the red stars in Figure 2). Because the logic of the workflow was from the top to bottom floor, it made sense to track one apartment on each floor. The selected apartments on each floor were one-bedroom apartments with an area of approximately 50 m2. The selected apartments shared the same layout; therefore, each apartment’s wall structure and location were identical, which made it possible to compare the tracking data across the selected apartments. Because of the lack of required power supply for the Raspberry Pi, we could not place gateways on the second floor.
The initial system set-up took half a day. After verifying the system accuracy and coverage, the beacons were assigned to the workers, each responsible for the execution of specific tasks (Table 2). The construction site was visited weekly (1–2 h each time) to maintain the tracking system, for example, ensuring that the installed gateways had sufficient power supply and internet connectivity.
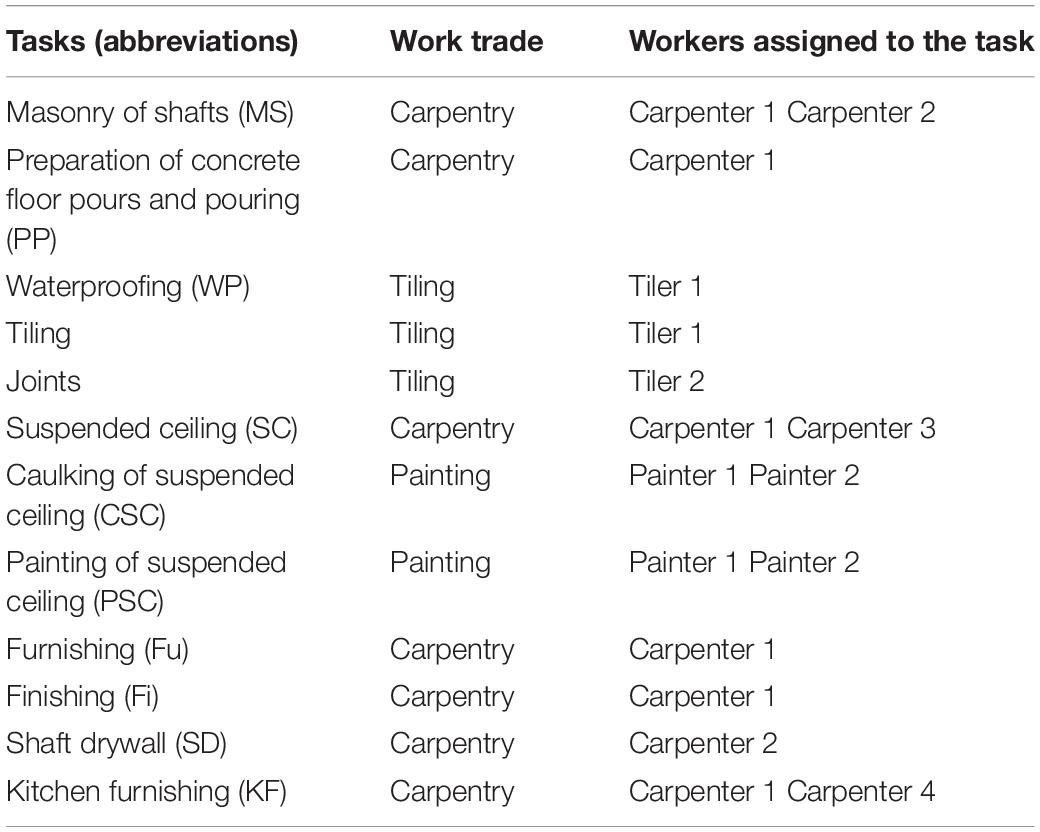
Table 2. Summary of tracked workers in the selected case project.
Table 2 summarizes the selected tasks, which can be broadly divided into two groups. First, workflow 1 (bathroom workflow) is a set of tasks with a logical sequence because of the technical dependencies in a constrained space. In the bathroom, the selected tasks had to be completed in the following sequence: masonry of shafts → preparation of concrete floor pours and pouring → waterproofing → tiling → joints → suspended ceiling → caulking of the suspended ceiling → painting of the suspended ceiling → furnishing → finishing. Second, workflow 2 (kitchen workflow) was a set of tasks that were not technically dependent on the bathroom workflow tasks but had resource dependencies, including shaft drywall and kitchen furnishing.
Overall, 12 tasks covering three trades (carpentry, tiling, and painting) in six work locations [floors 7 through the ground floor (see Figure 2)] were tracked, and a total of 88.95 h (5,337 min) with 1,727 time intervals were recorded. The time intervals in the tracking dataset contain information of a worker, trade, location, and the corresponding durations at that location. A new time interval was generated in the system when a worker moved to a new location and was detected by a different gateway.
System Accuracy and Coverage
To evaluate the reliability of the results, it is important to understand the positioning system’s accuracy and coverage. Here, accuracy refers to the system’s capability to record the trackable objects in the right location at the right time (Zhao et al., 2019). Coverage refers to how large a share of the total time the system can detect the tracked object in any location on site. To verify the accuracy and coverage, we followed the approach described by Zhao et al. (2019).
The system accuracy was evaluated based on comparing tracking results to ground-truth data. For creating the ground-truth data, two researchers walked around the site and manually recorded the time they spent in each location. Beacons were in the researchers’ pockets during the accuracy tests because the same instructions were also given to workers. The researchers attempted to simulate the workers’ daily routines in work locations, such as moving from floor to floor, staying in one location for some time, leaving and returning to the site from exits, etc. Then, the self-report data by the researchers were compared against the data recorded by the tracking system.
Out of 114 min of the researchers’ movements, 102 min were detected in the correct location and at the right time, resulting in 89% accuracy. Floors 4 and 6 registered the most inaccurate times with 7 min (6%) and 3 min (3%), respectively. Those inaccurate minutes were registered for two reasons: (1) An incorrect gateway detected the beacon. Because the indoor environment, such as concrete walls, contributes to the complexity of real-time monitoring, thus impacting the detection of signals, some beacons could be identified by a gateway that was not closest to them. For instance, on the fourth floor, an incorrect gateway detected the beacons for 4 min 43 s. To tackle this kind of inaccuracy, it is possible to decrease the beacon signal strength, but this could lead to situations where the beacons are not detected by any gateway. (2) Data flickering is a system reliability issue in real-time tracking methods (Zhao et al., 2019). It means that multiple gateways catch the signal, and the system reports rapid switching of locations. Data flickering can be caused by the proximity of gateways to each other. On floor 4, data was flickering for 1 min 51 s (all falsely registered to the adjacent floor: floor 5). To minimize the effects of inaccuracy, we followed the guidance from Zhao et al. (2019) for a similar renovation project where the researchers proposed to place gateways in work locations enclosed by concrete walls (such as apartments) to allow for small overlapping of detection areas from nearby gateways in case of no coverage.
For coverage, the time that the researchers were detected by any gateway during the simulated time was 112 min, resulting in a coverage ratio of 98.2%. We placed all gateways in the bathroom area, and the researchers recorded their movements around the bathrooms where the workers were supposed to work. Therefore, compared with our previous study using the same tracking technology, which achieved a 71.2% coverage and 55.3% accuracy in a plumbing renovation project (Zhao et al., 2019), the current case study achieved a higher level of coverage and accuracy. However, because we were not able to place gateways on floor 2, those workers could theoretically sometimes be detected on floors 1 or 3. We did not observe a substantial amount of inaccuracy on those floors because only 1 min on floor 2 was incorrectly grouped into floor 1 during the validation period.
Results
Detection of Task Start and Finish Times
The tracking system can detect the time period of each worker in a specific location. These raw data were used to estimate the actual start and end times of the tasks. This was done by implementing the following steps.
(1) Because the first task in the bathroom workflow (MS) was always scheduled one full day ahead of the first task in the kitchen workflow (SD) for each location, we started analyzing the bathroom workflow first. According to the schedule, there was a time when task PP in the bathroom was conducted at the same time as task SD in the kitchen workflow, but those two tasks were scheduled for two different workers, so their presence could be differentiated.
(2) In both workflows, the first detected uninterrupted presence on each floor was compared with the schedule of a task that was the closest to that presence, so that we could determine from which task in the workflow the worker had started the job.
(3) Task switching took place between two tasks within the same workflow. If the given task’s successor was scheduled for the same worker, we assumed that the task switch happened when there was an absence of at least 4 h at that location after the last presence of the task had been detected. We used 4 h because all tracked tasks at a single location were scheduled for 4 h, except kitchen furnishing. If we could not find any absence period longer than 4 h, we took the scheduled start time of its successor and used it to search for the closest detected uninterrupted presence to determine the time of the task switch. When determining absence, we did not count the absence time outside the construction hours: (1) the workday started at 7:00 a.m.; (2) the workday ended at 3:30 p.m.; and (3) a lunch break was between 11:00 and 11:30 a.m. In this case, the task switch rule was applied on the following task sequences where the same workers were doing multiple tasks in the same location: MS-PP; WP-Tiling; CSC-PSC; and Fu-Fi.
(4) If the given task’s successor was scheduled for different workers other than the one for the given task, we assumed that the task switch was happening when the first uninterrupted presence of the successor task was detected, regardless of the length of the absence time between the two tasks. This task switch scenario was applied to the following task sequences: PP-WP; Tiling-Joints; Joints-SC; SC-CSC; PSC-Fu; and SD-KF.
(5) In summary, the start time of a given task was the start of the first detected period of uninterrupted presence, and the finish time was the end of the last uninterrupted presence of that task until the task switch.
The scheduled and tracked start and finish times for the selected tasks were derived based on these task detection rules. Information related to the bathroom on floor 5 is presented as an example. Figure 3 illustrates how the raw data on floor 5 for consecutive tasks (waterproofing, tiling, and joints in tiling trade) were used to determine the tasks’ switching. Task switch 1 took place when there were 272 min of absence after the waterproof task’s detected presence, which is longer than 4 h. Task switch 2 took place when the other tiler’s presence was detected, regardless of the absence time length. March 24 and 25 landed on the weekend, so no presence of workers was detected.
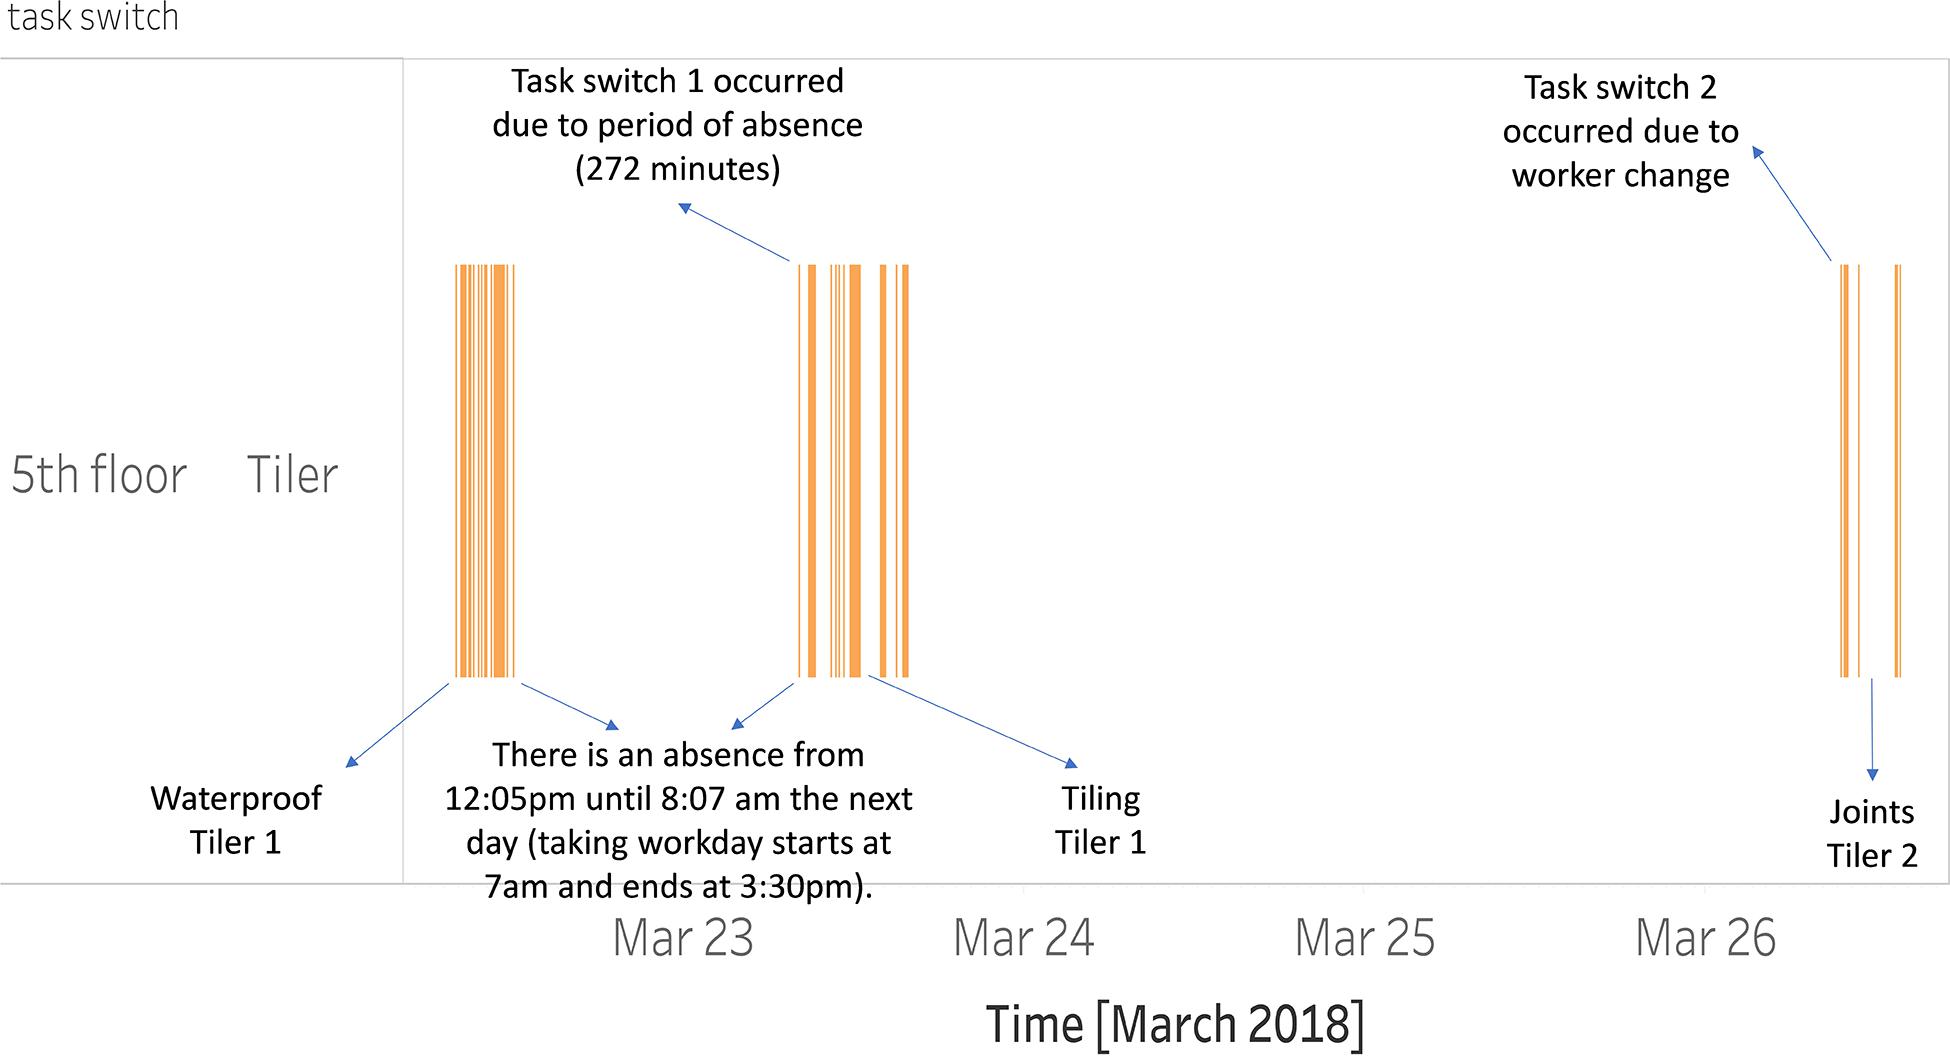
Figure 3. Task switch example for three consecutive tasks on floor 5.
Based on the steps, Table 3 presents the plans and tracking results of the tasks in the sequence of how work was actually performed, from the tasks “masonry of shafts” (top) to “painting of suspended ceilings” (bottom). There is a discrepancy between the tracked and planned start and finish times. This is expected because workers do not or cannot follow their plans all the time in practice.
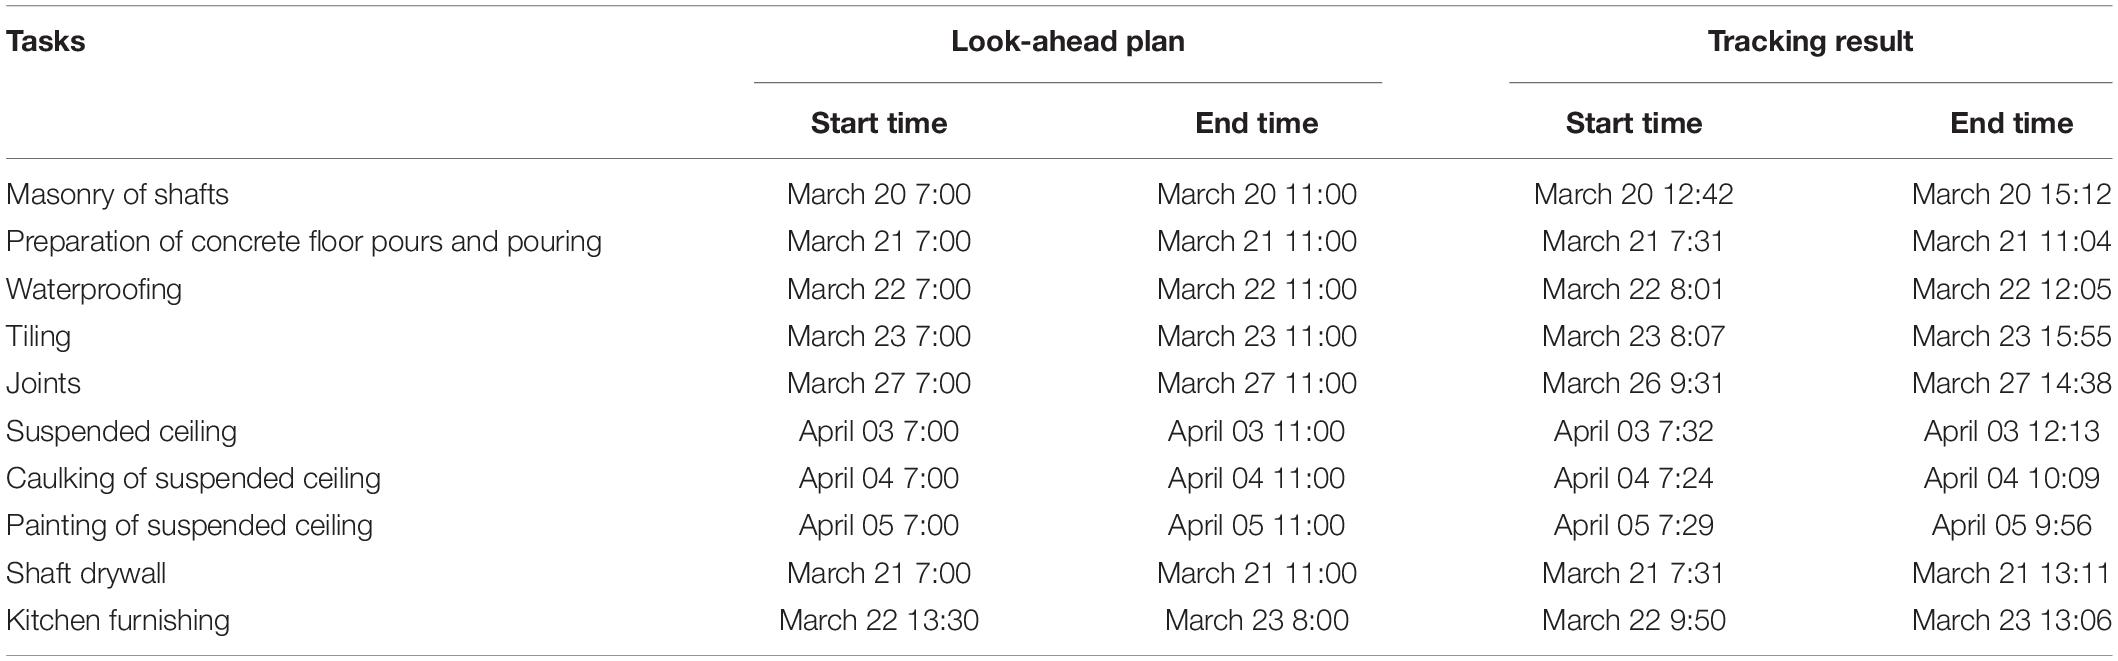
Table 3. The scheduled start and finish time of tasks on floor 5 compared with the results based on the real-time tracking system.
In summary, the presented method can begin to answer the first research question on how to automatically identify the task start and finish times based on the information of worker presence in specific locations. Next, the automatically detected information on the task start and finish times in different locations is validated against the construction workers’ self-report information.
Validation of Task Times Against Workers’ Self-Report Data
The validation aims to evaluate the differences between the automatically identified start and finish dates and the workers’ self-report records. We are particularly interested in cases where information from the automated tracking system does not match the information reported by the construction workers and site managers. The self-report task start and finish data were collected in two different ways, depending on the workers’ willingness to use a mobile application. (1) Workers self-report the information on a mobile application (SiteDrive), or (2) workers reported the information to site managers, who entered the records into the SiteDrive system.
Table 4 summarizes the differences between the system-detected results and workers’ self-report results, giving a total of 11 tasks (excluding the task “shaft drywall”). We used a 4 h time difference to divide the observations into “accepted” and “not validated” categories because all the tracked tasks at a single location were scheduled for 4 h, except for the task of kitchen furnishing (3 h). Workers were supposed to enter start and finish events into the system “in real time,” but some entered information later. In those cases, we expect to see some inaccuracy in the data. The natural way workers segment their time is based on breaks, which occur roughly every 2 h (i.e., morning before coffee break, afternoon after coffee break, before lunch). For this reason, we categorized 2 h (= 1 break) as “close” and 4 h (= 2 breaks) as “accepted.” We considered 4 h as a limit for acceptance (= 2 breaks) and further divided the “accepted” category to “close” (2–4 h, 1–2 breaks) and “validated” (<2 h, <1 break).
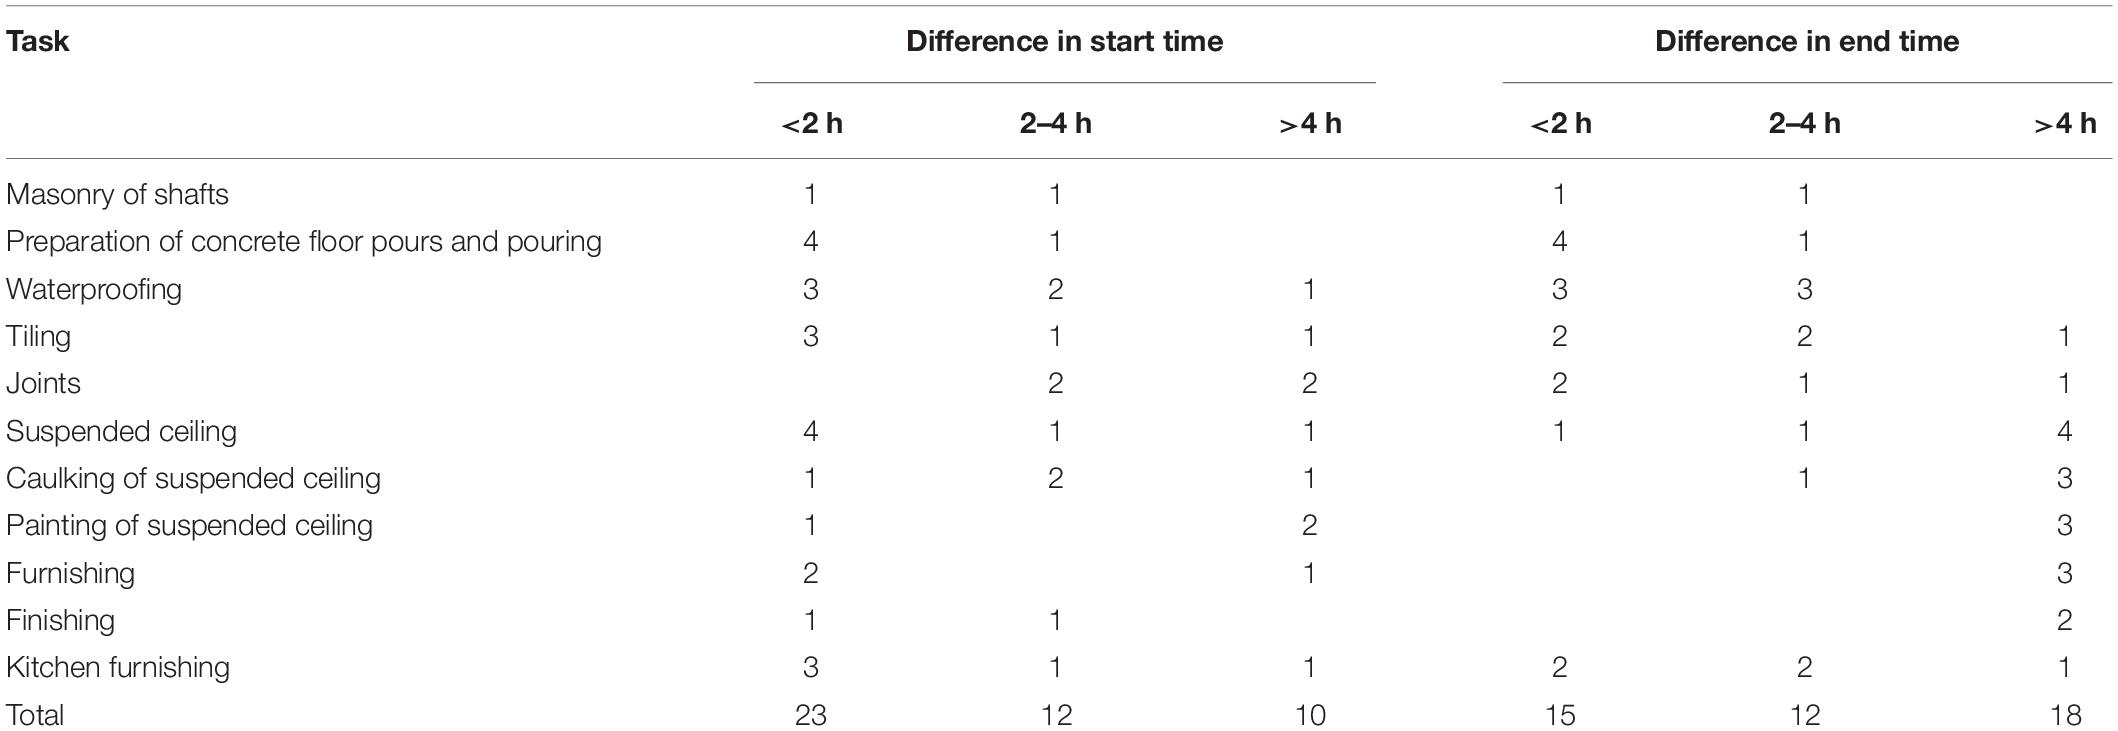
Table 4. Differences between self-report data and the tracking results of the workers (number of observations).
In summary, the following scenarios were defined for each task for both start and finish times:
(1). If longer than 4 h, the results are considered “not validated.”
(2). If between 2 and 4 h, the results are “close.”
(3). If less than 2 h, the results are “validated.”
Several time intervals that were “not validated” resulted from obvious errors in the progress data, self-reported by workers. For example, the task “shaft drywall” had the same self-report start and end times in all locations, and therefore, the task was excluded from the analysis. The task “masonry of shafts” on floor 1, task “caulking of suspended ceiling” on floor 3, task “painting of suspended ceiling” on floor 5, and task “finishing” on floor 1, as reported in SiteDrive, had the same start and finish times. Therefore, those tasks were also excluded from the analysis.
In summary, for the task start time, we found 35 out of 45 observations (78%) as “validated” or “close” and for the task end time, we found 27 out of 45 locations (60%) as “validated” or “close” (Table 4), resulting in a total of 31% of observations that were categorized as “not validated.”
For each of the 11 tasks, we evaluated all detected time intervals over the whole dataset to see how many of those were between the self-report start and finish times (Table 5). In total, 92% of the detected time intervals occurred between the task self-report start and finish times.
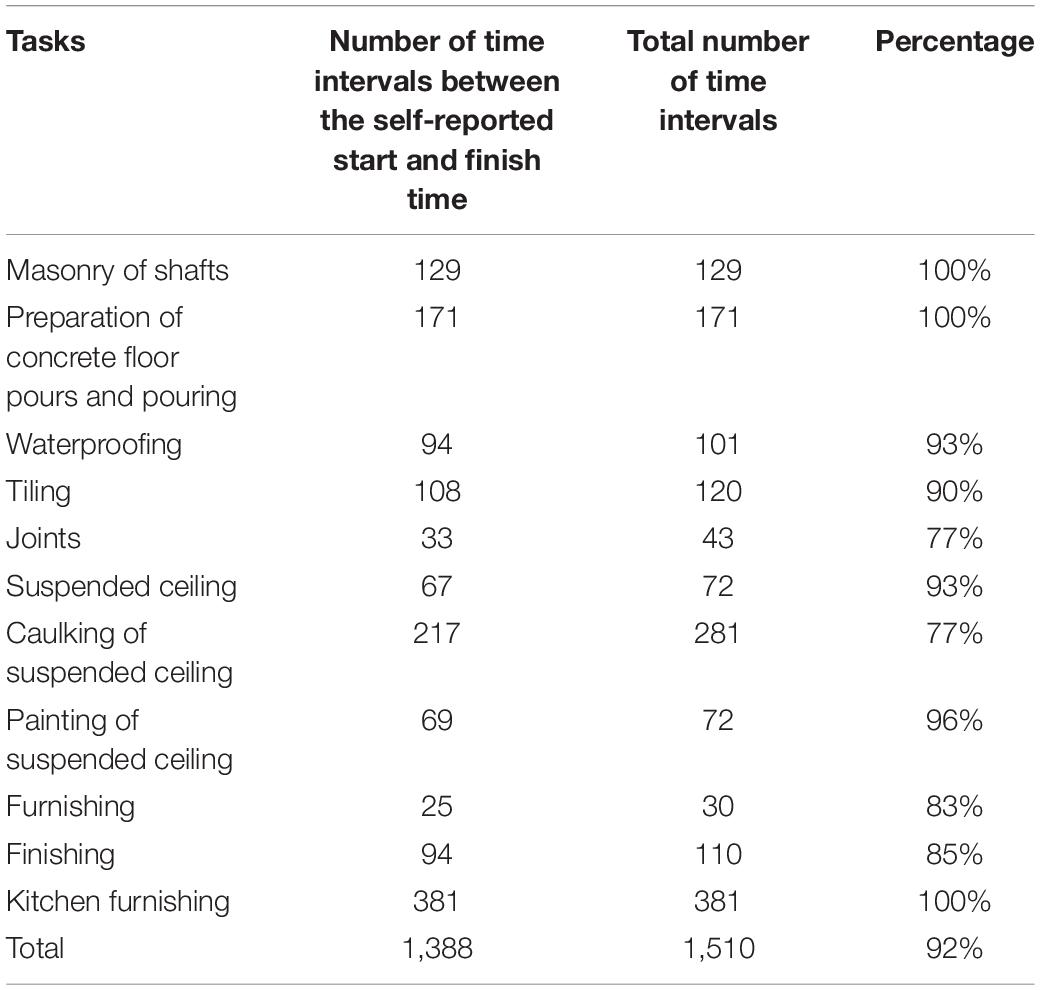
Table 5. Count percentage of the recorded time intervals inside of the self-reported data of each task (the whole dataset).
We made several observations based on the validation results. (1) The task start and finish times, as reported by the workers or site managers, were generally close to the automatically derived task start and finish times (see Tables 4, 5). However, there were issues with the self-report data. For example, there were cases where the start time and finish time of a task at one work location were reported with the same timestamps in the SiteDrive system. This confirms that manual data collection and entry are subject to human error. (2) The self-report data represent the time range of the task execution but do not show how much time the workers were present at the work location. For example, although a worker reported the whole day for their tiling task on March 23 on floor 5, the tracking system identified several periods when no one was present. Time gaps are visible both in the handovers between tasks and inside the task execution periods. Based on the tracking data, the tasks were regularly suspended, but in the self-report data, these suspensions were not captured. Therefore, the self-report data do not give an overview of how the workers’ time was actually used on site.
Next, we visualized workers’ uninterrupted presence in all tasks and work locations to obtain a broader picture of the work progress (Figure 4). The figure demonstrates two workflows of tracked tasks in one timeline. The dashed lines separate the kitchen workflow and bathroom workflow on floors 3, 5, 6, and 7 in the figure, where tracking data for both workflows are available.
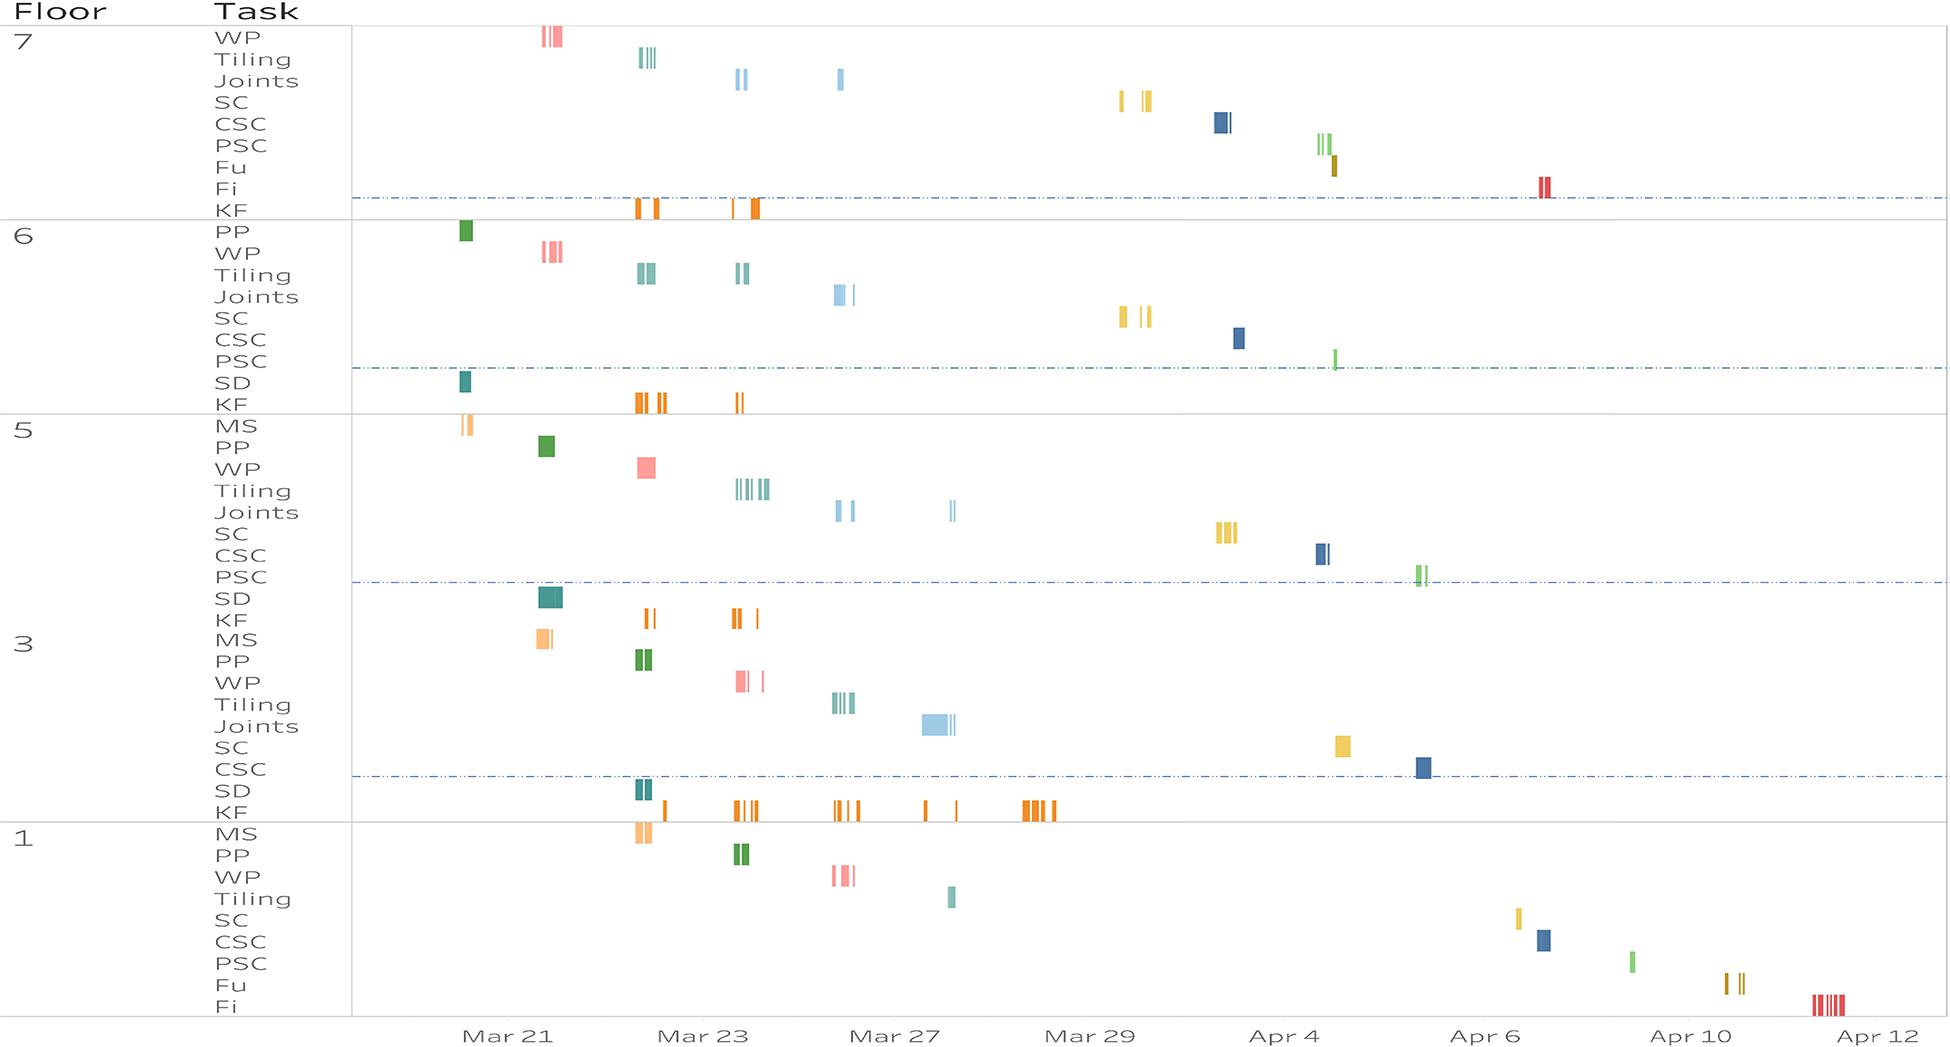
Figure 4. Tracked tasks in all locations, excluding floor 4. Abbreviations: Masonry of shafts (MS); Preparation of concrete floor pours and pouring (PP); Waterproofing (WP); Suspended ceiling (SC); Caulking of suspended ceiling (CSC); Painting of suspended ceiling (PSC); Furnishing (Fu); Finishing (Fi); Shaft drywall; (SD); and Kitchen furnishing (KF).
Due to several inaccuracies, we decided to exclude floor 4 from further analysis. Five out of seven tasks on floor 4 were not validated due to more than 4 h’ difference between estimated and self-recorded start times. Additionally, on floor 4, we could only capture uninterrupted presence related to seven tasks out of 12, which was the fewest when compared to other floors. For tiling on floor 4, we detected only 59 min of presence for tiler 1 from 12:30 to 13:52 on March 23. According to our task detection rules, the presence was classified as “waterproofing,” but tiler 1 reported doing this task on March 22 and “tiling” from 8:29 to 15:10 on March 23. Therefore, it appears that the period of uninterrupted presence was adequately related to the task “tiling,” but the duration was too short when compared to the self-report task duration.
The lack of uninterrupted presence captured could result from the fact that the workers may need to remove gateway power plugs at times for their own task uses, but forgot to plug them back in straight away. This was discovered during the system accuracy test observed by the researchers, but it was not possible to estimate how long the gateways were unplugged because the system could not determine whether the undetected time was from absence of workers or gateway offline periods. On floor 4, the uninterrupted presence in six tasks (out of seven tasks detected in total) did not appear to be during the same times as the workers’ self-report records. This suggests that the unplugged gateways did not capture the uninterrupted presence of workers during their self-report time range of the work, thus shortening the total captured uninterrupted presence on floor 4. Furthermore, there were also problems with workers’ self-report data on floor 4 to make the real picture even more complex. For example, the tiler reported working on the task “waterproofing” on floor 4 from March 22 at 7:38 to 14:31, but there were no detected uninterrupted presences during that time on floor 4. Instead, they were detected on floor 5 from 7:31 to 11:03. However, the worker also reported the exact same period for the task “waterproofing” on floor 5; therefore, the uninterrupted presence was allocated on floor 5 and not 4. We confirmed that workers on floor 4 were not incorrectly detected by floor 3 or 5 gateways by checking that uninterrupted presence on floors 3 and 5 matched (validated) worker self-report data on those floors, except in a few special cases. However, even though in those special cases the uninterrupted presences on floors 3 and 5 did not match worker self-report data on respective floors, they either did not match worker self-report data on floor 4 or workers reported being on floor 4 at the same time as floor 3 or 5. Because this was the case, we concluded that missing data was caused by unplugged gateways and workers on floor 4 were not incorrectly detected by floor 3 and 5 gateways, and other data remains valid. For future studies, the system should be developed so that it reports unplugged gateways and the status should be monitored more frequently and corrected (e.g., 2–3 times a week instead of weekly in this case) to avoid the potential poor quality of tracking data during the test stage caused by power supply issues.
Evaluation of Task-Level Presence With Schedules
To answer the second research question regarding the possibilities of using task detection data for better production control, we first followed the method proposed by Zhao et al. (2019) for calculating the indices for workers’ uninterrupted presence for each task. The task-level presence indices (PIs) of the workers were calculated by dividing the total uninterrupted presence in a location between the start and finish times of the task by the actual duration of the task. The task’s actual duration was defined as the duration between the first and last detected task times, excluding breaks and hours outside of standard working hours (evenings, weekends, and holidays).
Table 6 summarizes the results of the task-level PIs for workers in each location and the mean and standard deviation across all work locations. During the observation period, tasks were not detected or self-reported in all locations. Locations with missing data have been marked N/A (not available) in the table.
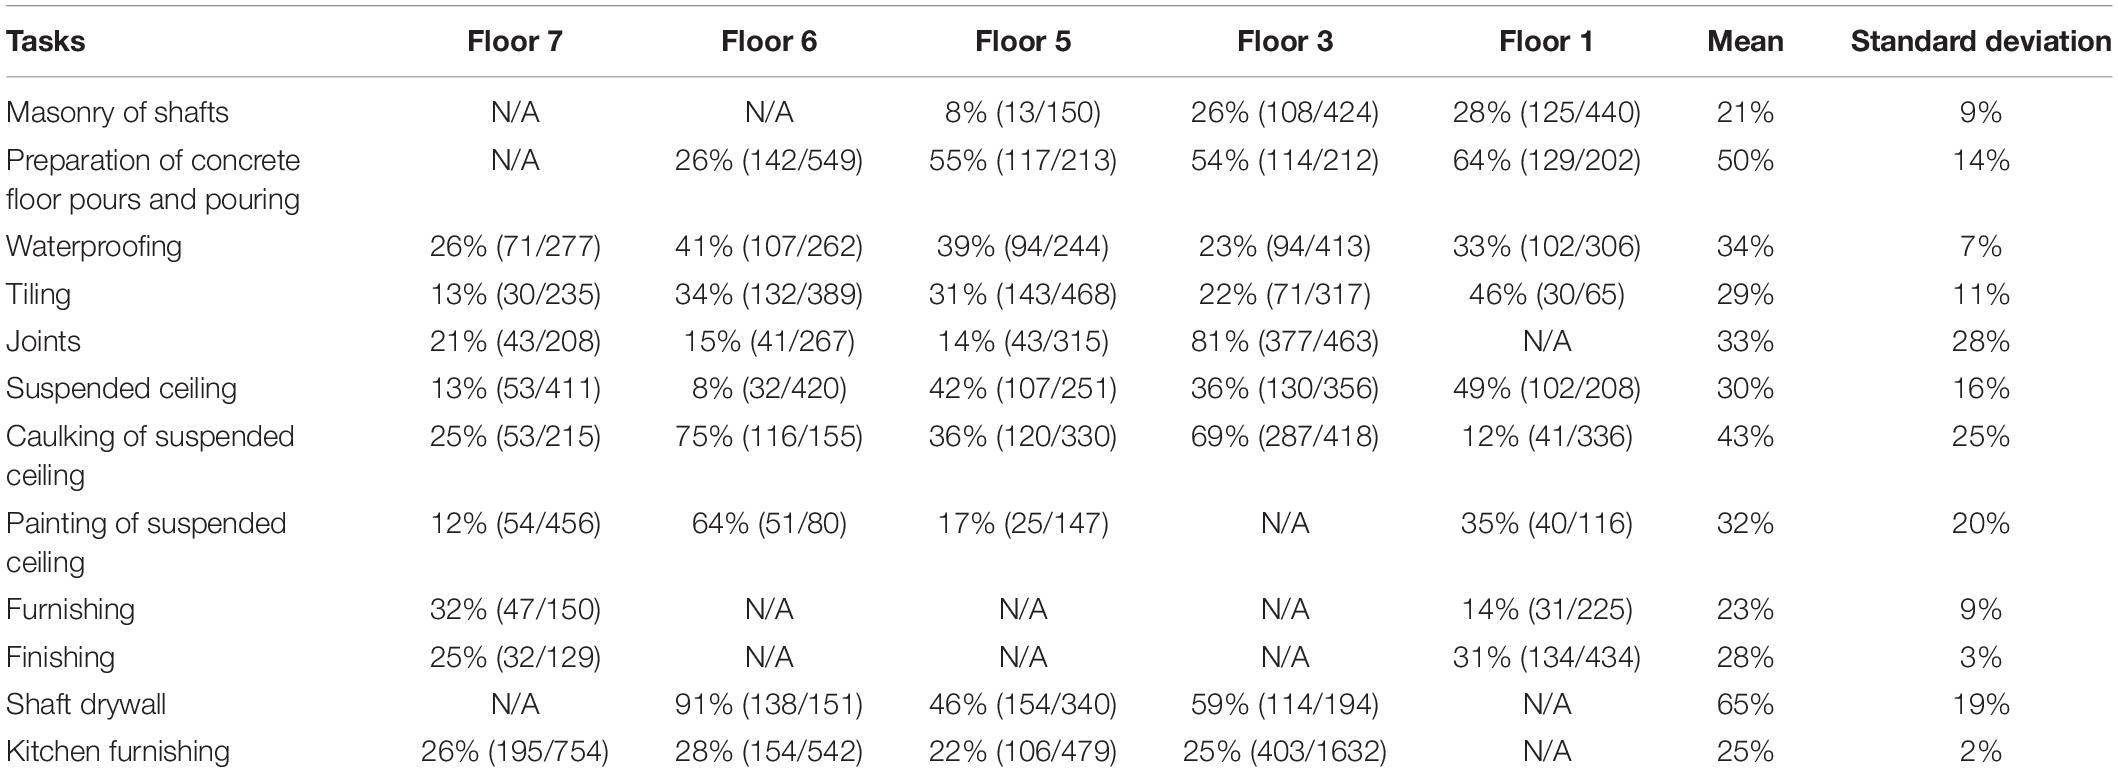
Table 6. Task-level presence indices of the workers on each floor and on average (uninterrupted presence time during task / actual duration of the task).
The actual duration of a task, uninterrupted presence during a task, and PIs by location and tasks indicate a significant amount of variation, even though the bathrooms were similar in terms of work quantity. High variation can also be found between the tasks. The mean presence level of all tracked tasks ranged from 21 to 65%, with a standard deviation between 2% and 28%.
As a result, we also found the phenomenon of work splitting between multiple locations. This was found in the tiling task. Although the tiler was scheduled to work on floor 7, the actual presence of a tiler in that location was very low, and they spent much of this time on floor 6 (Table 6). For the waterproofing task, we identified that the crews were working on floors 6 and 7 in parallel on March 21 (Figure 5). During the crew’s operational time that day (240 min), we found that 71 min were spent on floor 7 and 107 min on floor 6, resulting in 74% of uninterrupted presence for the worker but only 29 and 45% of uninterrupted work presence in the respective work locations. Here, the look-ahead plan assumed completely finishing one location before moving to the next location.
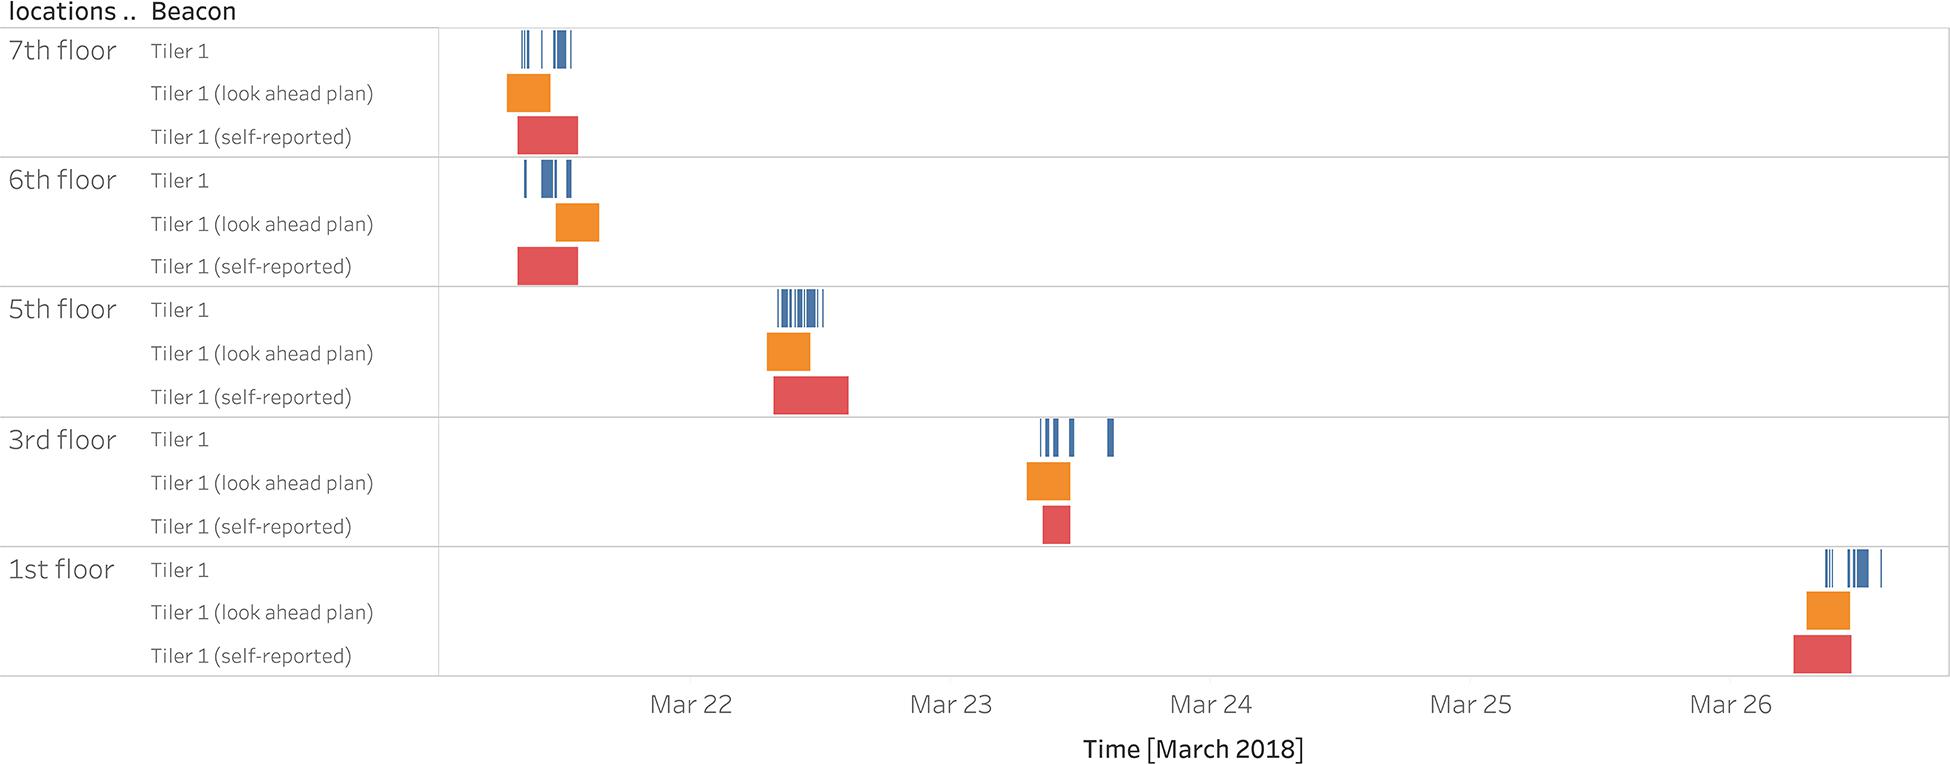
Figure 5. The task of waterproofing and workers’ presence visualization against the schedule and self-report records.
By comparing the actual worker presence in a specific location and the expected level of presence derived from the construction plans, it was possible to identify opportunities for productivity improvement interventions. Thus, we introduce a metric to evaluate the conformance between plan and realized work:
The PPs show how much presence is required compared with the planned duration to complete the task; therefore, it measures the buffer included in the task’s duration to account for waste and variability. If interruptions could be completely eliminated by diminishing waste and improving the process, it indicates how much the schedule could be compressed. For instance, with a perfect flow in the task of “caulking of suspended ceiling,” durations could be compressed to an average of 33% of existing planned durations, indicating opportunities for significant improvement (Table 7). This metric could be used to assess the task-level potential impact of lean interventions that target improving workflow, that is, by removing interruptions. Furthermore, based on equations 1 and 2, the ratio of PPs and PIs is equal to the actual duration divided by planned duration, which has been used in other studies as a metric of schedule conformance (e.g., Al-Momani, 2000).
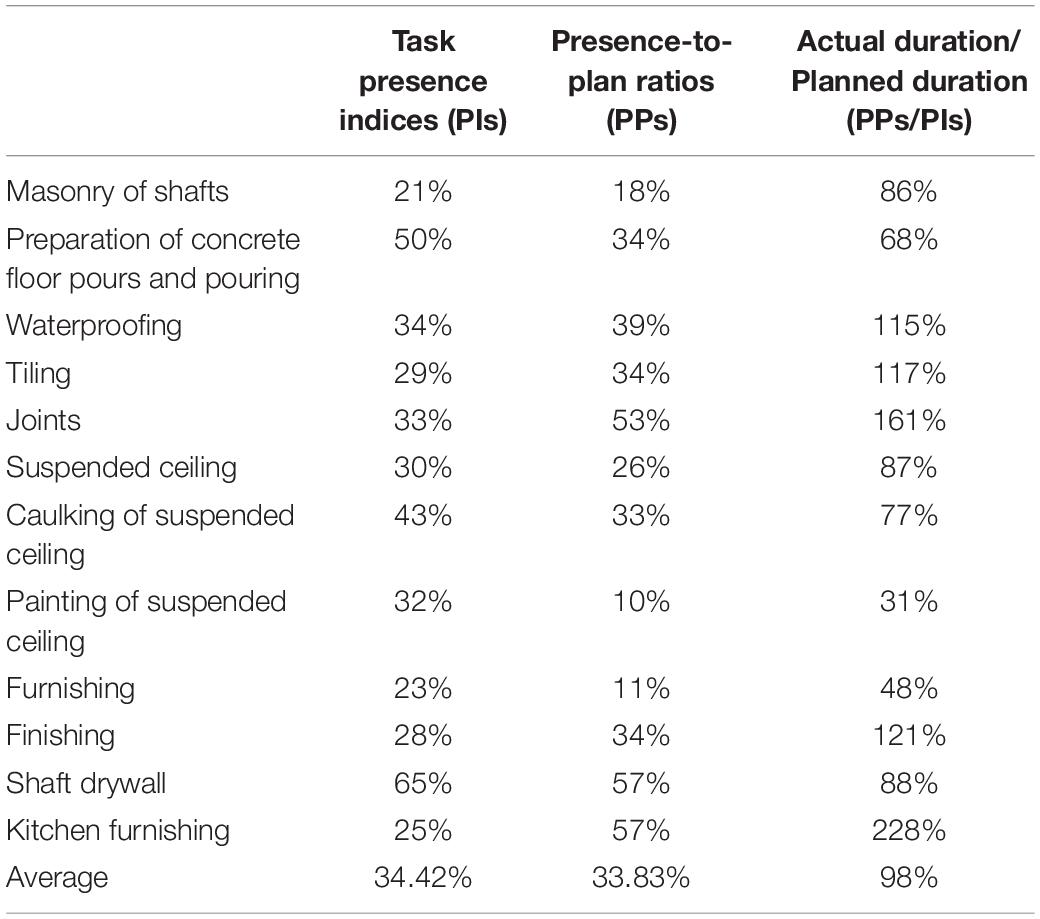
Table 7. Results of PIs, PPs in all tracked tasks and their ratios.
Discussion
The results indicate that worker positioning information enables the detection of the start and finish times of tasks, providing an estimate of the task-level uninterrupted presence. This information can be further used for improving production planning and control. In this section, we discuss the generalizability of the method, the use of task presence indices (PIs) and presence-to-plan ratios (PPs), the comparison of task PIs and project-level PIs, contribution to knowledge, managerial implications, and limitations.
Generalizability of the Method to Track the Progress of Tasks
The current method relies on workflow dependencies. There are several issues that should be considered when evaluating the generalizability of the developed method. Our case study is an example of strict and confined locations where there is a process of re-entrant flow (Brodetskaia et al., 2013) and where the same workers return multiple times to the same location to perform different tasks. On the one hand, this case project is simpler than other contexts because the small locations and strict technical dependencies enable detection of a sequence of work activities. On the other hand, the workers were undertaking several small tasks, so the method included the added difficulty of determining task switch in the same person’s tasks. In larger and more complex projects, the tasks are generally longer. For example, Ballesteros-Perez et al. (2020) reported that in building projects, the actual average duration for task activities is 11.35 days, while in our case, most of the tasks were 4 h. It could be argued that smaller time resolution made tracking in our case more difficult because the uninterrupted presence patterns were very short to detect.
Another feature of our project was small locations enclosed within walls, which made the tracking system accurate. In projects with large open spaces, accuracy may not be as high as in the described case. In our previous study (Zhao et al., 2019), we presented some heuristics and gateway placement strategies for open areas (roughly 30-meter intervals with a beacon range of roughly 15 meters), which can decrease the impact of open spaces on accuracy. Open spaces are also complicated in many areas of construction management. For example, in Takt planning, there is an ongoing debate on how to define boundaries for locations, and methods such as work density planning have been proposed (Jabbari et al., 2020). Open spaces are challenging because any location boundaries are more or less arbitrary and there are no natural obstacles guiding the workers to follow the plan (e.g., Kenley and Seppänen, 2010). For our system, the accuracy in open spaces is noticeably smaller (Zhao et al., 2019), the system may not record the actual boundary assumed in the plan, and the boundary may shift. Accuracy problems occur, especially on the edges of work areas. In future research, the system could be generalized to open spaces by differentiating between hard technical dependencies, and “soft” planning and resource dependencies (Kenley and Seppänen, 2010). Task switch in technical dependency can be determined by assuming a start-to-start relationship and classifying periods of uninterrupted presence based on their sequence. However, it can be argued that open spaces present a challenge to any kind of automatic progress evaluation system (and indeed even for manual observation).
Precedence relationships (Benjaoran et al., 2015) and planning the sequence of activities are not unique to our case. Olivieri et al. (2019) reported that 71% of survey respondents used CPM to plan activities, and CPM includes defining logical dependencies. Some dependencies are strict and technical (e.g., walls must be built before they can be painted), while others are “soft” (Kenley and Seppänen, 2010). Several tasks can technically happen in any sequence but not at the same time because of space requirements. Expansion of our system to these more complex contexts would require the identification of hard and soft logic. Because of generally longer durations of activities and less re-entrant work in larger projects, this should not pose a difficult obstacle, and the same approach should be usable with slight modifications. Brodetskaia et al. (2013) analyzed a residential construction case of interior and finishing works for 120 apartments in 480 days. The seven activities monitored (trade activity durations varied from 1.3 to 6.9 days per apartment) were performed by five trades (drywaller, plumber, electrician, HVAC, and tiler) with just one re-entrant flow loop (the drywaller). With these longer durations and less re-entrant flow, task switch would be easier to evaluate. Thus, mapping periods of uninterrupted presence while knowing the approximate sequence of activities in each location should be enough to make reasonable progress estimates. We will validate this in future research.
In any case, it is hard for a system relying only on BLE tracking to determine when one task of the same worker finishes and the next one starts. To improve the robustness of the system in these kinds of situations, the system should include a function in the future to automatically send push notifications to workers to ask for verification whether they have started a new task or are continuing the previous task. This could enable a learning system by adjusting the assumptions of the model based on user feedback. Asking for verification could also be used to identify rework in a location, for example, if the system detects a high amount of presence in a work location where the worker’s tasks have been previously finished. Nevertheless, even if we keep the single application possibility of indoor positioning system, tests with more extended periods of time, a larger number of individual workers etc., should be conducted to see if the system could be implemented in a more dynamic and complex environment.
Use of Task Presence Indices (PIs) and Presence-to-Plan Ratios (PPs) for Lean Interventions
Although the self-report information can be used to estimate the start and finish times of the task, outlining task execution boundaries or what is happening during the task is not visible using the data collected in traditional production control methods. The real-time tracking system can help reveal the actual presence of workers in the location. Based on our findings, the level of uninterrupted workers’ presence for the task is typically low and subject to a great deal of variation. This finding provides empirical evidence for studies highlighting the high variability of the construction process (Picard, 2002; Arashpour and Arashpour, 2015).
The task PIs show that despite workers’ self-reported duration of tasks to achieve completion, 43–90% of the time was spent either in other work locations than those scheduled, or they remained undetected in the scheduled location. This result agrees, for example, with the empirical research related to LPS, where the percentage of plans completed has been found to be generally low in construction (Ballard, 1997; Seppänen et al., 2010). This finding also raised another question of how much onsite presence from workers is required to complete tasks and how large buffers should be included inside the task to reach an optimal workflow.
The results of PP measurement from this study have opened a black box between the task first start and last end date on construction sites. Current construction production management approaches, methods, and techniques often overlook this in the planning and control of construction production. Although LBMS forecast calculations are critically impacted by task suspensions (e.g., Kenley and Seppänen, 2009), in practice, data are typically not entered into any system, which was also illustrated by our case study where no interruptions were entered by workers.
In the current study, we calculated PPs to show how much the presence of different tasks is required to complete the planned score. The remaining portion of task duration can be considered a buffer required to account for waste and variability. Therefore, this metric could be used to assess the task-level potential for lean interventions on that particular task. PPs suggest the minimum duration in which the task could be completed if wasteful interruptions were eliminated. On average, in our case study, just 34% of task durations were needed for actual work, indicating a considerable improvement opportunity if perfect or near perfect flow could be achieved. To achieve this duration reduction, only factors causing interruptions of work need to be eliminated, which would still not consider work efficiency when workers are present in the work location.
Other studies have shown that efficiency is low (Gouett et al., 2011; Cheng et al., 2013), but our method is unable to quantify that inefficiency directly because the system does not consider the amount of output achieved by workers. Rather than making value-adding time more productive, the waste caused by interruptions may be easier to address because it does not necessarily require interventions impacting the methods of a particular work type; instead, general interventions such as improved material logistics, better work instructions for workers, and situational awareness on the worker level (Cheng and Teizer, 2013; Reinbold et al., 2019; Tetik et al., 2019) can be implemented.
The PP as a temporal indicator cannot be used to judge the actual quality of the resulting work. However, achieving a higher PP of the task at the same level of quality would be essential in future production control studies in construction. Pushing toward shorter schedules based on PP to advance lean interventions should include a prerequisite that the work’s quality is not compromised. In the current study, we would like to emphasize that PP can increase by decreasing waste in the production process, ensuring more time spent at work locations. Therefore, a higher PP does not mean that a worker is hurrying to improve task performance. Instead, there are fewer interruptions, and the worker is able to spend more time at work locations. If we shorten the duration by eliminating interruptions, quality should improve. For instance, LPS for production planning and control in construction, focusing on minimizing the negative influence of variability (e.g., task interruptions) and enhancing the reliability of workflow has achieved success in improving production performance and generating a predictable workflow (Hamzeh et al., 2009). In a future study, we propose that, for example, computer vision approaches (e.g., Yang et al., 2016; Luo et al., 2018; Zhang et al., 2018) could be used to supplement our approach and system, providing means to automate the inspection of possible defects of the work. Pushing for speed at the cost of quality or vice versa is not feasible. This way, the two systems would complement each other.
The connection between PIs and PPs is presented in the results. PPs denote how much presence is required to achieve planned duration with the same productivity of tasks. PIs denote how much presence is required to achieve the actual durations. PPs have implications, such as showing how much of a buffer there is in the planned duration, while PIs are a workflow metric revealing the extent of uninterrupted time for that task. When lean interventions in construction have successfully decreased PIs, durations in future schedules can be reduced, leading to increased PPs. Furthermore, the ratio of PPs/PIs (Table 7) is a metric of schedule conformance: if over 100%, the task’s actual duration will be longer than its planned duration. This could be measured in real time to give early warning of delays.
Compared with other flow metrics, PIs and PPs have their own characteristics and connect to other metrics in practice. For example, Hamzeh and Aridi (2013) calculated LPS metrics to explore the relationship between task anticipated (TA), a task made ready (TMR), and PPC. However, all LPS metrics are based on fully completed activities, whereas PIs and PPs allow for measurement during the progress of tasks. Seppänen et al. (2014) evaluated the impact of control actions on production rates and productivity numerically. When production rates had to be increased, this was primarily achieved by improved productivity (i.e., decreased labor consumption), which challenged the LBMS theory that control actions could mainly be implemented by adding resources. This phenomenon could be seen in real time, with increased PI values if productivity interventions were successful.
Comparison of Task Presence Indices (PIs) and Project-Level Presence Indices
Project-level PIs are used to indicate the amount of uninterrupted presence of workers on site in proportion to their daily operational work time for an overall project (Zhao et al., 2019). The project-level presence is a measure of efficiency at the project level. In a plumbing renovation project, Zhao et al. (2019) reported a project-level presence index at 25.1% using 10 min as the threshold value. In the current research, the project-level presence index was 24.8% with the same threshold, matching the previous measurements in the same project almost exactly on the project level. However, the task-level presence index was found to vary significantly between different tasks.
Compared with project-level PIs, task presence indices are evaluated based on the presence between the task start and finish dates. Because the project-level presence index considers the uninterrupted presence of all measured workers, without considering their task or specific work location, it can be considered a metric of resource flow at the project level. Because task-level indices consider task and location differences, they can additionally be used as a metric of workflow and can be used to warn management in real time of potential problems at the task level. Thus, the indices are complementary. The advantage of a project-level index is that it requires little context information, just defining the work and non-work areas. A task-level presence index requires a resource-loaded schedule and dependencies between tasks but provides information that can be used to improve the process at the task level. Therefore, both indices contribute to site production control and waste elimination from two different perspectives.
Contribution to Knowledge
The current research provides a method based on automated data collection to estimate the start and finish times of tasks and measure the task-level presence of workers. The validation of the method has shown that it can detect the start and finish dates reasonably and accurately in confined locations with strict workflow dependencies. Additionally, the method allows for seeing into the black box between the start and finish times of tasks. In the measured project, a small fraction of task duration had workers present in the work location. The system can be implemented with an inexpensive set-up, and it can retrieve automatic tracking data from the cloud.
Previous studies have not focused on investigating the possibility of automating detection of start and finish times at the task level by using the BLE tracking method. Our results indicate that automatic detection is feasible in the case of workflow dependencies in confined spaces, such as the bathrooms of residential apartment buildings. The results showed that it was possible to get good results in the selected case using a real-time tracking system in an indoor environment: here, 69% of the selected locations were validated by workers’ self-report data, and 92% of the tracked time intervals fell between the self-report task start and finish dates. This indicated the robustness of the proposed approach and the system for the automated detection of task start and finish times.
The possibility of integration with vision-based approaches would improve the method to track task progress, which enables extended contribution in future studies. For example, Zhang et al. (2018) proposed a method from camera views that can be used to match construction site resources such as workers and equipment. This method is useful for identifying workers’ site activities from different camera views and automatically matching them, therefore providing possibilities for dynamically tracking the workers’ continuous workflow. However, despite good research results, the study still left room for further exploration of using matched visual appearances under different camera views onsite to evaluate workflow qualities, such as proposed task-related KPIs. In addition, Yang et al. (2016) studied vision-based worker action recognition based on a proposed Bag-of-Feature framework using a cutting-edge video representation method. The research has the potential to contribute to our study objective, since the capabilities of workers’ action classification based on this vision-based approach advanced the accuracy of task progress identification and validation, therefore improving the soundness of our proposed new KPIs as PIs and PPs. Our results indicate that only an average of 34% of workers’ task time was spent in scheduled work locations. It urges vision-based approaches in construction to shift focus to the time workers were actually in designated work locations rather than scanning through a full scale of video monitoring for action recognition. This provides possibilities for integrating the BLE system with a vision-based action recognition approach to improve the identification of task progress and interruptions.
Because the proposed BLE indoor positioning system relies on location information but not on action classification to determine task status, video clips need only to be analyzed when workers are detected in designed work locations. In turn, vision-based technology for action recognition (e.g., Yang et al., 2016) pinpoints workers’ behaviors so that task interruptions are more accurately identified for calculating PPs and PIs, which are the main contribution of the current study. Previous attempts to empirically research production at the task level have been reported as related to mainstream CPM scheduling (e.g., Senior, 2007; Castro-Lacouture et al., 2009), LBMS (e.g., Seppänen and Kankainen, 2004; Seppänen, 2009, Seppänen et al., 2014) and LPS (e.g., Ballard, 2000). Although LBMS studies have tried to manually account for the suspension of tasks to get more accurate production rate data at a daily level, studies based on CPM and LBMS have mostly focused on comparing the planned and actual duration and dates. However, these studies have all been conducted by looking at a week’s time frame. Instead, the interruptions detected by the automated system of this paper happened continuously during implementation and were not considered by workers or superintendents in the self-reported progress information.
PPC is a metric of the LPS (Ballard, 2000), which measures the reliability of the planning process. PPC was not explicitly measured in the current study, but based on our results, it is likely that even a 100% PPC can be achieved with a relatively low presence. Existing metrics still consider the events between the start and finish times of a task (CPM and LBMS) or within a weekly plan assignment (PPC) as being a black box. More recent metrics, such as the construction flow index (Sacks et al., 2017), are also based on the start and finish dates and, thus, operate with the same limitations. Together with the tracking system, our study proposes more accurate metrics (PI and PP) for daily production planning and control of site activities.
The implications of our results are that there seems to be a lot of unrecognized waste in an activity duration. This has previously been observed with time-motion studies (e.g., Jenkins and Orth, 2004; Saukkoriipi, 2007; Kalsaas, 2010), and results related to the measurement of waste with various approaches tend to agree that the share of value-adding time averages around 25% in construction (Pasila, 2019). However, time-motion studies cannot be performed in a scalable way, so automation has been proposed by various authors. Computer vision approaches have been proposed to detect and classify workers’ construction activities and thus their work performance. For example, Luo et al. (2018) proposed an activity recognition method to achieve continuous activity labels of workers onsite. With an average accuracy of 80.5%, they argued that activity recognition to implement an efficient work sampling method (Dozzi and AbouRizk, 1993) was feasible. However, these methods require extensive training datasets specific to each task, and creating a scalable method that generalizes to most of the construction work is not currently feasible. Our contribution is an automated light-weight approach, which is low cost and effortless to set up, and provides useful data related to the start and finish times of tasks and information about waste between those times, allowing for targeting lean interventions.
Managerial Implications
The proposed framework has several important implications for construction management. (1) The task-level progress tracking system can provide just-in-time information on task start and finish times. In cases where obvious errors occur from workers’ self-report records, the tracking data are a good alternative and can be automatically obtained. (2) The proposed evaluation metrics for the tasks, such as PPs and PIs, can be used to automatically raise alarms for onsite management problems in real-time, thus supporting efforts to decrease waste.
In the current project, workers or site managers manually recorded the task start and finish times in the SiteDrive information system. We found that the task self-entered progress information from five tasks was subject to manual errors. The automated data collection for tracking in real time the task start and finish times could help avoid inaccuracy and reduce the need for resources to collect control data from construction production systems.
The real-time tracking system could be an alternative for traditional human-based observations and inspections to report task progress. In our study, the concept developed for the real-time tracking of workers and the progress of tasks satisfied the accuracy requirement in most tracked tasks. There is also the potential to improve the system by adding notification features and asking whether the worker has started a task after an uninterrupted presence has been detected, rather than simply letting a worker manually enter the task start and finish dates.
Limitations
One of the main limitations of the method is the inaccurate identification of the correct duration range for some tasks. Specifically, (1) task schedules are still needed to identify the first task in each workflow or to detect a task switch when there is no absence between two tasks conducted by the same worker; (2) with this method, we cannot distinguish between several tasks done by the same person unless we define a threshold time range until the next presence appears (in this case, it is 4 h). In future research, we propose placing beacons to monitor the movement of materials that the tasks use so that more accurate identification of task switching can be made based on the interactions of tracked workers and materials. (3) In the investigated project, because the locations were small (bathrooms) and the dependencies between tasks were technical, it is reasonable to assume that the successor task could not start before the predecessor had been finished. Without technical dependencies, it may not be as easy to identify the correct task that should be performed. (4) In our validation process, we found that a small number of tasks did not match the workers’ records very well. In future work, the system could ask for verification of the start and finish times from workers to resolve ambiguities.
Conclusion
This research has demonstrated how the proposed BLE technology-based real-time tracking system can be implemented in construction sites to detect task start and finish times based on dependencies and task schedules. The automated detection of progress information was validated against workers’ self-report data. After analyzing 12 selected tasks in carpenter, tiling, and painting work trades, we learned that only an average of 34.42% of presence was needed to complete the tasks based on task PIs, and up to 66.17% of the task schedule could be compressed if the optimal workflow was reached, which shows great improvement potential in construction planning and control. Task presence indices indicate the presence level required to achieve the actual duration, while the presence-to-plan ratios indicate the presence level required to achieve the planned duration and capacities to compress the schedule. The results show that the high variability of task presences is an indication of waste. The information provides new insights that could contribute to establishing better workflows from lean interventions in construction.
Data Availability Statement
The raw data supporting the conclusions of this article can be made available by the authors upon request.
Author Contributions
JZ, OS, and AP: conceptualization. JZ and OS: methodology. JZ: data collection, data analysis, and writing—original draft. JZ, EP, OS, and AP: writing—review and editing. OS: funding acquisition. All authors contributed to the article and approved the submitted version.
Funding
This work was supported by the Digitalizing Construction Workflows (DiCtion) research project (Grant No. 2758/31/2017) funded by the Business Finland, Aalto University, and a consortium of companies.
Conflict of Interest
The authors declare that the research was conducted in the absence of any commercial or financial relationships that could be construed as a potential conflict of interest.
References
Akhavian, R., and Behzadan, A. H. (2016). Smartphone-based construction workers’ activity recognition and classification. Autom. Constr. 71, 198–209. doi: 10.1016/j.autcon.2016.08.015
Al-Momani, A. H. (2000). Construction delay: a quantitative analysis. Int. J. Proj. Manag. 18, 51–59. doi: 10.1016/S0263-7863(98)00060-X
Arashpour, M., and Arashpour, M. (2015). Analysis of workflow variability and its impacts on productivity and performance in construction of multistory buildings. J. Manag. Eng. 31:4015006. doi: 10.1061/(ASCE)ME.1943-5479.0000363
Ballard, H. G. (1997). Lookahead planning: the missing link in production control. Paper Presented at the 5th Annual Conference of the International Group for Lean Construction, Gold Coast, QLD, 13–26.
Ballard, H. G. (2000). The Last Planner System of Production Control. Available online at: http://etheses.bham.ac.uk//id/eprint/4789/ (accessed May 2000).
Ballesteros-Perez, P., Sanz-Ablanedo, E., Soetanto, R., González-Cruz, M. C., Larsen, G. D., and Cerezo-Narváez, A. (2020). Duration and cost variability of construction activities: an empirical study. J. Constr. Eng. Manag. 146:04019093. doi: 10.1061/(asce)co.1943-7862.0001739
Benjaoran, V., Tabyang, W., and Sooksil, N. (2015). Precedence relationship options for the resource levelling problem using a genetic algorithm. Constr. Manage. Econ. 33, 711–723. doi: 10.1080/01446193.2015.1100317
Bertelsen, S. (2003). Construction as a complex system. Paper Presented At the 11th Annual Conference of the International Group for Lean Construction, Blacksburg, VA.
Brodetskaia, I., Sacks, R., and Shapira, A. (2013). Stabilizing production flow of interior and finishing works with reentrant flow in building construction. J. Constr. Eng. Manag. 139, 665–674. doi: 10.1061/(ASCE)CO.1943-7862.0000595
Castro-Lacouture, D., Süer, G. A., Gonzalez-Joaqui, J., and Yates, J. K. (2009). Construction project scheduling with time, cost, and material restrictions using fuzzy mathematical models and critical path method. J. Constr. Eng. Manag. 135, 1096–1104. doi: 10.1061/(ASCE)0733-93642009135:101096
Cheng, T., and Teizer, J. (2013). Real-time resource location data collection and visualization technology for construction safety and activity monitoring applications. Autom. Constr. 34, 3–15. doi: 10.1016/j.autcon.2012.10.017
Cheng, T., Teizer, J., Migliaccio, G. C., and Gatti, U. C. (2013). Automated task-level activity analysis through fusion of real time location sensors and worker’s thoracic posture data. Autom. Constr. 29, 24–39. doi: 10.1016/j.autcon.2012.08.003
Costin, A., Pradhananga, N., and Teizer, J. (2012). Leveraging passive RFID technology for construction resource field mobility and status monitoring in a high-rise renovation project. Autom. Constr. 24, 1–15. doi: 10.1016/j.autcon.2012.02.015
Dave, B., Kubler, S., Främling, K., and Koskela, L. (2014). Addressing information flow in lean production management and control in construction. Paper Presented at the 22nd Annual Conference of the International Group for Lean Construction, Oslo, 581–592.
Dozzi, S. P., and AbouRizk, S. M. (1993). Productivity in Construction. Ottawa, ONT: Institute for Research in Construction.
Frandson, A., Seppänen, O., and Tommelein, I. D. (2015). Comparison between location based management and takt time planning. Paper presented at the The 23rd Annual Conference of the International Group for Lean Construction, Perth, WA.
Frandson, A., and Tommelein, I. D. (2014). Development of a takt-time plan: a case study. Paper Presented at the Construction Research Congress, Atlanta, GA, 1646–1655. doi: 10.1061/9780784413517.168
Gómez-de-Gabriel, J. M., Fernández-Madrigal, J. A., López-Arquillos, A., and Rubio-Romero, J. C. (2019). Monitoring harness use in construction with BLE beacons. Measurement 131, 329–340. doi: 10.1016/j.measurement.2018.07.093
Goodrum, P. M., McLaren, M. A., and Durfee, A. (2006). The application of active radio frequency identification technology for tool tracking on construction job sites. Autom. Constr. 15, 292–302. doi: 10.1016/j.autcon.2005.06.004
Gouett, M. C., Haas, C. T., Goodrum, P. M., and Caldas, C. H. (2011). Activity analysis for direct-work rate improvement in construction. J. Constr. Eng. Manag. 137, 1117–1124. doi: 10.1061/(ASCE)CO.1943-7862.0000375
Hamzeh, F. R., and Aridi, O. Z. (2013). Modeling the last planner system metrics: a case study of an AEC company. Paper Presented at the The 21st Annual Conference of the International Group for Lean Construction IGLC, Fortaleza, 599–608.
Hamzeh, F. R., Ballard, G., and Tommelein, I. D. (2009). Is the last planner system applicable to design?—A case study. Paper Presented at the 17th Annual Conference of the International Group for Lean Construction, Taipeipp, 165–176.
Heinonen, A., and Seppänen, O. (2016). Takt time planning in cruise ship cabin refurbishment: Lessons for lean construction. Paper presented at the The 24th Annual Confenrence of the International Group for Lean Construction, Boston, MA, 23–32.
Jabbari, A., Tommelein, I. D., and Kaminsky, P. M. (2020). Workload leveling based on work space zoning for takt planning. Autom. Constr. 118:103223. doi: 10.1016/j.autcon.2020.103223
Jenkins, J., and Orth, D. (2004). Productivity improvement through work sampling. Cost Eng. (Morgantown, W. VA.) 46, 27–32.
Kala, T., Mouflard, C., and Seppänen, O. (2012). Production control using location-based management system on a hospital construction project. Paper Presented at the 20th Annual Conference of the International Group for Lean Construction, San Diego, CA.
Kalsaas, B. T. (2010). Work-time waste in construction. Paper Presented at the The 18th Annual Conference of the IGLC, Technion, Haifa, 507–517.
Kenley, R., and Seppänen, O. (2009). Location-based management of construction projects: Part of a new typology for project scheduling methodologies. Paper Presented at the Proceedings of the 2009 Winter Simulation Conference (WSC), Austin, TX, 2563–2570. doi: 10.1109/WSC.2009.5429669
Kenley, R., and Seppänen, O. (2010). Location-Based Management for Construction. London: Routledge, doi: 10.4324/9780203030417
Konstantinou, E., Lasenby, J., and Brilakis, I. (2019). Adaptive computer vision-based 2D tracking of workers in complex environments. Autom. Constr. 103, 168–184. doi: 10.1016/j.autcon.2019.01.018
Lin, P., Li, Q., Fan, Q., and Gao, X. (2013). Real-time monitoring system for workers’ behaviour analysis on a large-dam construction site. Int. J. Distrib. Sens. Netw. 9:509423. doi: 10.1155/2013/509423
Liu, H., Darabi, H., Banerjee, P., and Liu, J. (2007). Survey of wireless indoor positioning techniques and systems. IEEE Trans. Syst. Man Cybernet. Part C (Appl. Rev.) 37, 1067–1080. doi: 10.1109/tsmcc.2007.905750
Lu, M., and Li, H. (2003). Resource-activity critical-path method for construction planning. J. Constr. Eng. Manag. 129, 412–420. doi: 10.1061/(ASCE)0733-93642003129:4(412
Luo, X., Li, H., Cao, D., Yu, Y., Yang, X., and Huang, T. (2018). Towards efficient and objective work sampling: Recognizing workers’ activities in site surveillance videos with two-stream convolutional networks. Autom. Constr. 94, 360–370. doi: 10.1016/j.autcon.2018.07.011
Mohanty, L., Chae, S., and Yang, Y. (2020). Identifying productive working patterns at construction sites using BLE sensor networks. Dev. Built Environ. 4:100025. doi: 10.1016/j.dibe.2020.100025
Olivieri, H., Seppänen, O., Alves, T. D. C., Scala, N. M., Schiavone, V., Liu, M., et al. (2019). Survey comparing critical path method, last planner system, and location-based techniques. J. Constr. Eng. Manag. 145:04019077. doi: 10.1061/(asce)co.1943-7862.0001644
Olivieri, H., Seppänen, O., and Peltokorpi, A. (2017). Real-time tracking of production control: requirements and solutions. Paper Presented at the 25th Annual Conference of the International Group for Lean Construction, Heraklion, 671–678.
Park, J., Kim, K., and Cho, Y. K. (2017). Framework of automated construction-safety monitoring using cloud-enabled BIM and BLE mobile tracking sensors. J. Constr. Eng. Manag. 143:5016019. doi: 10.1061/(ASCE)CO.1943-7862.0001223
Park, J., Marks, E., Cho, Y. K., and Suryanto, W. (2016). Performance test of wireless technologies for personnel and equipment proximity sensing in work zones. J. Constr. Eng. Manag. 142:4015049. doi: 10.1061/(ASCE)CO.1943-7862.0001031
Park, M. W., and Brilakis, L. (2016). Continuous localization of construction workers via integration of detection and tracking. Autom. Constr. 72, 129–142. doi: 10.1016/j.autcon.2016.08.039
Pasila, H. (2019). Impact of Lean-Intervention on Productivity. Available online at: http://urn.fi/URN:NBN:fi:aalto-201906234166 (accessed June 17, 2019).
Peffers, K., Tuunanen, T., Rothenberger, M. A., and Chatterjee, S. (2007). A design science research methodology for information systems research. J. Manag. Inform. Syst. 24, 45–77. doi: 10.2753/MIS0742-1222240302
Picard, H. E. (2002). Construction process measurement and improvement. Paper Presented at the The 10th Annual Conference on Lean Construction, Gramado.
Reinbold, A., Seppänen, O., Peltokorpi, A., Singh, V., and Dror, E. (2019). Integrating indoor positioning systems and BIM to improve situational awareness. Paper Presented at the 27th Annual Conference of the International Group for Lean Construction, Dublin, 1141–1150. doi: 10.24928/2019/0153
Sacks, R., Radosavljevic, M., and Barak, R. (2010). Requirements for building information modeling based lean production management systems for construction. Autom. Constr. 19, 641–655. doi: 10.1016/j.autcon.2010.02.010
Sacks, R., Seppänen, O., Priven, V., and Savosnick, J. (2017). Construction flow index: a metric of production flow quality in construction. Constr. Manag. Econ. 35, 45–63. doi: 10.1080/01446193.2016.1274417
Saukkoriipi, L. (2007). Measurement of waste and productivity in relation to lean thinking. Paper Presented at the The 15th Annual Conference of the International Group for Lean Construction, East Lansing, MI, 67–76.
Senior, B. A. (2007). Implications of action theories to lean construction applications. Paper Presented at the 15th Annual Conference of the International Group for Lean Construction, East Lansing, MI, 407–416.
Seppänen, O. (2009). Empirical Research on the Success of Production Control in Building Construction Projects. Available online at: http://urn.fi/URN:ISBN:978-952-248-061-3 (accessed 2009).
Seppänen, O., Ballard, G., and Pesonen, S. (2010). The combination of last planner system and location-based management system. Lean Constr. J. 6, 43–54.
Seppänen, O., Evinger, J., and Mouflard, C. (2013). “Comparison of LBMS schedule forecasts to actual progress,” in Proceedings of the 21st Ann. Conf. of the Int. Group for Lean Construction, eds C. T. Formoso, and P. Tzortzopoulos, Fortaleza 31-2. 569–578. Available online at: https://iglc.net/Papers/Details/947
Seppänen, O., Evinger, J., and Mouflard, C. (2014). Effects of the location-based management system on production rates and productivity. Constr. Manag. Econ. 32, 608–624. doi: 10.1080/01446193.2013.853881
Seppänen, O., and Kankainen, J. (2004). Empirical research on deviations in production and current state of project control. Paper Presented at the 12th Annual Conference of the International Group for Lean Construction, Helsingør, 12.
SiteDrive SiteDrive Webpage. Available online at: https://www.sitedrive.com/ (accessed 2016).
Tarek, Y., Basha, B., Faek, F., and Hamzeh, F. (2014). Implementing takt-time planning in construction to improve work flow. Paper Presented at the 22nd Annual Conference of the International Group for Lean Construction, Oslo, 787–798. doi: 10.13140/RG.2.1.4721.8726
Tetik, M., Peltokorpi, A., Seppänen, O., Viitanen, A., and Lehtovaara, J. (2019). Combining takt production with industrialized logistics in construction. Paper Presented at the 27th Annual Conference of the International Group for Lean Construction, Dublin, 299–310. doi: 10.24928/2019/0156
Thomas, H. R., Horman, M. J., de Souza, U. E. L., and Zavrski, I. (2002). Reducing variability to improve performance as a lean construction principle. J. Constr. Eng. Manag. 128, 144–154. doi: 10.1061/(asce)0733-9364(2002)128:2(144)
Yang, J., Shi, Z., and Wu, Z. (2016). Vision-based action recognition of construction workers using dense trajectories. Adv. Eng. Inform. 30, 327–336. doi: 10.1016/j.aei.2016.04.009
Zhang, B., Zhu, Z., Hammad, A., and Aly, W. (2018). Automatic matching of construction onsite resources under camera views. Autom. Constr. 91, 206–215. doi: 10.1016/j.autcon.2018.03.011
Zhao, J., Olivieri, H., Seppanen, O., Peltokorpi, A., Badihi, B., and Lundstrom, P. (2017). Data analysis on applying real time tracking in production control of construction. Paper Presented at the 2017 IEEE International Conference on Industrial Engineering and Engineering Management (IEEM), Singapore, 573–577. doi: 10.1109/IEEM.2017.8289956
Keywords: real-time tracking, production control, construction, Bluetooth low-energy tracking technology, task-level uninterrupted presence, task progress
Citation: Zhao J, Pikas E, Seppänen O and Peltokorpi A (2021) Using Real-Time Indoor Resource Positioning to Track the Progress of Tasks in Construction Sites. Front. Built Environ. 7:661166. doi: 10.3389/fbuil.2021.661166
Received: 30 January 2021; Accepted: 07 April 2021;
Published: 29 April 2021.
Edited by:
Søren Wandahl, Aarhus University, DenmarkReviewed by:
Yihai Fang, Monash University, AustraliaTomoyuki Gondo, The University of Tokyo, Japan
Copyright © 2021 Zhao, Pikas, Seppänen and Peltokorpi. This is an open-access article distributed under the terms of the Creative Commons Attribution License (CC BY). The use, distribution or reproduction in other forums is permitted, provided the original author(s) and the copyright owner(s) are credited and that the original publication in this journal is cited, in accordance with accepted academic practice. No use, distribution or reproduction is permitted which does not comply with these terms.
*Correspondence: Jianyu Zhao, amlhbnl1LnpoYW9AYWFsdG8uZmk=