 James Ogechi Kereri
 Carol Friedland
 Christofer Harper3
94% of researchers rate our articles as excellent or good
Learn more about the work of our research integrity team to safeguard the quality of each article we publish.
Find out more
ORIGINAL RESEARCH article
Front. Built Environ., 07 May 2021
Sec. Construction Management
Volume 7 - 2021 | https://doi.org/10.3389/fbuil.2021.636000
This article is part of the Research TopicDoctoral Research in Construction ManagementView all 10 articles
Relational and social behaviors of construction project team members explain relationship embeddedness. The literature review revealed three social behaviors (i.e., past experience, benevolence, and integrity) and seven relational behaviors (i.e., harmonization of conflict, propriety of means, restraint of power, reliance and expectation, contractual solidarity, flexibility, and reciprocity) commonly exhibited by construction project team members. Through a binomial logistic regression, research findings revealed that past experience was a significant (p < 0.01) predictor for five of the seven relational behaviors while benevolence and integrity were each significant (p < 0.01) predictors for three of the seven relational behaviors. Overall, out of the seven relational behaviors, only propriety of means is predicted by all the three social behaviors. Through internal validation, the prediction models performed well based on both positive predictive values and negative predictive values. From a relationship management standpoint, this research introduces relational and social behaviors of team members as triggers of relationship embeddedness. The results contribute to understanding the effect of social behaviors on the relational behaviors found in construction project teams where eleven statistically significant models that predict relational behaviors using the social behaviors were validated. The implication of this is that construction industry practitioners can use these prediction models to predict relationship interdependencies of team members.
Improving construction project team relationships remains a topic of interest in construction management both in research and practice (Abdirad and Pishdad-Bozorgi, 2014; Chen, 2019), and the need to address the perennial problem of fragmented relationships in construction project teams (Alashwal and Fong, 2015; Ma et al., 2021; Hu and Chong, 2020). Team member relationships are established either formally or informally. Formal relationships are based on team member roles defined in contract documents signed by the project parties (e.g., a window installation subcontractor will depend on the masonry subcontractor to construct the proper window openings). Informally, team members interact outside their roles, which can be within the workplace or outside work environments (e.g., sporting events, family picnics, etc.). Therefore, relationships form as a result of people who have something in common (e.g., friendships arising from a commonality, relationships developing at places of work, or as neighbors). As such, individuals who have comparable attributes or behaviors are classified together, while those of dissimilar attributes are left out of the network, which can strain team relationships.
Recent research indicate that aspects of relationship embeddedness founded in relational contracts can have a significant impact on the performance of construction teams (Martins et al., 2017; Arranz et al., 2020; Dogbe et al., 2020). Relationship embeddedness can be defined as the extent of relationship interdependencies between two or more team members and considers the interpersonal relationships that team members have with one another (Sporleder and Moss, 2002). Relationship embeddedness of construction project team members shape the social interactions within the team (Rezvani et al., 2018). Social interactions are based on actions, and practices where team members are mutually oriented towards one another, and that one member’s behavior will affect another. Furthermore, both relational and social behaviors of individual team members have been associated with relationship embeddedness (Sven, 2004). That is to say that construction project teams are embedded in a network of relationships which depend on the social and relational behaviors of individual team members.
Construction partnering organizations and relationship management researchers must, therefore, understand the triggers of relationship embeddedness in order to attain higher levels of construction team performance. For instance, team members’ relational behaviors require the interaction and reinforcement of socially expected behaviors for the members to develop into a cohesive, high-performing team (Moran, 2005). More specifically, according to Chinowsky et al., (2010), both relational and social behaviors are central to the establishment and maintenance of sound relationships in construction teams where the relational behaviors refer to the interconnections between team members, while the social behaviors drive team relationships. What this mean is that each of these behaviors play a role in keeping the balance in team member relationships. Yet, there is a gap in research to investigate the influence of social behaviors on relational behaviors of construction team members.
The aim of this paper is to better understand the association between relational and social behaviors. To achieve this, a United States national level survey was conducted to collect information describing the respondents’ opinions on the presence and absence of relational and social behavior variables. A suite of logistic regression models was fit to the reported relational (dependent variable) and social (independent variable) behaviors. Validation of the model was achieved by partitioning the data into 70% training and 30% testing datasets. The contribution of this paper is a quantitative analysis methodology to predict the probability of a relational behavior being expressed given the presence/absence of the social behavior, along with the results of the models fit with the collected data. The results of this paper provide greater insight into the role of the relational and social behaviors of construction team members in relationship embeddedness. Construction partnering organizations and relationship management researchers will find value in this paper as they work to understand how to create more cohesive and collaborative construction teams.
Relationship embeddedness refers to the extent of relationship interdependencies between two or more team members and considers the interpersonal relationships that team members have with one another (Sporleder and Moss, 2002). Embedded relationships in construction project teams are exhibited when one team member holds a connection with two others who are not connected, the embedded team member acts as a “go-between,” hence tying them together (Chandler and Wieland, 2010). The go-between plays a crucial role in passing information and expectations from an embedded member to unconnected members. In construction project teams, go-betweens essentially break down contractual relationships for ease of information and resource flow, which is more relational rather than transactional. The go-betweens link small groupings that exist within the network and breaks down the hierarchy that exists within the team (Chandler and Wieland, 2010). In the process, a network is formed, where members are exposed to team members’ relational and social behaviors; thus, the network moves beyond individual concerns to those members of the project.
Social behaviors are described as drivers of team relationships where members establish relationships based on the wellbeing of others, and members do so without expecting to be paid back (Triguero, 2018). Kereri and Harper (2019) identified social behaviors commonly exhibited by construction team members and they include: 1) previous experiences (S1), 2) benevolence (S2), and 3) integrity (S3).
Past experience (S1): The previous experiences of team members who have worked together can influence how these members treat one another on a current project. For example, previous negative work experience may be damaging to relationships, thereby causing parties to lose trust in one another. On the other hand, a previous positive working experience may foster better relationships in a current project. As such, both positive and negative past experiences carry the potential of shaping individual behaviors of team members.
Benevolence (S2): Benevolence refers to one’s concern for the well-being of others and to be generous or to show kindness to others. In construction project teams, a benevolent team member will show concern for the welfare of others by 1) showing consideration for the needs and interests of others; 2) acting in ways that will protect the interests of other team members; and 3) desisting from exploiting others within the team for the sake of self-interest (McAllister, 1995; Mishra, 2012). Benevolence in a team can be exhibited through such behaviors as members being willing to meet, being compassionate to one another, willingness to act in good faith, and pooling resources.
Integrity (S3): Integrity is defined as acting on accepted principles of right and wrong and being attentive to how one achieves results (Missimer et al., 2017). Integrity in a construction project team can be exhibited in terms of the level of blame, following through on commitments, willingness to help others, and dealing with difficult situations.
Relational behaviors stem from the well-researched relational contract theory premised on informal contracts and focused on interpersonal relationships (Harper et al., 2016). Relational behaviors exhibit a point of reference and establish standards to which parties are guided while executing specific tasks in a project. Harper et al. (2016) conducted a literature review and identified seven commonly discussed relational behaviors including:
Harmonization of conflict (R1): In relational approaches, harmonization and conflict resolution is informal, flexible, and internal, because team members establish a distinct social order as an exchange becomes more relational (Kaufmann and Dant, 1992).
Propriety of means (R2): Requires that team members adhere to principles of division of responsibilities, together with contract terms and conditions. Team members are to be fair in their dealings through the principle of gain share and pain share, through risk and benefit sharing (Ning et al., 2013).
Restraint of power (R3): It is an expectation between team members that none of the project team members will apply their legitimate authority against any other member’s interest (Kaufmann and Dant, 1992).
Reliance and expectation (R4): Team member relationships are based on the promise that others will fulfill their part of the bargain. The expectations are anchored on the exchange of promises (Harper et al., 2016).
Contractual Solidarity (R5): Harmonious and peaceful state of a team that is able to preserve a relationship, especially in situations where one team member is faced with a difficult situation (Ning et al., 2013).
Flexibility (R6): Allows changes to occur in the environment to which the parties operate, or if the transaction exchanges between the parties are outdated, the flexibility of the team allows for termination and creation of appropriate exchanges (Macneil, 1985).
Reciprocity (R7): Refers to team members who treat one another as equals, and exchanges or transactions take place with these individuals being symmetrically placed. It can be said that reciprocity is a relation between individuals who mutually depend on each other’s actions or influence (Macneil, 1985).
A cross-sectional survey was developed to collect data to answer the research question on the relationship between relational and social behaviors exhibited by construction project team members. The questionnaire was administered through the Qualtrics online survey tool to construction project team members. The factors considered in designing the survey include open-ended vs. closed-ended, rating scales vs. ranking scales, rating scale format, order of response alternatives, question wording, and question order. After taking these factors into consideration, the questionnaire was divided into two sections for clarity, with Introduction section containing questions regarding personal and project information, and Methodology section containing questions regarding relational and social behaviors of the project team members. Introduction section had both open and closed-ended questions while Methodology section questions consisted of statement items based on relational and social behaviors of team members (Supplementary Appendix S1). The statement items in Methodology section and the general format of the questionnaire builds upon the research conducted by Harper (2014). Although the behaviors were defined, the questions that were used in this questionnaire were intentionally subjective, as people’s experiences are intrinsically subjective, and the authors did not want to impart their interpretation into respondents’ perceptions of these behaviors.
To recognize and eliminate measurement errors, the questionnaire was validated by pre-testing the questions on targeted respondents (construction management professors and qualified industry experts) to review the questionnaire reliability and consistency in responses. Qualified industry experts were qualified using the alternative point system developed by Hallowell and Gambatese (2010). After developing the questionnaire, the questions were tested with the experts. The questionnaire was sent out to these two groups via email that included a Qualtrics link. The pretesting questionnaires were analyzed for consistency. Consistency was assessed by comparing the responses from the two groups. The questionnaire was considered consistent given that the responses from the two groups were equivalent.
Structured follow-up phone interviews were conducted to gain feedback on the clarity of wording, layout and style, and the general appropriateness of the survey questions to measure and assess the targeted constructs (content validity). The researcher took notes during the interviews on any issues raised concerning the questionnaire and noted key suggestions. However, feedback was limited, and improvement of the construct validity is discussed later in this paper as an opportunity for significant future work.
The data collected from the statement items in Methodology section were ratings using an ordinal Likert-scale format with ratings of 1 = strongly disagree, 2 = disagree, 3 = neither agree nor disagree, 4 = agree, and 5 = strongly disagree. However, the rating scale was categorical and thus there was a need to map the responses based on the rubric attached to each question to generate the final format of the data that was ultimately used in the analysis. The rubric had contrasting scenarios; choice implying that team member exhibited both relational and social behavior, (1,1), choice implying team members exhibited relational behavior and no social behavior, (1,0), did not exhibit relational behavior but exhibited a social behavior, (0,1), and where team member did not exhibit relational nor social behavior (0,0). However, there were situations where neither the question nor the rubric did not capture any of these scenarios and was marked as N/A and were not included in the analysis. In situations where social behaviors were not explicitly stated in the rubric based on the social behavior measures, they were interpreted as implied.
Coverage errors occur when the sampling frame does not match the population investigated (Groves, 2004). This study focused on the United States construction industry; it may be assumed that the various regions and states share similarities, and thus the sample adequately represented the population. The sample size was calculated based on a margin of error of two percent assuming a 95% confidence interval and a response rate of 20–30%. Qualtrics recorded respondent locations, which were checked and showed that they were distributed throughout the United States.
According to Groves (2004), sampling errors occur due to sampling bias (when subjects within a sampling frame are not selected), or due to sampling variance (if a number of independent subjects are selected from the same sample). The simple random sampling technique used offered an equal chance for all subjects selected.
Non-response errors arise from the failure of survey respondents to respond to the entire survey (Groves, 2004). To decrease non-response errors, the survey was designed in Qualtrics so that respondents cannot proceed to the next set of questions until all current questions are answered. This “forced response” option was used to decrease non-response answers. With this study being purely academic, the author tried to make the respondents view it as such by using a university email address in sending the request to increase the rate of response. Also, the email invitation to participate in the survey was personalized (request was received as a personal email, with their name), using the Mail Merge function in MS Word/Outlook. A distribution history was exported from Qualtrics and email reminders were sent weekly to prospective respondents who had not filled out the survey after assessing recipients who had completed, started, and not started the survey. The survey was closed after the third week.
The population for this study included representatives of construction project decision makers (e.g., project engineers, project managers, design engineers, superintendents, contract administrators, estimators, schedulers, field workers, and operations and maintenance personnel). The respondents to the survey were to complete the questionnaire from the perspective of an ongoing or recently completed construction project that the respondent participated in. The inclusion criteria also required that the respondents were based and working in the United States construction industry.
To develop a random sampling frame, professional organization databases listing the names and contacts of construction decision makers were used. The questionnaire was then sent to 3,207 construction practitioners, whose contact information was obtained from the Construction Management Association of America Certified Construction Manager database, the State Licensing Boards for Contractors with online registration databases (Louisiana, Texas, Ohio, Illinois, California, Pennsylvania, and Michigan), Design-Build Institute of America, and the American Institute of Architects. Of the total sent, 475 had emails that no longer worked, and ten were reported as having retired. Once the questionnaire was closed, 553 questionnaire responses (20.3% response rate) had been received, which were then used for the analysis.
Data processing started with cleaning the data by organizing participant responses using unique question identifier IDs. The responses were then assessed for completeness. The questions in Methodology section of the survey covering relational and social behaviors were considered as being crucial variables in the study and therefore, the authors considered responses that answered at least 19 out of the 21 (90%) questions as adequate for the analysis. After cleaning the data and checking it for completeness, 392 questionnaire responses (14.4% response rate) were used for the analysis. The relational behavior variables are represented as Rmn, where m designates relational behaviors and social behaviors are designated as Sn (i.e., S1 for past experience, S2 for benevolence, and S3 for integrity). For each relational behavior, Rm, there are three variables (i.e., one under each social behavior; Rm1, Rm2, and Rm3).
For each relational behavior, RmRmn, the three social behavior constructs, S1, S2, and S3 were measured in contrasting scenarios that those behaviors are exhibited within a team. For past experience, S1, members were asked how they related with others whom they worked with previously. For benevolence, S2, varied situations in which the behavior is exhibited by construction project team members are used in the study, which are willingness for team members to meet, being compassionate to one another, willingness to act in good faith, and members pooling their resources together. Integrity S3, on the other hand was measured by the level of blame, following through on commitments, willingness to help others, and how a respondent deal with a difficult situation. Table 1 shows the counts of the mapped responses from the statement items in Methodology section.

TABLE 1. Absolute frequencies for relational and social behavior data.
Figure 1 graphically shows the absolute frequencies of the relational and social behavior data. The majority of survey respondents reported having exhibited relational behaviors, Rmn and not social behaviors, Sn (1,0). Situations where respondents reported to have exhibited social behaviors, Sn and not relational behaviors, Rmn (0,1) were least expressed.

FIGURE 1. Absolute frequencies for relational and social behavior variables.
Binomial logistic regression which in its basic form uses a logistic function is used to model binary relational behavior (dependent variable). Additionally, many more functions exist including the one utilized in this paper as shown in Eq. 1 where, Rmn is the mth relational behavior modeled as a function of Sn, which is the nth social behavior. The index variable m ranges from 1 to 7 and n ranges from 1 to 3, corresponding with the behaviors previously described. The social behavior Sn is binary, with a null value indicating it is not expressed and a value of unity indicating it is expressed. The probability P(Rmn = 1) is the probability of that the relational behavior is expressed (i.e., the value of this variable is unity), as opposed to a null value, indicating it is not expressed. Regression coefficients β0 and β1 are determined by fitting this model structure to the collected data. Given the three social behaviors and seven relational behaviors, 21 models were fit.
After fitting the collected data to the model in Eq. 1, logistic regression coefficients and overall models are tested for statistical significance. Significance tests are based on standard errors associated with the logistic coefficients and p values are used to test the null hypothesis that the logistic coefficient is zero (0), indicating that there is no statistically significant correlation between social and relational behaviors.
Logistic regression coefficients are in log-odds units and cannot be interpreted in the same way as regular ordinary least squares (OLS), posing a challenge in their interpretation. Therefore, regression coefficients are often converted to odds using Eq. 2 (Statistical Consulting Group, 2016). When Sn = 1, indicating that the social behavior is expressed, the odds are calculated as shown in Eq. 3. When Sn = 0, indicating that the social behavior is not expressed, the odds are calculated as shown in Eq. 4. The odds ratio (OR), shown in Eq. 5, is then calculated by comparing the odds of the two states (Sn = 0 and Sn = 1). The odds ratio indicates how much more likely it is that the relational behavior is expressed when the social behavior is expressed, compared with when it is not expressed. Note that Eq. 5 can also be expressed as the exponentiated value of the logistic coefficient, β1.
The 95% lower confidence interval (LCI) and upper confidence interval (UCI) for the odds ratios, collectively called OR 95% CI, are calculated in accordance with Eq. 6, where S.E.β1 is the standard error of the estimated model coefficient β1.
Predicted probability values calculated in accordance with Eq. 1 when Sn = 0 and when Sn = 1, can be compared using relative probability (RP) as shown in Eq. 7. Similar to odds ratio, when relative probability is greater than 1, it means that a team member who exhibit a social behavior being associated with a relational behavior of another is higher than the probability of those who do not exhibit social behaviors.
The Pearson and deviance chi-square tests are often used to evaluate the goodness of fit of OLS regression models. Pearson and deviance chi-square tests are based on the minimization of squared differences between predicted and observed values, a condition that is not applicable for logistic regression. In their place, pseudo R-square (R2) goodness of fit measures are used. Pseudo R2 statistics commonly used are McFadden, Cox and Snell, and Nagelkerke R Squares (Allison, 2014). Cox and Snell R2 has a score of less than 1, and therefore, Nagelkerke’s pseudo R2 adjusts this deficit to make it cover a full range from 0 to 1 (Chan, 2005). Nagelkerke’s pseudo R2 (RNK2) is calculated using Eq. 8, where RCS2 is Cox and Snell’s Pseudo R2 and RMAX2 is explained in Eq. 9, where n is the sample size, and LL represents log-Likelihood for the null model. The closer Nagelkerke’s pseudo R2 is to 1, the better the logistic regression model fits (Liao, 2000).
where
Statistical prediction requires that the models be validated, as validation gives prediction models credibility that the resulting output would occur given similar input variables. In other words, robust model validation at a specified confidence level offers credibility that the prediction model results can be relied upon. Prediction performance for logistic regression is evaluated through internal (e.g., data splitting) or external (i.e., new data) validation. For this paper, the models are internally validated by partitioning the original data into 70% training and 30% testing datasets. Thus, the models are fit on 70% of the data (274 responses), while 30% of the data (117 responses) was retained (i.e., not used for fitting) to validate the model on new data.
Statistically significant models were tested for prediction performance using a confusion matrix (Steyerberg et al., 2010). In constructing the confusion matrix, the predicted probabilities of team members’ relational behaviors given the social behaviors is calculated using Eq. 1. Then a cutoff/classifier, pmn* is determined as a number that lies between the two probabilities (i.e., probabilities calculated when Sn = 0 and when Sn = 1). If the estimated probability is greater than this cutoff/classifier, 1 is assigned, otherwise 0 is assigned. A two by two table, as shown in Table 2, is formed by counting the four outcomes of the binary classifier:
True positive, which represents positive subjects that are classified as positive (TP)
False positive, which represents incorrect positive prediction (FP)
True negative, which represents negative subjects that are classified as negative (TN)
False negative, which represents incorrect negative prediction (FN)
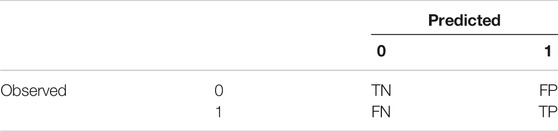
TABLE 2. Binary classifier outcomes.
The models are characterized by accuracy (Eq. 10), sensitivity (Eq. 11), and specificity (Eq. 12) performance metrics. The accuracy of a prediction model is its ability to correctly differentiate the relational behaviors influenced by social behaviors and those that are not. Sensitivity of the prediction models is their ability to determine relational behaviors correctly, whereas specificity is the ability of the prediction models to determine the social behaviors correctly. Perfect accuracy, sensitivity, and specificity are demonstrated when these values equal unity, while a value of zero is the lowest that can be calculated.
Accuracy is the ratio of correct predictions to total predictions made. The higher the accuracy, the better the prediction model. Sensitivity and specificity are useful if the values are high. High sensitivity values indicate that it is unlikely that the prediction models will predict that there is a relationship between relational and social behaviors when indeed there is no relationship, while low sensitivity values indicate the prediction models will have a high false negative rate. High specificity values mean that the prediction models are unlikely to predict a false relationship between relational and social behaviors when there is no relationship, while low specificity values indicate that the prediction models will have a high false positive rate.
The applicability of sensitivity and specificity has strong limitations. For example, sensitivity is only useful for deciding that a negative outcome of an analysis is so unusual that it strongly indicates the absence of the situation under investigation. This means that sensitivity analysis is only useful when these values are high. On the other hand, an analysis with high specificity is useful only for deciding that a positive outcome of an analysis is so unusual that it strongly indicates the presence of the condition under investigation. For meaningful interpretation of these metrics, both sensitivity and specificity values need to be high. Unfortunately, when sensitivity is low, specificity is high and vice versa because models with high sensitivity often come with fairly high rate of false positives. As such, Positive Predictive Value (PPV; Eq. 13) and Negative Predictive Value (NPV; Eq. 14) metrics are also calculated to aid in interpreting validation results of prediction models, with values ranging from 0 (worst) to 1 (best). High PPV is desirable, meaning that false positive results are minimized during the analysis. Moderate PPV may also be acceptable if follow-up studies are permitted. Similarly, high NPV is desirable, meaning that false negatives are minimized during the analysis. Moderate NPVs may also be acceptable if the prediction models are based on a follow up study for a known condition.
The questionnaire respondents provided their current role and years worked in the construction industry as well as the number of years in their current role (Table 3). The profiles indicate that the respondents represent top management (e.g., vice president, construction coordinators, and program managers), middle management (e.g., senior project managers and project principals) or professional level employees (e.g., project managers, project engineers, and estimators, schedulers).
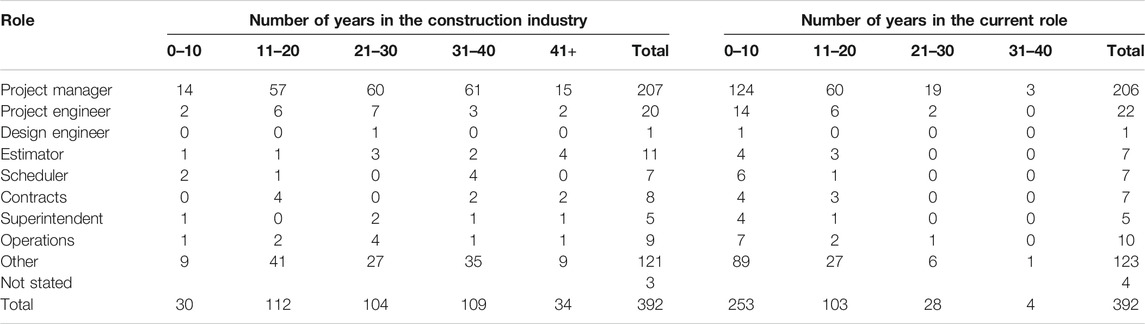
TABLE 3. Respondents’ role and work experience.
Table 3 includes not stated values for number of years in the construction industry (n = 3) and for number of years in the current role (n = 4) as these respondents left the question blank. “Other” in Table 3 includes: owner representatives, municipality representatives, utility agencies, material vendors, program managers, task order managers, construction administrators, owner’s agents, quality assurance managers, accountable managers, vice president, design-build managers, pre-construction managers, construction coordinators, startup and commissioning manager, and project principal.
Table 4 shows that the mean number of years in the construction industry of the respondents is 26 years, while the mean number of years worked in the current role is nine years. This suggests that the respondents have substantial years of construction experience to be able to soundly respond to the survey questions.

TABLE 4. Number of years worked descriptive statistics.
On the construction project in which the respondents based their responses, the organizations in which they worked were responsible for the roles shown in Figure 2. The majority of the respondent organizations (29%) played the role of the construction manager agency, 20% of the organizations were responsible for the actual construction in the field, 10% acted as program managers, 6% each for the design team and consulting. Other roles characterized 24% of the respondents.
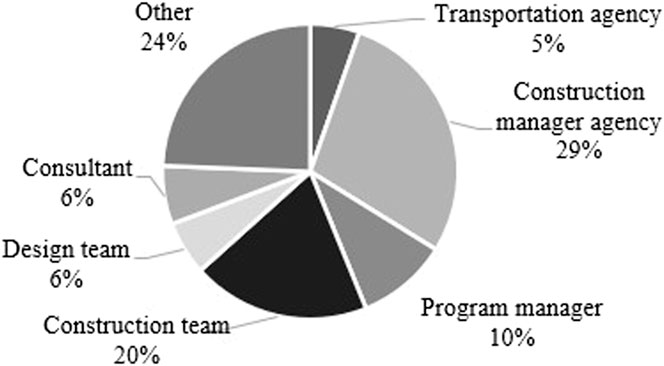
FIGURE 2. Role of respondents’ organization in the project.
Fifty-three percent (208 respondents) of the respondents reported to have based their responses on completed projects, 46% (180 respondents) on projects currently in progress, and 1% of the respondents did not reveal the project status due to confidentiality of the project. These responses were included in the analysis even though project status was unknown because this data was checked against the respondent demographics such as role and number of years worked, which proved to be valid. For the projects that were ongoing (Figure 3), close to 50% of the ongoing projects were more than 50% complete, indicating there was sufficient time for relationship building in the projects to occur (Davis et al., 2017). The overall data was checked for outliers or some common trends of inconsistency when those that were less than 50% completed were included together with those that were more that 50% complete. SPSS software was used to check for outliers by running descriptive statistics for the overall data (i.e., mean, median, skewness, and kurtosis values). The analysis showed low standardized kurtosis and skewness values that approximate a normal distribution, meaning that there were no outliers. These responses were thus included in the analysis.
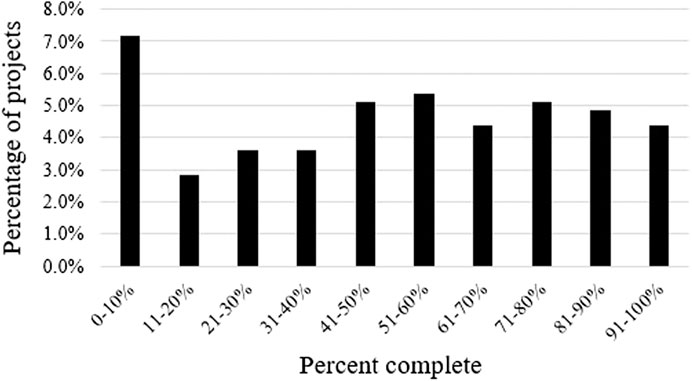
FIGURE 3. Completion status for projects under construction.
Table 5 provides the model fitting information from the data collected through the survey. Both the relational behaviors of restraint of power and reciprocity behaviors given the social behavior of integrity could not be modeled since the analysis returned a perfect fit for the data. This situation occurred because there were very few data points resulting from an issue with the questionnaire. Therefore, it was not possible to compute the standard errors and confidence intervals of the parameters. Logistic coefficients for 17 of the remaining 19 models are positive, with the coefficients for harmonization of conflict, R1 given benevolence, S2 and flexibility, R6 given benevolence, S2 are negative. Furthermore, of the 21 models, 11 that are labeled as No. 1–11 in Table 5 had a significant slope (p-value less than 0.05), β1 parameter, indicating a statistically significant relationship between the relational and social behaviors. One additional model was near the threshold of significance, while the remaining nine models were not statistically significant.
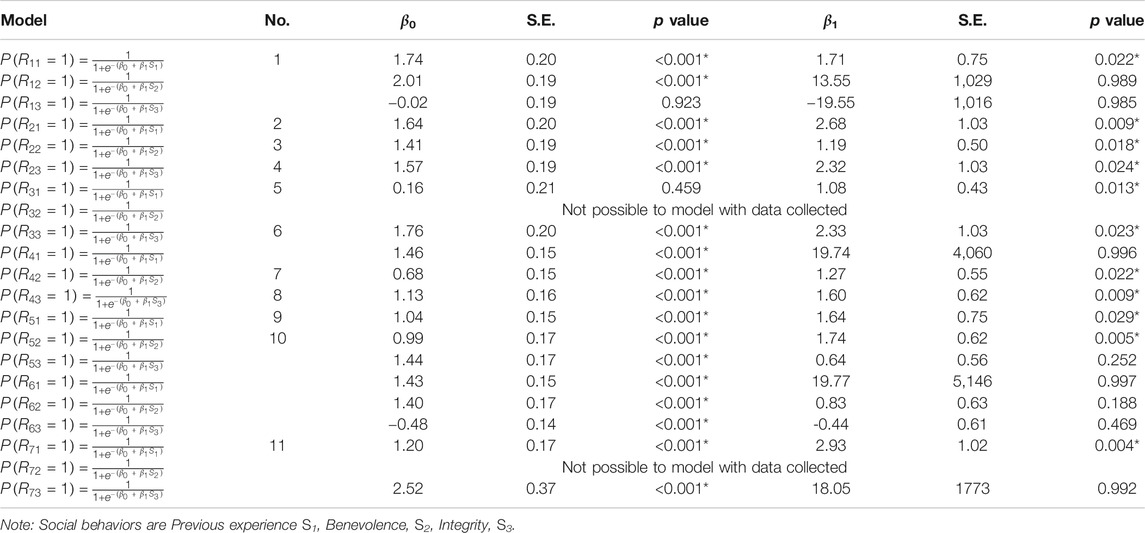
TABLE 5. Fitted models parameter estimates, standard errors, and p values.
Non-significant models indicated that there is not enough evidence to show a relationship between relational and social behaviors. As such, moving forward with the analysis, these non-significant models were not considered for further evaluation. Also, for the two that were not modeled, estimation and further analysis was terminated because of the perfect fit of the data.
Table 6 shows the odds of Rmn = 1 when Sn = 0 and Sn = 1 as well as odds ratios and predicted probabilities and relative probabilities for the significant models. Based on the analysis, the odds ratios for the logistic regression are greater than 1. These odds ratios indicate that when project team members exhibit a social behavior, the chance of expressing the corresponding relational behavior by team members increases by the value of that odds ratio. For example, for harmonization of conflict, R1 given past experience, S1, the chance of resolving issues informally increases by 5.53 times (on average) for team members who worked together previously, with an LCI of 1.28 times and a UCI of 23.74 times. Similar to odds ratio, the relative probability of a team member exhibiting a relational behavior given an exhibited social behavior is greater than one for all models.
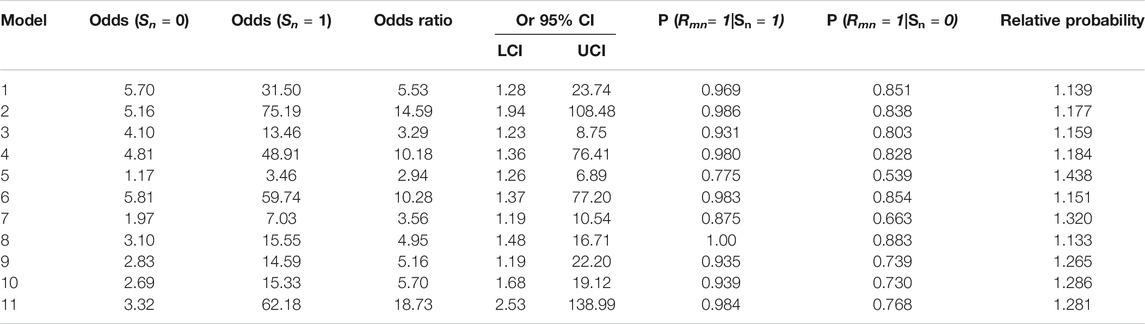
TABLE 6. Fitted model odds ratios with confidence intervals and predicted probabilities.
Nagelkerke R2 goodness-of-fit values (Table 7) explain the likelihood of predicting relational given the social behaviors. For example, the likelihood of predicting the harmonization of conflict behavior, R1 given past experience, S1 (Model 1) is 4.8%. Overall, the Nagelkerke R2 values are low. Low R2 values indicate that the predictor variable still provides information about the response variable but to a lower precision.
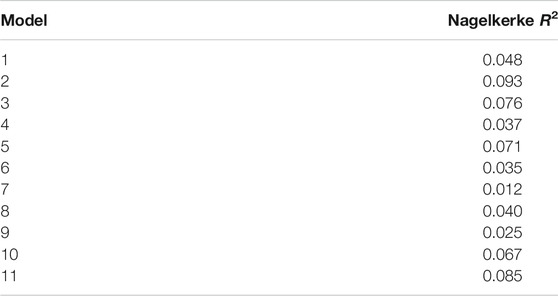
TABLE 7. Nagelkerke R-squared goodness-of-fit.
Table 8 shows the sensitivity, specificity, accuracy, PPVs, and NPVs of the prediction models through internal validation. The results show low values for sensitivity (11–56%), accuracy (34–44% except for model 5 with a moderately higher accuracy value of 71%), while specificity values are high (88–100%). The results also show high PPVs ranging from 86–100%, whereas NPVs are low, ranging from 18–59%.
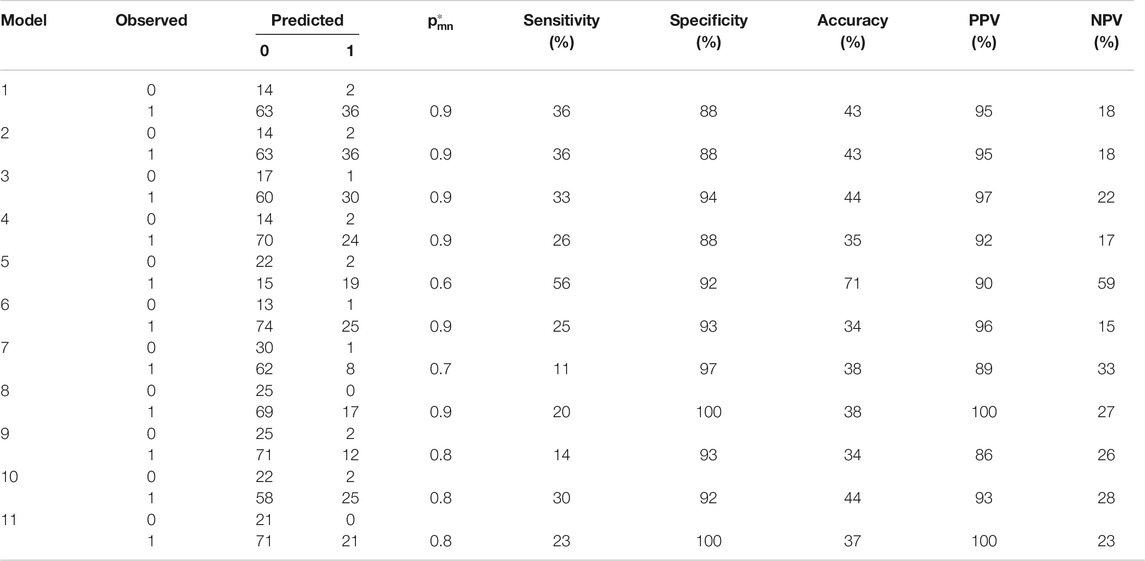
TABLE 8. Prediction models internal validation metrics.
Based on the research results that show low sensitivity values, these values are not useful in interpreting the research findings. High specificity values indicate that the prediction models have high chance of correctly predicting relational behaviors given the social behaviors of team members. High PPVs and low NPVs reveal that predicted positive expression of relational behaviors is typically correct, while the models overpredict negative/non-expression of relational behaviors given the social behaviors of construction project team members. Thus, the prediction models advanced in this paper perform quite well based on these metrics.
Results from the paper, logistic regression analysis identified a relationship between team members who exhibit relational behaviors and those who exhibit social behaviors. Statistically significant and non-significant models are shown as those supporting and not supporting the hypothesis, respectively (Table 9).
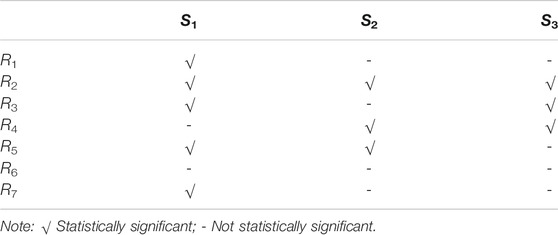
TABLE 9. Significance test results for the logistic regression β1 coefficients.
As shown in Table 9, this study finds that past experience, S1 is a significant predictor of five of the seven relational behaviors, benevolence, S2, and integrity, S3 are significant predictors of three of the seven relational behaviors each. All the statistically significant models had positive and significant logistic regression coefficients, β1, (p value < 0.05). Positive significant logistic regression coefficients indicate that the relational behavior is more likely to be exhibited when the social behavior is present, rather than absent. Similarly, it is expected that it is less likely for a team member to exhibit a relational behavior when a team member does not exhibit a social behavior.
The results of the analysis show that:
Compared with those who have not previously worked together (past experience, S1), those who have previously worked together were:
4.2 times more likely to resolve conflicts informally, flexibly, and internally (harmonization of conflict, R1), p = 0.002.
11.7 times more likely to adhere to the principles of division of responsibilities together with the terms and conditions set out in the contract (propriety of means, R2), p < 0.001.
4.5 times more likely to expect that members in the team will avoid applying their authority against any other team member’s interest (restraint of power, R3), p < 0.001.
4.9 times more likely to be in a coordinated and peaceful state that is able to preserve a relationship (contractual solidarity, R5), p < 0.001.
24.9 times more likely to treat each other as equals (reciprocity, R7), p < 0.001.
A statistically significant relationship was not found between past experience, S1 and reliance and expectation, R4.
A statistically significant relationship was not found between past experience, S1 and flexibility, R6.
What these findings mean, therefore, is that interactions between first time and repeat members in a construction project may not be the same. This assertion is consistent with prior research that showed that past experiences have an influence on how team members relate through the reputations established previously (Dekker et al., 2019). Therefore, previously embedded relationships will set the tone for team member expectations, which in turn provides for trust to develop and gives room for open communication and joint conflict resolution (Kululanga et al., 2002; Buvik and Rolfsen, 2015). For example, field personnel typically know how to work out issues informally in the field, rather than involving upper management (harmonization of conflict, R1).
Compared with those who have not shown concern for the well-being of others, generosity or kindness to others (benevolence, S2), those who have shown benevolence were:
4.1 times more likely to adhere to the principles of division of responsibilities together with the terms and conditions set out in the contract (propriety of means, R2), p < 0.001.
6.5 times more likely to rely on others to fulfill their part of the bargain (reliance and expectation, R4), p = 0.003.
6.5 times more likely to be in a coordinated and peaceful state that is able to preserve a relationship (contractual solidarity, R5), p < 0.001.
A statistically significant relationship was not found between benevolence, S2 and harmonization of conflict, R1.
A statistically significant relationship was not found between benevolence, S2 and flexibility, R6.
The findings show that the relationship between benevolence and three out of seven relational behaviors exhibited by construction project team members support the argument by Ling and Tran (2012) that for a more relational team, there is a need for construction project team members to be benevolent, and desist from exploiting others to avoid conflicts. The empirical evidence in this section suggests that benevolent team members show a relationship with team members who exhibit relational behaviors aimed at supporting one another in the team. For example, benevolent team members are more likely to relate with those who are fair in their dealing through the principles of gain share and pain share. The role of benevolence behavior as it relates to relational behaviors highlights the underlying concept of social network theory that project networks are comprised of both relational and social behaviors.
Compared with those who have not acted on accepted principles of right and wrong and being attentive to how one achieves results (integrity, S3), those who have shown integrity were:
5 times more likely to adhere to the principles of division of responsibilities together with the terms and conditions set out in the contract (propriety of means, R2), p = 0.001.
15 times more likely to expect that members of the team will avoid applying their authority against any other team member’s interest (restraint of power, R3), p < 0.001.
6.6 times more likely to rely on others to fulfill their part of the bargain (reliance and expectation, R4), p < 0.001.
A statistically significant relationship was not found between integrity, S3 and harmonization of conflict, R1.
A statistically significant relationship was not found between integrity, S3 and contractual solidarity, R5.
A statistically significant relationship was not found between integrity, S3 and flexibility, R6.
A statistically significant relationship was not found between integrity, S3 and reciprocity, R7.
The relationship between integrity, S3 and relational behaviors, Rmn is important in explaining team relationships in construction project networks. For example, when a team member is honest to other team members, they will adhere to the principles of division of responsibilities together with the terms and conditions set out in the contract which helps shape team relationships and thus a more cohesive team (Olkkonen and Tuominen, 2005). When members are untrustworthy and not honest with others in the team, relationship building is negatively impacted and raises tension and conflicts (Buvik and Rolfsen, 2015).
Non-significant models do not support previous research by Chinowsky et al. (2010) and Granovetter (1985) who advanced the theory that relationships constitute both relational and social behaviors under the social network theory. However, this research was exploratory and sought to establish the starting point for further investigation by researchers in this area.
Relational behaviors that show no relationship with benevolence, S2 have a direct effect on the terms and conditions that are set out in the contract. This explains why benevolence, S2 might be viewed as having no relationship with those behaviors. For instance, research findings do not support that benevolence, S2 positively influence how members resolve issues and disputes, informally without involving upper management. Similarly, when team members become more benevolent, others tend to take advantage of and exploit them (Kim and Nguyen 2018). Results show that as members become more benevolent, team members are not willing to allow changes to occur in their operating environments (flexibility, R6), treat them as equals (reciprocity, R7), or expect that others will not exert their legitimate authority upon them (restraint of power, R3).
Furthermore, it was not possible to model the relationship between benevolence, S2 and restraint of power, R3, and reciprocity, R7, relational behaviors using the collected data. This was because of the perfect fit of the data when modeling. This might be attributed to the data collection tool or the questions that might have not been better understood by the respondents. It will be worthwhile to conduct a follow-up study using a larger sample size in a bid to model the relationship between the relational and social behaviors.
This research explores the relationship between the relational and social behaviors exhibited by construction project team members. The social behaviors, Sn include: benevolence, S1, integrity, S2, and past experience, S3 whereas relational behaviors, Rm include: contractual solidarity, R1, flexibility, R2, harmonization of conflict, R3, propriety of means, R4, reciprocity, R5, reliance, expectation, R6, and restraint of power, R7. These identified behaviors were used as variables in the study by means of data collected through a cross-sectional survey sent to construction practitioners across the United States. The data collected were used to model the relationship between relational and social behaviors of construction project team members using binomial logistic regression. In conclusion, the findings of this research show that:
Past experience, S1 predicts five of the seven relational behaviors, benevolence, S2 and integrity, S3 each predict three of the seven relational behaviors.
Internal validation results show low values for sensitivity (11–56%), accuracy (34–44%, except for model 5 with a moderately higher accuracy value of 71%), and NPVs (18–59%). Specificity values (88–100%) and PPVs are high.
The insights into the concept of relationship embeddedness where the influence of social behaviors on relational behaviors of construction project teams are the main contribution to the body of knowledge. The practical implication of these findings is that the validated models showing an effect between social and relational behaviors can be considered at the team formation level as construction practitioners seek to create more integrated teams. The concept entices new directions for future research in construction project networks and collaboration in construction project teams.
The primary limitations of this research were discovered during the data analysis phase. Despite efforts to ensure the construct validity of the questionnaire, it was discovered that the collected data did not map as well as anticipated to the social and relational behaviors. As explained, some behaviors had to be assumed and some answers had to be mapped as N/A because one of the behaviors was not apparent from the selection. Although the analytical procedures are sound and recommended for additional studies, significant improvements to the questionnaire should be undertaken in future work. A larger sample size is also recommended for a subsequent confirmatory study. These additional developments would add more credibility and reliability to the overall results. Further, additional research is warranted to quantify how a construction firm’s bottom line is impacted by integrating behavior into team member selection impact, thus further demonstrating the importance of relationship embeddedness on project outcomes. Another area of future research is to guage the interest of contractors in understanding the effects of relationship embeddedness and project performance. An interesting future direction would be to define and set limits for the scope of the behaviors in an attempt to reducing the subjective nature of the responses from the survey. Specific case studies targeting the entire construction team is recommended to ensure that feedback is received from each and every team member.
The raw data supporting the conclusions of this article will be made available by the authors, without undue reservation.
The studies involving human participants were reviewed and approved by Louisiana State University. The patients/participants provided their written informed consent to participate in this study.
JK designed the data collection tool, collected and analyzed the data, interpreted the results, and drafted the manuscript in consultation with the co-authors. CF led the data analysis and modeling techniques and revised the manuscript with comprehensive feedback. CH provided foundational guidance on the research topic and assisted in survey development and dissemination. IN and CH provided comprehensive feedback on the manuscript. All authors contributed to the article and approved the submitted version.
The authors declare that the research was conducted in the absence of any commercial or financial relationships that could be construed as a potential conflict of interest.
This paper is part of a dissertation submitted to the graduate school at Louisiana State university and appeared online through the university’s digital commons. The authors acknowledge the funding from the Department of Construction Management, Louisiana State University. Publication of this article was subsidized by the LSU Libraries Open Access Author Fund.
The Supplementary Material for this article can be found online at: https://www.frontiersin.org/articles/10.3389/fbuil.2021.636000/full#supplementary-material
Abdirad, H., and Pishdad-Bozorgi, P. (2014). Developing a framework of metrics to assess collaboration in integrated project delivery. Proceedings of the 50th Annual International Conference of the Associated Schools of Construction. Blacksburg, VA:Virginia Polytechnic Institute and State University.
Alashwal, A. M., and Fong, P. S. W. (2015). Empirical study to determine fragmentation of construction projects. J. Construction Eng. Manag. 141, 04015016.
Arranz, N., Arroyabe, M. F., and Fernandez de Arroyabe, J. C. (2020). Network embeddedness in exploration and exploitation of joint R&D projects: a structural approach. Br. J. Manag. 31 (2), 421–437. doi:10.1111/1467-8551.12338
Buvik, M. P., and Rolfsen, M. (2015). Prior ties and trust development in project teams–a case study from the construction industry. Int. J. Proj. Manag. 33 (7), 1484–1494. doi:10.1016/j.ijproman.2015.06.002
Chan, Y. H. (2005). Biostatistics 305. multinomial logistic regression. Singapore Med. J. 46, 259–268; quiz 269.
Chandler, J. D., and Wieland, H. (2010). Embedded relationships: implications for networks, innovation, and ecosystems. J. Bus. Market Manag. 4, 199–268. doi:10.1007/s12087-010-0041-5
Chen, Z. (2019). Grand challenges in construction management. Front. Built Environ. 5, 31. doi:10.3389/fbuil.2019.00031
Chinowsky, P. S., Diekmann, J., and O’Brien, J. (2010). Project organizations as social networks. J. Constr. Eng. Manag. 136 (4), 452–458. doi:10.1061/(asce)co.1943-7862.0000161
Davis, P. R., Jefferies, M., and Ke, Y. (2017). Psychological contracts: framework for relationships in construction procurement. J. Constr. Eng. Manag. 143, 04017028. doi:10.1061/(ASCE)CO.1943-7862.0001327
Dekker, H., Donada, C., Mothe, C., and Nogatchewsky, G. (2019). Boundary spanner relational behavior and inter-organizational control in supply chain relationships. Ind. Marketing Manag. 77, 143–154. doi:10.1016/j.indmarman.2018.11.010
Dogbe, C. S. K., Tian, H., Pomegbe, W. W. K., Sarsah, S. A., and Otoo, C. O. A. (2020). Effect of network embeddedness on innovation performance of small and medium-sized enterprises. J. Strategy Manag. 13 (2), 181–197. doi:10.1108/JSMA-07-2019-0126
Granovetter, M. (1985). Economic action and social structure: the problem of embeddedness. Am. J. Sociol. 91, 481–510. doi:10.1086/228311
Hallowell, M. R., and Gambatese, J. A. (2010). Qualitative research: application of the Delphi method to CEM research. J. Constr. Eng. Manag. 136 (1), 99–107. doi:10.1061/(asce)co.1943-7862.0000137
Harper, C. M. (2014). Measuring project integration using relational contract theory. Doctoral dissertation. Boulder (CO): University of Colorado.
Harper, C. M., Molenaar, K. R., and Cannon, J. P. (2016). Measuring constructs of relational contracting in construction projects: the owner’s perspective. J. Constr. Eng. Manag. 142, 04016053. doi:10.1061/(ASCE)CO.1943-7862.0001169
Hu, X., and Chong, H.-Y. (2020). Integrated frameworks of construction procurement systems for off-site manufacturing projects: social network analysis. Int. J. Constr. Manag., 1–9. doi:10.1080/15623599.2020.1766188
Kaufmann, P. J., and Dant, R. P. (1992). The dimensions of commercial exchange. Marketing Lett. 3, 171–185. doi:10.1007/BF00993996
Kereri, J. O., and Harper, C. M. (2019). Social networks and construction teams: literature review. J. Constr. Eng. Manage. 145 (4), 03119001. doi:10.1061/(asce)co.1943-7862.0001628
Kim, S. Y., and Nguyen, V. T. (2018). A Structural model for the impact of supply chain relationship traits on project performance in construction. Prod. Plann. Control 29, 170–183. doi:10.1080/09537287.2017.1398846
Kululanga, G. K., Price, A. D., and McCaffer, R. (2002). Empirical investigation of construction contractors’ organizational learning. J. Constr. Eng. Manag. 128, 385. doi:10.1061/(ASCE)0733-9364(2002)
Liao, T. F. (2000). “Chapter 1–introduction,” in Interpreting probability models: logit, probit and other generalized linear models. Thousand Oaks, CA: SAGE.
Ling, F. Y., and Tran, P. Q. (2012). Effects of interpersonal relations on public sector construction contracts in Vietnam. Constr. Manag. Econ. 30, 1087–1101. doi:10.1080/01446193.2012.729848
Ma, G., Jia, J., Ding, J., Wu, M., and Wang, D. (2021). Examining the impact of social media use on project management performance: evidence from construction projects in China. J. Constr. Eng. Manage. 147 (3), 04021004. doi:10.1061/(asce)co.1943-7862.0002009
Macneil, I. (1985). Relational contract: what we do and do not know. Madison, WI: Wisconsin Law Review.
Martins, G. S., Rossoni, L., Duarte, A. L., and Martins, R. S. (2017). Supply chain relationships: exploring the effects of both relational and structural embeddedness on operational performance. Int. J. Procure. Manag. 10 (5), 639–664. doi:10.1504/ijpm.2017.10006799
McAllister, D. J. (1995). Affect- and cognition-based trust as foundations for interpersonal cooperation in organizations. Acad. Manag. J. 38, 24–59. doi:10.2307/256727
Mishra, A. K. (2012). “Organizational responses to crisis: the centrality of trust,” in Trust in organizations: frontiers of theory and research. Editors M. K. Roderick, and R. T. Tom (Thousand Oaks, CA: SAGE).
Missimer, M., Robèrt, K. H., and Broman, G. (2017). A strategic approach to social sustainability–part 2: a principle-based definition. J. Clean. Prod. 140, 42–52. doi:10.1016/j.jclepro.2016.04.059
Moran, P. (2005). Structural vs. relational embeddedness: social capital and managerial performance. Strateg. Manag. J. 26, 1129–1151. doi:10.4324/9780203997659
Ning, Y., Yean, F., and Ling, Y. (2013). Reducing hindrances to adoption of relational behaviors in public construction projects. J. Constr. Eng. Manag. 139 (11), 1–10. doi:10.1061/(asce)co.1943-7862.0000745
Olkkonen, R., and Tuominen, P. (2005). “Triggers and configurations of relationship fading in cultural-sponsorship relationships,” in 21st IMP conference, Rotterdam, Netherlands, September 1, 2005.
Rezvani, A., Khosravi, P., and Ashkanasy, N. M. (2018). Examining the interdependencies among emotional intelligence, trust, and performance in infrastructure projects: a multilevel study. Int. J. Project Manage. 36 (8), 1034–1046. doi:10.1016/j.ijproman.2018.08.002
Sporleder, T. L., and Moss, L. E. (2002). Knowledge management in the global food system: Network embeddedness and social capital. Am. J. Agric. Econ. 84, 1345–1352.
Statistical Consulting Group (2016). Introduction to SAS. Available at: http://stats.idre.ucla.edu/sas/modules/sas-learning-moduleintroduction-to-the-features-ofsas/. (Accessed March 19, 2019).
Steyerberg, E. W., Vickers, A. J., Cook, N. R., Gerds, T., Gonen, M., Obuchowski, N., et al. (2010). Assessing the performance of prediction models: a framework for traditional and novel measures. Epidemiology 21 (1), 128–138. doi:10.1097/EDE.0b013e3181c30fb2
Sven, I. B. (2004). How relevant are different forms of relational behavior? an empirical test based on Macneil’s exchange framework. J. Bus. Ind. Mark. 19, 300–309. doi:10.1108/08858620410549929
Triguero, S. (2018). From project teams to project networks: expanding limits and creating added value. Available at: http://www.rainovaproject.eu/joomla/index.php/wales-european-news/152-from-project-teams-to-projectnetworks (Accessed November 21, 2018).
Keywords: social behaviors, relational behaviors, relationship embeddedness, construction, team
Citation: Kereri JO, Friedland C, Harper C and Nahmens I (2021) Relationship Embeddedness in Construction Project Teams: The Effect of Social Behaviors on Relational Behaviors. Front. Built Environ. 7:636000. doi: 10.3389/fbuil.2021.636000
Received: 30 November 2020; Accepted: 17 February 2021;
Published: 07 May 2021.
Edited by:
Yongkui Li, Tongji University, ChinaReviewed by:
Behzad Esmaeili, George Mason University, United StatesCopyright © 2021 Kereri, Friedland, Harper and Nahmens. This is an open-access article distributed under the terms of the Creative Commons Attribution License (CC BY). The use, distribution or reproduction in other forums is permitted, provided the original author(s) and the copyright owner(s) are credited and that the original publication in this journal is cited, in accordance with accepted academic practice. No use, distribution or reproduction is permitted which does not comply with these terms.
*Correspondence: James Ogechi Kereri, a2VyZXJpQHVjbW8uZWR1
Disclaimer: All claims expressed in this article are solely those of the authors and do not necessarily represent those of their affiliated organizations, or those of the publisher, the editors and the reviewers. Any product that may be evaluated in this article or claim that may be made by its manufacturer is not guaranteed or endorsed by the publisher.
Research integrity at Frontiers
Learn more about the work of our research integrity team to safeguard the quality of each article we publish.