
94% of researchers rate our articles as excellent or good
Learn more about the work of our research integrity team to safeguard the quality of each article we publish.
Find out more
ORIGINAL RESEARCH article
Front. Built Environ., 12 February 2021
Sec. Earthquake Engineering
Volume 7 - 2021 | https://doi.org/10.3389/fbuil.2021.627058
This article is part of the Research TopicArtificial Intelligence-powered Methodologies and Applications in Earthquake and Structural EngineeringView all 5 articles
The cost of dedicated sensors has hampered the collection of the high-quality seismic response data required for real-time health monitoring and damage assessment. The emergence of crowdsensing technology, where a large number of mobile devices collectively share data and extract information of common interest, may help remove such obstacles and mitigate the seismic hazard. The present study proposes a crowdsensing-oriented vibration acquisition and identification method based on time–frequency characteristics and deep transfer learning. It can distinguish the responses during an earthquake event from vibration under serviceability conditions. The core classification process is performed using a combination of wavelet transforms and deep transfer networks. The latter were pre-trained using finite element models calibrated with the monitored seismic responses of the structures. The validation study confirmed the superior identification accuracy of the proposed method.
The earthquake-induced damage and collapse of buildings and infrastructure have caused enormous economic losses and casualties. The structural seismic response is critical to understand the behaviors of structures during earthquakes and mitigate seismic disasters. Real-time seismic damage assessment (Lu et al., 2019a; Xu et al., 2020a; Xu et al., 2020b), structural seismic damage diagnosis (Ye et al., 2019; Patel et al., 2020), and the updating of finite element models (Foti 2015; Lin et al., 2020) are in high demand for structural seismic response data. Hence, there is an essential need to monitor the seismic responses of structures (Carnimeo et al., 2015a; Foti et al., 2017). Presently, professional and high-performance sensors are primarily adopted in seismic response acquisition. However, the coverage and quantity of city-scale monitoring data are seriously restricted by the high cost of installing and maintaining sensors (Lynch, 2006; Shirzad-Ghaleroudkhani et al., 2020). To this end, high-efficiency and economical methods are required for the acquisition of structural seismic responses on a city-scale.
With the development of crowdsensing and telecommunication technology, conventional data acquisition in structural health monitoring has been changed and reshaped. For instance, environmental vibrations can easily be collected and uploaded to the cloud by smartphones equipped with a linear acceleration sensor and the corresponding APP (Ma et al., 2014; Kong et al., 2016; Boubiche et al., 2019; Patel et al., 2020; Shrestha and Dang, 2020a; Shrestha et al., 2020b). Crowdsensing has been adopted in earthquake early warning systems (Kong et al., 2016). Therefore, crowdsensing could also be adopted in seismic response acquisition. However, unlike the vibrations collected by professional sensors, most of the smartphone-collected data are human movement-induced vibrations (Ma et al., 2014), and structural seismic responses are rare. Furthermore, it is challenging to automatically and effectively distinguish the acquired structural seismic responses from normal vibrations based on the amplitude and frequency characteristics. Hence, a high-performance seismic response identification method is required to enhance the data quality and application efficiency.
Deep neural networks are effective in extracting in-depth data characteristics and their subsequent identification (Krizhevsky et al., 2017; Carnimeo et al., 2015b; Wang et al., 2019; Nath and Behzadan, 2020). Thus, they have been widely adopted in vibration identification and prediction studies (Tang et al., 2019; Lu et al., 2020). Moreover, time–frequency characteristic extraction by a wavelet transform can significantly improve the vibration identification accuracy of deep neural networks (Lu et al., 2020). However, the quantity of structural seismic response data is significantly smaller than that of normal vibrations due to the low occurrence frequency of earthquakes and the sparseness of structural monitoring networks. Simultaneously, the significantly imbalanced sample data can degrade the feature extraction and classification ability of deep neural networks. Therefore, feature-based deep transfer learning was adopted to address the problems induced by imbalanced data in this study (Liu et al., 2011; Wang, 2020). Finite element simulation was used to create structural seismic response data to enrich the dataset. The simulated vibration-trained neural networks were then adopted to identify the real monitored structural seismic responses. Additionally, model-based deep transfer learning for big-data classification was adopted for a more effective classification (Zhao et al., 2011; Wang, 2020). Consequently, the combination of time–frequency characteristics and deep transfer learning could provide the potential to identify the structural seismic responses from the enormous amount of normal vibrations collected by crowdsensing.
A novel identification method for structural seismic responses is proposed based on deep transfer neural networks with the time–frequency domain characteristic input. The remainder of this paper is structured as follows. Structural Seismic Response Identification Method describes the framework of the method, and Vibration Acquisition, Extraction of Vibration Characteristics, Training and Evaluation of Deep Transfer Neural Networks, Case Studies show the implementation steps based on this framework. Vibration Acquisition shows how the normal vibrations acquired by smartphones and simulated structural seismic responses obtained by finite element analysis are used to create the corresponding raw vibration dataset. Extraction of Vibration Characteristics presents the time–frequency characteristics of the raw vibrations obtained by the wavelet transform. Training and Evaluation of Deep Transfer Neural Networks illustrates how deep transfer neural networks can be trained to identify vibrations based on the characteristics, and the corresponding performance is evaluated by the validation accuracy and loss. Case Studies outlines how real monitored structural seismic responses were used to validate the accuracy and generalization of the proposed model, indicating that the VGG19 model with the time–frequency characteristic matrix input had the best performance. Finally, Conclusion summarizes the contributions and provides suggestions for future studies.
In this study, smartphones were adopted as sensors to collect normal vibrations and determine structural seismic responses. The proposed vibration identification method was studied based on the collected data. The most significant characteristic of the method is the coupling of the time–frequency domain characteristics and deep transfer learning. The method includes three main modules: the primary extractor, deep extractor, and classifier (Figure 1A). In the primary extractor module, the wavelet transform is used to extract the initial vibration characteristics and output the corresponding time–frequency characteristic matrix. In the deep extractor module, the VGG19, InceptionV3, and ResNetV2 networks are used for in-depth feature extraction. Moreover, the classifier module uses a simple neural network based on the in-depth features for classification.
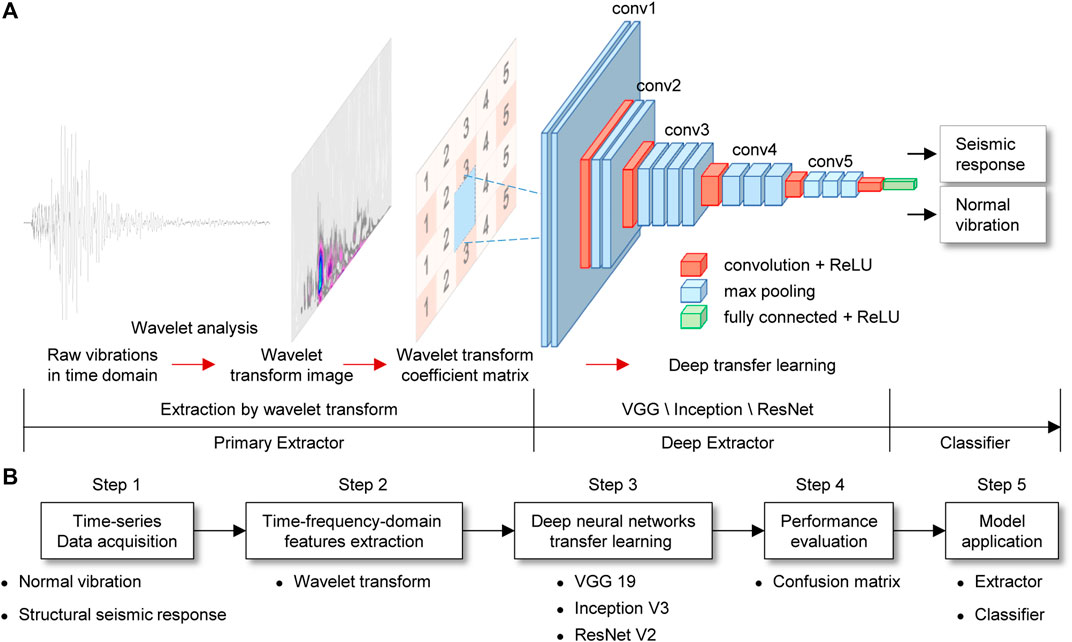
FIGURE 1. Time–frequency characteristics and deep neural network-based vibration identification method: (A) structural seismic response identification method and (B) detailed implementation of proposed method.
As shown in Figure 1B, the implementation of the proposed vibration identification method consists of five crucial steps, as follows.
Step 1: Data acquisition and dataset establishment. The datasets were composed of two types of vibrations: normal vibrations and structural seismic responses. Normal vibrations could easily be collected using smartphones equipped with linear accelerators during daily usage. In comparison, structural seismic responses are rarely obtained with smartphones because of the low occurrence frequency of earthquakes. Hence, the structural seismic responses were primarily provided by coupling finite element analysis results and white noise, which were equivalent to the structural seismic responses collected by smartphones. Additionally, this work adopted the real monitored structural vibrations supplied by CESMD as supplementary test datasets (CESMD, 2020).
Step 2: Initial vibration feature extraction. The initial time–frequency domain characteristics were obtained by the wavelet transform of 1D time-series vibrations and stored as characteristic coefficient matrices, as the inputs of deep neural networks.
Step 3: Training the deep neural networks. The initial feature matrices were input, and the different pre-trained network models, VGG19, InceptionV3, and ResNetV2 (Simonyan and Zisserman, 2014; Szegedy et al., 2016; He et al., 2016a, He et al., 2016b), were trained in the fine-tuning mode. The in-depth features were efficiently extracted using these high-performance networks, and their performances were also compared.
Step 4: Evaluation of trained network models. The training and validation performances of the different network models were evaluated based on their accuracy and loss values. Subsequently, their test performances were assessed by the confusion matrix (Foody, 2002), using classification accuracy as the primary metric.
Step 5: Application of the vibration identification method. Based on the evaluation results, the trained models with the best performances were adopted to identify the real monitored structural seismic responses, as illustrated in Figure 1A. The CESMD test dataset was adopted to validate the real identification performance.
Normal vibrations can easily be collected using smartphones, while the collection of real monitored structural seismic responses is relatively limited, causing the dataset imbalance problem. In such imbalanced datasets, the spatial feature distribution difference between the normal vibrations and seismic responses is indistinctive, which makes it difficult for a neural network to fit a hyperplane separating various vibrations. Hence, this study used the feature-based deep transfer learning method to address the data imbalance problem (Liu et al., 2011; Wang, 2020). In the transfer learning method, the simulated and monitored structural seismic responses are in the source and target domains, respectively. The finite element analysis results were used to train deep neural networks. Subsequently, these trained network models could be adopted to identify real monitored structural seismic responses. Additionally, the time–frequency domain characteristics of the simulated and real monitored structural seismic responses were highly consistent, which was fundamental to transfer learning.
The real monitored vibrations were composed of the normal vibrations collected by smartphones and monitored structural seismic responses provided by CESMD. In this work, the normal vibrations were acquired by smartphones equipped with a linear accelerator and the corresponding SensorRecord App with a sampling frequency of 100 Hz. The smartphone types were HUAWEI Honor V20 and MI 5. The specification of accelerometer is summarized as follows. Part number: LSM6DS3 and ICG-20660; sensitivity: 0.061–0.488 mg; resolution: 2 mg; operational range: ±2–±16 g; and noise level: 1–6 mg (InvenSense Inc., 2016; STMicroelectronics, 2017; Shrestha et al., 2020b). The normal vibrations were primarily collected in daily life and sufficiently representative, including indoor and outdoor movements, rest, and phone operations.
The simulated structural seismic responses had to be sufficiently typical, with different structural types and structural heights. Therefore, this study adopted typical structural models designed by various Chinese architectural design institutes. Moreover, the designed structures included concrete frame, concrete shear wall, concrete frame-core tube, steel frame, and steel frame-braced core tube structures, with structural heights varying from 23 to 167 m. The 3D and plan views of the five models are shown in Figure 2 (CABR et al., 2018). As introduced by CABR et al. (2018), these models were designed and optimized based on the corresponding design codes, with characteristics similar to those of buildings in the real world. The dynamic characteristics of the designs are listed in Table 1. The fundamental periods were in the range of 1–6 s, covering the primary dynamic characteristic range of typical structures in China. In addition to the essential model information already provided, more design information was provided in the study by CABR et al. (2018).
The SAP 2000 software and nonlinear time history analysis method were adopted for the finite element analysis. In the finite element models, the lumped-hinge model was adopted for the beam and column elements. The brace model was adopted for the brace elements. The thin shell model was used for the shearwall and floor elements (Lu et al., 2019b). Furthermore, approximately 4,000 earthquake ground motions selected from the PEER ground motion database (Pacific Earthquake Engineering Research Center, 2006) were adopted for the seismic analysis, with earthquake intensities of 3–8. Lu et al. (2019b) indicated that the adopted modeling and analysis method could accurately simulate the nonlinear seismic response.
After the nonlinear time history analysis, the simulated structural seismic response (i.e., the floor acceleration) of a story was output and stored. Kong et al. (2016) indicated that smartphones started to slide when the horizontal accelerations reached a specific threshold (approximately 0.3 g), and smartphone-slide had the effect of clipping the peak amplitudes. Moreover, in Time–Frequency Characteristic Extraction by Wavelet Transform, the statistical results of the monitored structure responses show that approximately 80% of vibration peak amplitudes do not exceed 0.3 g. Therefore, in most cases, the relative movement between the ground (or desk) and the smartphone was small, and could be neglected (Kong et al., 2016). Hence, the simulated floor accelerations were used as the equivalent structural seismic responses collected by a smartphone, with a quantity equal to approximately 18,000.
Because the energy of earthquake ground motions is mainly concentrated within 40 s, the redundant vibration signals were dropped to ensure that the useful information was more obvious and effectively improve the vibration identification performance. This study used the short-term energy method (Zheng et al., 2001) to intercept the effective signal parts. As shown in Figure 3A, the maximum energy point was regarded as the center, and the signals from 20 s before and after the center were adopted. The short-term energy could be calculated using Eq. 1, and the intercepting vibrations are shown in Figure 3. Subsequently, each intercepted vibration was coupled with a randomly selected 40 s of white noise to ensure that the vibrations were random and realistic. Notably, white noise was collected from a smartphone by placing it on solid ground without any environmental vibration disturbance.
where w(m) denotes the window function, which was a 1 s long quadratic window in this study, and x(m) is the signal function.

FIGURE 3. Time-domain characteristics: (A) intercepting vibration based on short-term energy method and (B) typical structural seismic response and normal vibration.
Consequently, approximately 20,000 normal vibrations and 18,000 simulated structural seismic responses were collected in this study. Subsequently, the data were randomly split into training, validation, and test datasets, with a proportion of 8:2:1. Moreover, approximately 130 real monitored structural seismic responses of CESMD were adopted for further tests. Wavelet transform was used to extract the initial time–frequency domain characteristics of the vibrations (Lu et al., 2020). In the wavelet transform analysis, the complex Gaussian wavelet (cgau8) and 128 scale were used, and the corresponding analysis results were in the frequency domain range of 0.78–50 Hz, with a time domain range of 40 s. Figures 4A,B show the time–frequency domain analysis results for typical normal vibrations. Figures 4C,D depict the characteristics of the coupled vibrations of the simulated seismic responses and smartphone-white noise. Figures 4E,F illustrate the characteristics of the coupled vibrations of the real monitored structural seismic responses and smartphone-white noise.
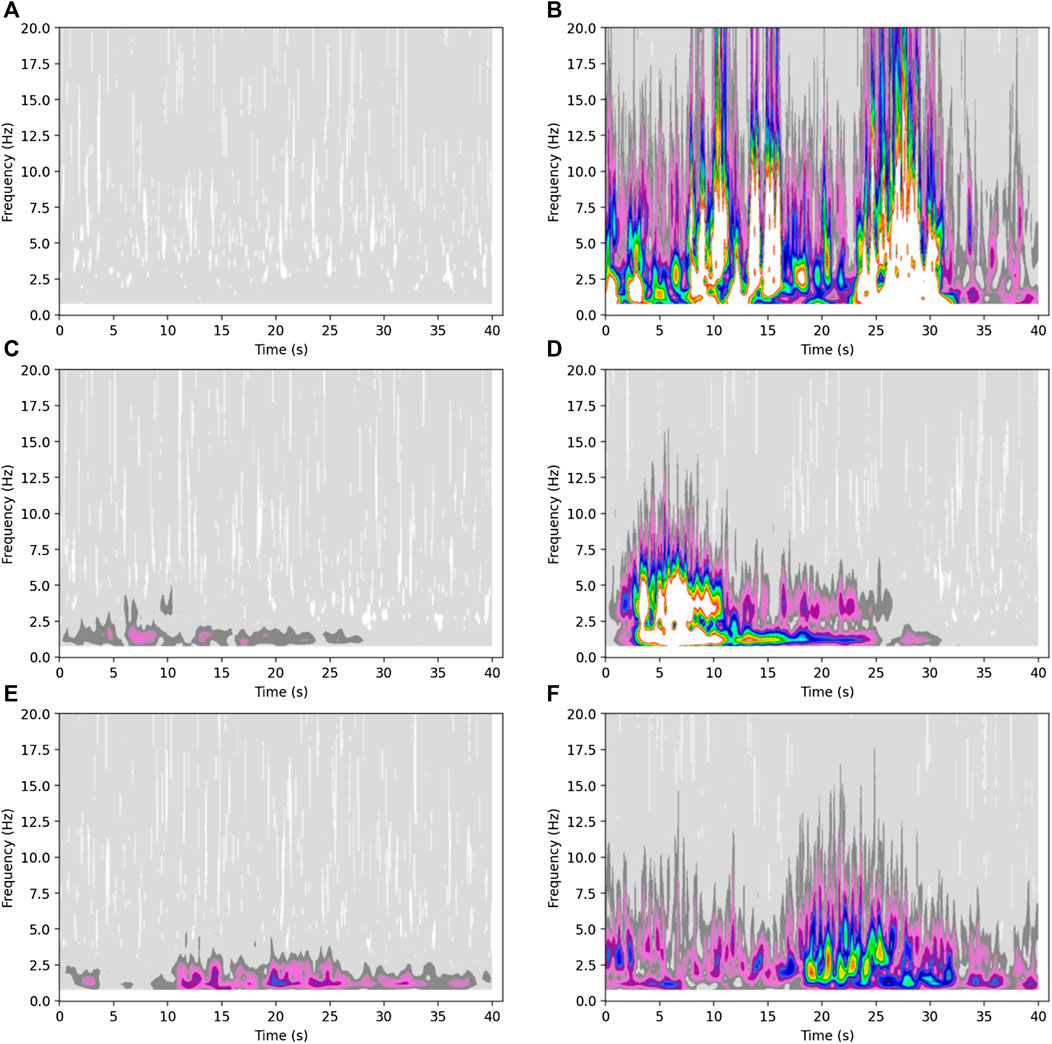
FIGURE 4. Time–frequency domain characteristics of vibrations: (A–B) normal vibrations with low amplitude and high amplitude, (C–D) simulated structural seismic responses with low amplitude and high amplitude, and (E–F) real monitored structural seismic responses with low amplitude and high amplitude.
As seen in the time–frequency analysis results shown in Figure 4, the intensities of the normal vibrations were relatively discrete in the time domain. In contrast, a significant vibration energy concentration was found in the time domain of the seismic response. A frequency feature comparison showed that the high-frequency components of the normal vibrations were significantly higher than those of the structural seismic responses.
Furthermore, Figure 5 shows the characteristic comparison between the statistical analysis results of 18,000 simulated- and 130 monitored-structural seismic responses. Figure 5A demonstrates the probability distribution of fundamental frequencies, and Figure 5B shows the probability distribution of peak accelerations. As shown in Figure 5A, the time–frequency domain characteristics of the simulated and monitored structural seismic responses were highly consistent. Characteristics consistency is the basis of the feature-based transfer learning method. Additionally, the peak acceleration probability distribution between simulated- and monitored-seismic responses is different (Figure 5B). The main reason is that the adopted CESMD data is from the structures under strong ground motions, and the corresponding peak amplitudes are larger than those of the simulated structural response. Moreover, the statistics of the monitored structural seismic response indicate that approximately 80% of maximum floor accelerations are less than 0.3 g.
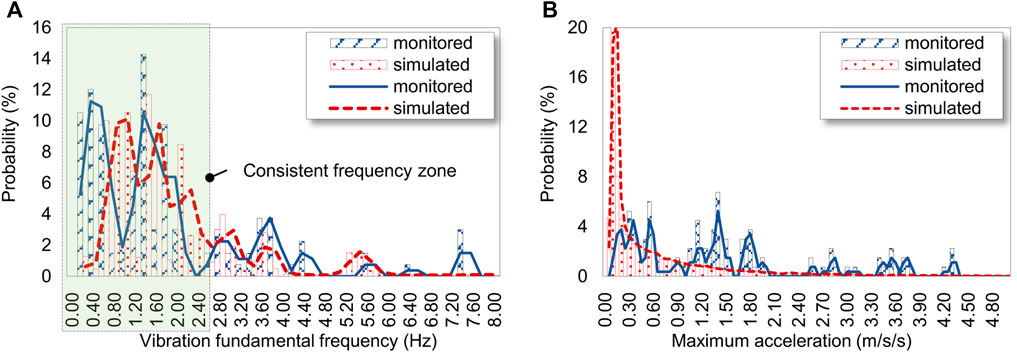
FIGURE 5. Characteristic comparison between simulated seismic responses and monitored seismic responses. (A) Vibration fundamental frequency comparison, (B) Peak amplitude comparison.
Notably, although this work shows the time–frequency domain characteristics in images (Figure 4), the characteristic matrices were used in the neural network training. The physical meanings of characteristic matrices and images are almost the same, but the matrices contained more detailed information than the images.
In big-data classification, convolutional neural networks (CNNs) with a simple architecture have difficulty extracting high-dimensional abstract data features and cause the under-fitting problem. Therefore, to achieve more effective data feature extraction and classification, model-based transfer learning was adopted in this study. Previous studies indicated that the bottom-layer features do not appear to be specific to a particular dataset or task, but are general to many datasets and tasks. In contrast, the top layer features are more specific (Yosinski et al., 2014). The fine-tuning training method was used in this study to conduct model-based transfer learning. The bottom transferred layers of the pre-trained deep neural networks were frozen for general feature extraction, and the top layers were fine-tuned to extract specific features in this task. The fine-tuning transfer learning method could effectively utilize the advantages of pre-trained networks to accelerate the training and enhance the classification performance.
Widely adopted pre-trained deep neural networks such as VGG19 (Simonyan and Zisserman, 2014), InceptionV3 (Szegedy et al., 2016), and ResNetV2 (He et al., 2016a; He et al., 2016b) have exhibited excellent feature extraction and classification capabilities in open-source datasets. Hence, the VGG19, InceptionV3, and ResNetV2 pre-trained networks were adopted, and the corresponding network architectures are shown in Figure 6.
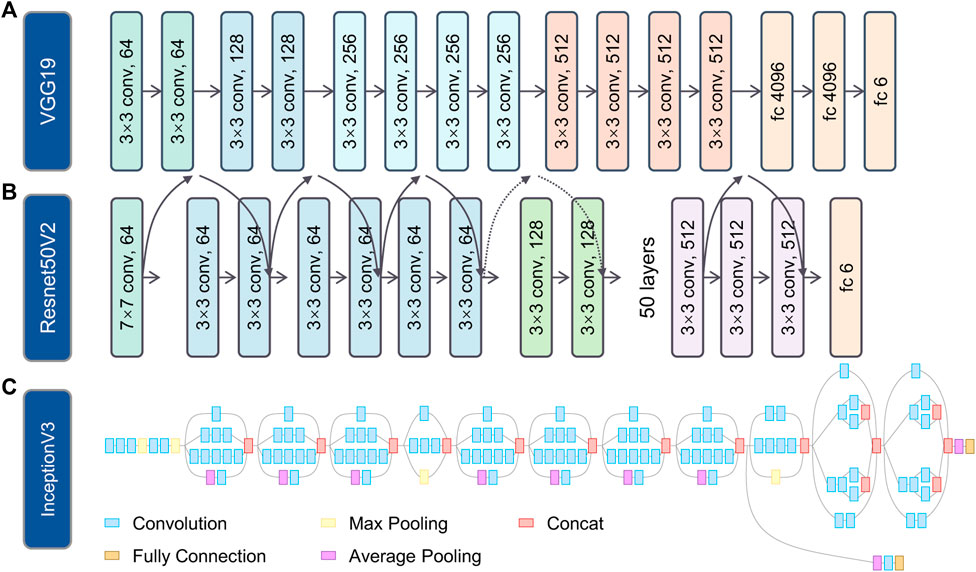
FIGURE 6. Architectures of typical deep neural networks: (A) VGG19; (B) ResNet50V2. ResNetV2 comprises different depth network models, where ResNet50V2 has 50 layers; and (C) InceptionV3.
Based on the study of Lu et al. (2020), using time–frequency domain characteristic matrices as the neural network input can assist in obtaining an excellent performance. Hence, characteristic matrices were adopted in this study. The neural network model for vibration identification primarily adopted the widely used pre-trained models (i.e., VGG19, InceptionV3, and ResNetV2), whose architectures are shown in Figure 6. In addition, conventional networks with simple architectures (i.e., CNN2D) were used as comparison cases. CNN2D was built using the Keras sequential architecture, and composed of 6 convolutional layers +6 batch normalization layers +6 pooling layers +3 dropout layers (dropout ratio = 0.5). By comparing their vibration identification performances, this study attempted to identify the optimal networks with high efficiency and high accuracy. Furthermore, the training platform adopted Python 3.6, equipped with the deep learning framework of TensorFlow1.15 and Keras2.2.5 (Chollet, 2018; Keras, 2020).
Additionally, reasonable evaluation metrics were essential in this study to better understand and compare the performances of the different network models. The training accuracy, training loss, validation accuracy, and validation loss in the last 10 epochs during the training process were adopted to evaluate the network models (Lu et al., 2020), and the corresponding metric Perf could be calculated using Eq. 2. The method considered the training and validation performance comprehensively and was mainly used for training assessment, where a high Perf value corresponded to a high performance.
where
The detailed training processes for a simple deep neural network (i.e., CNN2D) and the deep transfer neural networks (i.e., VGG19, InceptionV3, and ResNetV2) are demonstrated in Figure 7, in which the training results are illustrated by dashed lines, and the validation results are shown by solid lines. As Figure 7A demonstrates, the training and validation accuracy of CNN2D was maintained at approximately 65%. Simultaneously, the loss of CNN2D could not be effectively optimized during the entire training process. The poor performance of CNN2D meant that simple networks barely extract the in-depth features and classify them for numerous vibrations. In contrast to CNN2D, the training performances of the deep transfer neural networks were excellent, with powerful feature extraction capabilities and high training accuracy. However, only the validation results of the VGG19 networks were comparable to the training results. Compared to the training results, the validation accuracies of the InceptionV3 and ResNetV2 networks were significantly lower, exhibiting obvious over-fitting. Specifically, as shown in Figure 7A, the VGG19 network had the highest training accuracy (equaling 0.93), with the training accuracies of the ResNet50V2 and InceptionV3 networks slightly lower (equaling approximately 0.89). The validation accuracy of the VGG19 network is shown by the highest red solid line (equaling 0.94). In contrast, the validation accuracies of the ResNet50V2 and InceptionV3 networks were much lower than their training accuracies (both lower than 0.8). Similarly, as shown in Figure 7B, the validation loss of the VGG19 network is shown by the decrease in the solid red line. The validation losses of the ResNet50V2 and InceptionV3 networks could not be effectively optimized, which was consistent with their poor validation accuracies in Figure 7A.
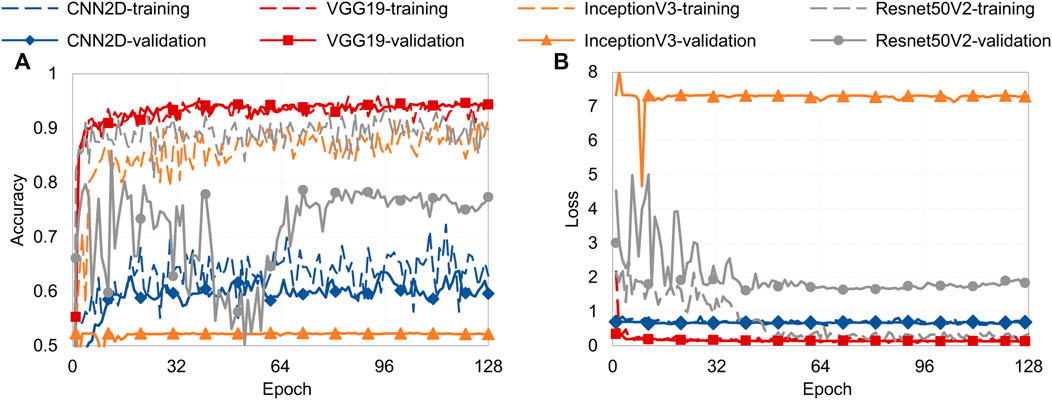
FIGURE 7. Detailed training process for deep neural networks: (A) training and validation accuracies of CNN2D, VGG19, ResNet50V2, and InceptionV3 network models, and (B) training and validation losses of CNN2D, VGG19, ResNet50V2, and InceptionV3 network models.
Subsequently, the performance evaluation method shown in Eq. 2 was utilized in this study. The performance comparison between the conventional deep neural networks and deep transfer neural networks is shown in Table 2. For big-data classification, it is difficult for CNN2D to capture high-dimensional and in-depth data features compared to deep transfer neural networks. When the amount of data is too large, a simple architectural CNN cannot fit the strong-nonlinear spatial hyperplane to effectively classify different data because of the small number of network parameters. In comparison, neural networks with deeper and more complicated architectures possess more parameters to efficiently fit complex hyperplanes, with a higher consumption of training time and cost. Using model-based deep transfer learning, high-dimensional data features can be effectively extracted with reasonable training costs, showing significant advantages. The ResNet50V2 and InceptionV3 networks overfitted significantly because of their powerful feature extraction ability compared to the relatively simple binary classification work, which resulted in significant validation and training performance differences. The network architecture of the VGG19 model is relatively simpler than those of the ResNet50V2 and InceptionV3 networks (Figure 6) and is more advanced than that of the conventional CNN2D, which helps the VGG19 model classify without over-fitting and under-fitting. Consequently, the VGG19 deep transfer networks performed the best for the binary classification of this study.
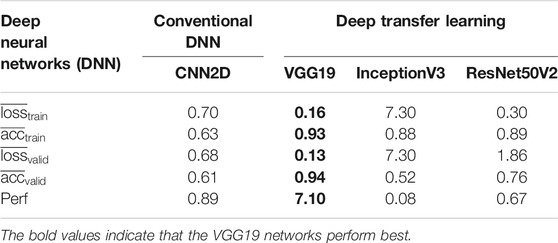
TABLE 2. Performance evaluation of conventional deep neural networks and deep transfer neural networks.
As shown in Training and Evaluation of Deep Transfer Neural Networks, various deep neural networks with different network architectures and hyperparameters were trained and validated. Nevertheless, during the model training process, every time the model hyperparameters were adjusted based on the model validation results to obtain a better performance, this led to certain information from the validation dataset leaking into the model (i.e., information leak) (Chollet, 2018). Moreover, with repeated hyperparameter adjustments, the training and validation results could not effectively reflect the actual generalization ability of the trained models. Therefore, totally independent test datasets not involved in training and validation were adopted to evaluate the model by testing its actual classification performance and generalization ability.
First, the finite element simulated structural seismic responses and smartphone-collected normal vibrations were used to test the vibration identification performance. A confusion matrix was adopted to evaluate the performances of the various models (Foody, 2002; Shrestha and Dang, 2020a; Mangalathu and Jeon, 2020). The corresponding identification results for the different models are shown in Figure 8. Here, categories N and S represent the normal vibrations and structural seismic responses, respectively. Diagonal elements represent the number of correctly classified items, and off-diagonal elements represent the number of incorrect classifications. Taking Figure 8B as an example, 1766 normal vibrations and 1,462 ground motions were correctly classified by the trained VGG19 model. In addition, 63 normal vibrations were misjudged as structural seismic responses, and 181 seismic responses were misclassified as normal vibrations. In the test dataset, the sample proportions of normal vibrations and structural seismic responses were approximately 1:1, and the metric of accuracy was used to effectively assess the classification performance. Moreover, accuracy was defined as the ratio of correctly classified samples to the total number of samples, as located in the third row and third column (3, 3) of the confusion matrix.

FIGURE 8. Confusion matrices of different deep neural network models: (A) CNN2D, (B) VGG19, (C) InceptionV3, and (D) ResNet50V2.
As seen in the confusion matrix-based evaluation results for the deep neural network models shown in Figure 8, the test results were consistent with the training and validation results discussed in Training and Evaluation of Deep Transfer Neural Networks. The VGG19 network model performed the best, with an overall accuracy of 93%, and the CNN2D, InceptionV3, and ResNet50V2 network models performed poorly. Specifically, the (3, 2) value of the confusion matrix in Figure 8B is the VGG19 model identification result for the real structural seismic response, indicating that approximately 89% of the objective structural seismic responses were correctly classified, which was slightly lower than the overall accuracy of 93%. The structural seismic response identification accuracy of the VGG19 model could still be improved in the future, by using other information for assistance. In Figure 8A, the (3, 1) value of the confusion matrix is the identification result of CNN2D for normal vibrations, indicating that the main reason for the poor CNN2D performance is that an enormous number of normal vibrations were judged to be structural seismic responses. The (3,2) values of the confusion matrix in Figures 8C,D are almost 0, which show that the primary reason for the poor InceptionV3 and ResNet50V2 performances was the misclassification of most of the structural seismic responses as normal vibrations.
In summary, the VGG19 network model could correctly identify the vibrations. In contrast, the other network models had incorrect identification performances. The CNN2D model recognized most vibrations as structural seismic responses, and the InceptionV3 and ResNet50V2 models classified all the vibrations as normal vibrations. Subsequently, the real monitored structural seismic response vibrations were used as a supplementary test dataset for further evaluation.
The real monitored seismic responses of buildings were essential for the test because feature-based transfer learning was adopted to allow the simulated vibration-trained model to identify real monitored vibrations. Hence, approximately 130 monitored vibrations provided by CESMD were used for the test in this study. The data came from nine buildings with steel and concrete structures, including a 4-story hospital, 6-story and 8-story hotels, and 10-story, 13-story, and 22-story office buildings. The short-term energy method was used to intercept the effective vibrations over a period of 40 s, after which these effective vibrations were coupled with smartphone-white noise. Because the CESMD data were collected by professional sensors with high accuracy and low noise, coupling the smartphone-white noise with the monitored data ensured that the test datasets simulated the actual collection environment.
The previously discussed identification results for the simulated vibrations proved that only the VGG19 model could accurately identify the structural seismic responses. Therefore, the test study using the real monitored vibrations was conducted only for the VGG19 model, and the identification results are shown in Figure 9A. The identification accuracy of the VGG19 model reached 96%, which was slightly higher than that when identifying the simulated vibrations. Notably, the most important metric was the identification accuracy for the structural seismic responses in this study, namely the recall ratio of the confusion matrix (3, 2) in Figure 9A. The recall ratio reached 90.7%, which was similar to the value of the confusion matrix (3, 2) in Figure 8B (recall ratio = 89%). Simultaneously, the value of the confusion matrix (3, 1) in Figure 9A reaches 96.7%, indicating that the VGG19 model did not arbitrarily identify normal vibrations as structural seismic responses and collect them. Consequently, the test results for the VGG19 model revealed the efficiency of vibration identification and the reliability of the application. However, they also showed that the performance of the proposed method needs further improvement in the future.
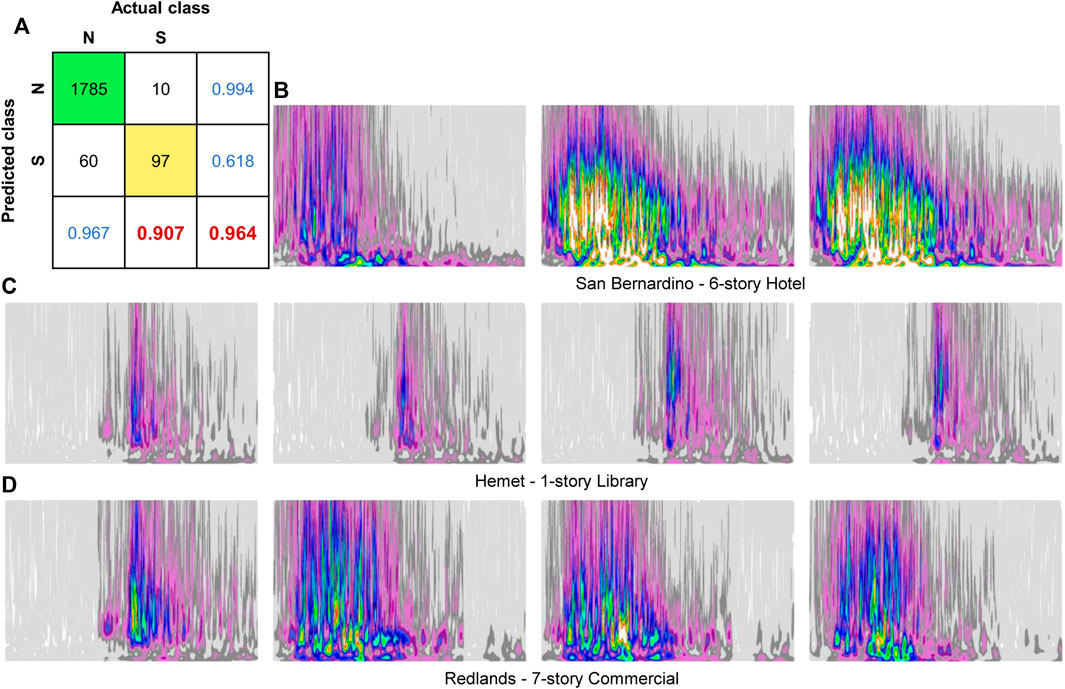
FIGURE 9. Identification results for real monitored seismic responses: (A) confusion matrix of VGG19 model identification results, (B) wrong classifications for 6-story hotel, (C) wrong classifications for 1-story library, and (D) wrong classifications for 7-story commercial office building.
Moreover, the incorrectly identified structural seismic responses were filtered and analyzed to reveal the primary reason for the identification error. The time–frequency characteristic metrics of the incorrectly identified seismic responses were plotted in the corresponding wavelet transform images, as shown in Figures 9B–D. The analysis revealed that the incorrect classifications came from the vibrations of the 6-story hotel, 1-story library, and 7-story commercial office, indicating that the identification errors were not directly associated with the structural height and function. Additionally, from the perspective of the time–frequency domain characteristics, the high-frequency components of the incorrect classifications were significant and close to those of normal vibrations. The apparent high-frequency components were different from the energy concentrations of the structural seismic responses, confusing the trained VGG19 model and producing the incorrect classifications.
Additionally, identification for smartphone-monitored structural seismic responses was conducted. Notably, since the publicly available smartphone-monitored structural seismic response was limited, only three seismic responses from MyShake (Kong et al., 2016; Patel et al., 2020) were adopted for the identification analysis in this study. The time-series data and the corresponding time–frequency domain characteristics are demonstrated in Figure 10. Obviously, the characteristics of the three data are different, and the seismic response amplitude in Figure 10E is small.
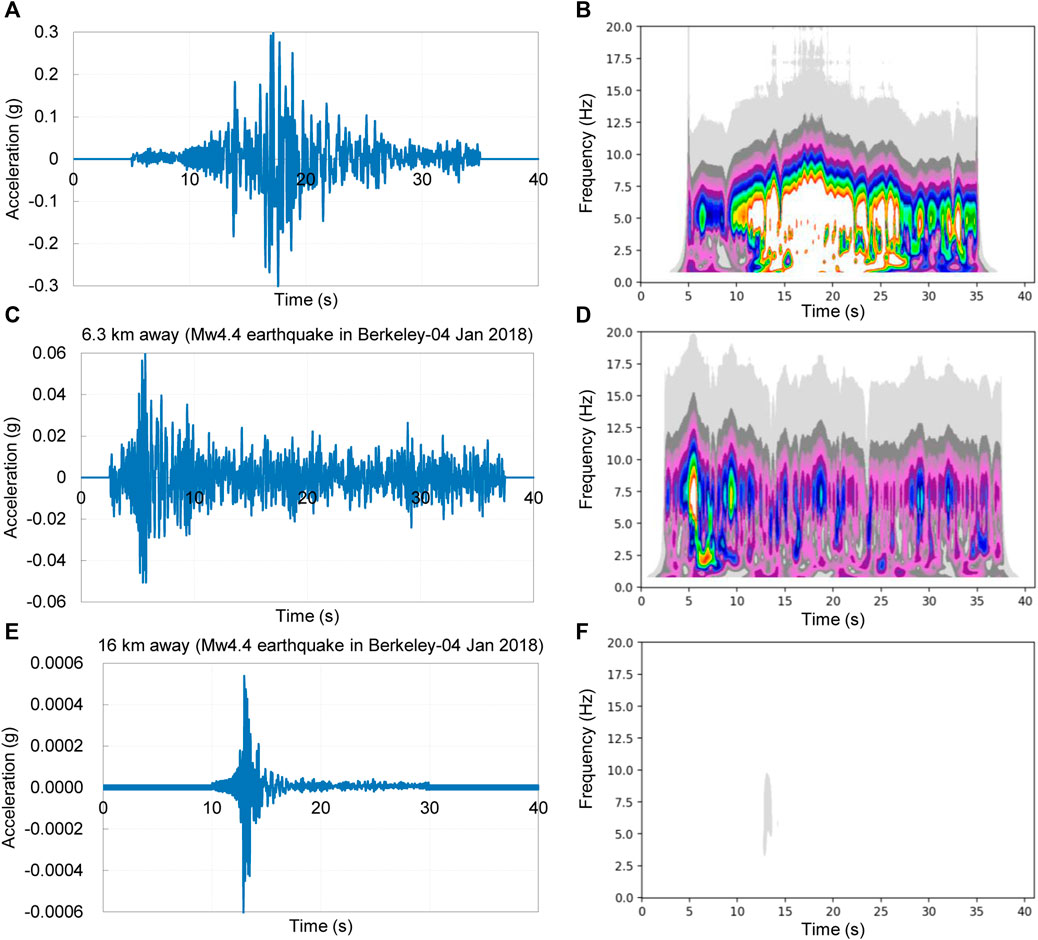
FIGURE 10. Three smartphone-monitored structural vibrations. (A–B) Time-series data and time–frequency characteristics of structural seismic response for training MyShake model (Kong et al., 2016), (C–D) Time-series data and time–frequency characteristics of the structural seismic response of a 24-story building (Patel et al., 2020), (E–F) Time-series data and time–frequency characteristics of the structural seismic response of an 8-story building (Patel et al., 2020).
Subsequently, the best performed VGG19 model in CESMD-Monitored Vibration Identification was adopted for vibration identification, and it only incorrectly identified the seismic response shown in Figure 10E. The primary reason is that the seismic response’s amplitude was so small that the identification system misjudged it as a normal vibration. Overall, the results of smartphone-monitored vibration identification have proven the effectiveness of the proposed method, and more smartphone-monitored data will be used for validation in the future.
In summary, based on tests of four deep neural network models, the performance of the VGG19 model was excellent and stable, while those of the CNN2D, InceptionV3, and ResNet50V2 models were relatively poor. Simultaneously, the vibration identification results for the simulated and real monitored structural seismic responses were consistent, proving the high consistency of the time–frequency characteristics between the simulated and monitored vibrations, and the rationality of the feature-based deep transfer learning method. Therefore, the VGG19 neural network model with the wavelet coefficient matrix input is recommended to identify structural seismic responses. Additionally, it is worth noting the following limitations of the proposed method 1) when the noise of the monitored vibration is large (approximately >6 mg), or the seismic response is small (approximately <6 mg), the identification system may misjudge; 2) when the horizontal accelerations exceed approximately 0.3 g, smartphone’s slip may cut off the peak amplitudes of smartphone-monitored vibration (Kong et al., 2016). Future studies will be conducted to overcome these limitations.
A novel identification method for structural seismic responses was proposed in this paper. It adopts deep transfer learning and the input of time–frequency domain characteristics. The method is composed of the primary extractor, deep extractor, and classifier modules. The primary extractor adopts wavelet transform analysis; the deep extractor uses deep transfer neural networks; and the classifier utilizes a simple neural network to conduct the final classification. The detailed conclusions are as follows.
(1) It was difficult to adopt real monitored structural seismic responses in vibration identification training because of their small quantity; therefore, transfer learning was utilized, and simulated seismic responses were used to enrich the datasets. In feature-based transfer learning, the source domain consisted of the responses simulated by finite element analysis, and the target domain consisted of the real monitored seismic responses. Moreover, their time–frequency domain characteristics were highly consistent, supporting feature-based transfer learning. The test results also proved the consistency and rationality of the adopted transfer learning method.
(2) The fine-tuning transfer learning method was adopted to address the big-data classification problem of normal vibrations and simulated structural seismic responses, because it is difficult to use simple deep neural networks to extract and classify vibration features. The pre-trained VGG19 network model could effectively perform the vibration identification. In contrast, the InceptionV3 and ResNetV2 network models seriously overfitted because their network architectures were too complicated for the binary classification problem in this study.
(3) The VGG19 network model performed outstandingly in the training, validation, and test processes, with an accuracy above 90%, when using the time–frequency characteristic matrices as the input. Hence, the combination of the characteristic matrix input and the VGG19 model is recommended to identify structural seismic responses. Moreover, large vibration noises and small seismic responses may lead to unsuccessful identification, and excessive horizontal accelerations may cause smartphone’s slip and inaccurate recording of the vibration. Further improvements need to be made in the future.
The datasets presented in this study can be found in online repositories. The names of the repository/repositories and accession number(s) can be found below: https://github.com/wenjie-liao/DTL_TFC_Vibration_Identification
All authors conceived the study and contributed to writing the manuscript. WL and XC collected the datasets, conceived the model, and implemented the experiments and analysis. XL, YH, and YT supervised the study. All authors contributed to interpreting the results.
The authors are grateful for the financial support from the National Key Research and Development Program of China (No. 2019YFC1509305), China Postdoctoral Science Foundation (No. 2020M680576), and the Tencent Foundation through the XPLORER PRIZE.
The authors declare that the research was conducted in the absence of any commercial or financial relationships that could be construed as a potential conflict of interest.
Boubiche, D. E., Imran, M., Maqsood, A., and Shoaib, M. (2019). Mobile crowd sensing—taxonomy, applications, challenges, and solutions. Comput. Hum. Behav., 352–370. doi:10.1016/j.chb.2018.10.028
CABR, CSWADI, CADRI, CEEDI, ECADI, ARUP, SOM (2018). Comparison of typical buildings designed following Chinese and US codes. Report: China Academy of Building Research, Shenzhen, China. [in Chinese]
Carnimeo, L., Foti, D., and Ivorra, S. (2015a). On modeling an innovative monitoring network for protecting and managing cultural heritage from risk events. Key Eng. Mater. 628, 243–249. doi:10.4028/www.scientific.net/KEM.628.243
Carnimeo, L., Foti, D., and Vacca, V. (2015b). On damage monitoring in historical buildings via neural networks,” in IEEE Workshop on environmental, energy, and structural monitoring systems (EESMS) proceedings, Trento, Italy, July, 2015, 157–161. IEEE. doi:10.1109/EESMS.2015.7175870
CESMD (2020). Center for engineering strong motion data. Available at: https://www.strongmotioncenter.org/index.html.
Foody, G. M. (2002). Status of land cover classification accuracy assessment. Rem. Sens. Environ. 80 (1), 185–201. doi:10.1016/S0034-4257(01)00295-4
Foti, D., La Scala, M., Lamonaca, S., and Vacca, V. (2017). Control of framed structures using intelligent monitoring networks. MATEC Web Conf. 125, 05012. doi:10.1051/matecconf/201712505012
Foti, D. (2015). Non-destructive techniques and monitoring for the evolutive damage detection of an ancient masonry structure. Key Eng. Mater. 628, 168–177. doi:10.4028/www.scientific.net/KEM.628.168
He, K. M., Zhang, X. Y., Ren, S. Q., and Sun, J. (2016a). “Deep residual learning for image recognition,” in Conference on Computer Vision and Pattern Recognition. Las Vegas, NV, June, 2016, doi:10.1109/CVPR.2016.90
He, K. M., Zhang, X. Y., Ren, S. Q., and Sun, J. (2016b). “Identity mappings in deep residual networks,” in European conference on computer vision, Amsterdam, Netherlands, October, 2016.
InvenSense Inc (2016). High performance 6-axis OIS/EIS optimized MEMS sensor. Available at: https://invensense.tdk.com/download-pdf/icg-20660l-datasheet/ (Accessed January 14 , 2021).
Keras (2020). The Python deep learning library. Avaialble at: https://keras.io/ (Accessed October 4 , 2020).
Kong, Q., Allen, R. M., Schreier, L., and Kwon, Y. (2016). MyShake: a smartphone seismic network for earthquake early warning and beyond. Sci. Adv. 2 (2), e1501055. doi:10.1126/sciadv.1501055)
Krizhevsky, A., Sutskever, I., and Hinton, G. E. (2017). ImageNet classification with deep convolutional neural networks. Commun. ACM 60 (6), 84–90. doi:10.1145/3065386
Lin, K. Q., Xu, Y. L., Lu, X. Z., Guan, Z., and Li, J. (2020). Collapse prognosis of a long-span cable-stayed bridge based on shake table test and nonlinear model updating. Earthq. Eng. Struct. Dynam. 50 (2), 455–474. doi:10.1002/eqe.3341
Liu, J., Shah, M., Kuipers, B., and Savarese, S. (2011). Cross-view action recognition via view knowledge transfer,” in Conference on Computer Vision and Pattern Recognition. Colorado Springs, CO, June, 2011. doi:10.1109/CVPR.2011.5995729
Lu, X. Z., Cheng, Q. L., Xu, Z., Xu, Y. J., and Sun, C. J. (2019a). Real-time city-scale time-history analysis and its application in resilience-oriented earthquake emergency responses. Appl. Sci. 9 (17), 3497. doi:10.3390/app9173497
Lu, X. Z., Liao, W. J., Cui, Y., Jiang, Q., and Zhu, Y. N. (2019b). Development of a novel sacrificial-energy dissipation outrigger system for tall buildings. Earthq. Eng. Struct. Dynam. 48 (15), 1661–1677 doi:10.1002/eqe.3218
Lu, X. Z., Liao, W. J., Huang, W., Xu, Y. J., and Chen, X. Y. (2020). An improved linear quadratic regulator control method through convolutional neural network–based vibration identification. J. Vib. Contr. doi:10.1177/1077546320933756
Lynch, J. P. (2006). A summary review of wireless sensors and sensor networks for structural health monitoring. Shock Vib. Digest 38 (2), 91–128. doi:10.1177/0583102406061499
Ma, H. D., Zhao, D., and Yuan, P. Y. (2014). Opportunities in mobile crowd sensing. IEEE Commun. Mag. 52 (8), 29–35. doi:10.1109/MCOM.2014.6871666
Mangalathu, S., and Jeon, J. S. (2020). Ground motion-dependent rapid damage assessment of structures based on wavelet transform and image analysis techniques. J. Struct. Eng. 146 (11). doi:10.1061/(ASCE)ST.1943-541X.0002793
Nath, N. D., and Behzadan, A. H. (2020). Deep Convolutional networks for construction object detection under different visual conditions. Front. Built Environ. 6, 97. doi:10.3389/fbuil.2020.00097
Pacific Earthquake Engineering Research Center (2006). PEER NGA Database. Berkeley, California: University of CaliforniaAvailable at: http://peer.berkeley.edu/nga/ (Accessed October 4 , 2020).
Patel, S., Kong, Q. K., Gunay, S., and Allen, R. (2020). Applications of smartphone seismic data for rapid structural health assessment. ESSOAr doi:10.1002/essoar.10502141.1
Shirzad-Ghaleroudkhani, N., Mei, Q., and Gül, M. (2020). Frequency identification of bridges using smartphones on vehicles with variable features. J. Bridge Eng. 25 (7), 04020041. doi:10.1061/(ASCE)BE.1943-5592.0001565
Shrestha, A., and Dang, J. (2020a). Deep learning-based real-time auto classification of smartphone measured bridge vibration data. Sensors 20 (9), 2710 doi:10.3390/s20092710
Shrestha, A., Dang, J., Wang, X., and Matsunaga, S. (2020b). Smartphone-based bridge seismic monitoring system and long-term field application tests. J. Struct. Eng. 146 (2), 04019208. doi:10.1061/(ASCE)ST.1943-541X.0002513
Simonyan, K., and Zisserman, A. (2014). Very deep convolutional networks for large-scale image recognition. Available at: https://arxiv.org/abs/1409.1556 Accessed January 16, 2021
STMicroelectronics (2017). LSM6DS3 iNEMO inertial module: always-on 3D accelerometer and 3D gyroscope. Available at: https://www.st.com/resource/en/datasheet/lsm6ds3.pdf.
Szegedy, C., Vanhoucke, V., Ioffe, S., Shlens, J., and Wojna, Z. (2016). “Rethinking the inception architecture for computer vision,” in Computer Vision and Pattern Recognition, Las Vegas, NV, June, 2016. doi:10.1109/CVPR.2016.308
Tang, Z. Y., Chen, Z. C., Bao, Y. Q., and Li, H. (2019). Convolutional neural network-based data anomaly detection method using multiple information for structural health monitoring. Struct. Contr. Health Monit. 26 (1), e2296. doi:10.1002/Stc.2296
Wang, J. D. (2020). Transfer learning. Available at: https://github.com/jindongwang/transferlearning. Accessed January 16, 2021
Wang, Y., Brownjohn, J. M., Dai, K. S., and Patel, M. (2019). An estimation of pedestrian action on footbridges using computer vision approaches. Front. Built Environ. 5, 133. doi:10.3389/fbuil.2019.00133
Xu, Y. J., Lu, X. Z., Cetiner, B., and Taciroglu, E. (2020a). Real-time regional seismic damage assessment framework based on long short-term memory neural network. Comput-Aided Civ. Inf. Eng. doi:10.1111/mice.12628
Xu, Y. J., Lu, X. Z., Tian, Y., and Huang, Y. L. (2020b). Real-time seismic damage prediction and comparison of various ground motion intensity measures based on machine learning. J. Earthq. Eng. doi:10.1080/13632469.2020.1826371
Ye, X. W., Jin, T., and Yun, C. B. (2019). A review on deep learning-based structural health monitoring of civil infrastructures. Smart Struct. Syst. 24 (5), 567–586. doi:10.12989/sss.2019.24.5.567
Yosinski, J., Clune, J., Bengio, Y., and Lipson, H. (2014). How transferable are features in deep neural networks? Adv. Neural Inf. Process. Syst. 27, 3320–3328. doi:10.5555/2969033.2969197
Zhao, Z. T., Chen, Y. Q., Liu, J. F., Shen, Z. Q., and Liu, M. J. (2011). Cross-people mobile-phone based activity recognition,” Proceedings of the 22nd International Joint Conference on Artificial Intelligence, Barcelona, Catalonia, Spain, July, 2011. doi:10.5555/2283696.2283820
Keywords: crowdsensing, deep transfer learning, time-frequency characteristics, wavelet transform, structural seismic responses
Citation: Liao W, Chen X, Lu X, Huang Y and Tian Y (2021) Deep Transfer Learning and Time-Frequency Characteristics-Based Identification Method for Structural Seismic Response. Front. Built Environ. 7:627058. doi: 10.3389/fbuil.2021.627058
Received: 08 November 2020; Accepted: 18 January 2021;
Published: 12 February 2021.
Edited by:
Michele D’amato, University of Basilicata, ItalyCopyright © 2021 Liao, Chen, Lu, Huang and Tian. This is an open-access article distributed under the terms of the Creative Commons Attribution License (CC BY). The use, distribution or reproduction in other forums is permitted, provided the original author(s) and the copyright owner(s) are credited and that the original publication in this journal is cited, in accordance with accepted academic practice. No use, distribution or reproduction is permitted which does not comply with these terms.
*Correspondence: Xinzheng Lu, bHV4ekB0c2luZ2h1YS5lZHUuY24=
Disclaimer: All claims expressed in this article are solely those of the authors and do not necessarily represent those of their affiliated organizations, or those of the publisher, the editors and the reviewers. Any product that may be evaluated in this article or claim that may be made by its manufacturer is not guaranteed or endorsed by the publisher.
Research integrity at Frontiers

Learn more about the work of our research integrity team to safeguard the quality of each article we publish.