- 1Architecture and Building Systems, ETH Zürich, Zurich, Switzerland
- 2Intelligent Environments Laboratory at the University of Texas at Austin, Austin, TX, United States
In the building and construction sector, the mismatch between predicted and measured energy consumption is a well-known phenomenon called the performance gap. A promising approach to reduce the performance gap and thus improve the current building energy performance assessments are methods based on in-situ measurements. In this work, we present a building assessment process based on a novel, easily deployable wireless sensor kit. The basic sensor kit for building energy assessment presented in this study consists of a heating energy input node, several indoor temperature nodes, an outdoor temperature node, and a heat flux sensor. Specifically, the study outlines a medium-scale deployment of the sensor kit in eight occupied single-family homes in Switzerland and identifies the benefits of such an approach in the estimation of the overall heat loss coefficient and U-values. The findings of this study suggest that such sensor kits could be effectively used for rapid building performance assessment, and the paper concludes by outlining the potential benefits and implementation challenges of a larger scale study.
Introduction
Buildings make up 36% of the final energy consumption and 40% of the energy-related greenhouse gas emissions in Europe (United Nations Environment Programme and International Energy Agency, 2018). As a result, buildings are vital for any endeavor to reduce primary energy consumption and greenhouse gas emissions, despite the fact that most of the buildings in the western world have already been built. Specifically, the IEA estimates that in the United States and the European Union, 60% of the current building stock will still be in operation in 2050 (International Energy Agency and Organisation for Economic Co-operation and Development, 2013). Hence, within the building sector, building refurbishments are essential to reduce energy consumption and greenhouse gas emissions. In Switzerland, the reduction of greenhouse gas emissions of the building stock is a key mitigation measure of the energy strategy 2050, which aims to reduce the energy-related greenhouse gas emissions of Switzerland by 77% by 2050 in relation to reported levels in 2000 (Prognos, 2012).
In the following subsections, we briefly introduce the performance gap, the current state of smart meters, and the current state of the art of in-situ measurements for building performance assessments.
Performance Gap
The key departure point of this research is that building retrofitting will play a key role in achieving this transition, and therefore more site-specific approaches to understanding the phenomenon of the performance gap are warranted. The performance gap in the building and construction sector occurs when the calculated energy consumption does not match the measured energy consumption in buildings (de Wilde, 2014). This phenomenon affects building retrofits in two ways, which are known as the prebound effect and rebound effect.
The prebound effect occurs in building energy assessments of older buildings to be retrofitted (Sunikka-Blank and Galvin, 2012). These assessments often yield a higher energy consumption than what is measured. There are multiple drivers for this performance gap, including: 1) the lack of accurate data about the building; 2) building properties changing due to aging or moisture; 3) undocumented refurbishments; 4) inefficient operation of building systems; and 4) occupant behavior. Therefore, in the field, building assessors must make assumptions about the missing information on visual inspections and professional experience. Remote measurements are not widely used due to their typically cumbersome and costly nature (Ma et al., 2012). Overall, building assessments are prone to inaccuracies and lead to an inaccurate impression of the current state of the building.
Secondly, due to the significant uncertainties of the building assessment, increased safety margins need to be considered when sizing retrofit measures. As a result, often inappropriate or ineffective retrofit measures are suggested (Ma et al., 2012). Additionally, occupant energy behavior before and after the retrofit can change, and the varying quality of workmanship and construction materials can also modify the energy consumption. This phenomenon is known as the rebound effect and leads to an underestimation of the building energy consumption expected after the refurbishment (Sunikka-Blank and Galvin, 2012).
Similar results have been found for Switzerland. While Cozza et al.’s building-stock level survey has found that the median of the buildings performs better than their energy rating, low performing buildings (G-label) use 40% less energy than expected, and higher-performing buildings (B-label) use 12% more energy (Cozza et al., 2019). Similarly for retrofits, the achieved energy savings were 37% lower than what the standard-based calculation suggested due to prebound and rebound effects (Cozza et al., 2019). Additionally, a study regarding energy labels in Switzerland has found that even though, on average, the buildings perform as indicated by their energy labels, 49% notably use more energy than anticipated by the label (Reiman et al., 2016).
In short, the worst-case scenario of the predicted energy savings of a building retrofit is doubly diminished due to 1) the overestimation of the energy consumption of the unretrofitted building, and 2) the underestimation of the energy consumption of the retrofitted building. In combination, the prebound effect and the rebound effect result in an estimated performance gap of 30% on average within the European building stock (Sunikka-Blank and Galvin, 2012).
Smart Meters
Smart meters can be used to derive building performance characteristics, reducing the performance gap. Researchers are anticipating easier access to energy data due to the wide rollout of smart meters (Senave et al., 2019a, 2019b; Chambers and Oreszczyn, 2019; Deb et al., 2019). The penetration rate of smart meters in the European Union is expected to be 43% by the end of 2020 and 92% by 2030. The penetration rate varies significantly throughout the European Union from 0% in Germany to 100% in Sweden. The rollout for smart gas meters is even slower, with an expected penetration rate of 44% by 2024 (Tounquet and Alaton, 2020). To accelerate the uptake of smart meters, the European Union is developing the Smart Readiness Indicator (Ma et al., 2020), which helps to raise awareness of the benefits of building smartness. In 2018, the Swiss federal government set the objective of an 80% penetration rate for smart electricity meters by 2027, which are also required to have a bi-directional interface for end-users. However, there is no common standard required for the interface (Swiss Federal Council, 2020). There are more than 700 Swiss electricity suppliers, which are regulated on a cantonal or municipal level1. Hence, any endeavor to collect meter-level electricity demand data needs to either integrate smart meters across different interfaces or negotiate access to the data with 700 different electricity suppliers. There are currently no plans for smart gas meters in Switzerland.
Even with access to energy data, there remains the challenge of disaggregation of the energy demand into categories, such as space heating, appliances, and domestic hot water, which adds a data processing step and uncertainty (Senave et al., 2019b; Deb et al., 2019). Further, a significant amount of the energy supply for space heating is not directly metered. Among the ones that are not metered are typically systems based on wood, heating oil, and coal, which account for 41% of the total heating energy use in the European Union2 and 49% in Switzerland3, respectively.
Measurement-Based Building Performance Assessment
To further improve the quality of building performance assessment and subsequently reduce the performance gap, several strategies exist to acquire operational data of buildings with sensors and to derive building characteristics from measured data. For example, Baker conducted 70 U-value measurements in occupied traditional Scottish buildings using offline data loggers (Baker, 2011). The author concludes that the calculated U-values tend to be higher as compared to the corresponding measurements.
Bacher et al. describe the experimental setup, data acquisition, and data analysis of a monitoring campaign in an unoccupied office space in Denmark (Bacher and Madsen, 2010). The measurement data is used for the identification of suitable thermal RC models (Bacher and Madsen, 2011). In total, 86 sensors and actuators were deployed in the single-story structure with a footprint of approximately 100 m2. The experiments lasted 58 days in total. Further, the authors also detail data processing (e.g., time synchronization of all sensors, treatment of gaps in the measured data, comparison of redundant data, and visual inspection of the entire data set). The time gaps in the data lasted between 20 min to two hours. They derived two outputs (overall heat loss coefficient and thermal capacity) to assess the quality of various models. More examples of measurement campaigns in testbed buildings can be found in (Janssens, 2016).
Dimitriou describes sensor deployment in 20 inhabited domestic buildings in the United Kingdom (Dimitriou, 2016). The author describes the effort in recruiting and coordinating with the homeowners and provides an overview of the required visits for the entire case study. More than 1,084 sensors were deployed in total. The sensors included dataloggers for air temperature, relative humidity, light intensity, radiator surface temperature, whole-house electricity consumption, and gas consumption. A nearby weather station provided weather data. From the 20 houses investigated, only data from 11 houses could be used for further modeling. The main reasons for the exclusion of the other datasets were gaps in the data due to the low memory capacity of the dataloggers, difficulties with scheduling visits with occupants, erroneous sensor data due to sensor malfunctioning or detachment of sensors, and connectivity issues regarding the energy measurements. One building was excluded from further modeling due to the complex heating system. The author details the manual inspection and processing of the measurement data, particularly the handling of gaps in the data and outliers.
The above-described examples concerned studies in mostly occupied buildings. However, there are also methods available that require vacant buildings, e.g., co-heating tests (Bauwens and Roels, 2014). During co-heating tests, electric heaters are installed to uniformly heat the building to a constant temperature, usually 25°C. By measuring the heat input, internal gains, solar radiation, indoor temperatures, and outdoor temperatures, the heat loss coefficient (HLC) can be determined, e.g., by linear regression. Co-heating tests can also include blower door tests and tracer gas tests for the assessment of the airtightness of the building. The co-heating test is a quasi-steady-state method and typically requires a test period of approximately 7–21 days (Alzetto et al., 2018a). There are variants of the co-heating method that consider the dynamic behavior of the building, which leads to shorter test periods, e.g., QUB (2 days), P-STAR (3 days), or ISABELE (15 days) (Subbarao, 1988; Alzetto et al., 2018b; Thébault and Bouchié, 2018). All variants of the co-heating methods are intrusive and require extensive equipment. Senave et al. investigated the determination of HLC in occupied buildings omitting the requirement of a constant indoor temperature of 25°C (Senave et al., 2019a; Senave et al., 2019b; Senave et al., 2019c; Senave et al., 2020a). The method does not require auxiliary heaters or fans. Instead, the space heating input to the dwelling is measured. The authors found that the accuracy of the HLC is influenced by several parameters, e.g., the duration of the test, the number of temperature sensors and their placement, and the data analysis method. But also, the occupancy schedules and the building energy performance levels influenced the accuracy. The best methods can determine the HLC with an accuracy of 2.5% (Senave et al., 2020b).
In the above-described examples, the authors used data acquisition systems from multiple suppliers, often mixing online logging solutions with offline data loggers as well as merging data from the different systems. The authors in (Bacher and Madsen, 2010; Dimitriou, 2016; Senave et al., 2019c) mention gaps in the time series data, which needed to be addressed during the data processing or lead to the exclusion of the case study object from further use. For online monitoring systems, gaps were noticed during the monitoring period, and attempts were made to rectify the issues. For offline data loggers, the issues were only noticed after the read-out of the data. The deployment process in the examples is described in varying detail. The shortcomings of the research outlined above are primarily the lack of description of the required resources for the sensor deployment, i.e., cost, time, personnel, tools, and materials. The same holds true for the challenges encountered during the entire deployment and data-processing. Moreover, experiences and feedback from the occupants regarding the monitoring in their environments or the deployment are also not reported.
Additionally, the literature review highlights that the hardware-side of measurement-based building performance assessment has improved little over the past ten years. Evidence-based building performance assessment currently still requires heterogeneous setups, including the deployment of multiple sensors of different brands, which is cumbersome. Moreover, offline dataloggers are still prevalent. This suggests that smart meters are potentially useful for building energy research. However, wide-scale easy access to space heating input for an arbitrary building is still a long time coming due to the varying availability of smart-meters, non-uniform access policies to smart-meter data, and significant diversity of space heating fuels, which includes fuels that are not directly metered.
Objectives of this Research
As described above, wide-scale on-site building performance assessment is hindered by the practical challenges associated with sensor deployment and access to heating energy data. This work aims to objectively discuss the benefits and risks of using a cost-effective and easy-deployable WSN for gathering building data for assessing the building performance. We propose and demonstrate a process that allows a wide-scale rollout of evidence-based building performance assessment. We apply the process to estimate the heat loss coefficient and U-values and demonstrate it on a residential building case study. We present the methodology to estimate the heat loss coefficient and U-values. Finally, we describe the process from WSN deployment to the inference of building characteristics and discuss the encountered risks and learnings.
The paper is organized as follows: Section Wireless Sensor Networks-Based Building Performance Assessment presents the process of deploying a streamlined WSN for deriving heat loss coefficients and U-values from in-situ measurement data in occupied buildings. Section Case Study: Eight Residential Building in a Moderate Climate presents the results of a case study campaign in eight residential buildings and compares the results inferred from the measurement data to standard values assessed using conventional methods. Section Risks and Learnings reports on risks and learnings encountered during the case study campaign that, however, also apply to any comparable measurement campaign. Section Conclusion and Outlook concludes the work and provides an outlook.
Wireless Sensor Networks-Based Building Performance Assessment
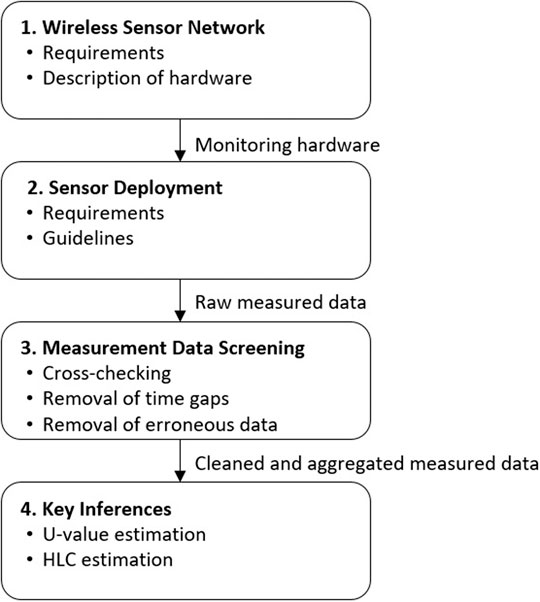
In the following section, we outline a process to capture in-situ data of occupied buildings. The process is based on the utilization of a wireless sensor network (WSN) (Figure 1, step 1). The WSN is deployed in the building while it is operated in a regular manner (step 2). The data is acquired and screened (step 3). The process concludes with the inference of energy-relevant characteristics of the building (step 4).
Wireless Sensor Network Architecture
The novel WSN used in this work has been introduced previously in (Frei et al., 2020), where performance, cost, and sensor choice are discussed in detail. The WSN allows for measurements of air temperature, relative humidity, supply and return temperature of hot water from the heating system and the radiators, heat flux through the walls and the windows, luminosity, oil flow, electricity, window opening times, and CO2-concentration. The modular design and the open-source architecture allow tailoring the number and type of sensors to the specific needs4. Besides, streaming to an online database enables the monitoring of measured data in near real-time, which allows for fault detection during operation without requiring on-site visits.
Deployment of the Wireless Sensor Network
The deployment process includes the preparation of the sensor deployment, communication with stakeholders, on-site visits, sensor installation, maintenance, and removal of sensors. The deployment of the WSN has been previously described for a single building (Frei et al., 2020). Typically, before the deployment of the sensors, sensor node positions are proposed on the floor plans. The final sensor location, however, was influenced by the individual preferences of the various stakeholders. The installation of the sensor nodes took, on average, seven minutes per sensor node.
Measurement-Data Screening
During the data collection process, it is likely that imperfections occur in the data set, despite all efforts to avoid that. Such imperfections consist of time gaps in the measurement data and erroneous measurement data. Time gaps in the data can be caused by transmission errors, which in turn can be caused by weak wireless connections or a malfunction of one of the sending or receiving devices (Frei et al., 2020). For this work, the data set was split into two parts if the time gap was longer than one hour. For time gaps shorter than one hour, the missing values were replaced by linear interpolation between the measurement values before and after the gap. At the end of the process, the longest data set was used for further analyses.
It is common for distributed sensor networks that the timestamps of the measured data from different sensors are not synchronized. However, the timestamps of the measured data from different sensors need to be synchronized to combine the data in further calculations. For the time synchronization, a new date vector was defined with the desired sampling timestamps. The measured data was then linearly interpolated at the new timestamps. A sampling interval of five minutes was chosen for this work. For U-value estimation, the data was cropped to have the first and last timestamps occur at the same time of day. For HLC estimation, the data was cropped to keep only whole days worth of data. Then the daily average is taken of the resampled data with the five-minute sampling interval. Daily averages were chosen to counteract dynamic thermal effects (Butler and Dengel, 2013; Chambers and Oreszczyn, 2019).
Erroneous data can be caused by malfunctions on the sensor node, malfunction of the sensor mount, and environmental interferences. The data needs to be within reasonable limits and internally consistent. We used visualizations, such as time-series plots, raster plots, histograms, and statistical indicators, e.g., maximum, minimum, and mean, to detect outliers (Frei et al., 2020). Further, we compared the indoor temperatures against each other and the default value in the standard. In addition, we compared the outdoor temperatures measured in-situ against outdoor temperatures measured at a nearby weather station.
Inference of Building Characteristics
Once the measurement data is acquired and pre-processed, useful information can be extracted. In the following subsections, the methods to extract information relevant for a building performance assessment are presented.
U-Value Calculation
Using the data from the heat flux sensors, the U-values can be inferred. ISO 9869–1:2014 outlines the calculation of the U-value based on two air temperature measurements of either side of the building element and the heat flux through the building element (International Organization for Standardization, 2014). The thermal transmittance U (W/m2K) is calculated with the average method, according to Eq. 1.
where qj is the heat flux (W/m2) through the building element at time j, Tij is the interior environmental temperature (°C or K) at time j, and Tej is the exterior environmental temperature (°C or K) at time j.
Heat Loss Coefficient
The steady-state energy balance for calculating the required space heating power is
where Qh is the required space heating energy (W), Qloss are all thermal losses through the building envelope (W), Qgains are the internal gains from appliances and occupants (W), and Qsolar are the solar gains (W).
For buildings with a low performing envelope, internal and solar gains are much smaller than losses through the envelope during the heating season. Hence, following the reasoning in (Bauwens and Roels, 2014), equation Eq. 2 can be simplified to
where HLC is the heat loss coefficient (W/K), Ti is the indoor temperature (°C), and Ta is the ambient temperature (°C). Unlike the U-value, which represents transmission losses of an individual component, the HLC lumps together all transmission losses and ventilations losses in one value.
For cases where the same system supplies space heating and domestic hot water (DHW), the total energy Qtot (W) can be described as
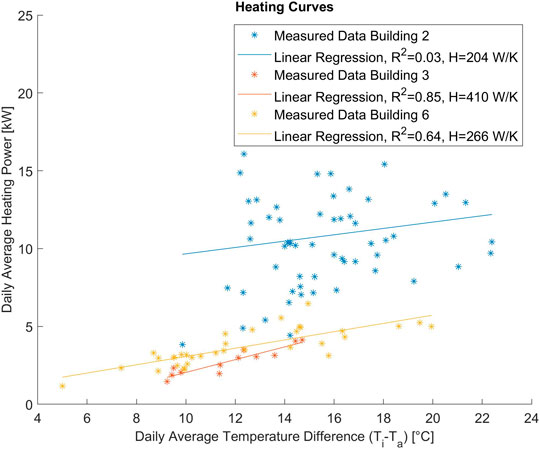
where QDHW is the power needed for DHW production (W). DHW production and hence QDHW is assumed to be independent of indoor and outdoor temperatures (de Santiago et al., 2017). Hence, when Qtot and the temperature difference are plotted against each other, linear regression can be applied to the daily averaged samples. The slope of the line resulting from the linear regression model describes the heat loss coefficient of the building. The contribution of DHW to the daily average heating power results in a vertical shift of the curve but does not influence the slope of the curve. Variations in DHW demand can, however, lead to a wider spread of the data and hence lower R2 values of the linear regression model. For the linear regression, daily averaged arithmetic means for indoor temperatures were used. For the outdoor temperature, we chose measurements from the sensors with the least influence from solar radiation, i.e., we compared the three outdoor temperature measurements from the U-value measurements and chose the one with the lowest mean temperature.
In addition, the experimentally measured HLC, which is derived from space heating energy input, indoor temperature, and outdoor temperature (Eq. 3), the heat loss coefficient was estimated by an energy assessor according to the SIA 380/1 (Swiss Society of Engineers and Architects (SIA), 2016), where HLC in (W/K) is defined as the sum of all transmission losses and the ventilation losses:
The transmission losses consist of the U-values Ui (W/m2K) of the envelope elements multiplied by their respective surfaces Ai (m2), the linear thermal transmittances Ψi (W/mK) multiplied by their respective lengths li (m), and the point thermal transmittances Xi (W/K). U-Values can be multiplied by temperature adjustment factors bi (-) in cases where the building element is adjacent to an unheated space instead of the ambient air. bi is based on the ratio between the temperature difference between the heated and unheated space and the temperature difference between the heated space and outdoors. Alternatively, tabulated values can be used. The ventilation losses result from the multiplication of the air exchange rate qth (m3/m2h) with the heated reference area Aref (m2), the density of air ρair (kg/m3), and the specific heat capacity of air cair (J/kgK).
Case Study: Eight Residential Building in a Moderate Climate
To demonstrate the aforementioned process, we conducted an experimental study using eight occupied single-family residential buildings in Switzerland. Wireless sensor kits were deployed in the buildings between the end of January to mid-May 2017 to acquire measured data during the heating season and extract information about the building properties and occupant preferences.
Case Study Setup
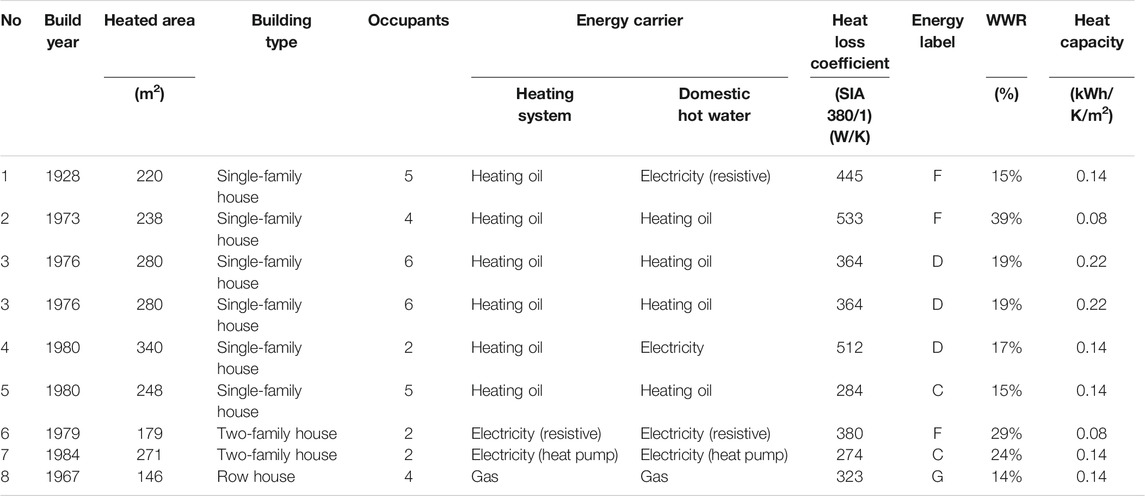
The eight single-family buildings are located near the city of St. Gallen in Switzerland. Initially, a local energy assessor was asked to provide a list of potential measurement sites. The selection criteria were oil-based heating systems and single-family as a building type. However, to broaden the experiment, buildings with different heating systems were also included. Documents provided by the energy assessor included a heating energy assessment based on local standards (SIA 380/1), photographs of the envelope, an assessment of the envelope, a description of the construction of the building and systems, and floor plans. Table 1 provides an overview of the eight case study buildings. The number of occupants per building varied from two to six people. The construction years range from 1928 to 1984. The combination of heating systems for space heating and domestic hot water are different for each building except building two, three, and four. In these three buildings, heating oil is used as an energy carrier for domestic hot water and space heating. The heat loss coefficients estimated according to SIA380/1 range from 274 to 533 W/K. Most envelopes of the case study buildings exhibit low thermal performance with envelope performance labels ranging from C to G, according to GEAK (Hall, 2020). For the base construction of the buildings, materials such as concrete and bricks have been used. Hence the buildings have a rather high thermal mass, indicated by their average heat capacity of 0.14 kWh/m2. Building one and two have newer double and triple glazing windows with U-values between 0.9 and 1.5 W/m2K. The majority of the windows in the remaining buildings are double-glazed windows with U-values above 2 W/m2K. Occasionally, few windows were updated to triple-glazing. The building’s windows-to-wall ratio (WWR) ranges from 14 to 39%. The set of case study buildings is typical for Switzerland, where 51% of all buildings were built before 1970 (Bau- und Wohnungswesen 2018, 2020), and 57% of all residential buildings are single-family buildings5. Each building was equipped with a sensor kit consisting of up to 18 sensor nodes. The number, type, and accuracy of the selected sensors are described in Table 2.
Hardware Deployment
The occupant owners of the buildings selected were already planning to perform a building energy retrofit to their properties. Subsequently, they were engaged in the process and the results, which might have contributed to a positive attitude toward the measurement campaign. Additionally, all participants stated that they would participate in a similar case study again, even though on-site visits occurred more frequently than initially anticipated, which was perceived as the most prevalent nuisance. At the beginning of each site installation, the proposed sensor positions were discussed with the occupants at the location of the sensor nodes in the house. If necessary, the sensor positions were revised. Common reasons for revised sensor positions were the obstruction of the building element by furniture, undocumented changes to the building structure or on request from the occupants. Sensor nodes for U-value measurements were placed on building elements, which were expected to cause the most significant heat losses according to an energy assessment based on the standard SIA380/1 (Swiss Society of Engineers and Architects (SIA), 2016) and preferentially on the north façade. Sensors for air temperature and relative humidity were preferentially placed in the largest volume of each level. For a detailed overview of all sensor locations and orientation, see Supplementary Material.
Most of the time for installing the sensors was spent on sensor cable management. On average, the installation of a sensor node took seven minutes, while the removal of the sensor took three minutes. Even with removable adhesives and carefulness during removal, we could not avoid damages entirely. A private heating system technician installed the oil flow meters.
For fault detection, we examined the measurement data daily online. We particularly made sure that all installed sensor nodes were recording data. Further, random checks were run on the time series data, and whenever sensor nodes went offline or the measured data exceeded the expected limits, an on-site visit was scheduled to inspect the sensor. During on-site visits, we rectified the issue that caused the on-site visit and checked all mechanical mountings of the sensors. However, notably site maintenance-visits typically occurred roughly a week after detection of a sensor issue due to homeowner availability to allow access to the site. This means that despite the ability to determine sensor faults quickly, a gap of several days in the time series data would still occur. Also, we were not always able to address the issue. For instance, the respective oil and electricity meters in building four were never successfully connected to the sensor nodes.
Results Data Screening
Wireless Sensor Network Performance
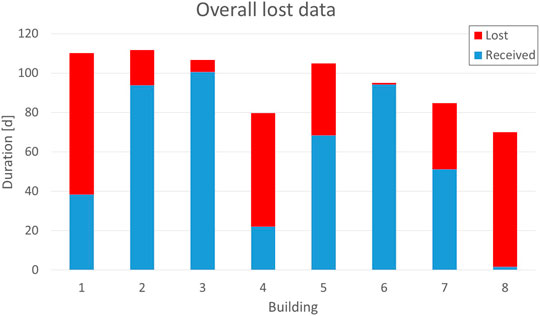
During the measurement campaign, the quality of data varied widely between the buildings, from almost no measured data to measured data with no significant gaps in the time series (Figure 2). For building eight, we were only able to collect a few hours of data, while the data sets for building two, six, and seven are uninterrupted for several weeks. As previously described in (Frei et al., 2020) two kinds of data losses have been observed: 1) A partial loss, where continuous data is available for some sensor nodes, while other sensor nodes show significant data gaps, and 2) full connectivity loss, where no data is available for any sensor nodes.
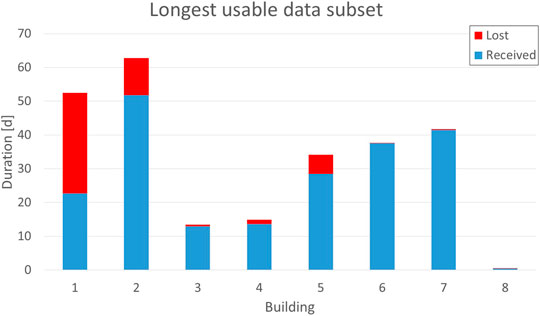
Outages due to gateway malfunction required a manual reset on-site. The outages led to time gaps of multiple days, resulting in a significant amount of lost data packages. Moreover, the installation of the oil flow meters took place after the initial sensor deployment and shrunk the complete length of data sets further. The lost package ratio ranges from 0.8% in building six to 97.7% in building eight, with an overall average of 41.5%. However, when focusing on the longest complete data streams without long periods of missing data, the lost package ratios improve to the range of 0.4% in building six to 56.8% in building one with an overall average of 16.2%, as seen in Figure 3.
In building three, the heating system failed and was replaced thirteen days after the installation of the oil flow meter. This “data loss” does not appear in Figure 2, since the data was not lost during transmission, but the sensors were discarded during the replacement of the heating system. The data loss rate in building four was caused due to an unplugged gateway antenna cable and delays in scheduling for an on-site visit due to vacations of the occupants. In building eight, almost all data was lost because the gateway initially worked for several hours and then stopped working. The issue could not be fixed during a follow-up visit.
Outdoor Air Temperatures
For our estimations, we exclusively used outdoor temperatures measured by the WSN outside of the building. A common approach is to rely on temperature data from a nearby weather station. However, this might introduce significant offsets due to influences such as the vertical thermal gradient and local microclimatic conditions. In our example, using measurements from a nearby (2.5 km) weather station would have resulted in mean deviations of 0.1–2.5°C as compared to measurements taken on site.
Indoor Air Temperatures
Figure 4 presents an overview of air temperatures measured in the case study buildings. The mean of all averaged air temperatures is 20.5°C, while the median is 20.4°C, which is close to the standard room temperature of 20°C in SIA380/1. However, average room temperatures of individual buildings deviate up to 3.3°C from the standard room temperature, e.g., in building two, the average air temperature is 23.3°C. In building four, the average air temperature is 18.2°C. This clearly demonstrates the differences in indoor environments and occupant preferences.
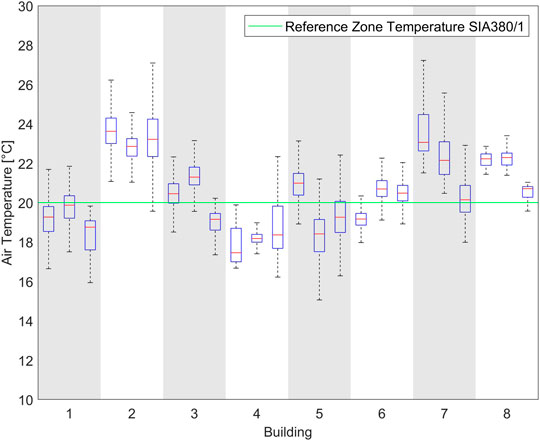
FIGURE 4. Measured indoor air temperatures in the case study buildings. The green line indicates the standard room temperature according to SIA380/1.
Electricity Consumption
Electricity consumption data with good data quality could be accessed from building two and six. Figure 5 shows the two successful attempts to measure the whole building electricity consumption. The plots show two very different electricity usage patterns. In building two (Figure 5, left), electricity is only consumed by appliances and lighting. The electricity consumption peaks between six and seven kilowatts, and the baseload is approximately 500 W.
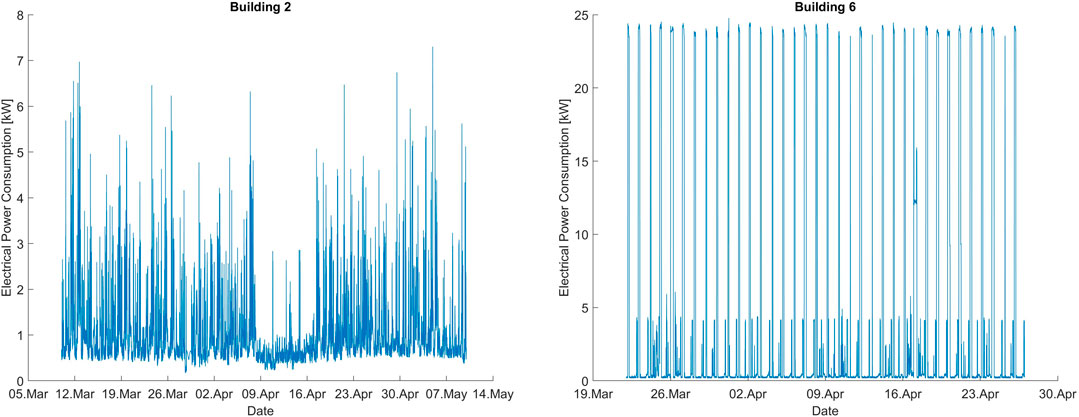
FIGURE 5. Measured electricity consumption of case study building two (left) and case study building six (right).
Further, no usage pattern is apparent. In contrast, in building six, electricity is used for DHW production, heating, lighting, and appliances. There is a clear pattern visible in the electricity consumption of building six (Figure 5, right). During the night, peaks of approximately 24 kW are visible. The peaks are caused by the electric heating system, which thermally loads large water tanks during the night. These water tanks are for space heating only and not to be confused with DHW storage. Further, there are peaks of four kilowatts in the evenings and less frequent during the days. The smaller peaks belong to the DHW boiler. The baseload in building six is approximately 180 W.
The electricity demand in building two amounts to approximately 9.4% of the oil demand for heating and DHW. Detailed disaggregation of the electricity consumption data of building six is available in (Deb et al., 2019). From (Deb et al., 2019), it can be seen that space heating amounts to 86% of the total energy input and appliances amount to 6%. These observations support the assumption that internal gains can be neglected for the HLC estimation of older residential buildings.
Building Characteristics
U-Values
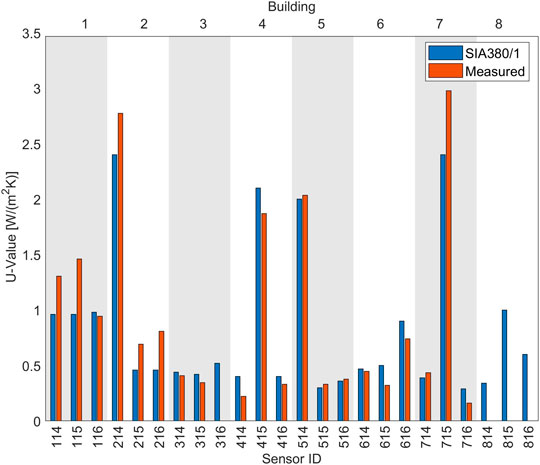
Using the heat flux measurements, we were able to calculate 20 U-values by applying Eq. 1. Table 3 lists all sensor nodes and their locations involved in the U-value measurements.
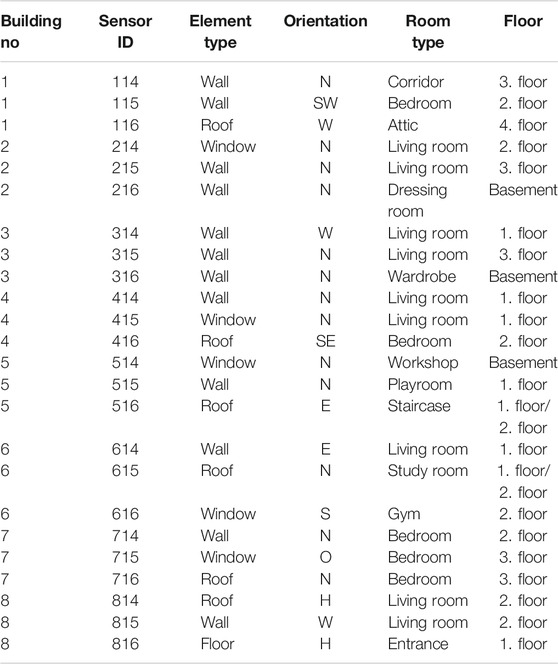
TABLE 3. Location of U-value measurements (Orientation: N: north, E: east, S: south, W: west, H: horizontal).
For light building elements such as windows, only measurement values during night time (one hour after sunset until sunrise) were used for the calculation of the U-values, as recommended in ISO 9869, to avoid the effects of solar radiation. Figure 6 provides an overview of the U-values derived from the measurements compared to the U-values estimated by the energy assessor, according to the SIA 380/1 (Swiss Society of Engineers and Architects (SIA), 2016).
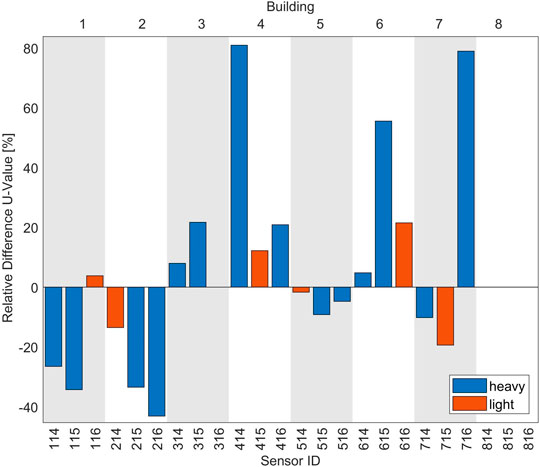
According to ISO 9869, differences between measured and calculated U-values of more than 20% are considered significant. Eleven differences between calculated and measured U-values were found to be significant, i.e., 114, 115, 215, 216, 414, 315, 414, 416, 615, 616, 716 (Figure 7). Only one out of four light-weight elements exhibited a significant difference between calculated and measured U-value. This can be attributed to the fact that the light building elements are expected to have a higher U-value. Therefore, relative differences are smaller for the same absolute difference. On average, the measured U-values are lower than the U-values assumed in the norm-based assessment, i.e., the envelope elements are performing better in reality than assumed.
Heat Loss Coefficient
Before the estimation of the HLC, we applied further data-processing. The measured oil demand was adjusted by the efficiency of the oil boilers, as stated in the manuals, which were 93% for building two and 91% for building three. The electrical storage space heating system charges with constant power during the night, depending on the storage temperature and outdoor temperature. Hence, the length of the charging process depends on the heat demand from the preceding day and the current outdoor temperature. Therefore, the daily means were calculated from 07:00 to 07:00 instead of midnight to midnight. We excluded three days from the analysis due to the very low heat demand of less than 25% of the mean daily demand.
Figure 8 shows the heating curves for the buildings two, three, and six. The slope of the linear regression approximates the heat loss coefficient of the building. The R2 metric for building three and six are 0.64 and 0.85, which is comparable to results from co-heating studies (Butler and Dengel, 2013). However, the regression for building two yields an R2 metric of 0.03 and an underestimation of the HLC of 64% compared to the standard assessment. Averaging over more than one day did increase the HLC estimation to 481 W/m2. However, the fit was still weak with R2 = 0.09. The same procedure did not yield significantly different results for building two and three. Similarly, considering solar radiation did not significantly alter the results. Lastly, the HLC or R2 metric for building two did not change significantly when electricity demand was removed from the heat input. Using a sliding window of three weeks yields the best results for the time from April 7 to April 28 with HLC = 580 W/K and R2 = 0.63. Within the same period is a phase of apparent lower occupancy from April 9 to April 17 (Figure 5, left). During this time, the electricity demand exhibits a lower baseload and significantly fewer peaks. Similarly, the CO2 concentration in the living room exhibits fewer peaks and remains constant for several hours. Hence, when the building is occupied, we suspect a strong occupant interaction with the heat demand of the building, e.g., strong fluctuations in DHW demand, substantial variations in ventilation habits, or variations in shading habits.
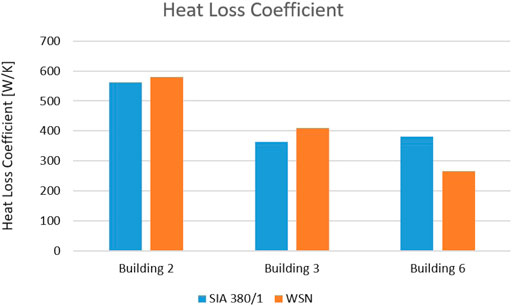
In Figure 9, the measured heat loss coefficients are compared to the calculated heat loss coefficients according to the local standard SIA380/1 (Swiss Society of Engineers and Architects (SIA), 2016). For building two and three, the measured heat loss coefficients are by 3 and 13% higher compared to the calculated assessment. For building six, the measured heat loss coefficient is 30% lower than the calculation.
For buildings two and six, observed deviations of the HLC are consistent with the deviations observed for U-values: Overestimation in the U-value result in an overestimation of the HLC and vice versa. In contrast, the signs of the deviations are opposite for building three. The measured U-values in building three are, on average, 13% lower compared to the assessment, whereas the measured heat loss coefficient is 13% higher than what the assessment suggests. While the HLC depends on all transmissive heat losses and ventilation losses, the U-value measurements are spot measurements of transmissive heat losses, which represent the particular building element. Hence, deviations between U-value measurements and HLC estimation can stem from unaccounted deviations, e.g., ventilation losses or other building elements.
Risks and Learnings
In the following subsections, we will discuss the learnings from the sensor deployment together with working with the measurement data. We discuss the reliability of the sensor network and the effort required to acquire the data. Additionally, we critically review the approach, highlight the challenges, and suggest improvements for further applications.
Technical
The quality of the raw datasets varies from only a few hours measured to data sets with many gaps to data sets without significant gaps. The same is true for individual sensor nodes within a dataset. The gaps caused by the gateway impacted all data from the sensor nodes connected to the respective gateway. These gaps were caused by unplugging of the gateway, lose antenna connections, and issues with the cellular modem. Such gaps require significant effort spent on data analysis and reconstruction and limit the quality of the data. Cases with disconnected gateway antenna cable could be avoided with an improved design of the gateway housing that secures the antenna more safely. Cellular connectivity failures could be inhibited in the future with a more reliable gateway design. Power supply issues cannot be avoided entirely unless the entire wireless sensor network is battery-driven. There is always a chance of an electricity blackout or occupants unplugging the device. To avoid unplugging of the power source, we suggest using a wall outlet in the building that is not shared with other devices and placing the gateway somewhere where it is not easily accessible to occupants. Even though issues with the sensor network can be detected within hours, rectifying the fault can take days or weeks, depending on the availability of occupants. In addition, every visit is an inconvenience to the occupants. Therefore, the sensor network should be as minimal and as robust as possible.
Aside from gaps, invalid sensor data is a concern for sensor nodes, e.g., sensors detaching. The sensors for the U-value measurement, i.e., indoor temperature, outdoor temperature, and heat flux, fell off on a few occasions. This is the consequence of trying to mount the sensor in a way that the sensor can be removed without damaging the surface of the building element. Stronger adhesives could be used, but that might also increase the risk of damage to the surfaces.
We conducted the measurements with a sampling interval of five minutes, which is adequate for building energy applications. The sampling time of five minutes resulted in a battery lifetime of ten to twelve months for the temperature and heat flux sensors, which is more than required for measurements of one heating season in Switzerland. Sensors for energy use were wall-powered. The energy meters were usually in the basement with nearby power outlets. Only in building three, the electricity meters were located outside of the building with no nearby power outlet.
Process
Wireless Sensor Network Deployment
Even though such measurements are often called non-intrusive, it mostly refers to the physical nature of the measurements, i.e., the measurements require no or very little physical change to the building. Nevertheless, the measurements are an intrusion to the privacy and comfort of occupants in their homes. While privacy is a delicate topic, none of the occupants objected to a sensor placement because of privacy concerns. This could be linked to the positive bias of the occupants and voluntary participation in a research project. Mandated in-situ measurements might produce different occupant reactions. The intrusion was most tangible for occupants when negotiating sensor placements at the actual location of the sensor.
The placement of the sensor nodes was planned carefully in advance with the aid of floorplans and a performance assessment. However, the planned sensor placement could not always be implemented due to the objection of the occupants, undocumented changes to the building, and furniture that restricted access to place the sensors. Occupants either refused to have the visual intrusion of the sensors in the living room and bedroom, or they feared it might interfere with their routines. In these cases, it is up to the measurement facilitator to propose acceptable alternatives. Moreover, floorplans might not always be available in future case studies.
The deployment of the sensors is already rapid. The most time-intensive sensors are the sensors for U-value measurement and the oil flow meters. The sensors for the U-value measurement require time-intensive cable management. A way to improve this situation is to recombine the sensors into one sensor module for outdoor temperature and one sensor module for indoor temperature and heat flux. This approach would allow to shorten the cables and shorten the associated cable management process significantly.
The oil flow meters required a third party for installation, which led to at least one additional site-visit. Non-invasive clamp-on flow meters could save significant amounts of time and reduce the number of on-site visits.
The current data screening process is manual and needs to be carried out every day of the deployment for fault detection, which is labor-intensive. The most common data integrity issues included gaps in the time-series data and heat flux sensors that detached from the wall. There is potential for improvement by rule-based automation of the tasks. For example, heat flux sensors that detach from the wall transmit values close to 0 W/m2 with little variance because both sides of the sensor are exposed to the same air. Another example is the DS18B20 sensors, which send −127°C in case of connectivity issues between sensors and sensor module. Both values are easy to detect and therefore can be used for automated detection of measurement errors.
Inference of Building Characteristics
The envelopes of the case study buildings exhibit low thermal performance, which justifies the simplifications in the heat balance needed for the HLC estimation. This is supported by the low relative share of internal gains. Nevertheless, this leads to an underestimation of the HLC. The analysis of the HLC for building two has shown that there is likely a strong impact from occupant behavior on the space heating demand. Further, we assumed that DHW demand is independent of temperature. Hence, it does not influence the HLC estimation. However, the DHW demand is likely to vary over time, which introduces more variance in the HLC estimation.
The issues mentioned above seem to be permissible for buildings with low energy performance. However, as other researchers have shown, this is no more the case for high-performing buildings (Alexander and Jenkins, 2015; Senave et al., 2020b). Hence, buildings with high energy performance require a more elaborate sensing setup to have a better grasp on all heating inputs, i.e., internal gains, metabolic gains, solar irradiation, and space heating input independent of DHW demand. On the bright side, higher-performing buildings tend to have more homogeneous internal temperatures. Hence, the number of temperature sensors can likely be decreased with increasing envelope performance (Senave et al., 2020b).
While the HLC allows the assessment of the overall performance of a building, it does not allow to pinpoint issues. U-value measurements allow for spot checks of building elements. Hence, U-value performance is a subset of the HLC performance, which includes all transmissive losses as well as ventilation losses. It is, therefore, possible that the average deviation from the standard assessment is not equal for some U-values and the HLC. For a better comparison between HLC estimation and spot-measurements, the U-value of all building elements should be measured as well as ventilation losses. Such comprehensive spot measurements are likely to require many more sensors, while linear and point thermal transmittance are still unknown. Furthermore, the measurement of ventilation losses requires significantly more time and tools, compared to the deployment of more sensor nodes. Alternatively, the ventilation losses could be estimated based on CO2 concentration measurements. However, more research is required on that topic with regard to single-family buildings.
Measuring Space Heating Consumption
The measurement of energy carriers using the meters installed proved to be challenging. This starts at the level of the meter type and available interfaces. On the building systems level, it needs to be understood which systems for space heating, DHW, and which storage tanks are included and how they are combined. This means that the instant primary energy use is not necessarily proportional to the instantly supplied space heating energy.
On a meter level, the sensor kit is currently only able to access energy consumption, e.g., electricity or gas, if the energy meter outputs light pulses or electric pulses. Only in three cases, the electricity was measured successfully. In the three other cases, the energy meters did not have an appropriate interface. In one case, the electricity meter was located outside and could not be accessed with the sensor kit due to a lack of weatherproofing. Natural gas was one of the primary energy sources for heating and DHW. However, the energy meters installed in the case study buildings were analog and could not be interfaced with the sensor network, which is a commonly faced issue.
For oil-based heating systems, a third party installed an oil meter between the oil tank and the heating system. The oil meter had a cost of USD 225, and the installation of the oil meter had a cost of approximately USD 210 on average. The involvement of a third party for the installation of the oil meter increased the scheduling complexity. The setup of the heating systems of the case study buildings was heterogeneous regarding the energy carriers and the integration of DHW generation in the heating system. The measurement of energy used for space heating also proved to be challenging on the system level. There were four different systems for heating, namely gas boiler, oil boiler, ground borehole with heat pump, and electric resistive heating. Additionally, the energy source for DHW was not necessarily the same as for space heating. In the eight case study buildings, there were six different setups for the supply of space heating and DHW. The inclusion of DHW in the energy consumption data was addressed with the assumption that DHW demand is independent of the heating energy. Hence, it does not affect the slope of the heating curve. However, for more detailed analyses, e.g., grey box modeling, it is desirable to have access to heating energy demand data only and with high temporal resolution. With the current sensor suite, it is not possible to access the efficiency of the heating system, i.e., we cannot determine how much energy from the energy carrier is actually converted to heat and transferred to the building and how much is lost in the process. Hence, the heat loss coefficients calculated earlier relied on efficiency data from the manuals. Hence, clamp-on flow meters seem to be a promising alternative for accessing space heating energy use.
Limitations
The construction of the buildings measured in this case study were quite uniform, featuring a high thermal mass and low performing thermal envelopes. For the heating season, this allowed to make certain simplifications about internal heat gains. As the standard-based assessments show, even for buildings with a rather low windows-to-wall ratio, the solar gains can be significant, particularly in spring and autumn. For the buildings measured, they range from 20–36% compared to the total losses in March of a standard year, which means an error of the HLC estimate in the same order of magnitude. For different conditions, e.g., light-weight construction, milder climate, or better-performing envelopes, the impact of solar gains could be even larger, and hence the underlying assumptions for the estimation of the HLC need to be reviewed. In cases where higher accuracy is required, an on-site solar radiation measurement is needed.
Disturbance by solar radiation was minimized by placing outdoor temperature sensors preferentially on the north façade. In the extreme case of building six, where one U-value setup was mounted on a window on the south façade, only night values were used to compute the U-value, which is in line with ISO 9869. Although ISO 9869 does not require shaded sensors, the difficulty of measuring the ambient temperature is discussed in Annex A of that standard where shading is suggested. The preferential installation on the north side and only using night values for windows is also in accordance with the manuals from the manufacturer of the heat flux sensors6. For practical reasons, we decided not to install shading devices on the outdoor temperature sensors and attempted to avoid solar disturbances by appropriate sensor placement. Solar radiation can cause temperature measurement errors of up to 0.5°C (World Meteorological Organization, 2008, 86, 396; Philipona et al., 2013). This might lead to a maximal additional uncertainty of the HLC estimate in the range of 3–5%, assuming an average temperature difference of 10–20°C between indoor and outdoor.
While we were able to demonstrate that it is possible to measure relevant building properties in high quality with less effort as compared to previous studies (Bacher and Madsen, 2010; Dimitriou, 2016; Alzetto et al., 2018b), we are aware that certain assumptions taken to simplify the process risk bear additional inaccuracies. We did not study the cumulative impact of these inaccuracies, which require further investigations.
Conclusion and Outlook
Building performance assessment and retrofits are essential for any comprehensive strategy to save greenhouse gas emissions and primary energy consumption. Due to a lack of readily available off-the-shelf hardware and tools for remote sensing of multiple modalities in buildings, we developed a novel modular and open-source sensor network for building performance assessment.
Within the Swiss case study presented in this paper, sensor kits were installed in eight occupied single-family homes during the heating season 2016/2017. The occupants well received the sensor kits, and we were able to capture high-resolution time-series data. The case study revealed several challenges of in-situ measurements. First, the heating energy carriers and heating system setup that we encountered were quite diverse, and second, interfacing existing metering infrastructure was not always feasible. This lean case study has highlighted that it is possible to measure multiple modalities in buildings with one sensor network, as well as install and collect the sensors with little disturbance to the occupant and minimal damage to the building. If the methodology presented in this paper and the lessons learned from the case study were applied widely to the existing building stock, it has the potential to improve the effectiveness of building retrofit measures by providing a more accurate building energy assessment. Consequently, this work could help to accelerate the transformation of the building stock, which is essential to mitigate anthropogenic climate change.
As seen in the literature, the frequently measured parameters are indoor temperature, outdoor temperature, solar radiation, and heating energy input. These parameters allow for an overall assessment of the heating system and the building envelope. Notably in practice, the envelopes of real buildings are not homogeneous, but rather are an ensemble of different envelopes with varied properties. Some properties are even unsteady such as air change rate and shading. Hence, when it comes to retrofit decisions, identification of the weakest elements of the envelope should be prioritized to support strategic retrofitting, and the approach outlined in this research would support this kind of decision-making. In other words, the novel approach presented here aids in identifying the quality of the different envelope parts, and specifically spot measurements can help to assess the different material properties such as U-value measurements and surface temperature measurements.
Heating energy input is central to any building energy assessment. However, it is challenging to measure the energy input in a generalized and non-intrusive manner with a high temporal resolution, due to many energy carriers and diverse heating system setups. Wide-scale deployments of smart meters are seldom able to alleviate this fact. In Switzerland, the majority of heating systems in single-family buildings are water-based. Recent developments have made ultrasonic clamp-on flowmeters significantly less expensive (<USD 1500). Hence, measuring the heating energy input by measuring the water flow rate from the heating system and the respective supply temperature and return temperature appear to be a promising approach since the space heating demand is measured independently of the primary energy carrier and the system configuration. Clamp-on flow meters were also suggested by Senave (Senave, 2019).
The communication and scheduling with the building owners required a significant amount of time. To better prepare all stakeholders, comprehensive information material could be helpful, e.g., visual representation of the sensor nodes, a written timeline of the sensor deployment, and examples of measured data.
We expect that the cost of measurement-based building assessment reduces due to technical developments in other areas, such as more inexpensive batteries and more inexpensive electronic components and sensors. For the future, we envision a sensor system that is more reliable and requires less effort to operate. We were already able to improve the performance of the WSN by design changes to the gateway based on the learning of this work. Ideally, the sensor system works in conjunction with a wide range of heating energy carriers and heating systems. Further, we envision a higher degree of automation, i.e., automatic fault detection of the sensor network and automatic processing of the sensor data for building performance assessment. This would involve only the very necessary sensors for a minimal amount of time. A basic sensor suite for whole building energy assessment (overall heat loss coefficient, thermal mass) could consist of a heating energy input node (without DHW), several indoor temperature nodes, an ambient temperature node, and a pyranometer. In addition, the primary energy input could be measured in order to determine the heating system efficiency. For the inspection of individual building elements, U-value nodes could be added. Such a sensor kit could be used for building assessment of older buildings in need of a retrofit or for new or retrofitted buildings for quality control assessment. However, even in the future, some modalities might stay challenging to measure, e.g., metabolic energy input from occupants or the energy input from wooden fireplaces.
Finally, in the presented case study, we deployed more sensors than we used in the data analysis. We also deployed sensors for CO2 concentration and reed switches for measuring the windows opening times. In the future, these sensors could be used to infer occupancy, air exchange rates, and air quality. Furthermore, some of the sensors that measure air temperature, also measure relative humidity, which could be used for thermal comfort assessment.
Data Availability Statement
The raw data supporting the conclusions of this article will be made available by the authors, without undue reservation.
Author Contributions
MF, ZN, AS contributed to the conception and design of the study. MF carried out the in-situ measurements. MF, CD, and IH wrote the first draft of the manuscript. All authors contributed to manuscript revision, read, and approved the submitted version.
Funding
This work was financially supported by the Office for Water and Energy of the Canton St. Gallen. This research project is financially supported by the Swiss Innovation Agency Innosuisse and is part of the Swiss Competence Center for Energy Research SCCER FEEB&D.
Conflict of Interest
The authors declare that the research was conducted in the absence of any commercial or financial relationships that could be construed as a potential conflict of interest.
Acknowledgments
We would like to thank Jörg Drechsler of Drechsler Energie-Optimierung for sharing his assessment of the case study buildings. Further, we would like to thank the participants of the case study, who allowed us to place sensors in their homes. Moreover, we are grateful to Krishna Bharathi for the fruitful discussion.
Supplementary Material
The Supplementary Material for this article can be found online at: https://www.frontiersin.org/articles/10.3389/fbuil.2020.609877/full#supplementary-material.
Footnotes
1https://www.bfe.admin.ch/bfe/de/home/versorgung/stromversorgung.html (accessed June 23, 2020)
2https://www.odyssee-mure.eu/publications/efficiency-by-sector/households/heating-energy-consumption-by-energy-sources.html (accessed July 1, 2020)
3https://www.bfs.admin.ch/bfs/de/home/statistiken/bau-wohnungswesen/gebaeude/energiebereich.html (accessed June 24, 2020)
4https://github.com/architecture-building-systems/Wireless-Sensor-Network (accessed June 23, 2020)
5https://www.bfs.admin.ch/bfs/en/home/statistics/construction-housing/buildings/energy-field.html
6https://greenteg.com/template/userfiles/files/gSKIN_U-Value%20KIT_Manual_Version2.4.pdf
References
Alexander, D. K., and Jenkins, H. G. (2015). The validity and reliability of co-heating tests made on highly insulated dwellings. Energy Proc. 78, 1732–1737. doi:10.1016/j.egypro.2015.11.282
Alzetto, F., Farmer, D., Fitton, R., Hughes, T., and Swan, W. (2018a). Comparison of whole house heat loss test methods under controlled conditions in six distinct retrofit scenarios. Ener. Build. 168, 35–41. doi:10.1016/j.enbuild.2018.03.024
Alzetto, F., Pandraud, G., Fitton, R., Heusler, I., and Sinnesbichler, H. (2018b). QUB: a fast dynamic method for in-situ measurement of the whole building heat loss. Energy and Buildings 174, 124–133. doi:10.1016/j.enbuild.2018.06.002
Bacher, P., and Madsen, H. (2010). Experiments and data for building energy performance analysis. Lyngby, Denmark: Technical University of Denmark, DTU Informatics.
Bacher, P., and Madsen, H. (2011). Identifying suitable models for the heat dynamics of buildings. Energy and Buildings 43, 1511–1522.
Baker, P. (2011). U–values and traditional buildings: In situ measurements and their comparisons to calculated values. Available at: https://www.historicenvironment.scot/archives-and-research/publications/publication/?publicationId=16d0f7f7-44c4-4670-a96b-a59400bcdc91 (Accessed September 14, 2020).
Bau- und Wohnungswesen, 2018 (2020). Neuchâtel: Bundesamt für Statistik (BFS) / Bundesamt für Statistik (BFS) / BFS. Available at: https://www.bfs.admin.ch/hub/api/dam/assets/12507412/bibtex.
Bauwens, G., and Roels, S. (2014). Co-heating test: a state-of-the-art. Ener. Build. 82, 163–172. doi:10.1016/j.enbuild.2014.04.039
Butler, D., and Dengel, A. (2013). Review of co-heating test methodologies. NHBC Foundation Available at: https://www.nhbcfoundation.org/publication/review-of-co-heating-test-methodologies/ (Accessed June 15, 2020).
Chambers, J. D., and Oreszczyn, T. (2019). Deconstruct: a scalable method of as-built heat power loss coefficient inference for UK dwellings using smart meter data. Ener. Build. 183, 443–453. doi:10.1016/j.enbuild.2018.11.016
Cozza, S., Chambers, J., Geissler, A., Wesselmann, K., Gambato, C., Branca, G., et al. (2019). GAPxPLORE: energy performance gap in existing, new, and renovated buildings—lerning from large-scale datasets. Swiss Federal Office of Energy SFOE. Available at: https://www.aramis.admin.ch/Grunddaten/?ProjectID=40161 (Accessed October 6, 2020).
de Santiago, J., Rodriguez-Villalón, O., and Sicre, B. (2017). The generation of domestic hot water load profiles in Swiss residential buildings through statistical predictions. Ener. Build. 141, 341–348. doi:10.1016/j.enbuild.2017.02.045
de Wilde, P. (2014). The gap between predicted and measured energy performance of buildings: a framework for investigation. Auto. Const. 41, 40–49. doi:10.1016/j.autcon.2014.02.009
Deb, C., Frei, M., Hofer, J., and Schlueter, A. (2019). Automated load disaggregation for residences with electrical resistance heating. Ener. Build. 182, 61–74. doi:10.1016/j.enbuild.2018.10.011
Dimitriou, V. (2016). Lumped parameter thermal modelling for UK domestic buildings based on measured operational data. Available at: https://dspace.lboro.ac.uk/dspace-jspui/handle/2134/23239 (Accessed March 11, 2017).
Frei, M., Deb, C., Stadler, R., Nagy, Z., and Schlueter, A. (2020). Wireless sensor network for estimating building performance. Auto. Const. 111, 103043. doi:10.1016/j.autcon.2019.103043
Hall, M. (2020). Normierung des GEAK®. Konferenz Kantonaler Energiedirektoren. Available at: https://www.endk.ch/de/ablage/grundhaltung-der-endk/20200402_Normierung_GEAK_EnDK_D.pdf.
International Energy Agency, and Organisation for Economic Co-operation and Development (2013). Transition to sustainable buildings strategies and opportunities to 2050. Paris: OECD/IEA Available at: https://doi.org/10.1787/9789264202955-en (Accessed March 15, 2016).
International Organization for Standardization (2014). ISO 9869-1: 2014 thermal insulation–building elements–in-situ measurement of thermal resistance and thermal transmittance–part 1: heat flow meter method. Available at: https://www.iso.org/standard/59697.html.
Janssens, A (2016). Inventory of full scale test facilities for evaluation of building energy performances. KULeuven Available at: http://hdl.handle.net/1854/LU-8088193 (Accessed September 25, 2019).
Ma, Y., Aerts, D., Reynders, G., Waide, P., and Verbeke, S. (2020). Final report on the technical support to the development of a smart readiness indicator for buildings: final report. LU: Publications Office of the European UnionAvailable at: https://data.europa.eu/doi/10.2833/41100 (Accessed November 12, 2020).
Ma, Z., Cooper, P., Daly, D., and Ledo, L. (2012). Existing building retrofits: methodology and state-of-the-art. Energy and Buildings 55, 889–902. doi:10.1016/j.enbuild.2012.08.018
Philipona, R., Kräuchi, A., Romanens, G., Levrat, G., Ruppert, P., Brocard, E., et al. (2013). Solar and thermal radiation errors on upper-air radiosonde temperature measurements. J. Atmos. Ocean. Tech. 30, 2382–2393. doi:10.1175/JTECH-D-13-00047.1
Prognos, A. G. (2012). “Die Energieperspektiven für die Schweiz bis 2050,”in Energienachfrage und Elektrizitätsangebot in der Schweiz 2000. New York, NY: Prognos.
Reiman, W., Bühlmann, E., Lehmann, M., Bade, S., Krämer, S., Ott, W., et al. (2016). Erfolgskontrolle Gebäudeenergiestandards 2014-2015. Bundesamt für Energie BFE. Available at: https://www.newsd.admin.ch/newsd/message/attachments/43534.pdf (Accessed April 12, 2017).
Senave, M. (2019). characterization of the heat loss coefficient of residential buildings based on in-use monitoring data. Available at: https://lirias.kuleuven.be/retrieve/555433 (Accessed June 17, 2020).
Senave, M., Reynders, G., Bacher, P., Roels, S., Verbeke, S., and Saelens, D. (2019a). Towards the characterization of the heat loss coefficient via on-board monitoring: physical interpretation of ARX model coefficients. Ener. Build. 195, 180–194. doi:10.1016/j.enbuild.2019.05.001
Senave, M., Reynders, G., Sodagar, B., Verbeke, S., and Saelens, D. (2019b). Mapping the pitfalls in the characterisation of the heat loss coefficient from on-board monitoring data using ARX models. Ener. Build. 197, 214–228. doi:10.1016/j.enbuild.2019.05.047
Senave, M., Roels, S., Verbeke, S., Lambie, E., and Saelens, D. (2019c). sensitivity of characterizing the heat loss coefficient through on-board monitoring: a case study analysis. Energies 12, 3322. doi:10.3390/en12173322
Senave, M., Roels, S., Reynders, G., Verbeke, S., and Saelens, D. (2020a). Assessment of data analysis methods to identify the heat loss coefficient from on-board monitoring data. Energy. Build. 209, 109706. doi:10.1016/j.enbuild.2019.109706
Senave, M., Roels, S., Verbeke, S., and Saelens, D. (2020b). Analysis of the influence of the definition of the interior dwelling temperature on the characterization of the heat loss coefficient via on-board monitoring. Ener. Build. 215, 109860. doi:10.1016/j.enbuild.2020.109860
Subbarao, K. (1988). PSTAR-primary and secondary term analysis and renormalization. Golden, CO: Solar Energy Research Institute Report.
Sunikka-Blank, M., and Galvin, R. (2012). Introducing the prebound effect: the gap between performance and actual energy consumption. Build. Res. Inform. 40, 260–273. doi:10.1080/09613218.2012.690952
Swiss Federal Council (2020). Stromversorgungsverordnung (StromVV) vom 14. März 2008 (Stand am 1. Januar 2020). Available at: https://www.admin.ch/opc/de/classified-compilation/20071266/index.html (Accessed June 24, 2020).
Thébault, S., and Bouchié, R. (2018). Refinement of the ISABELE method regarding uncertainty quantification and thermal dynamics modelling. Ener. Build. 178, 182–205. doi:10.1016/j.enbuild.2018.08.047
Tounquet, F., and Alaton, C. (2020). Benchmarking smart metering deployment in the EU-28 : Final Report. European Comission, Directorate for Energy Available at: http://op.europa.eu/en/publication-detail/-/publication/b397ef73-698f-11ea-b735-01aa75ed71a1/language-en (Accessed June 23, 2020).
United Nations Environment Programme, and International Energy Agency (2018). 2018 Global Status Report - Towards a zero-emission, efficient and resilient buildings and construction sector. Available at: https://wedocs.unep.org/bitstream/handle/20.500.11822/27140/Global_Status_2018.pdf.
Keywords: wireless sensor networks, building performance assessment, in-situ measurement challenges, measured building data, evidence-based building assessment, modular sensors
Citation: Frei M, Deb C, Nagy Z, Hischier I and Schlueter A (2021) Building Energy Performance Assessment Using an Easily Deployable Sensor Kit: Process, Risks, and Lessons Learned. Front. Built Environ. 6:609877. doi: 10.3389/fbuil.2020.609877
Received: 24 September 2020; Accepted: 29 December 2020;
Published: 10 February 2021.
Edited by:
Azni Zain Ahmed, Universiti Teknologi Mara, MalaysiaReviewed by:
Anna Romanska-Zapala, Cracow University of Technology, PolandGiulia Ulpiani, The University of Sydney, Australia
Copyright © 2021 Frei, Deb, Nagy, Hischier and Schlueter. This is an open-access article distributed under the terms of the Creative Commons Attribution License (CC BY). The use, distribution or reproduction in other forums is permitted, provided the original author(s) and the copyright owner(s) are credited and that the original publication in this journal is cited, in accordance with accepted academic practice. No use, distribution or reproduction is permitted which does not comply with these terms.
*Correspondence: Mario Frei, bWFyaW8uZnJlaUBhcmNoLmV0aHouY2g=
 Mario Frei
 Chirag Deb
 Zoltan Nagy
 Illias Hischier
 Arno Schlueter