- Department of Architecture and Building Engineering, Graduate School of Urban Environmental Sciences, Tokyo Metropolitan University, Tokyo, Japan
Indoor thermal environment is important for maintaining comfort and health. In a tropical region, it becomes more critical when the air-conditioning system consumes excessive energy for a whole year. This study aims to clarify the impact of thermal environment on human comfort and building-related symptoms in air-conditioned offices. A field study was conducted in office spaces in Singapore and Thailand from 2017 to 2019 by installing data loggers to measure thermal variables together with a questionnaire survey. As a result, the psychometric charts of ASHRAE 55 show that most of the measured thermal environments were fitted to the 1.0 clo comfort zone, which was not recommended for people in this region. Overcooling determined the cause of high discomfort when people felt cold and preferred a warmer temperature. Based on Griffith’s method, average comfort temperatures were 24.8°C (Singapore) and 24.0°C (Thailand). The probit analysis illustrated that the comfort temperature range for a dissatisfaction of 20% was 23.6–26.4°C (Singapore) and 22.9–25.6°C (Thailand). These comfort temperature ranges which were higher than the measured values reflected the clothing adaptation and the personal complaints. Symptoms were reported in the coldest temperature group (21–22°C), with the highest odds ratio (OR) of symptom occurrence. The thermal sensation vote (TSV) defined that the higher rate of symptoms belonged to the colder-than-neutral side, whereas the thermal comfort vote (TCV) could not well predict the symptom occurrence. The intention of enhancing comfort and promoting better health conditions in the offices of these regions was discussed, while considering warmer indoor temperatures.
Introduction
In tropical regions, the indoor thermal environment of an air-conditioned office building is maintained through a cooling load throughout the year (de Dear et al., 1991). The operation and maintenance of such air-conditioning systems in offices account for more than half of the total electricity distribution (Kofoworola and Gheewala, 2009); the demand for air conditioning in office buildings is greater than that of all other applications of air conditioners in buildings (Yamtraipat et al., 2005). Owing to economic developments, the demand for office space unitization has increased (Coldwell Banker Richard Ellis [CBRE], 2019). Consequently, there has been an increase in the use of air-conditioning loads to provide cool indoor environments for workers within office spaces. However, this increasing use of air conditioning has forced governments of different countries to address the emerging future crises of cooling loads. This has led to the implementation of energy-saving measures (Coldwell Banker Richard Ellis [CBRE], 2019; International Energy Agency [IEA], 2019). For instance, the concept of reducing energy consumption by maintaining an optimal indoor temperature, which is also known as the set-point temperature policy, was implemented in several countries worldwide (Tan, 2008). In the temperate climate zone, Japan launched a campaign for the reduction of energy consumption in buildings; this campaign was named “Coolbiz,” and it implemented setting higher temperatures of up to 28°C during the summer. Thus, people adjusted their lifestyles by wearing lighter clothes, instead of suits and ties; consequently, this dress code became a common office practice (Nakashima, 2013). Locally, Singapore standards declare that the minimum indoor room temperature should be maintained between 24 and 26°C (S.P.R.I.N.G, 2009), whereas the Thai standard (The Engineering Institute of Thailand Under H M The King’s Patronage [EIT], 2016) follows the suggestions recommended by the American Society of Heating, Refrigerating, and Air-Conditioning (ASHRAE) standard (American Society of Heating Refrigerating Air-Conditioning Engineers [ASHRAE], 2017). Furthermore, the Thai government promotes setting a temperature of up to 25°C during the summer with the aim of reducing energy consumption (Energy Policy and Planning Office [EPPO], 2018). However, indoor conditions are not maintained based on the preferences of people; instead, these conditions are set based on the design and operation of overload cooling (Sekhar, 2016). The actual temperature is often lower than the optimum standard, which may cause occupants to complain and adjust to uncomfortable conditions (mainly through changes in their attire) (Sikram et al., 2019). For several decades, adaptive thermal comfort studies have been conducted in the field and also by using climate chambers. These experiments have revealed that people in different climate zones have different thermal preferences (Fanger, 1970; de Dear and Brager, 1998; de Dear, 2004). Based on a study of the adaptive thermal comfort in Southeast Asian countries, the comfort temperatures for workers in air-conditioned offices was up to 25.6°C in Malaysia, 26.3°C in Indonesia, and 26.4°C in Singapore, when the average operative temperatures of these countries were 24.4, 25.9, and 23.2°C, respectively (Damiati et al., 2016). Although thermal performance is maintained within a standard range, the comfort temperature remains variable and is also higher than the actual operative temperature. However, indoor thermal environment can affect the comfort, health, and productivity of a person (World Health Organization [WHO], 1990; Ajimotokan and Oloyede, 2009). The health of people working inside air-conditioned offices depends on biological, chemical, and thermal variables (Turiel, 1998). A study conducted in the tropical climate zones of China indicated that extended exposure to air-conditioned environments may cause discomfort to the human body, although a few people were more comfortable in such cool air-conditioned environments (Cao et al., 2012). Furthermore, the probability of sick building syndrome can be higher if thermal variables, such as ambient temperature, relative humidity (RH), and ventilation rate, are not controlled appropriately (Amin et al., 2015). Jaakkola et al. (1989) indicated that room temperature is a significant factor influencing sick building syndrome, and the sensation of dryness and well-being are correlated when the room temperature exceeds 22°C. A study in the United States reported that a majority of the office buildings operate at low temperatures during the summer and that a temperature exceeding 23°C is associated with a decrease in most symptoms, including stuffy or runny noses, sore or dry throats, and dry, itchy, or irritated eyes and skin (Mendell and Mirer, 2009). In Singapore, Foo and Phoon (1987) reported that approximately 60% of the occupants in air-conditioned offices were exposed to room temperatures lower than 24°C and that more than 80% of these occupants would be more comfortable when the air temperature was 27°C. Chen and Chang (2012) observed thermal environments through subjective feedback from 18 offices. They found that occupants experienced cool indoor environments at 23–26°C with an RH of 50–70% and that the average ventilation rate was three times higher than the local standard (10 L/s-person) (S.P.R.I.N.G, 2009). A majority of the occupants (70.9%) reported feeling a cold sensation; the occupants had to put on additional clothes to continue working in the office. Due to the psychological factors introduced, approximately 33% of the occupants reported feeling fatigue. Thus, it is evident that indoor thermal environment affects the comfort and health of occupants. Therefore, the data obtained via recent studies need to be calibrated more accurately, owing to the previously limited number of field studies in hot-humid climates. To address these issues, this study aims to (1) assess the on-site thermal environment and estimate the range of comfort temperature by comparing it with previous studies and (2) observe the relationship between human comfort and building-related symptoms with respect to thermal environments. It would also be advantageous to consider indoor environments with regard to sustainability and the well-being of occupants to realize a promising future.
Outline of Methodologies
Climate Description
According to the Köppen climate classification (Kottek et al., 2006), Singapore and Thailand are identified as hot and humid regions. Singapore is located in the AF zone (regions with tropical rainforest climate are typically designated AF by the Köppen climate classification) at 1° 17′ 24.9720″ N latitude and 103° 51′ 7.0524″ E longitude. The average outdoor temperature for 2017–2019 was between 26 and 32°C, with 62–91% RH. Similarly, Bangkok, in Thailand, is located in a hot and humid climate zone designated as AW (typically savanna) at 13° 02′ 19.93″ N latitude and 101° 29′ 24.37″ E longitude. The average outdoor temperature ranges from 25 to 34°C, with 50–93% RH. The climates of both these countries have similar characteristics of temperature and humidity throughout the year (Weather Underground, 2019a,b).
Field Study of the Indoor Environment
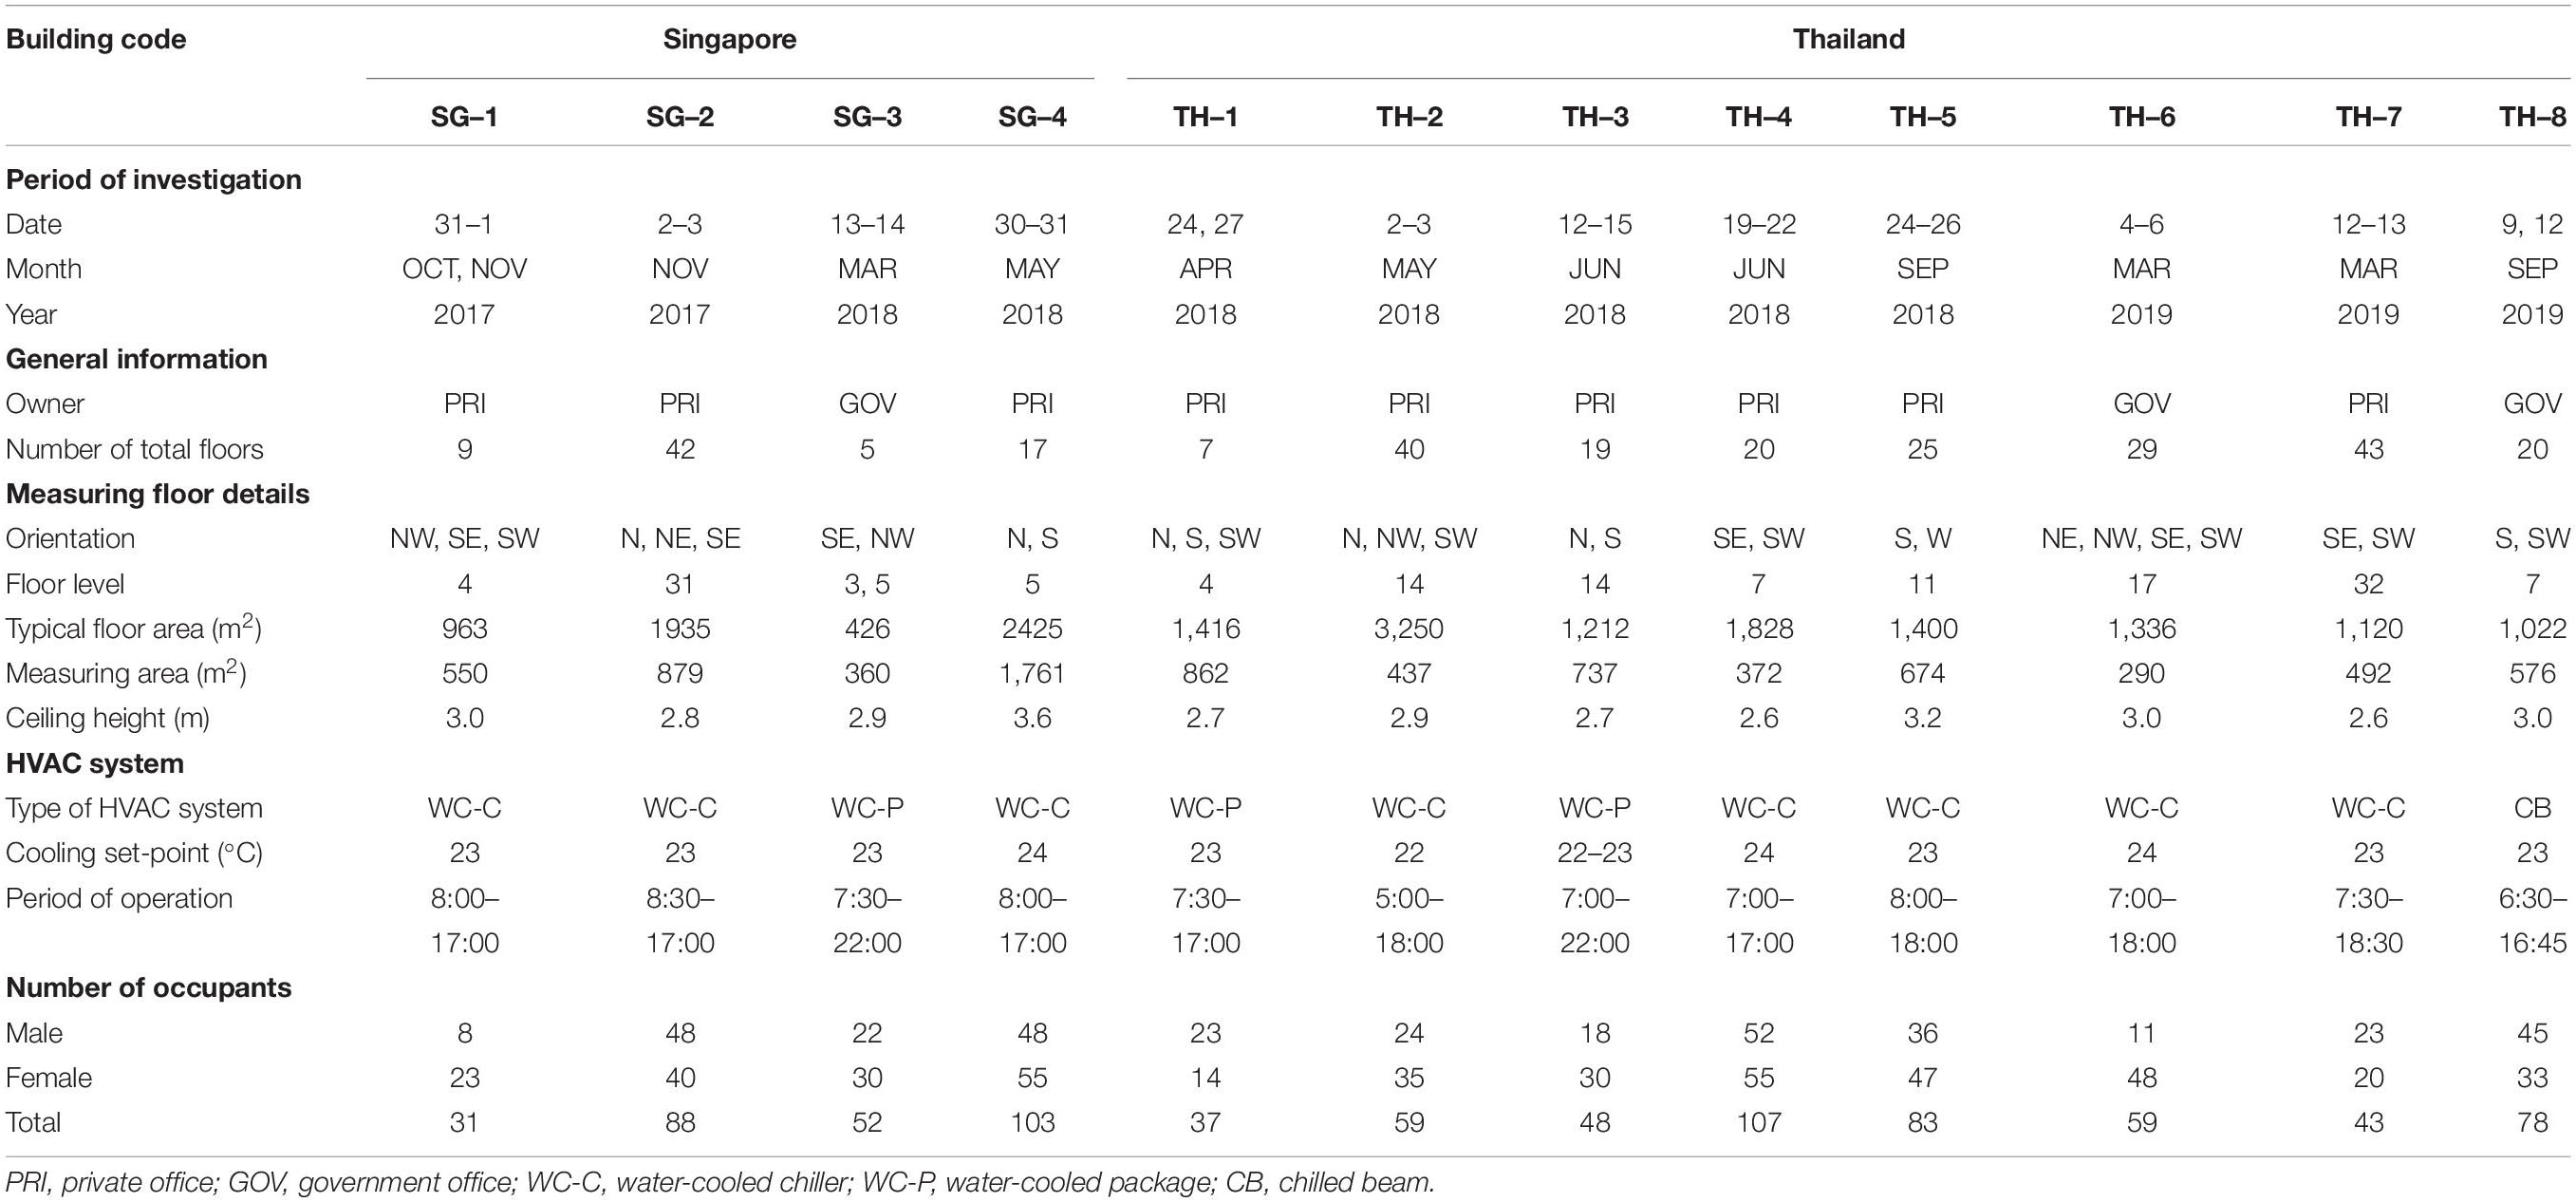
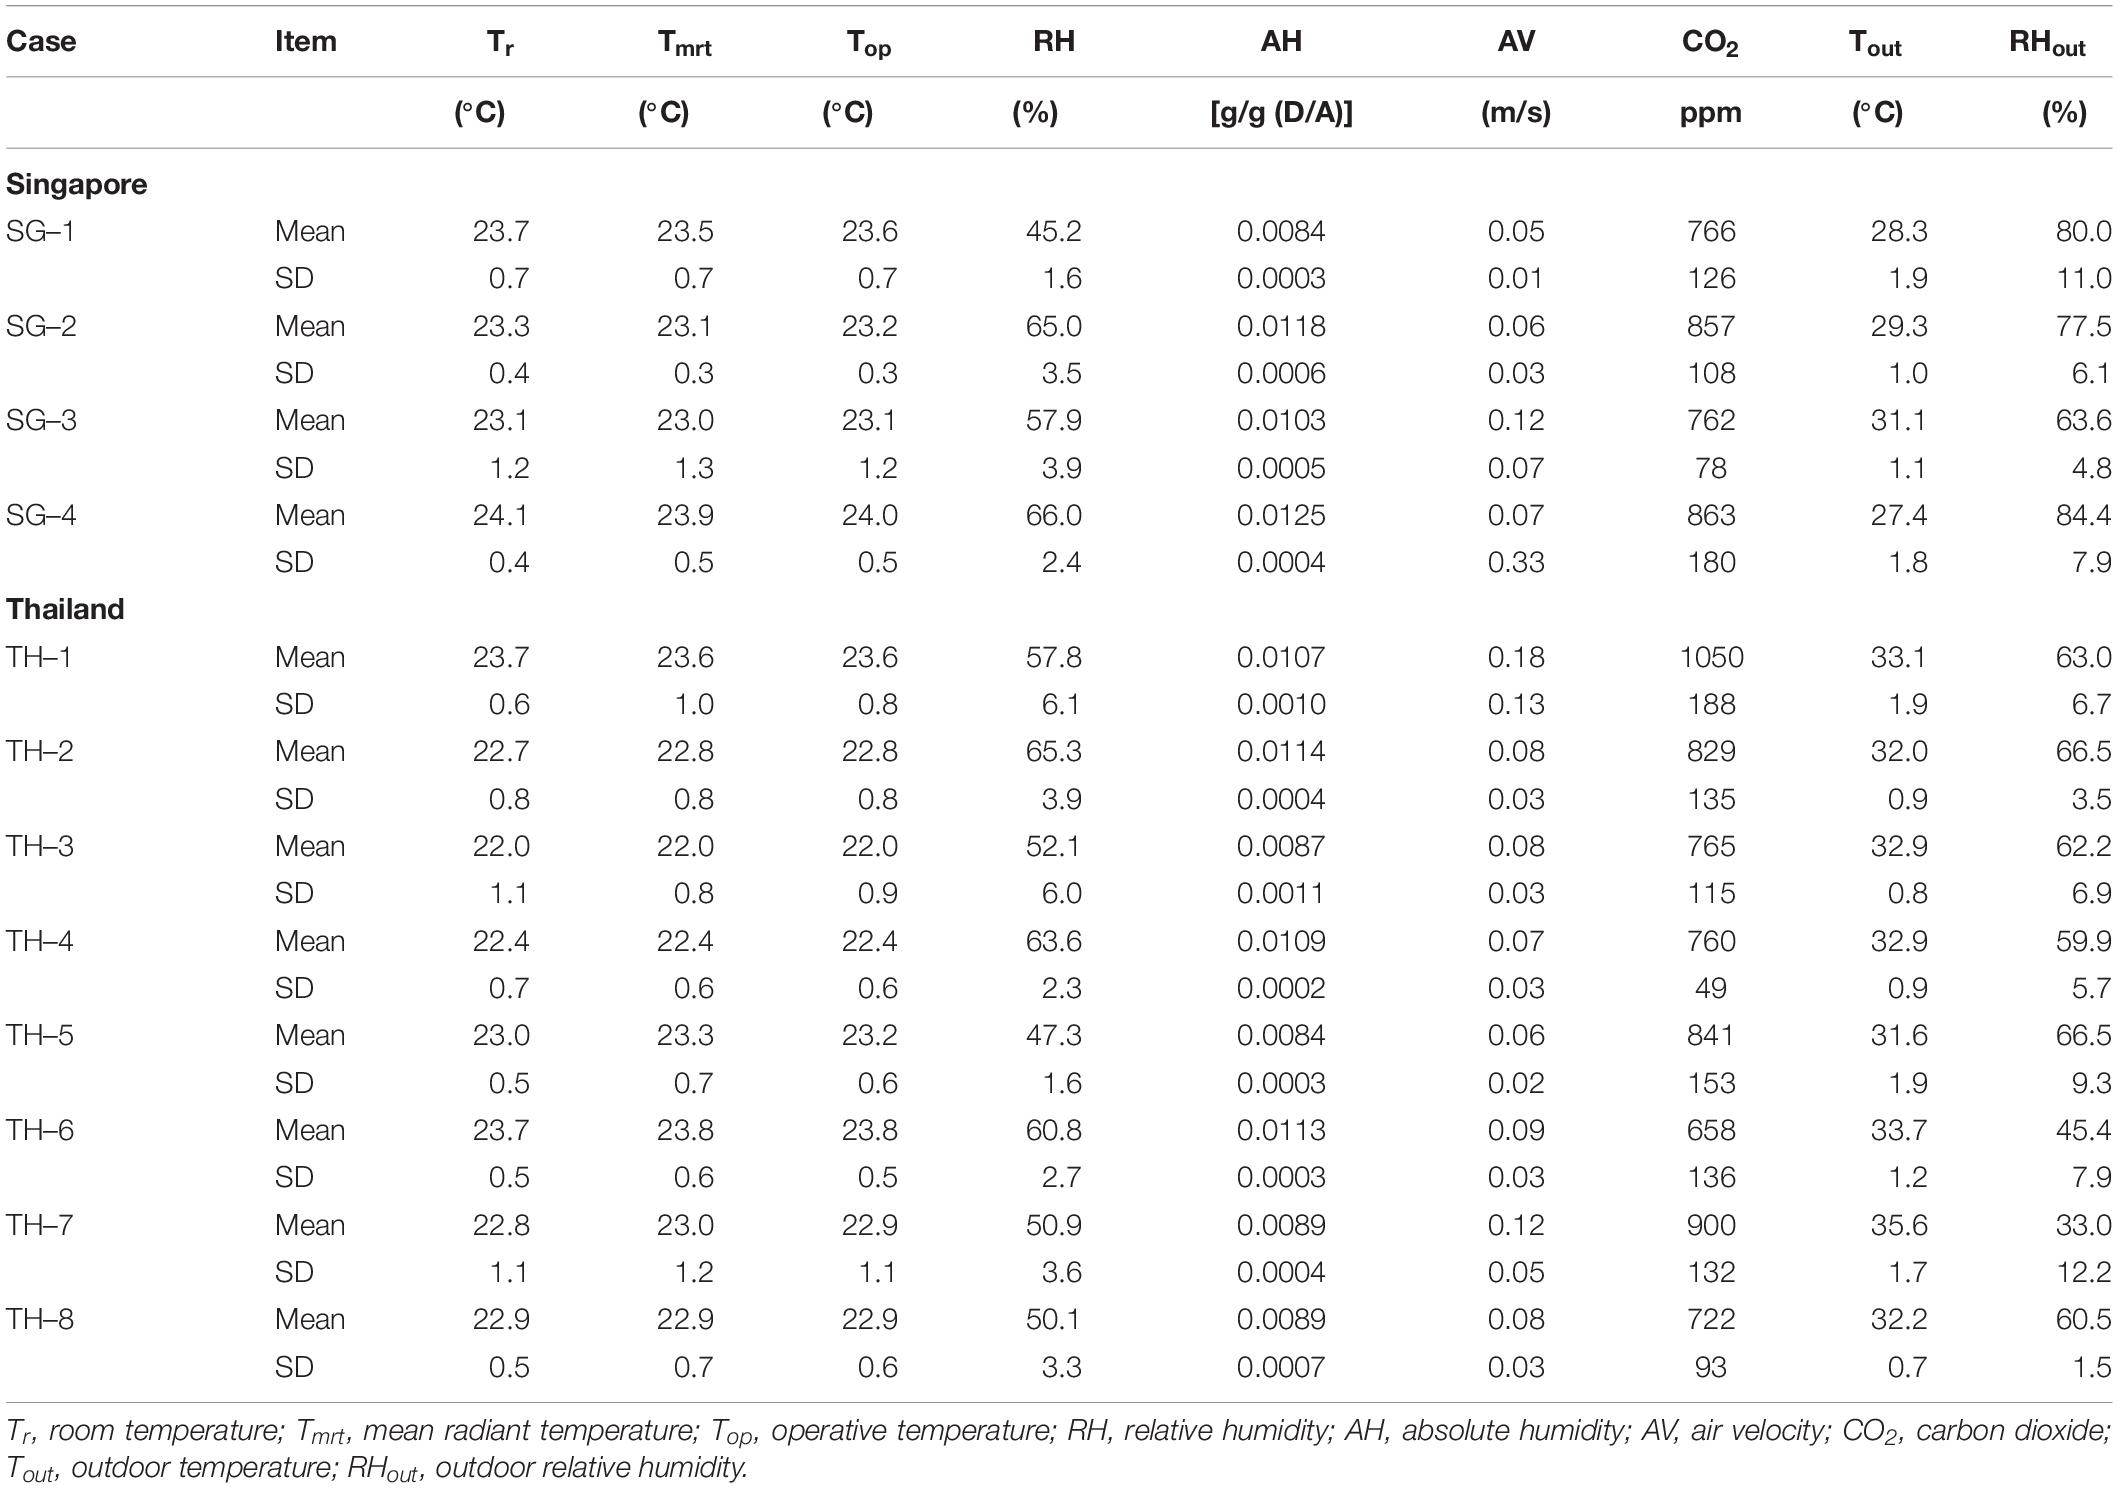
Information regarding the case study is described in Table 1. During the period of 2017–2019, field surveys were conducted in four offices in Singapore and eight offices in the metropolitan city of Bangkok, Thailand. All the offices were identified as large-scale buildings belonging to both government sectors and private companies for computer-based working activities. Air-conditioning systems could be equipped with individual units (water-cooled package units) or central units (water-cooled chiller and chilled beam) to supply cooled air to all the office floors. The measurement data were only collected in open-planned spaces, whereas cellular and executive rooms were excluded. The offices were monitored during the survey to collect indoor environmental metrics, as shown in Table 2. Data logger measuring devices were installed at a height of approximately 1.1 m from the floor and attached to working partitions near occupants seated at the perimeter (near windows) and interior zones (Chen and Chang, 2012; Damiati et al., 2016; Mustapa et al., 2016). We used TR-74Uvi sensors to measure air temperature and RH at intervals of 10 min. RTR-52A 7″ Globes were set to calculate the globe temperature at intervals of 10 min. Air velocity was measured using an anemometer at each location, at intervals of 60 s. The mean radiant temperature (MRT) was estimated using the equation provided by ISO 7726 (International Organization for Standardization [ISO], 1998) for a standard globe diameter of 0.15 m with a globe emissivity of 0.95: MRT = [(Tg + 273)4 + 2.5 × 10⁸ × Va0.6 (Tg − Ta)]1/4− 273, where Tg is the globe temperature, Va is the wind velocity, and Ta is the air temperature. The operative temperature was estimated using the equation provided by ISO 7730: to = ta + (1 − A)(tr − ta), where to is the operative temperature, te is the air temperature, and A is the coefficient of air velocity (A = 0.5 when air velocity is ≤0.2 m/s) (International Organization for Standardization [ISO], 1994).
Questionnaires
A questionnaire sheet was provided to the occupants of the offices in order to evaluate the subjective perception of thermal environments; this questionnaire was derived from ASHRAE 55 (American Society of Heating Refrigerating Air-Conditioning Engineers [ASHRAE], 2017). It involved three questions: a seven-point scale of thermal sensation vote (TSV): cold (−3), slightly cold (−2), cool (−1), neutral (0), warm (1), slightly hot (2), and hot (3); five-point scale of thermal comfort vote (TCV): uncomfortable (−2), slightly uncomfortable (−1), neutral (0), slightly comfortable (1), and comfortable (2); and five-point scale of preference (TPV): colder (−2), slightly colder (−1), no change (0), slightly warmer (1), and warmer (2). We interviewed occupants twice per day, at 11:00 and 15:00, during the acquisition of thermal variables. This questionnaire was not to be answered when occupants were not at their assigned seats. Occupants were questioned about their attire, the upper (shirts, t-shirt, cardigan, sweater, etc.), lower parts (trousers, pants, skirts, etc.), socks, and shoes, to evaluate their personal characteristics. The equation for the clothing rate is derived from ISO 9920 (International Organization for Standardization [ISO], 2007): Icl = 0.161 + 0.835 × ΣIclu, where Iclu is the effective thermal insulation, according to the table of the insulation values of typical clothing ensembles. The last part of the questionnaire comprised a multiple-choice question inquiring about the building-related symptoms experienced by occupants throughout the day due to the thermal environment. The questionnaire was in English for the occupants in Singapore, and it was translated into Thai for those in Thailand. In total, there were 274 subjects with 1,109 votes (126 males and 148 females) in Singapore and 514 subjects with 2,197 votes (232 males and 282 females) in Thailand. The number of females in both countries was slightly higher than that of males.
Results and Discussion
Thermal Environmental Performance
The results obtained from the field surveys are categorized in Table 3, which indicates the mean values and standard deviations of the thermal environmental indices. In Singapore, the average room temperature (Tr) ranged between 23.1 and 24.1°C. The mean room temperature of three offices in Singapore was lower than 24°C which was the minimum recommended value for air-conditioned office spaces (S.P.R.I.N.G, 2009). Office SG–3 featured the lowest temperature of 21°C, whereas Office SG–4 featured the highest value of 25.1°C. The fluctuation in the room temperature during working hours was from 1.2–3.7 K; the most stable temperature range was observed in Office SG–2. The average RH was 45.2–66.0%; the lowest RH was observed in Office SG–1, and the highest RH was observed in Office SG–4. The maximum RH reached 71.8% in Office S–2, and the minimum RH dropped to 42.3% in Office SG–1. The average RH in two out of five offices (Office S–2 and S–4) exceeded 60%. In Thailand, the average Tr was 22.0–23.7°C which was lower than the minimum suggested value by the local standard at 24°C (The Engineering Institute of Thailand Under H M The King’s Patronage [EIT], 2016). The lowest value was observed in Office TH–3, whereas the highest value was observed in Offices TH–1 and TH–6. The widest range was obtained in Office TH–3, varying between 20.3 and 24.7°C (ΔT = 4.4 K), and the narrowest range was observed in Office TH–8, ranging from 21.8 to 24.1°C (ΔT = 2.3 K). The average RH was 47.3–65.3%; the highest average RH was observed in Office TH–2, and the lowest average RH was observed in Office TH–5. The most stable RH of Δ6.4% was observed in Office TH–5, whereas the most unstable RH of Δ26.4% was observed in Office TH–3. The average air velocity was highly stable at 0.10–0.20 m/s, which is typical for air-conditioned buildings. In most cases, the operation of the fresh air ventilation system was considerably normal, compared with the average level of CO2 concentrations, which was limited to 1000 ppm (American Society of Heating, Refrigerating, and Air-Conditioning Engineers [ASHRAE], 2019). This implies that the mechanical ventilation system of most of the studied offices operated under typical conditions and provided sufficient volumes of fresh air. The average outdoor temperatures in Singapore were 28.3–31.1°C, with 63.6–84.4% RH, whereas those in Thailand were 31.1–35.6°C, with 33.0–66.5% RH. The difference between indoor and outdoor conditions was 3.3–8.0°C with 5.7–34.8% RH in Singapore and 8.6–12.8°C with 3.7–19.2% RH in Thailand. The cases in Thailand were expected to be more severe when the difference between indoor and outdoor temperatures was higher than that in Singapore, due to the lower indoor temperatures. Considering the temperature index, air temperature, globe temperature, MRT, and operative temperature, the regression equations and the correlation among these measured temperature indices of the case studies are listed in Table 4. All the cases exhibited nearly identical trends. Variations in the trend lines of these indices occur when the insulation envelope is insufficient; this can be used to confirm if the entire building is well insulated. When the glass window was inadequate in restricting heat from the outside, there was only a weak correlation between the room and globe temperatures (Damiati et al., 2016). In this study, the operative temperature is primarily used to define thermal comfort, which is then compared with subjective votes obtained via the questionnaire. The psychometric charts based on the ASHRAE standard (American Society of Heating Refrigerating Air-Conditioning Engineers [ASHRAE], 2017) are shown in Figure 1. The recommended comfort zone for people in tropical regions is 0.5 clo, which is suitable for light clothes rather than thick suits and ties; the latter are more suitable for the comfort zone of 1.0 clo. Therefore, the thermal environments of the three Singapore offices—Offices SG–1, SG–2, and SG–3—correspond to the 1.0 clo comfort zone, which is higher than the 0.5 clo comfort zone. Office SG–2 yielded the lowest rate of 12% when fitted to the appropriate zone; however, the thermal environment in Office SG–3 appeared to be fitted to the 0.5 clo zone, with the highest rate of 39%. However, there was only one case in Singapore (Office SG–4), where most of the values were beyond both comfort zones; this was attributed to the extreme absolute humidity, which exceeded 0.012 kg/kg (D/A). Similar to the cases in Singapore, most of the thermal environments in the Thailand offices corresponded to the 1.0 clo comfort zone. They fitted to the 0.5 clo comfort zone at 13% and to the 1.0 clo zone at 85%; at 2%, they were beyond both comfort zones due to excessive humidity. Among the eight cases, Office TH–6 yielded the most suitable thermal condition with a high operative temperature and optimum absolute humidity of 44% in the 0.5 clo zone and 54% in the 1.0 clo zone. Furthermore, Office TH–4 had the coldest thermal condition; 98% of the thermal values were in the 1.0 clo zone, and 2% of these values were in the 0.5 clo zone. The thermal environments in the offices in Thailand shifted out of the recommended zone more than those in Singapore with a cooler temperature and lower absolute humidity. In five offices, the thermal environments exceeded 80% in the 1.0 clo zone.
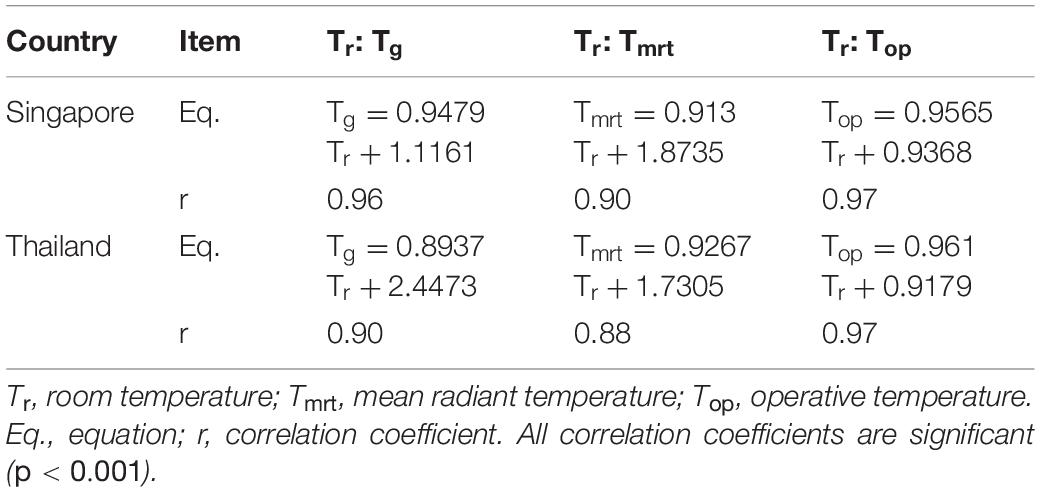
Table 4. Regression equations and correlation coefficients of room temperature and other temperature variables.
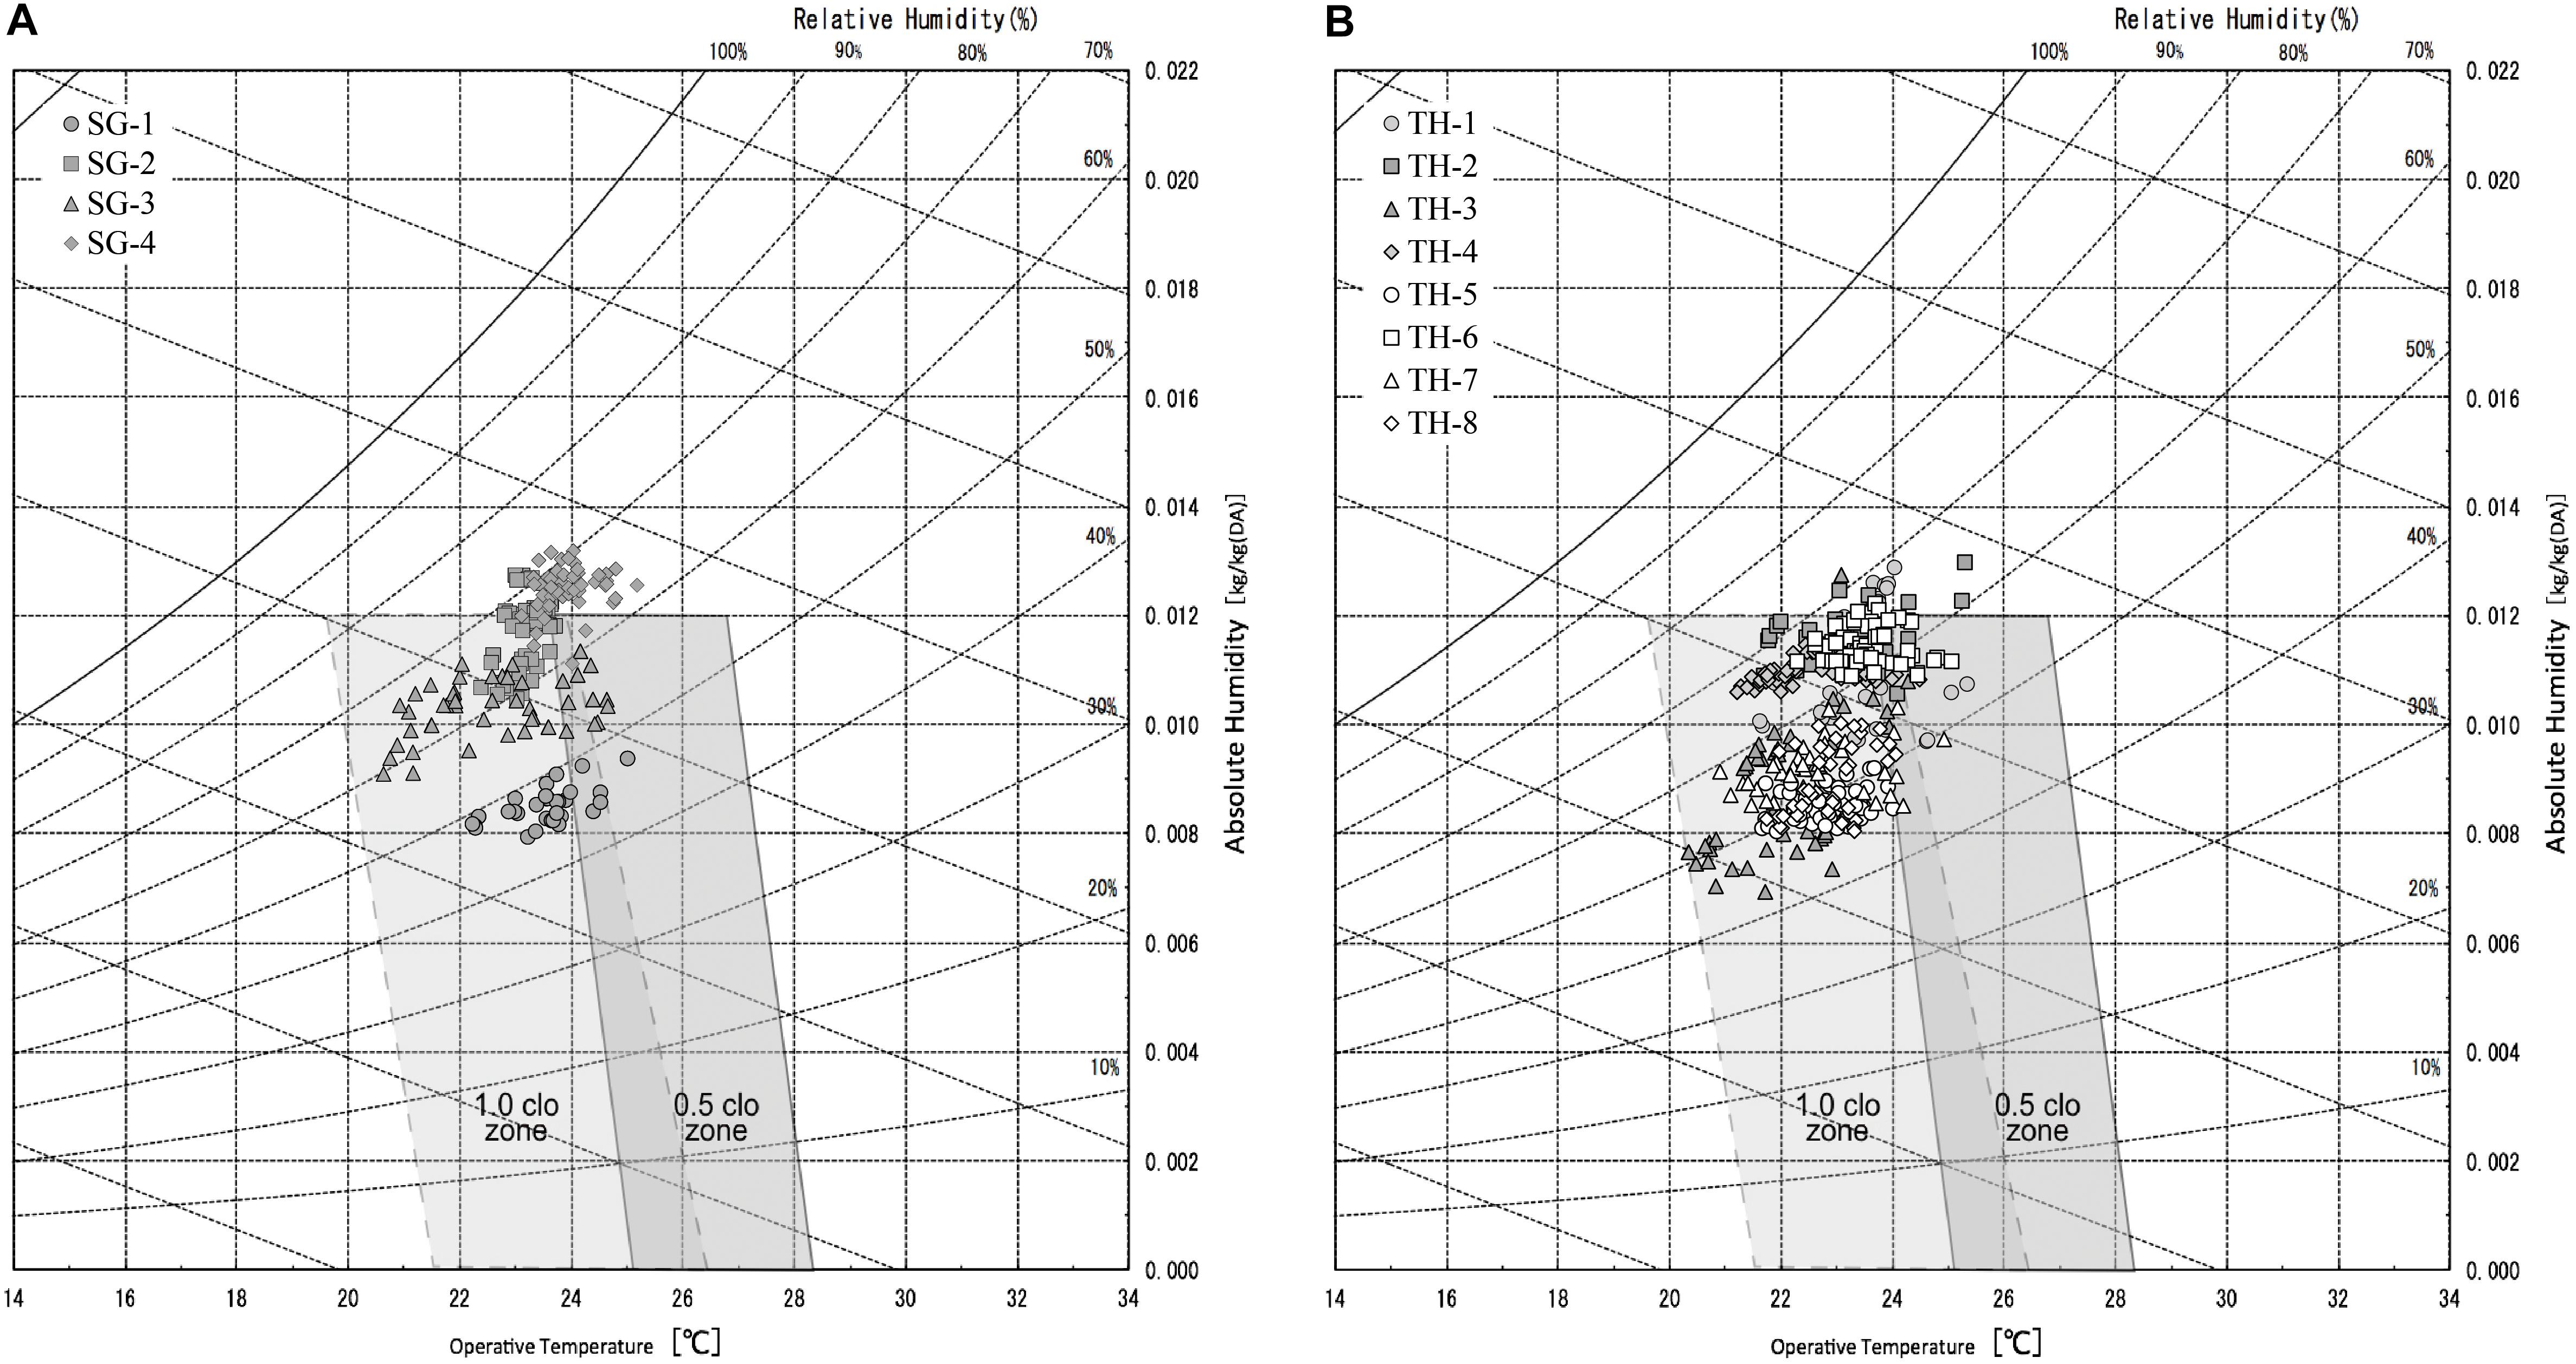
Figure 1. Indoor thermal environments of the case studies on a psychometric chart of the ASHRAE 55 standard: (A) Singapore and (B) Thailand.
Predicted Mean Vote (PMV)
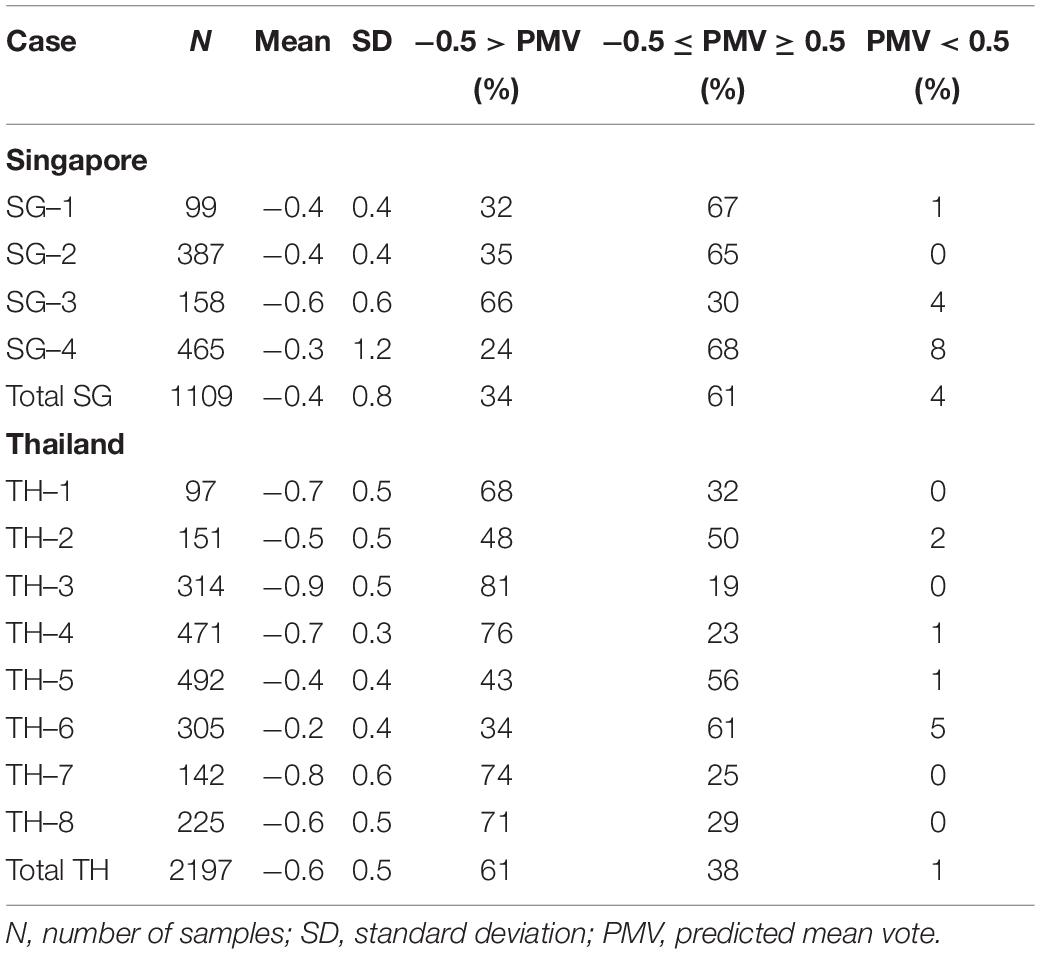
The predicted mean vote (PMV) is a well-known benchmark for evaluating thermal comfort in an office building. We used the PMV to estimate the amount of thermal environments, and the characteristics of the participants in our study could be fitted to a particular climate zone. PMV uses the data of (1) thermal variables measured during working hours, such as temperature, RH, and wind velocity, and (2) the occupants’ information, such as metabolic rates and clothing insulation, obtained from the questionnaire. A metabolic rate of 1.1 was used, which was satisfactory according to a typical rate for occupants of an office provided by ASHRAE 55 (American Society of Heating Refrigerating Air-Conditioning Engineers [ASHRAE], 2017). The clothing insulation of the workers in Singapore ranged from 0.26 to 1.69 clo, with an average of 0.60 clo, whereas that of the workers in Thailand ranged from 0.26 to 1.45 clo, with an average of 0.61 clo. The recommended PMV range was from −0.5 to + 0.5. Table 5 presents the results of PMV, in accordance with the ASHRAE standard. The compliance rate of the cases in Singapore was 30–68%, and that for the cases in Thailand was 19–56%, which is lower than that of Singapore. The values of all the cases in both countries were under 80% of the recommended zone, mainly due to the low operative temperature.
Subjective Votes
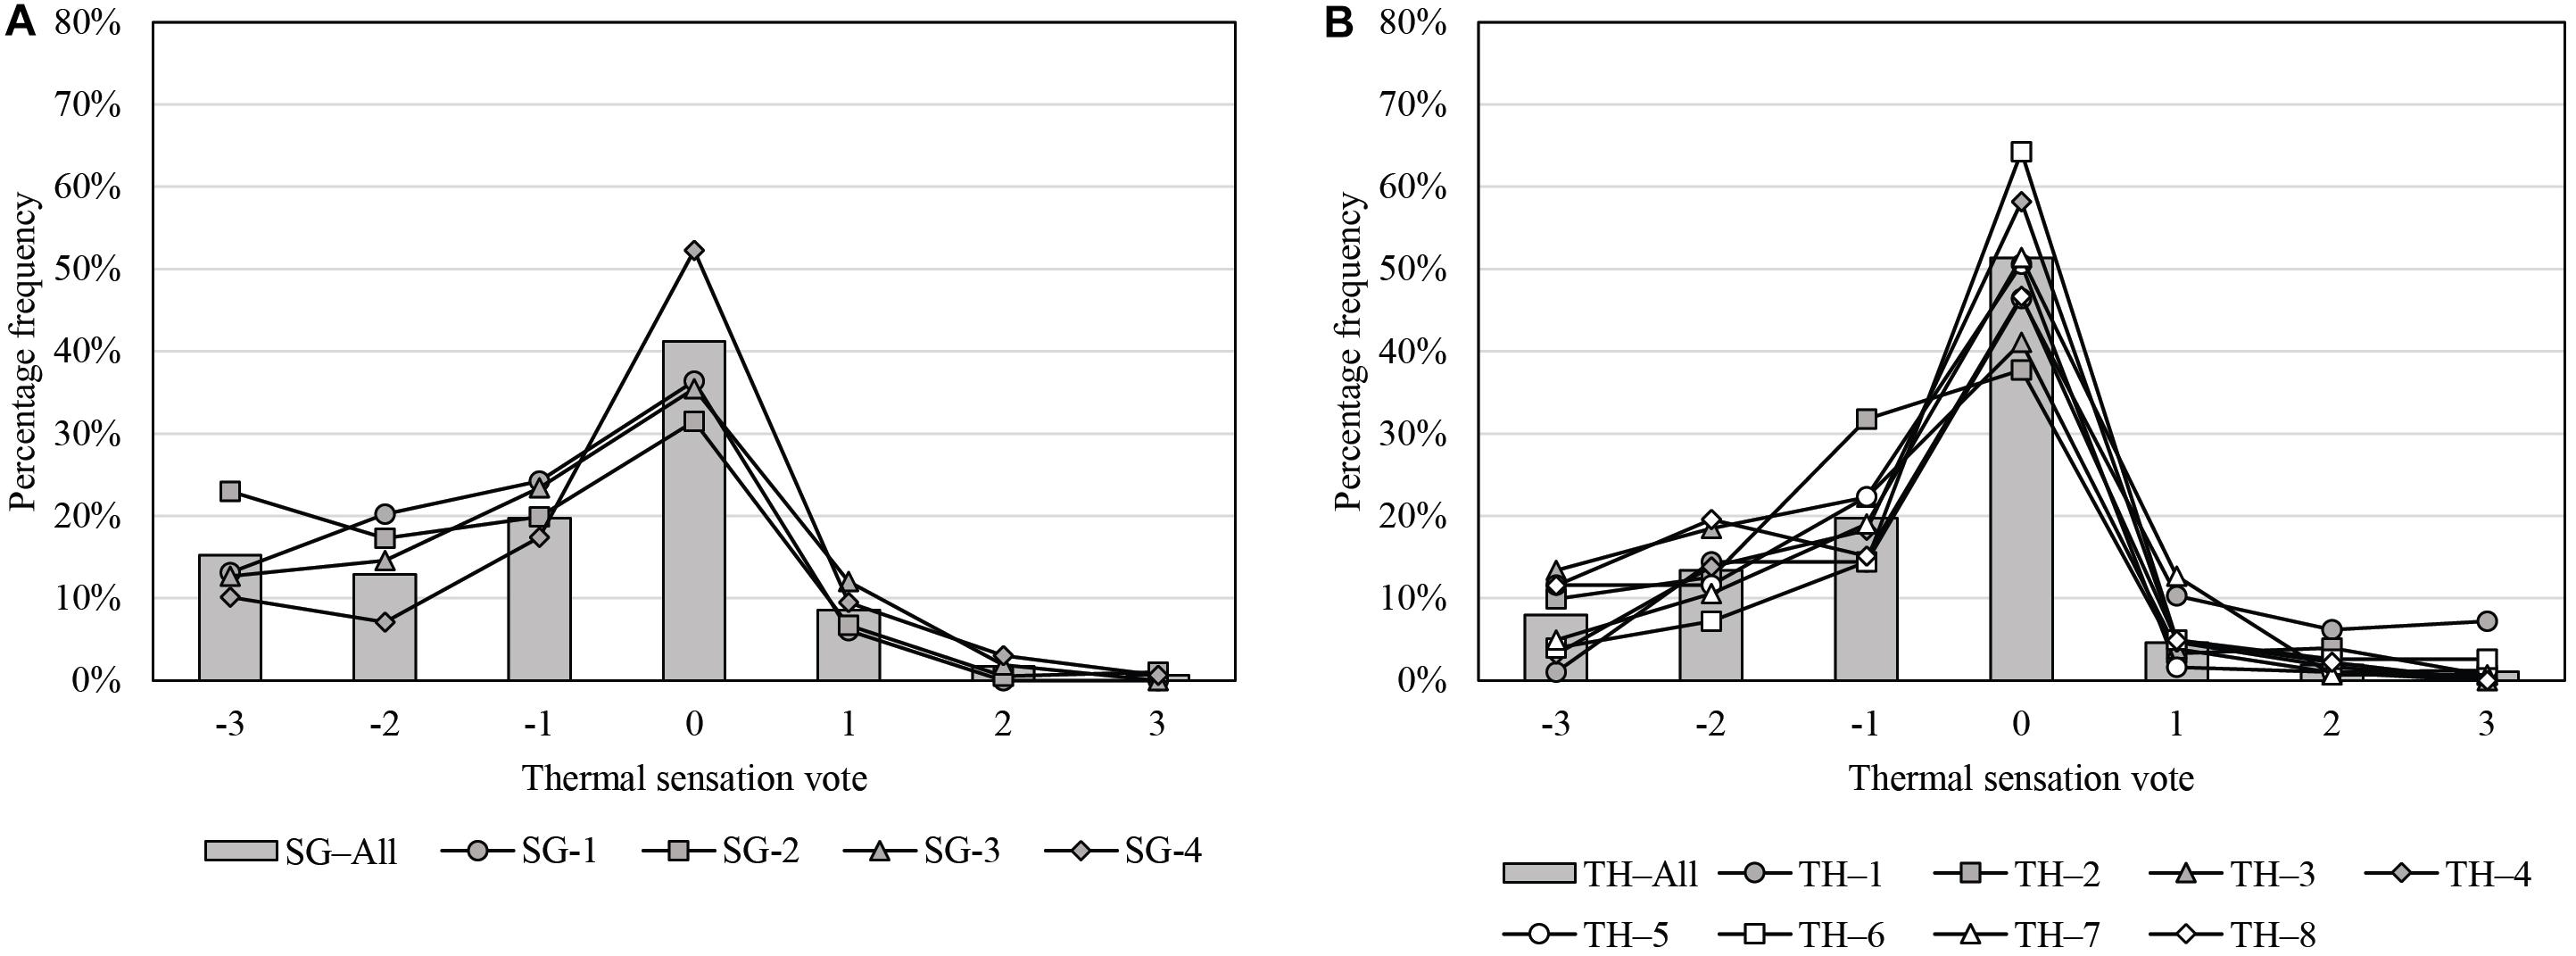
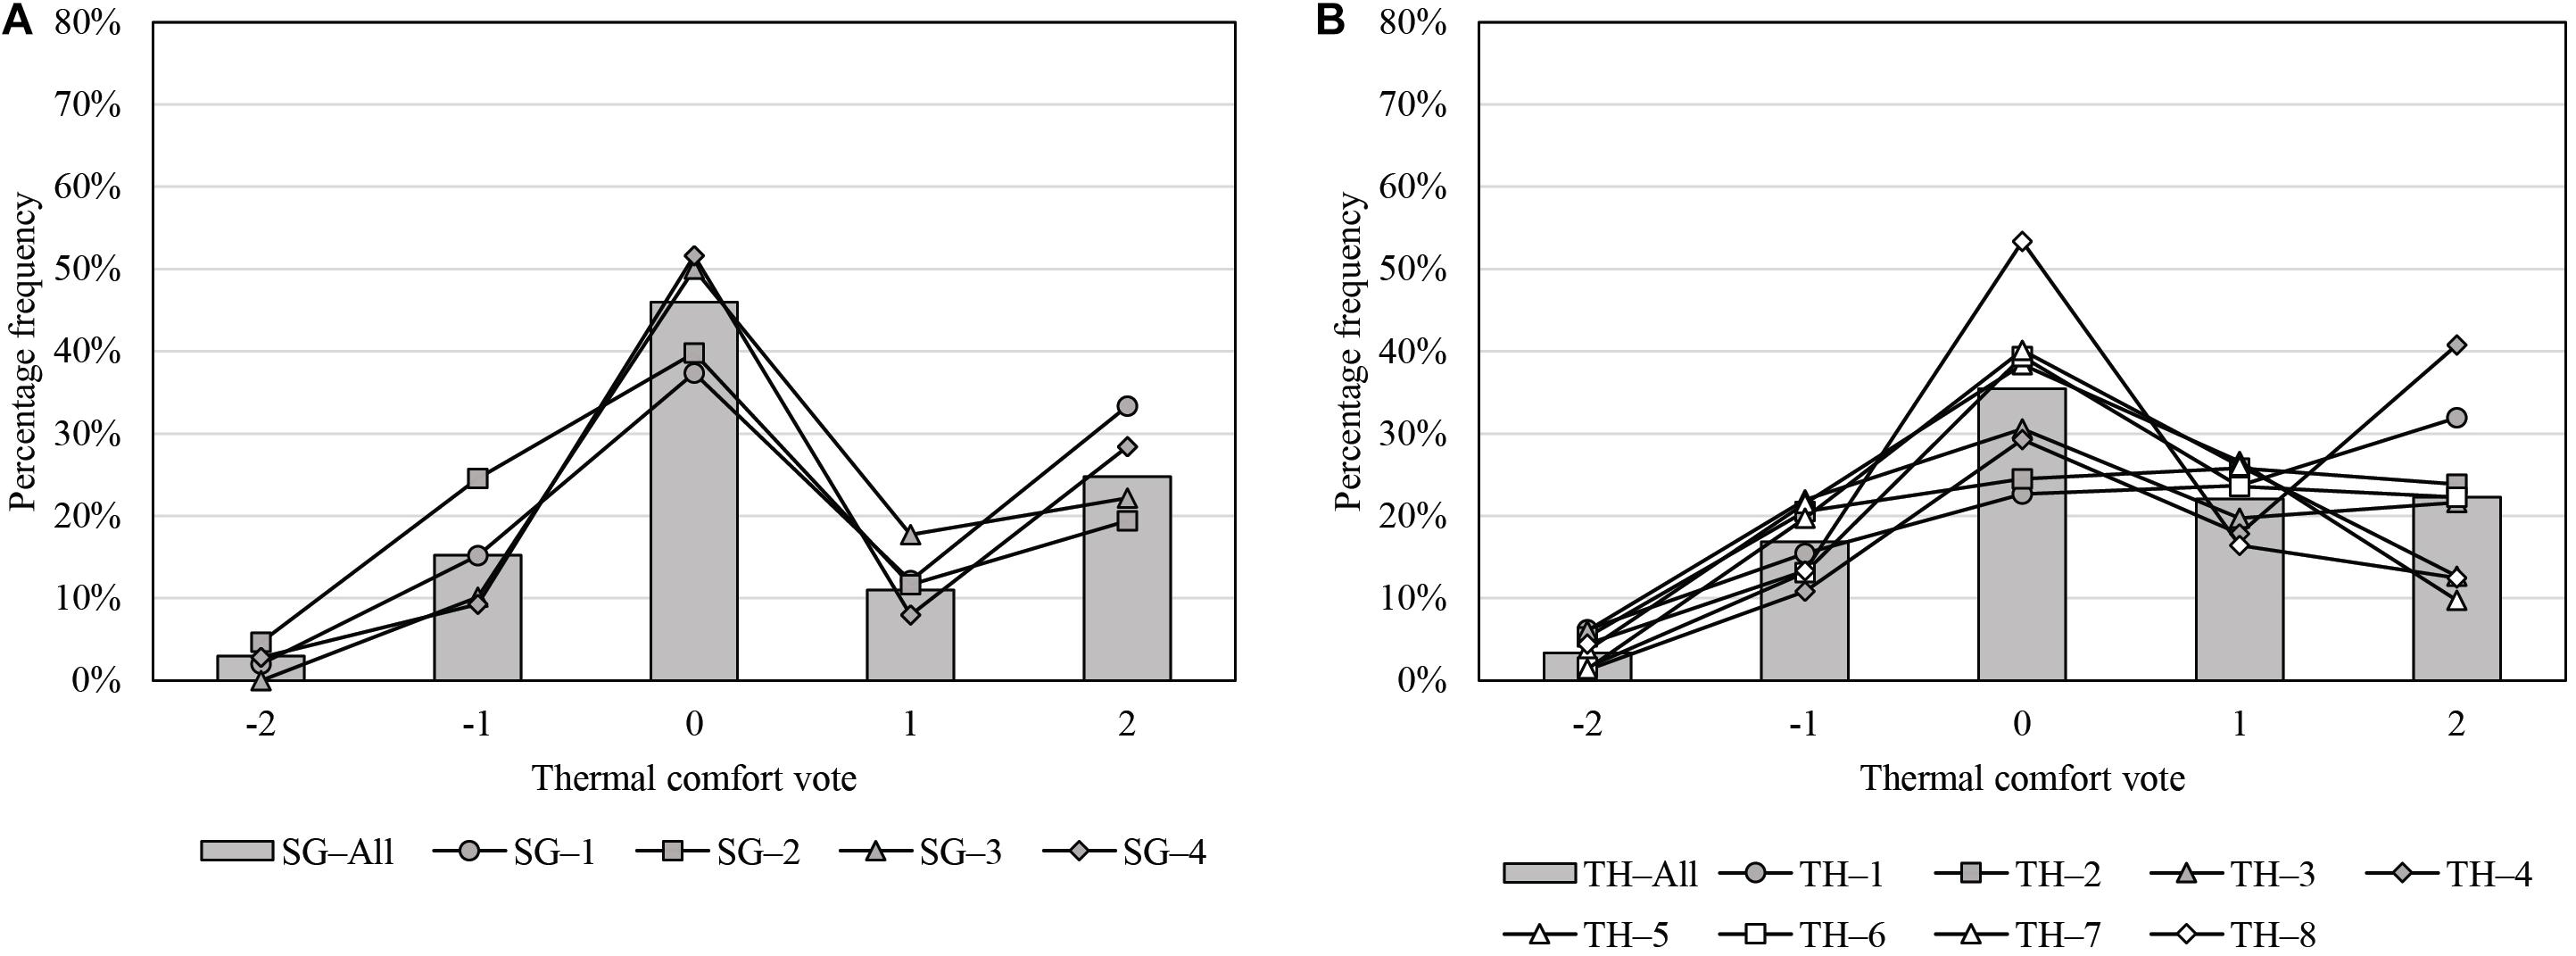
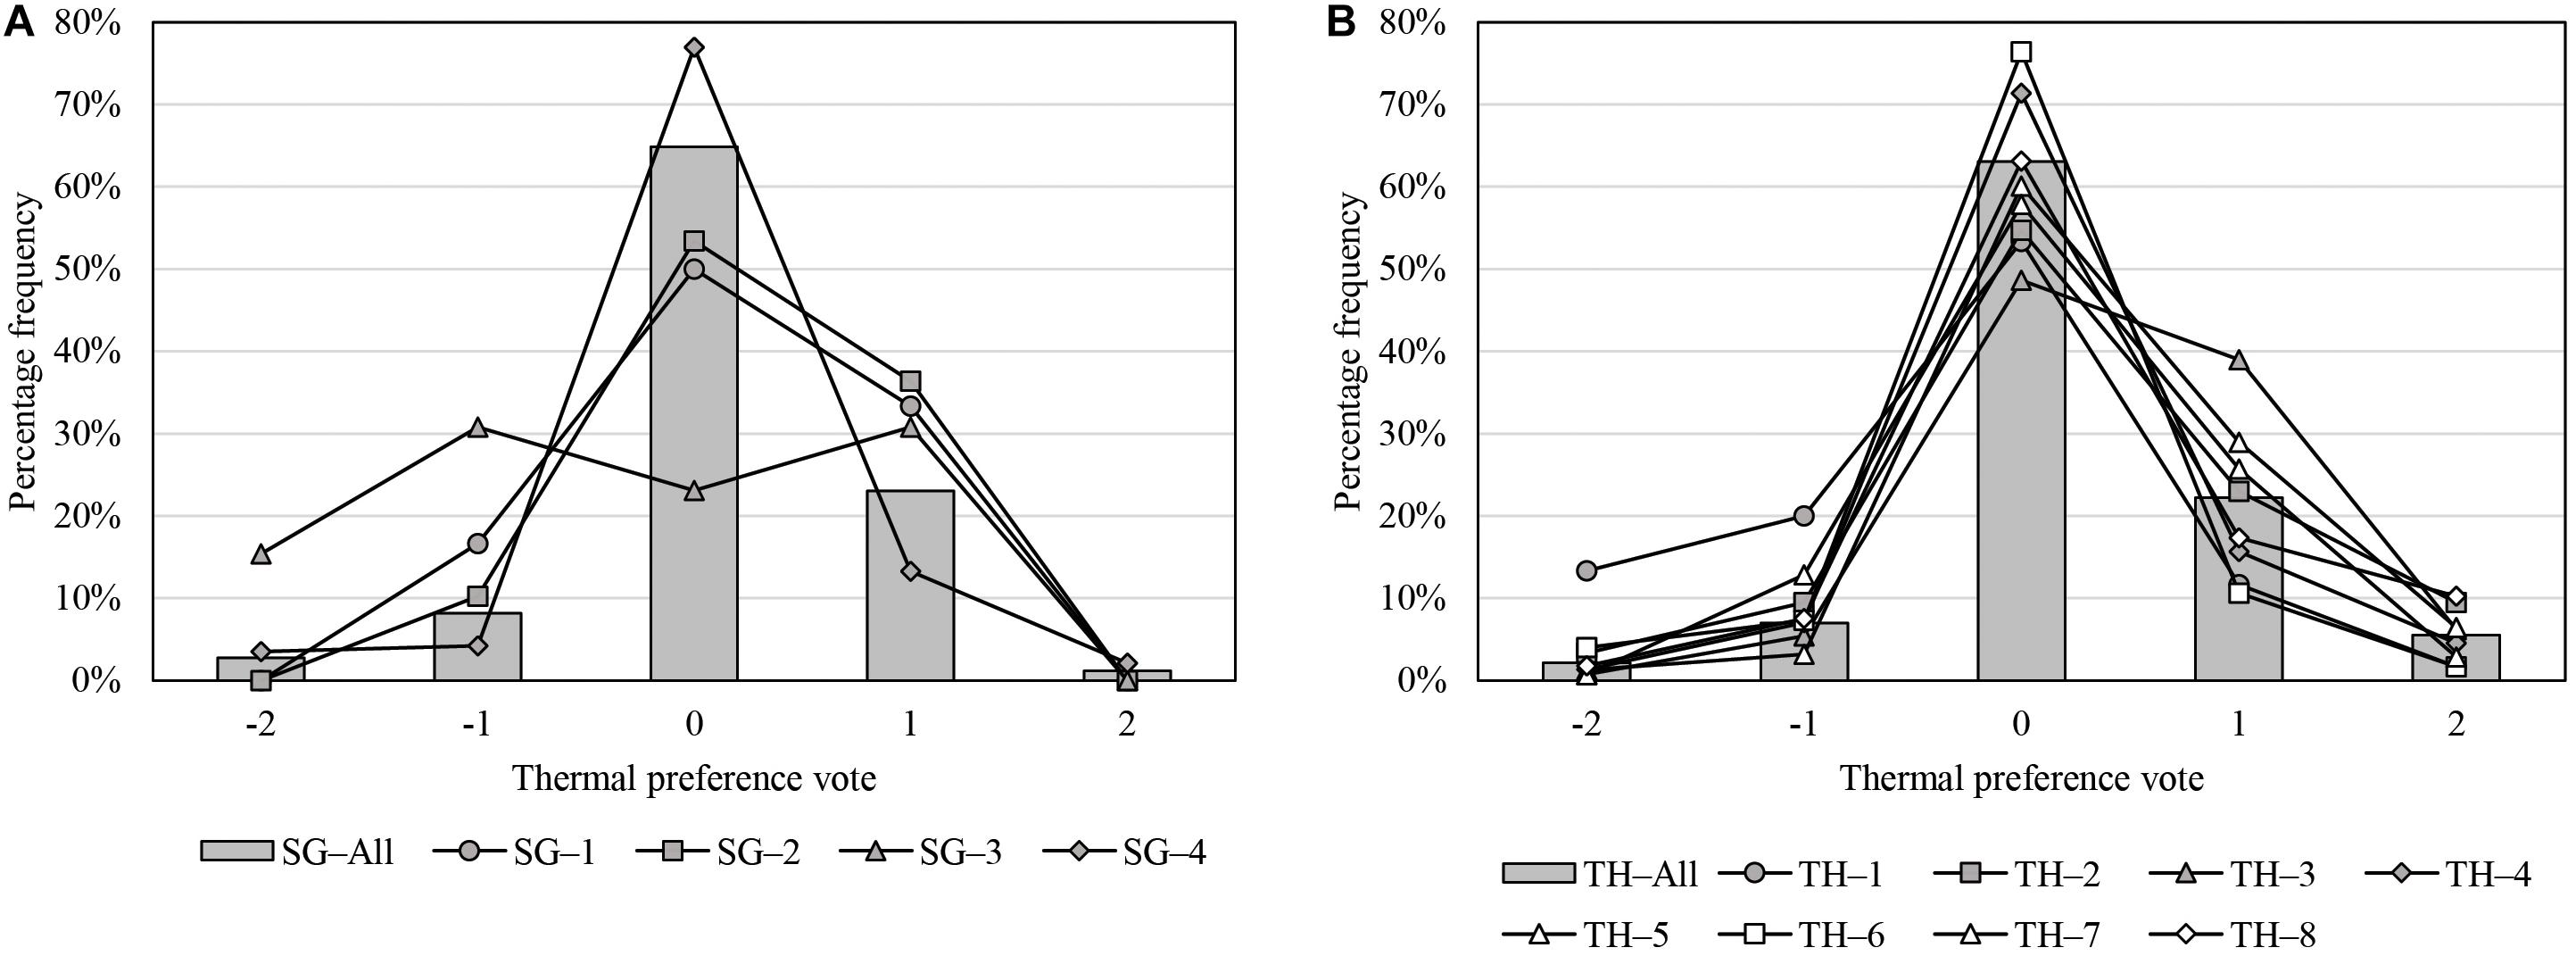
Thermal sensation votes are shown in Figure 2. The TSV for all cases in both countries was categorized into three groups: a neutral group (TSV = 0 or TSV0), colder-than-neutral group (TSV = −1 to −3 or TSV−), and warmer-than-neutral group (TSV = 1–3 or TSV+). TSV indicated a similar trend with average values of −0.8 and −0.6. For all offices, the highest votes were cast for TSV0, accounting for 32–52% (with an average of 40%) in Singapore and 38–64% (with an average of 51%) in Thailand. TSV− ranged from 35 to 60%, whereas TSV+ ranged from 4 to 24%. In Singapore, TSV− was 35–60%; SG–4 (average Tr = 24.1°C) had the lowest rate and SG–2 (average Tr = 23.3°C) had the highest rate. In Thailand, TSV− was 30–54%, with the lowest rate from TH–1 (when average Tr was low at 23.7°C) and the highest rate from TH–3 (when average Tr = 20.0°C). The percentage of TSV in both countries is similar to the trend when TSV− was generally higher than TSV+, which was nearly four times higher in Singapore and five times higher in Thailand (48:11 and 41:8, respectively). Considering the range of TSV = −1 to 1 recommended by ASHRAE (American Society of Heating Refrigerating Air-Conditioning Engineers [ASHRAE], 2017), three out of 10 offices (TH–4, TH–6, and TH–7) achieved more than 80% of this acceptable range. The values were beyond the recommended sensation by 28% of TSV− in Singapore and 21% of TSV− in Thailand, against 2 and 3% of TSV+. The TCVs are declared in five scales and are presented in Figure 3. The highest rate is represented by the neutral side (TCV = 0), as compared to the comfort side (TCV = 1 and 2 or TCV+), and the average comfort of both countries was 0.4. TCV+ was 31–46% in Singapore and 36–59% in Thailand. The proportion of uncomfortable votes exceeded 20% in one office in Singapore and five offices in Thailand. The highest uncomfortable votes were observed for SG–2 (29%) and TH–3 (28%), where the average room temperature was low, and the TSV was high on the cold side. The total acceptable range (TCV = 0, 1, and 2) converges with 83% in Singapore and 80% in Thailand. To determine the relationship between TSV and TCV, the data are categorized by the scale of votes plotted in Figure 4. The comfort rate in TSV−, which was on the comfortable side, was approximately 18% in Singapore cases and 15% in Thai cases; this is higher than that in TSV+, which was 3% in Singapore and 2% in Thailand. The highest comfort rate was approximately 50% of TSV = 2 (71 out of 143 votes) in Singapore and approximately 54% of TSV = 0 (614 out of 1,128 votes) in Thailand. Most of the discomfort rates were derived from people who voted for TSV− rather than TSV+ (77:21 in Singapore and 74:17 in Thailand, respectively). There were 14 and 15% of discomfort votes in TSV− and 4 and 3% in TSV+. This is because, although a cold sensation may cause discomfort, people are likely to tolerate overcooled environments. The TPVs are plotted in Figure 5. In the case of Singapore, 65% of the participants voted for TPV = 0, whereas 63% of the participants in the Thailand offices voted for the same. The percentage of “prefer warmer temperature” (TPV+) was higher than that of “prefer colder temperature” (TPV−), which was 24:11 in Singapore and 28:9 in Thailand. The percentage of TPV+ in the Thai cases was slightly higher than that in Singapore at 4%. TPV corresponded to TSV when 87% of the people in Singapore and 83% of the people in Thailand who voted for TSV- preferred changing to a warmer temperature, whereas 64% of the people in Singapore and 47% of the people in Thailand voted for TSV+ preferred changing to a colder temperature (correlation coefficient = −0.8 and −0.7). Generally, most of the people feel comfortable in thermal environments. However, there is a possibility to adjust to a slightly warmer temperature for a better TPV with a preference of the neutral scale.
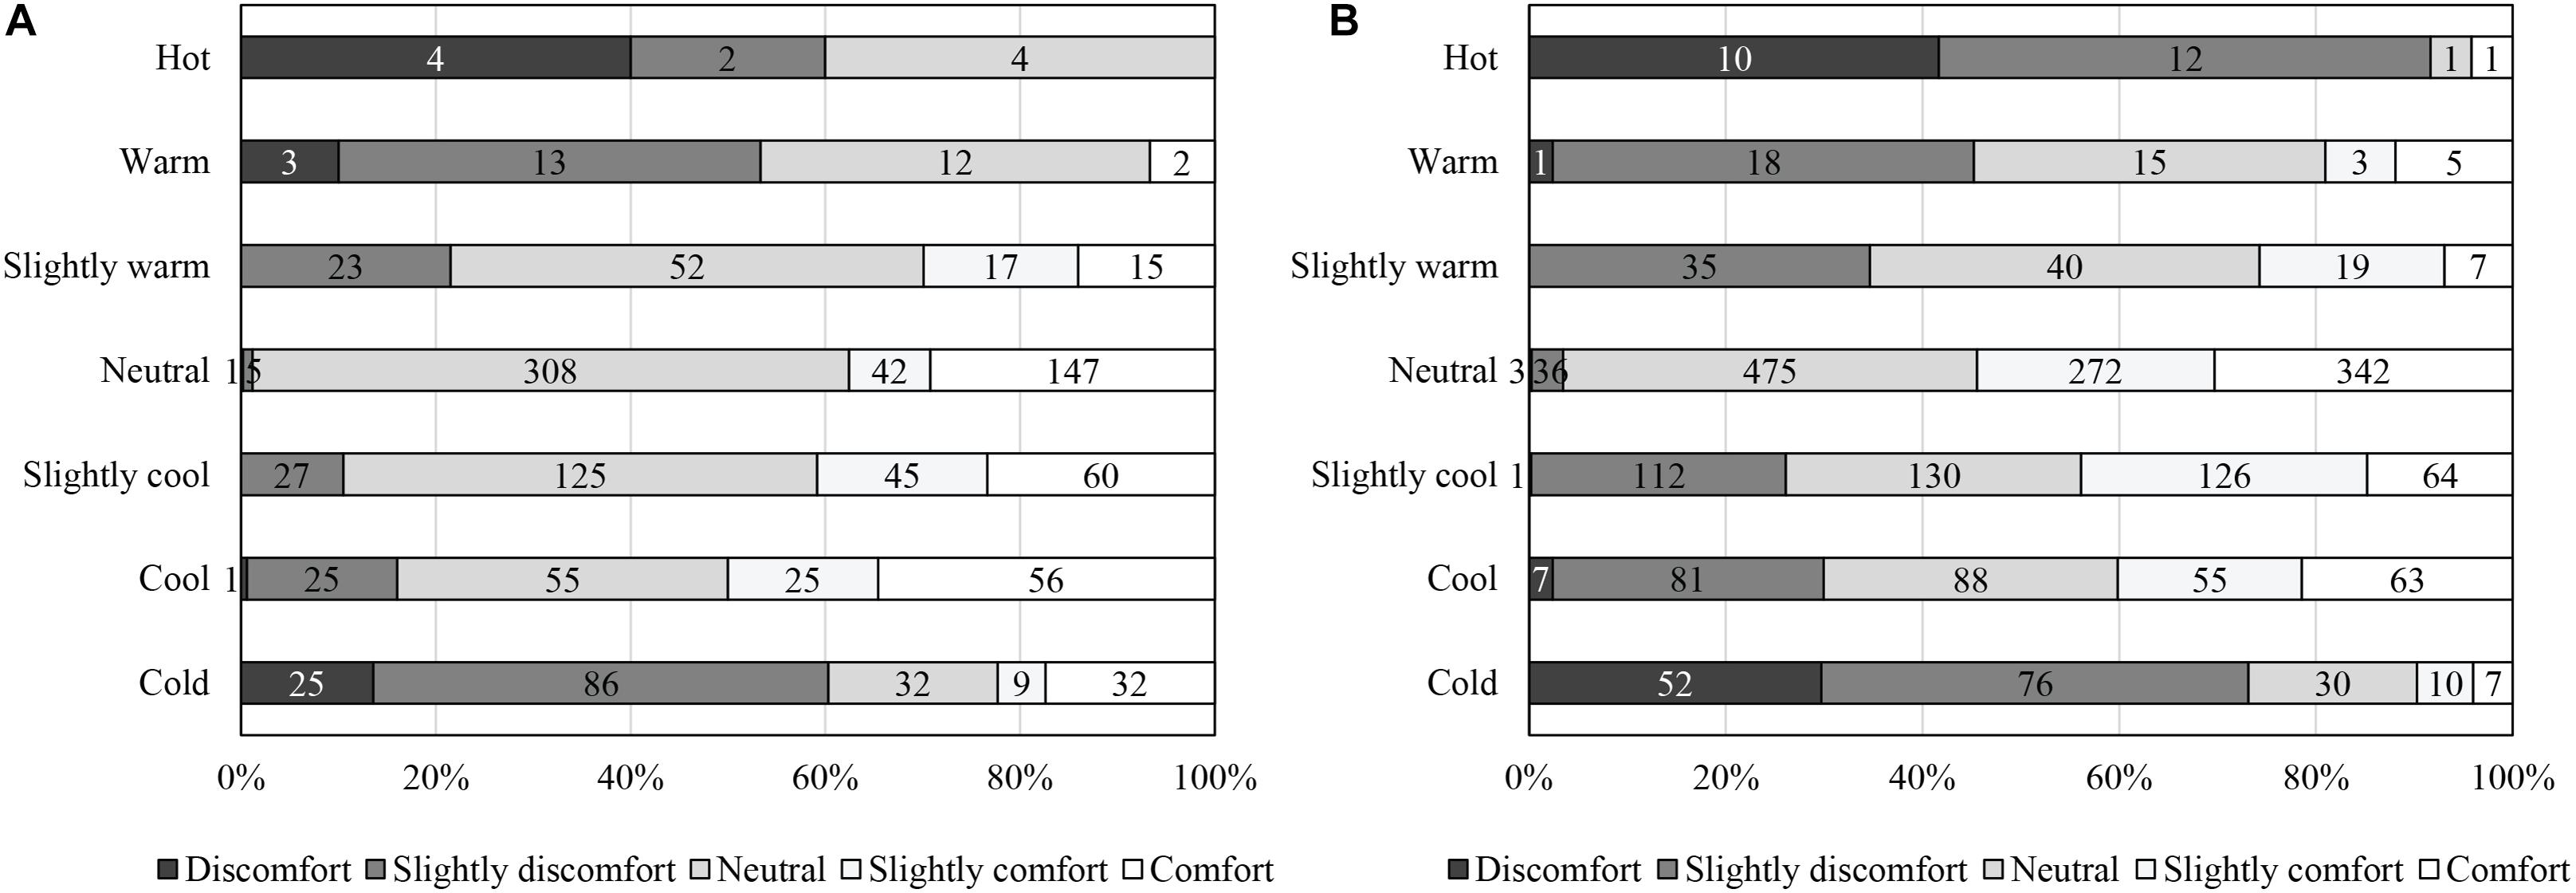
Figure 4. Relation between thermal sensation votes and thermal comfort votes: (A) Singapore and (B) Thailand.
Comfort Temperature
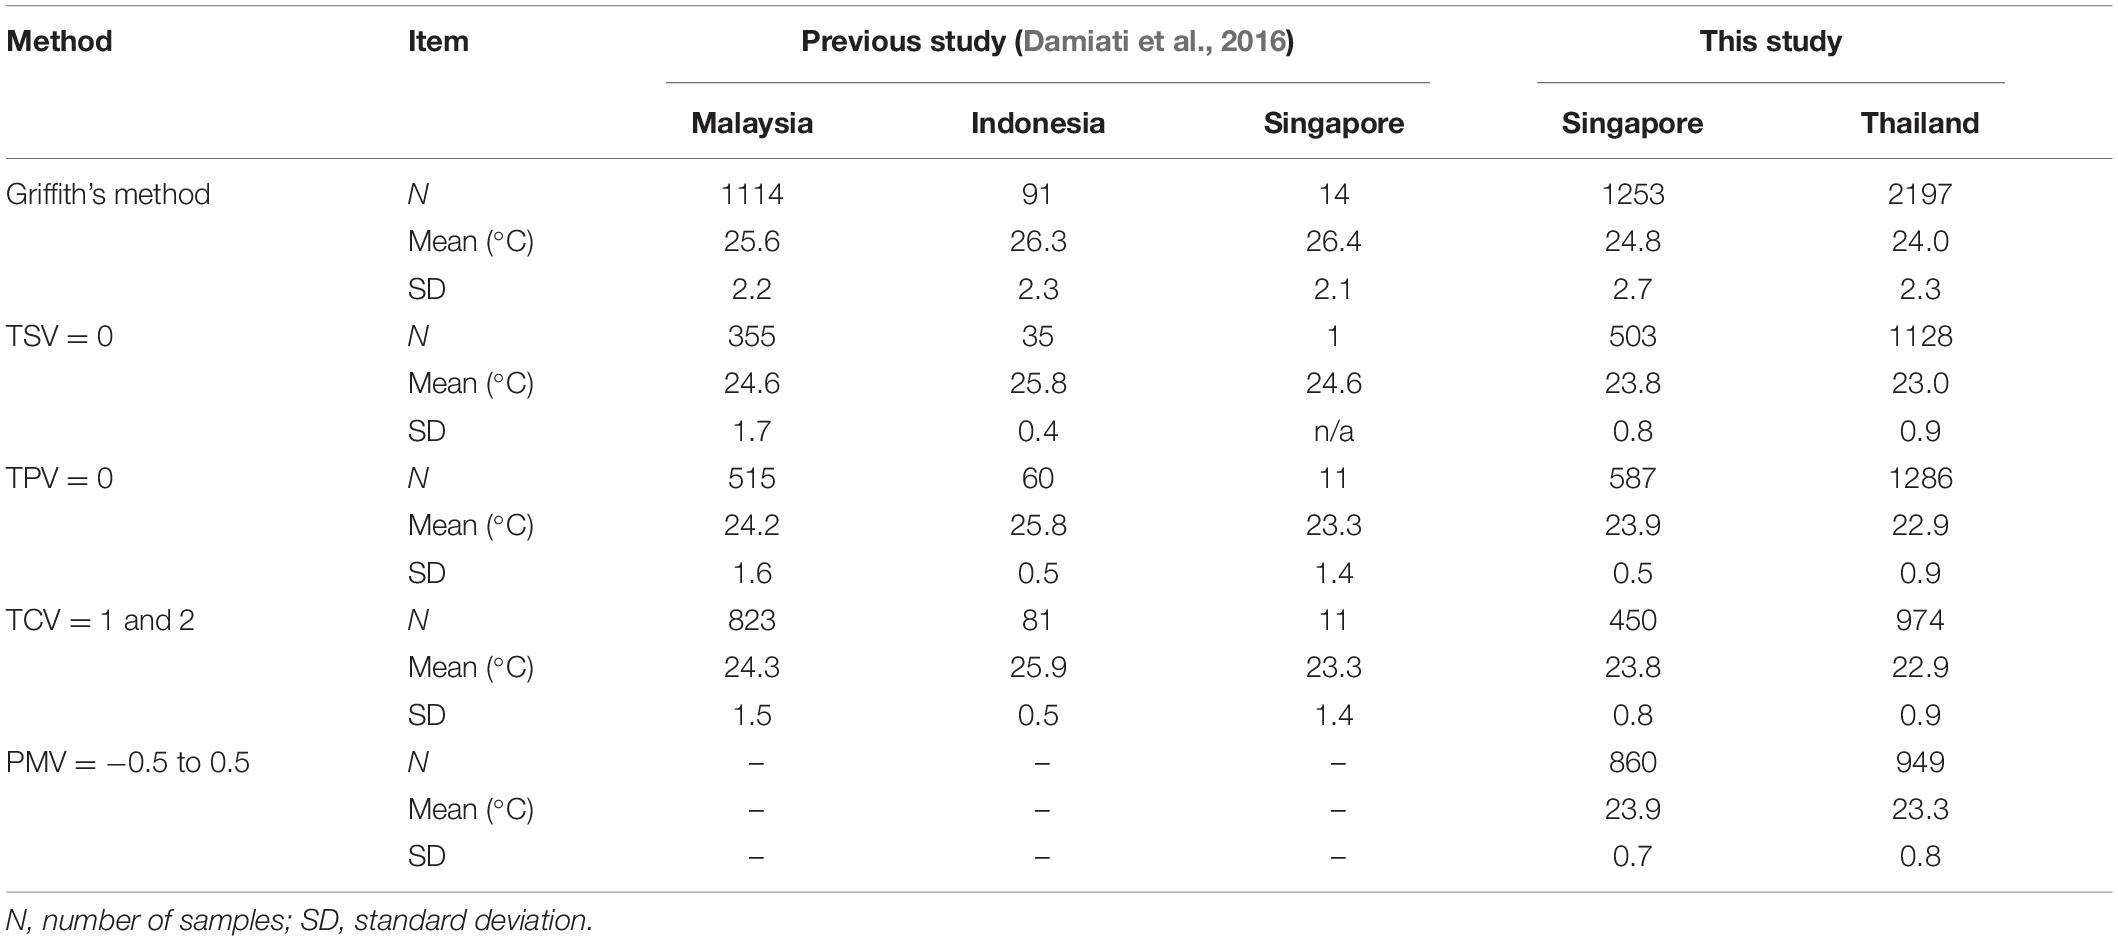
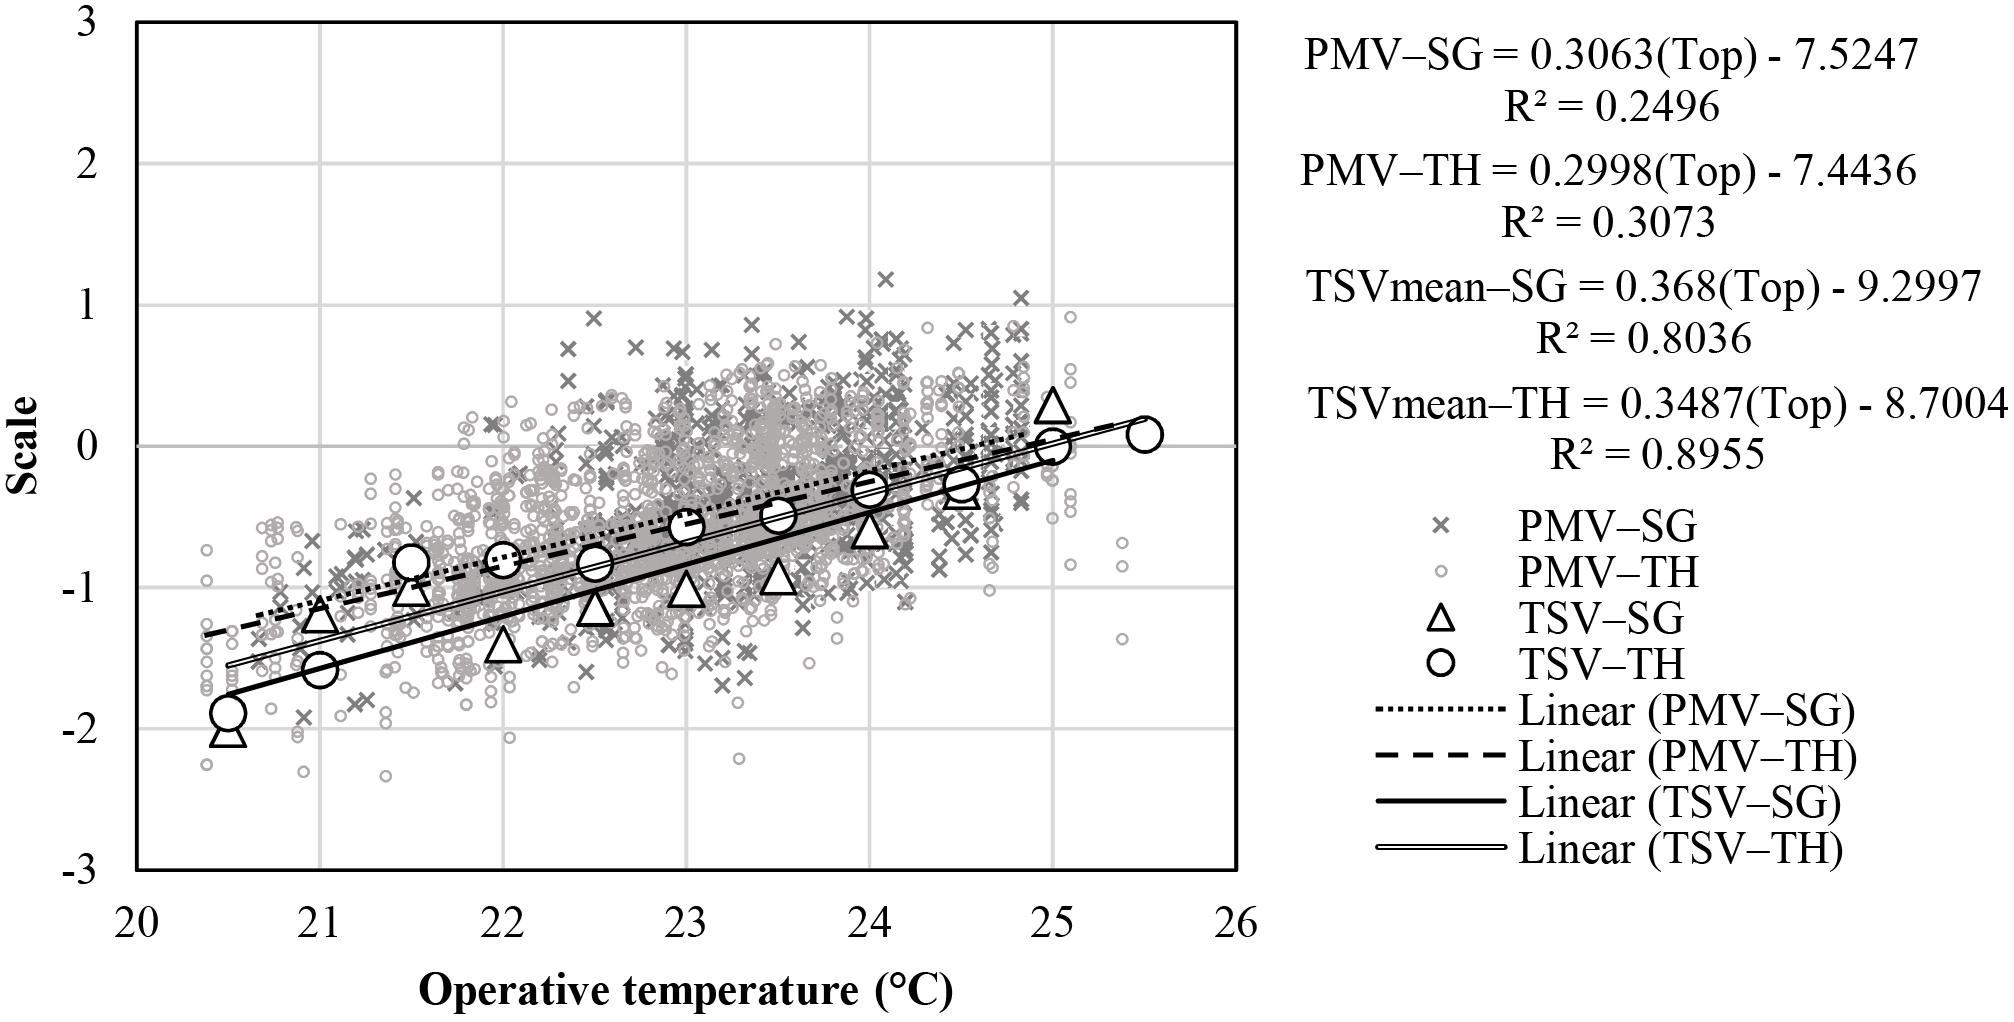
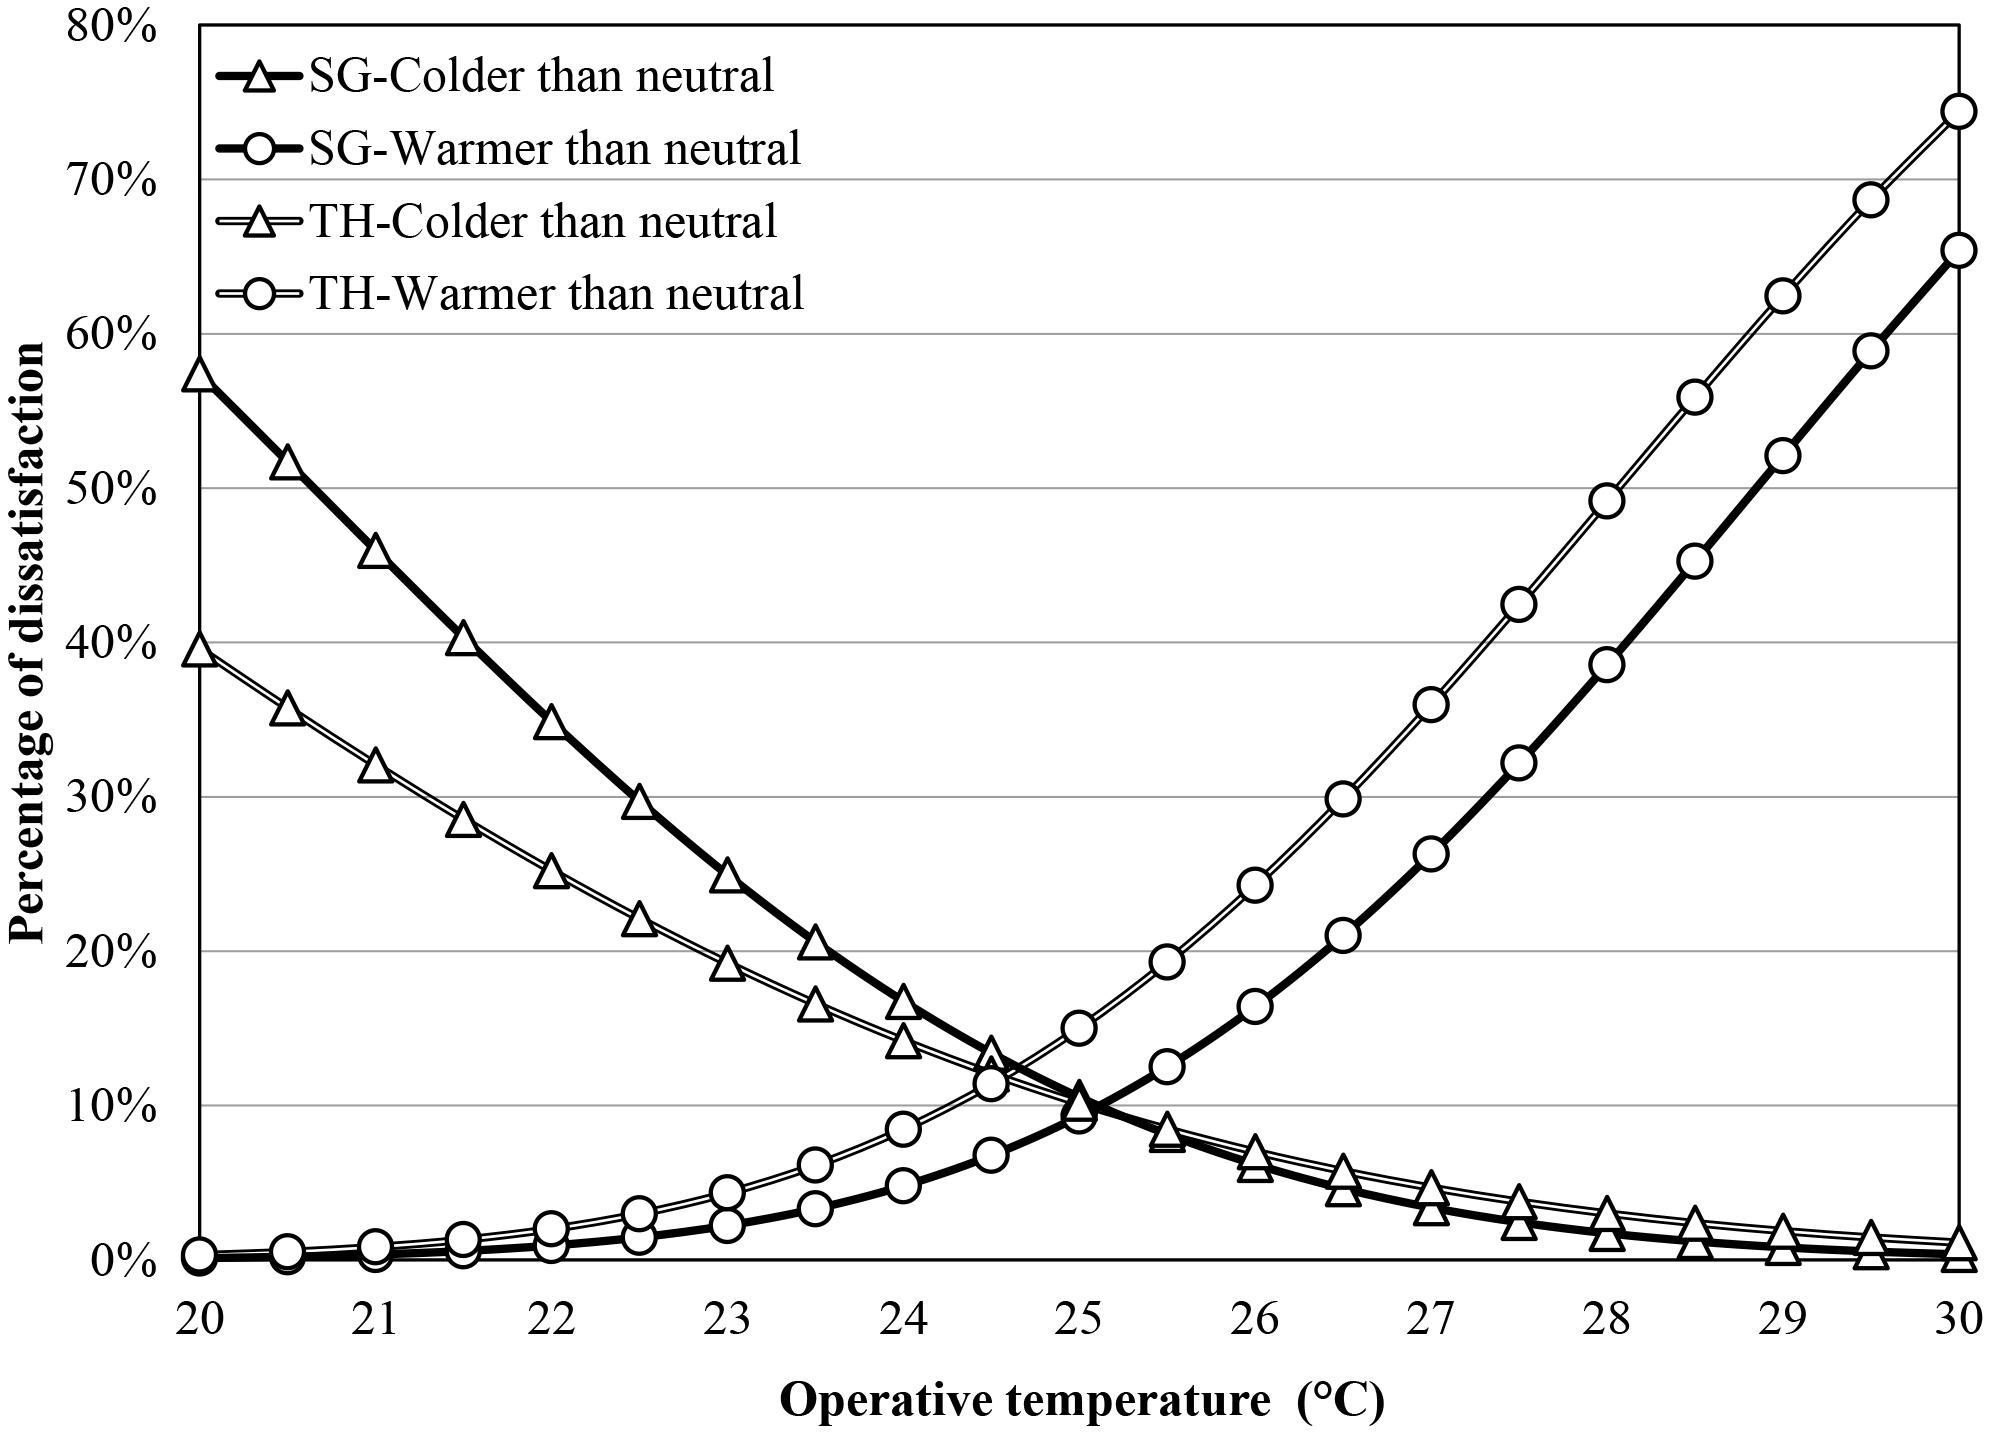
The comfort temperature is essential to achieve because it is suitable to confirm indoor temperature adjustment in terms of human satisfaction. To estimate the comfort temperature, the results of the operative temperature and questionnaire were used. The comfort temperatures of each variable are listed in Table 6. First, we apply an equation based on Griffiths’ method to air-conditioned building types and climate zones, including a hot-humid climate zone (Griffiths, 1991). This method is suitable for a narrow range of thermal conditions or small sample sizes. We concluded all TSVs between the morning and the afternoon because most thermal environments were quite stable during the day. The results of the measured operative temperature and the TSVs at that moment were used to calculate the comfort temperature. The equation is Tc = Tr + (0 − C)/a, where Tc is the comfort temperature (°C) based on T; C is the TSV on the scale, where 0 is the neutral condition, and a defines the constant rate of thermal sensation change at room temperature (0.5). This constant rate was used with a seven-point thermal sensation scale in the study conducted by Humphreys et al. (2013). Using this method, the average comfort temperature was determined to be 24.8°C in Singapore, which is slightly higher than that in Thailand (24.0°C). The average comfort operative temperature is different from the measured value (approximately + 1.1°C on average). The average comfort temperature of Singapore was slightly higher than that of Thailand because there were more Singaporean office workers voting cold at the same operative temperature. In contrast, there were more Thai office workers voting neutral at the lower operative temperature. Second, the comfort temperature was selected from the temperature when the participants answered the questionnaire as TSV = 0 (neutral), TCV = 1 or 2 (slightly comfortable or comfortable), and TPV = 0 (no change). The average comfort temperatures from the three types of votes were comparable to each other in the ranges of 23.8–23.9°C (Singapore) and 22.9–23.0°C (Thailand). The value was slightly low because several people voted neutral for the TSV and no change for the TPV, while the temperature was low. The values from these votes are lower than that of Griffith’s method by approximately 1°C. Third, we selected the temperature values when the PMV = −0.5 to 0.5, which was 23.9°C in Singapore and 23.3°C in Thailand. The values of both countries were comparable because, under the calculation, several people in this range wore a high clothing rate, even when exposed to low temperatures. This finding is relevant to the results in the study in Malaysia (Damiati et al., 2016) and Singapore (Chen and Chang, 2012), which the average clothing insulation values were found to be 0.62 and 0.61 clo, respectively, while the average indoor temperature of both countries was 24.4°C. The PMV and the mean TSV are plotted against the operative temperature for every 0.5°C, ranging from 21.5 to 26°C, as shown in Figure 6. For the PMV, the trendlines between Singapore and Thai cases are parallel with the most negative PMV values. This prediction becomes 0 when the operative temperatures are 24.6°C in Singapore and 24.8°C in Thailand. Similarly, for the TSV, the Singapore offices in all operative temperature groups yielded a mean TSV of 0 at 25°C. The regression lines of both cases lie parallel to the cold side, similar to the PMV trendline. Considering a suitable range of −0.5 to +0.5, the operative temperature was well matched at 24°C in the Singapore offices and 23.5°C in the Thailand offices. These values were relevant to the mean comfort temperature of PMV (described in Table 6) when the operative temperature of the case studies converged with the colder side rather than the warmer side. Additionally, compared with the previous research of Damiati et al. (2016) in South East Asian countries of Malaysia, Indonesia, and Singapore, it was found that the mean comfort temperatures in this study were lower. This is because the thermal conditions in these cases were slightly lower than those with a high number of neutral votes and without a change in preference. We obtained an acceptable range between the two countries. The probit of percentage of dissatisfaction, derived from subjective votes of “colder-than-neutral” and “warmer-than-neutral,” is plotted against the binned operative temperature, which was categorized by 0.5°C interval, as illustrated in Figure 7. The results indicate that, when considering a dissatisfaction of 20%, the acceptable comfort temperature range of the Singapore offices is 23.6–26.4°C (Δ 2.8°C), higher than that of the Thailand offices, which was 22.9–25.6°C (Δ 2.7°C). The percentage of dissatisfaction with colder-than-neutral votes was higher in Singapore cases, whereas that of warmer-than-neutral votes was higher in Thailand because of the higher vote of discomfort of the Thailand occupants at higher temperatures. Considering the intersection of the colder-than-neutral line and the warmer-than-neutral lines, the optimum comfort temperatures between both groups are 25.1 and 24.6°C, respectively, which is cooler than the average operative temperatures of 0.1–2 and 0.8–2.6°C, respectively. The comfort temperature value obtained via this analysis deviates from the mean comfort temperature determined using Griffith’s method at +0.3°C (Singapore) and +0.7°C (Thailand) (see Table 6).
Thermal-Adaptive Clothing Behavior
This study focuses on the adaptation of clothing insulation as one of the most significant factors that affect thermal comfort (American Society of Heating Refrigerating Air-Conditioning Engineers [ASHRAE], 2017). Generally, there is no personal control of the indoor environment in these mechanically ventilated office buildings, such as the use of windows for ventilation, the thermostat control, etc. The adaptation of clothing insulation reflects psychological aspects and weather conditions for both outdoor and indoor environments throughout the day (Carli et al., 2007). In the cooling space, people tend to adjust their clothes when the indoor temperature decreases. The average clothing insulation rate increases when they expose to cool environments during the day. The comparison of the clothing rate in summer was discussed in the study of some Southeast Asia countries and Japan (Damiati et al., 2016). Japanese occupants had a lower average clothing rate than Malaysian occupants (0.53: 0.62 clo) while exposing the higher average indoor temperature (25.9: 24.4°C). The policy of setting a high indoor temperature in Japan is significant to reduce the clothing adjusting behavior of occupants while staying inside buildings. The amount of clothing in Japan was strongly associated with the outdoor weather while that in tropical climate countries is likely to be more related to indoor environments. In another study, Chen and Chang (2012) found that there were 62% of tenants wearing heavy cloths (long sleeves or light jackets) to overcome the overcooled indoor environments. Almost 33% of them reported that they usually wore long sleeves. Similarly, this study observed the clothing rate of occupants to identify the effects of thermal conditions on the behavior of the occupants. In most offices, office workers wore flexible clothes such as light shirts with long sleeves or short sleeves in the upper part of the body for outdoor hot and humid climates. Based on the results of the survey, approximately 35% of additional clothing was used during the day in the upper part of the body, for self-adaptation in order to feel warmer. Almost 50% of the occupants donned extra upper pieces of clothing such as sweaters, jackets, suits, or cardigans. Although the gender did not vary significantly with respect to the clothing rate (men = 0.60 clo and women = 0.61 clo), some women wore cardigans or scarves for greater comfort or warmth, whereas several men wore sweaters or jackets. The number of occupants wearing heavy clothes over 0.6 clo was large in both countries (28% in Singapore and 42% in Thailand). There were 50% of them feeling cold toward the temperature at 23°C or lower. The high amount of clothing as well as several complaints regarding the cold sensation is related to previous studies in Thailand (Sikram et al., 2018, 2019), Malaysia (Damiati et al., 2016), and Singapore (Chen and Chang, 2012). The complaints are also associated with the symptom reports, where subjects felt cold in the parts of the body that were not covered when exposed to lower temperatures (see Table 7).
Building-Related Symptoms
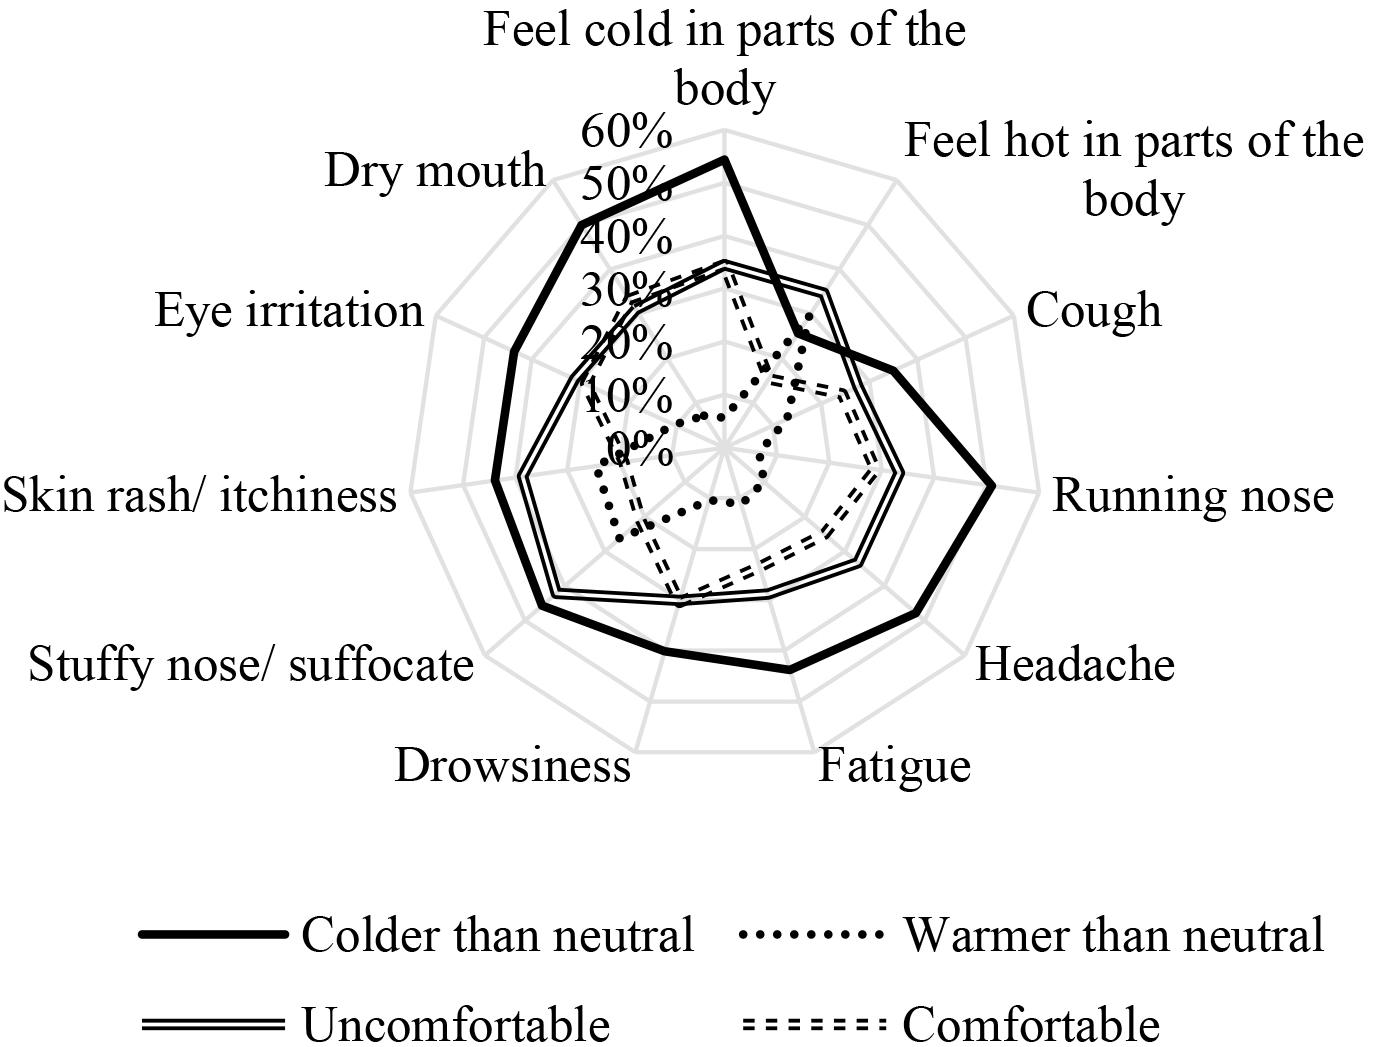
Building-related symptoms are defined as complaints from general samples which are caused by both the poor physical and the psychological work environment (Marmot et al., 2006). Factors indicated as possible causes include physical parameters (temperature, humidity, ventilation, particle matters, etc.) and psychological issues (Cao et al., 2012). In general, building-related symptoms refer to the prevalence of general, mucosal, skin symptoms which were associated with eyes, nose, and upper respiratory, and skin (Eriksson and Stenberg, 2006). Some but not all previous studies in a temperate climate zone found that high temperatures caused the prevalence of symptoms more than low temperatures (Jaakkola et al., 1989; Reinikainen and Jaakkola, 2001). However, the symptom response in air-conditioning spaces in a tropical climate or summer can be unique because the overcooling environment leads occupants to feel uncomfortable and experience symptoms in cool air-conditioned environments during extended periods of exposure (Chen and Chang, 2012); therefore, this study investigated the response of people reporting general building-related symptoms experienced during the day by mainly considering temperature and humidity. We avoided collecting unhealthy samples by asking whether they were fine or healthy at the beginning of the day so that sick occupants were excluded to be analyzed. The results in Table 7 describe the frequency of 11 individual symptoms and odds ratios (ORs), which are grouped in the range of operative temperatures at 2°C intervals: 21–22, 23–24, and 25–26°C. Among the 944 votes, more than half of the participants experienced similar symptoms throughout the survey period. There were almost 40% of occupants reporting at least one symptom during the day and 72% of them claiming that they had the same symptoms every day. It could be assumed that they might have previously suffered from similar symptoms when the thermal environments were likely to be stable throughout the year. The number of reports of such symptoms was lower when the temperature was higher, and all symptom percentages were below 20% in the 25–26°C group. There were three major in the 21–22°C group: feeling cold in unclothed parts of the body (47.1%), fatigue (23.5%), and drowsiness (29.4%). The last two symptoms have been commonly reported in previous studies (Thach et al., 2019) in Singapore. At higher temperatures, the percentage of participants with symptoms of feeling cold in the unclothed parts of the body, coughing, fatigue, drowsiness, stuffy noses, and dry mouths decreased. However, the percentage of participants experiencing symptoms of feeling hot in different parts of the body, skin rashes, and eye irritations increased slightly. The most common symptom was the feeling of a cold sensation in different parts of the body, such as the head, neck, shoulders, face, arms or hands, body, legs, and feet; it was 47.1% in the 21–22°C group. In contrast, the sensation of heat in different parts of the body had the lowest number of complaints (1.7%). When the temperature was higher, in the 25–26°C group, the rate of feeling cold in different parts of the body suddenly reduced to 15.5%, whereas the percentage of feeling hot in different parts of the body slightly increased to 8.5%. To clarify whether a specific exposure is a risk factor for an individual outcome and to compare the magnitude of various risk factors for this outcome, an OR was used to compare the symptoms arising due to the exposure to thermal environments. In this study, we used this risk factor to determine how indoor temperatures influence the prevalence of symptoms. The symptom occurrence of each temperature group was compared between ones who complained about symptoms and ones who did not give any feedback. OR = (a/c)/(b/d), where a denotes the number of cases exposed to the mentioned temperature, b denotes the number of cases exposed to non-mentioned temperature, c is the number of cases reporting mentioned symptoms, and d is the number of cases reporting no symptoms. When the value of OR exceeds 1, the exposure is associated with higher odds of the outcome. In contrast, if the OR value is less than 1, the exposure is related to lower odds of the outcome (Szumilas, 2010). As the results, the OR in the 21–22°C group was greater than 1 for most of the symptoms, except for the sensation of heat in different parts of the body. The three highest values in this group were those for the sensation of cold in parts of the body (1.48), runny nose (1.22), stuffy nose, and skin rash/itchiness (1.17). The ORs for several symptoms in the 23–24 and 25–26°C groups are likely to be lower than 1. The OR of symptoms in the 25–26°C group appears to be higher than 1 for the sensation of heat in different parts of the body (1.64) and headache (1.29), whereas that of other symptoms is lower than 1. These results suggest that the lower the temperature experienced by the occupant, the greater the risk of building-related symptoms. Additionally, the humidity ranging from was also considered on the symptom occurrence. The results found that the symptoms grouped by the RH range were quite varied. There is no difference in overall symptom occurrence between the optimum range (40–60%) and the excessive range (higher than 60%). Since they experienced high outdoor humidity throughout the year, people in Southeast Asia could accept a wider range of humidity in air-conditioning spaces (Djamila et al., 2014). However, it was noticeable that dry skin and dry month appeared to increase over 30% when the absolute humidity was lower than 0.008 g/g and the operative temperature was lower than 23°C. To extend the relation between the subjective response and the symptom occurrence, Figure 8 illustrates the percentage of people reporting symptoms with respect to sensation and comfort: the colder-than-neutral votes (TSV−), the warmer-than-neutral votes (TSV+), the uncomfortable votes (TCV−), and the comfortable votes (TCV+), regardless of the neutral votes. Among these 11 symptoms, the TSV− side exhibited a higher frequency of 10 symptoms, except for the sensation of heat in different parts of the body. People who were sensitive to the cold complained more about their symptoms, as compared to those who felt warm (44:14). The three highest rates of TSV− belonged to the sensation of cold in parts of the body (54%), dry mouth (50%), and headache (48%). Meanwhile, the highest rates of TSV+ were the sensation of heat in parts of the body (29%), stuffy nose or suffocating (26%), and skin rash or itchiness (25%). For the TCV, in total, the ratio on the TCV side was slightly lower than that of TCV+ (26:33). The three highest rates of TCV− were stuffy nose or suffocating (42%), skin rash or itchiness (39%), and the sensation of cold in parts of the body (35%). As the results, the relation between TSVs is significant to the symptoms occurrence. The colder-than-neutral side showed the higher risk of the prevalence of symptoms rather than the warmer-than-neutral side. It is worth noting that people who voted as feeling comfortable also experienced several symptoms, similar to those who voted feeling uncomfortable. Thus, comfort may not always align with health conditions; people may vote comfortable in cold or severely cold environments, but their health could deteriorate during long-term exposure. This evidence indicates that living in a comfortable condition does not always correspond to living in a healthy condition, in terms of indoor thermal environments (Cao et al., 2012).
Discussion
The actual thermal environment in offices in a hot humid climate was overcooled due to air-conditioning operation and maintenance, which are mainly responsible for air-conditioning engineers or building management teams. The fluctuations in Tr and RH were primarily attributed to the air-conditioning operation; older buildings were likely to perform the indoor environment to be low temperatures or high humidity. To remove an excessive amount of water vapor, the HVAC system cooled the intake air that caused a high latent heat load for itself. The results of cooling the coil to lower humidity lead to the overcooling indoor environment (Chen and Chang, 2012). Low indoor room temperature was the result of the oversized HVAC system or the building management staff wanting to avoid complaints from occupants in a few sections of the office. Consequently, high differences between outdoor and indoor conditions seemed to be a critical point in offices in a tropical region which leaded discomfort and symptom complaints in the long run. Although the operative temperature and absolute humidity belonged to the ASHRAE comfort zone, the complaints were still high because most of them fell into the 1.0 clo zone which was compatible with people who dressed suits and ties. It seems that people highly adapted themselves to the cooling environment by clothing adjustment when they could not adjust the temperature by themselves. The TSVs and the PMV declared the similar linear regressions showing that the colder-than-neutral values were about five times greater than the warmer-than-neutral values. The TSVs and the thermal preference votes confirmed that discomfort was mainly from people stayed at lower temperatures than their comfort temperatures. The most comfortable votes were from the neutral to the cool side rather than the warm side. This result corresponds with those of studies in Thailand (Busch, 1992; Jitkhajornwanich and Pitts, 2002; Sattayakorn et al., 2017) and Singapore (de Dear and Brager, 1998) where the subjects were more comfortable at neutral and slightly cooler temperatures. In contrast, the discomfort rate increased when the subjects felt either cold or hot; they tended to vote uncomfortable rather than neutral, i.e., TSV− or TSV+. Thermal environments inevitably impacted on overall satisfaction when the symptom occurrence appeared to increase when they exposed the cold temperature. It was noticeable that the comfort temperature was an indicator to support a better temperature set in the air-conditioned offices in a hot and humid climate in terms of comfort and health. People were likely to simultaneously complain about both comfort and symptoms when facing the temperature was lower than the average comfort temperature over 24°C. The symptom occurrence declared that occupants who voted for the colder-than-neutral side had much greater symptom complaints, whereas those who felt comfortable did not have much difference in symptoms. It could imply that reducing the feeling of cold sensation should be more considerable than maintaining comfort levels. Since we found the acceptable comfort temperature to be up to 26.4°C in Singapore and 25.6 5°C in Thailand, it is quite challenging to change the indoor temperature setpoint to satisfy people both in comfort and health.
Conclusion
A field study of the thermal environment was conducted in air-conditioned offices in Singapore and Bangkok from 2017 to 2019. Data loggers for measuring thermal variables were installed in these offices. The questionnaire was distributed among occupants to obtain their perceptions and building-related symptoms of the thermal environment during working hours. The significant conclusions are as follows:
1. Based on the measurements, the average room temperature in Singapore was 23.1–24.1°C with 45.2–66% RH, whereas that in Thailand offices was slightly lower as 22.0–23.7°C with 47.3–65.3% RH. Most thermal variables of the offices in both countries were subordinated to the 1.0 clo comfort zone, which is higher than the 0.5 clo comfort zone of the psychometric chart, owing to the low temperature during working hours. There were very few values beyond the comfort zone because of the high humidity generated from the high outdoor RH.
2. The PMV votes indicated that most cases were beyond the recommended zone of the ASHRAE standard, and the compliance rate was lower than 80% in all cases. This similarity is also observed in the TSVs, where the mean was mainly plotted on the negative side.
3. Based on the questionnaire, the TSV had the highest percentage in the neutral group, whereas the colder-than-neutral side had a higher percentage than that of the warmer-than-neutral side. The percentage of TSV in the recommendation zone of all offices in Singapore and five of the eight offices in Thailand was lower than 80%. TCV was lower than 80% of the comfortable votes in one of the four offices in Singapore and five of the eight offices in Thailand. The most comfortable votes were from the neutral and cold sides.
4. The mean comfort temperatures obtained via Griffith’s calculation are 24.8°C in Singapore and 24.0°C in Thailand, which are higher than the actual performance. The probit analysis yielded ranges of 23.6–26.4°C for the Singapore participants and 22.9–25.6°C for the Thai participants.
5. Clothing insulation was determined to be the primary factor affecting adaptive thermal comfort. Using additional pieces of clothing during the day indicated that occupants had to adjust themselves to feel warmer when exposed to cool indoor environments.
6. The symptom report declares that a high frequency of symptoms is observed in the low temperature range. The OR estimates that a low temperature of 21–22°C results in the highest occurrence of most symptoms. In contrast, high temperatures between 25 and 26°C are associated with a decrease in symptoms, except for the sensation of heat in different parts of the body. Occupants in offices with colder thermal environments complained about the symptoms more frequently than those in warmer conditions. When the ratio between the comfortable votes and the uncomfortable votes was almost equal, it could not be confirmed that the thermal environment featuring high comfort was supportive of the well-being of occupants.
In summary, apart from the reduction in energy consumption, a warmer environment satisfies human comfort and improves health in the long run. To reduce sensitivity of feeling cold and similar symptoms, the indoor thermal environment should be maintained at a higher temperature; however, the humidity of this environment needs to be controlled to ensure optimum thermal environment. The findings of this study support the implications for healthy building development in areas featuring hot and humid climates. The long-term assessment of the indoor environments related to comfort and health is recommended for future study.
Data Availability Statement
All datasets presented in this study are included in the article/supplementary material.
Ethics Statement
Ethical review and approval was not required for the study on human participants in accordance with the local legislation and institutional requirements. Written informed consent for participation was not required for this study in accordance with the national legislation and the institutional requirements.
Author Contributions
TS and MI designed and performed the field survey. TS wrote the manuscript in consultation with MI and RS. Both authors discussed the results and contributed to the final manuscript. All authors contributed to the article and approved the submitted version.
Funding
This work was supported by Tokyo Metropolitan Government Collaborative Research (Platform for Promoting Technology and Industry) Grant Number (H29-P1).
Conflict of Interest
The authors declare that the research was conducted in the absence of any commercial or financial relationships that could be construed as a potential conflict of interest.
Acknowledgments
We would like to thank the executives who gave us permission to conduct the survey and the building management teams who provided supportive building data. Furthermore, we would like to express our appreciation to all the occupants who filled out the questionnaire.
References
Ajimotokan, H., and Oloyede, L. (2009). Influence of indoor environment on health and productivity. N.Y. Sci. J. 2, 46–49.
American Society of Heating, Refrigerating, and Air-Conditioning Engineers [ASHRAE] (2017). ANSI/ASHRAE Standard 55-2017: Thermal Environmental Conditions for Human Occupancy. Atlanta, GA: American Society of Heating, Refrigerating, and Air-Conditioning Engineers.
American Society of Heating, Refrigerating, and Air-Conditioning Engineers [ASHRAE] (2019). ANSI/ASHRAE Standard 62.1-2019: Ventilation for Acceptable Indoor Air Quality. Atlanta, GA: American Society of Heating, Refrigerating, and Air-Conditioning Engineers.
Amin, N. D. M., Zainal, A. A., and Wahid, R. (2015). Architectural evaluation of thermal comfort: sick building syndrome symptoms in engineering education laboratories. Proc. Soc. Behav. Sci. 204, 19–28. doi: 10.1016/j.sbspro.2015.08.105
Busch, J. F. (1992). A tale of two populations: thermal comfort in air-conditioned and naturally ventilated offices in Thailand. Energ. Build. 18, 235–249. doi: 10.1016/0378-7788(92)90016-A
Cao, B., Qi, S., Zizhu, D., and Yingxin, Z. (2012). The impact of air-conditioning usage on sick building syndrome during summer in China. Indoor Built. Environ. 22, 490–497. doi: 10.1177/1420326X12443246
Carli, M. D., Bjarne, W. O., Angelo, Z., and Roberto, Z. (2007). People’s clothing behaviour according to external weather and indoor environment. Build. Environ. 42, 3965–3973. doi: 10.1016/j.buildenv.2006.06.038
Chen, A., and Chang, V. W. C. (2012). Human health and thermal comfort of office workers in Singapore. Build. Environ. 58, 172–178. doi: 10.1016/j.buildenv.2012.07.004
Coldwell Banker Richard Ellis [CBRE] (2019). Thailand Investment Market View Q3. Los Angeles, CA: Coldwell Banker Richard Ellis.
Damiati, S. A., Sheikh, A. Z., Hom, B. R., and Surjamanto, W. (2016). Field study on adaptive thermal comfort in office buildings in Malaysia, Indonesia, Singapore, and Japan during hot and humid season. Build. Environ. 109, 208–223. doi: 10.1016/j.buildenv.2016.09.024
de Dear, R. (2004). Thermal comfort in practice. Indoor Air 14, 32–39. doi: 10.1111/j.1600-0668.2004.00270.x
de Dear, R., and Brager, G. S. (1998). Developing an adaptive model of thermal comfort and preference. ASHRAE Trans. 104, 145–167.
de Dear, R. J., Leow, K. G., and Foo, S. C. (1991). Thermal comfort in the humid tropics: field experiments in air conditioned and naturally ventilated buildings in Singapore. Int. J. Biometeorol. 34, 259–265. doi: 10.1007/BF01041840
Djamila, H., Chu, C., and Kumaresan, S. (2014). Effect of humidity on thermal comfort in the humid tropics. J. Build. Const. Plann. Res. 2, 109–117. doi: 10.4236/jbcpr.2014.22010
Energy Policy and Planning Office [EPPO] (2018). Ministry of Energy. Peak 2018. Bangkok: Ministry of Energy Policy and Planning Office (EPPO).
Eriksson, N. M., and Stenberg, B. G. T. (2006). Baseline prevalence of symptoms related to indoor environment. Scand. J. Public Health 34, 387–396. doi: 10.1080/14034940500228281
Fanger, P. O. (1970). Thermal Comfort: Analysis and Applications in Environmental Engineering. Copenhagen: Danish Technical Press.
Foo, S. C., and Phoon, W. O. (1987). The thermal comfort of sedentary workers. Asia Pac. J. Public Health 1, 74–77. doi: 10.1177/101053958700100213
Griffiths, I. D. (1991). Thermal Comfort in Buildings with Passive Solar Features: Field Studies Commission of the European Communities. Brussels: Commission of the European Communities.
Humphreys, M. A., Rijal, H. B., and Nicol, J. F. (2013). Updating the adaptive relation between climate and comfort indoors: new insights and an extended database. Build. Environ. 63, 40–55. doi: 10.1016/j.buildenv.2013.01.024
International Energy Agency [IEA] (2019). Southeast Asia Energy Outlook. Available online at: https://www.iea.org/reports/southeast-asia-energy-outlook-2019 (accessed December 20, 2019).
International Organization for Standardization [ISO] (1994). ISO 7730. Moderate Thermal Environments: Determination of the PMV and PPD Indices and Specification of the Conditions for Thermal Comfort = Ambiances Thermiques Modeìreìes. Geneva: International Organization for Standardization.
International Organization for Standardization [ISO] (1998). ISO 7726. Ergonomics of the Thermal Environment — Instruments for Measuring Physical Quantities. Geneva: International Organization for Standardization.
International Organization for Standardization [ISO] (2007). ISO 9920. Ergonomics of the Thermal Environment — Estimation of Thermal Insulation and Water Vapour Resistance of a Clothing Ensemble. Geneva: International Organization for Standardization.
Jaakkola, J. J. K., Heinonen, O. P., and Seppänen, O. (1989). Sick building syndrome, sensation of dryness and thermal comfort in relation to room temperature in an office building: need for individual control of temperature. Environ. Int. 15, 163–168. doi: 10.1016/0160-4120(89)90022-90026
Jitkhajornwanich, K., and Pitts, A. C. (2002). Interpretation of thermal responses of four subject groups in transitional spaces of buildings in Bangkok. Build. Environ. 37, 1193–1204. doi: 10.1016/S0360-1323(01)00088-89
Kofoworola, O. F., and Gheewala, S. H. (2009). Life cycle energy assessment of a typical office building in Thailand. Energ. Build. 41, 1076–1083. doi: 10.1016/j.enbuild.2009.06.002
Kottek, M., Jürgen, G., Christoph, B., Bruno, R., and Franz, R. (2006). World map of the Köppen-Geiger climate classification updated. Meteorol. Zeitschr. 15, 259–263. doi: 10.1127/0941-2948/2006/0130
Marmot, A. F., Eley, J., Stafford, M., Stansfeld, S. A., Warwick, E., and Marmot, M. G. (2006). Building health: an epidemiological study of “sick building syndrome” in the Whitehall II study. Occup. Environ. Med. 63, 283–289. doi: 10.1111/j.1600-0668.2009.00592.x
Mendell, M. J., and Mirer, A. G. (2009). Indoor thermal factors and symptoms in office workers: findings from the US EPA BASE study. Indoor Air 19, 291–302. doi: 10.1111/j.1600-0668.2009.00592.x
Mustapa, M. S., Zaki, S. A., Rijal, H. B., Hagishima, A., and Ali, M. S. M. (2016). Thermal comfort and occupant adaptive behaviour in Japanese university buildings with free running and cooling mode offices during summer. Build. Environ. 105, 332–342. doi: 10.1016/j.buildenv.2016.06.014
Nakashima, Y. (2013). Climate change policies in Japan / What are COOL BIZ and WARM BIZ? Jpn. Environ. Quart. 3, 2–3.
Reinikainen, L. M., and Jaakkola, J. J. K. (2001). Effects of temperature and humidification in the office environment. Arch. Environ. Health 56, 365–368. doi: 10.1080/00039890109604469
S.P.R.I.N.G (2009). CP 553: 2009. Code of Practice for Mechanical Ventilation and Air conditioning in Buildings. Singapore: Building and Construction Standards Committee.
Sattayakorn, S., Masayuki, I., and Rumiko, S. (2017). Clarifying thermal comfort of healthcare occupants in tropical region: a case of indoor environment in Thai hospitals. Energ. Build. 149, 45–57. doi: 10.1016/j.enbuild.2017.05.025
Sekhar, S. C. (2016). Thermal comfort in air-conditioned buildings in hot and humid climates - Why are we not getting it right? Indoor Air 26, 138–152. doi: 10.1111/ina.12184
Sikram, T., Ichinose, M., and Sasaki, R. (2019). Thermal adaptive behavior of occupants in air-conditioned office buildings in Thailand. IOP Conf. Ser. Earth Environ. Sci. 294:12082. doi: 10.1088/1755-1315/294/1/012082
Sikram, T., Masayuki, I., and Rumiko, S. (2018). “Relationship between clothing insulation and thermal comfort of occupants in air-conditioned offices in Thailand,” in Proceedings of the 34th International Conference on Passive and Low Energy Architecture Passive and Low Energy Architecture [PLEA], Hongkong.
Tan, C. K. (2008). Cool United Nations - Our World. Available online at: https://ourworld.unu.edu/en/cool-united-nations (accessed August 26, 2008).
Thach, T.-Q. Q., Dhiya, M., Gerard, D., Nuraini, N., Yichi, Z., Christina, E. H. T., et al. (2019). Prevalence of sick building syndrome and its association with perceived indoor environmental quality in an Asian multi-ethnic working population. Build. Environ. 166:106420. doi: 10.1016/j.buildenv.2019.106420
The Engineering Institute of Thailand Under H M The King’s Patronage [EIT] (2016). Air Conditioning and Ventilation Standard, 3rd Edn, Bangkok: EIT.
Weather Underground (2019a). Singapore, Central Region, Singapore Weather History. Available online at: https://www.wunderground.com/history/daily/sg/singapore (accessed December 2, 2019).
Weather Underground (2019b). Underground, Weather. Bangkok, Bangkok Metropolitan Region, Thailand Weather History. Available online at: https://www.wunderground.com/history/daily/th/bangkok (accessed December 2, 2019).
World Health Organization [WHO] (1990). Indoor Environment: Health Aspects of Air Quality, Thermal Environment, Light and Noise. Geneva: World Health Organization.
Keywords: thermal comfort, indoor environment, building-related symptoms, air-conditioned office, tropical region
Citation: Sikram T, Ichinose M and Sasaki R (2020) Assessment of Thermal Comfort and Building-Related Symptoms in Air-Conditioned Offices in Tropical Regions: A Case Study in Singapore and Thailand. Front. Built Environ. 6:567787. doi: 10.3389/fbuil.2020.567787
Received: 30 May 2020; Accepted: 09 October 2020;
Published: 05 November 2020.
Edited by:
Runa T. Hellwig, Aalborg University, DenmarkReviewed by:
Asit Kumar Mishra, Berkeley Education Alliance for Research in Singapore (BEARS), SingaporeGearoid Patrick Lydon, ETH Zürich, Switzerland
Copyright © 2020 Sikram, Ichinose and Sasaki. This is an open-access article distributed under the terms of the Creative Commons Attribution License (CC BY). The use, distribution or reproduction in other forums is permitted, provided the original author(s) and the copyright owner(s) are credited and that the original publication in this journal is cited, in accordance with accepted academic practice. No use, distribution or reproduction is permitted which does not comply with these terms.
*Correspondence: Tanadej Sikram, tanadej.si@gmail.com
 Tanadej Sikram
 Masayuki Ichinose
 Rumiko Sasaki