 Shijia Pan
 Mario Berges
 Juleen Rodakowski
 Pei Zhang
 Hae Young Noh
- 1Computer Science and Engineering, University of California, Merced, Merced, CA, United States
- 2Civil and Environmental Engineering, Carnegie Mellon University, Pittsburgh, PA, United States
- 3Department of Occupational Therapy, University of Pittsburgh, Pittsburgh, PA, United States
- 4Electrical and Computer Engineering, Carnegie Mellon University, Mountain View, CA, United States
- 5Civil and Environmental Engineering, Stanford University, Stanford, CA, United States
Non-intrusive monitoring of fine-grained activities of daily living (ADL) enables various smart healthcare applications. For example, ADL pattern analysis for older adults at risk can be used to assess their loss of safety or independence. Prior work in the area of ADL recognition has focused on coarse-grained ADL recognition at the context-level (e.g., cooking, cleaning, sleeping), and/or activity duration segmentation (hourly or minutely). It also typically relies on a high-density deployment of a variety of sensors. In this work, we target a finer-grained ADL recognition at the action-level to provide more detailed ADL information, which is crucial for enabling the assessment of patients' activity patterns and potential changes in behavior. To achieve this fine-grained ADL monitoring, we present a heterogeneous multi-modal cyber-physical system, where we use (1) distributed vibration sensors to capture the action-induced structural vibrations and their spatial characteristics for information aggregation, and (2) single point electrical sensor to capture appliance usage with high temporal resolution. To evaluate our system, we conducted real-world experiments with multiple human subjects to demonstrate the complementary information from these two sensing modalities. Our system achieved an average 90% accuracy in recognizing activities, which is up to 2.6× higher than baseline systems considering each state-of-the-art sensing modality separately.
1. Introduction
The Internet of Things (IoT) and its rapid development enables various smart home applications that have the potential to support independent living for older adults (Azimi et al., 2017; Kokku, 2017). Engagement in activities of daily living (ADL) is an important metric for these smart home applications to monitor, as engagement in ADL is associated with the risk of disability and all-cause mortality for older adults (Wu et al., 2016). One way that variation in an ADL can be detected is by the length of time or missed steps within an ADL. For example, an older adult with cognitive impairments may insidiously decline in the engagement of ADL (e.g., take longer to perform an ADL or miss-steps within an ADL) as their cognitive impairments progress (Rodakowski et al., 2014). Non-intrusive, fine-grained and in-home ADL monitoring provides a critical platform to detect variation in ADL and ensure safety and independence in the home.
Prior work in ADL monitoring mainly focuses on duration segmentation and type recognition to describe ADL patterns. ADL duration segmentation relies on the dense deployment of sensors that capture a sequence of human interaction with ambient objects (e.g., drawers, doors) to determine the duration of an activity (Kodeswaran et al., 2016a,b). Activity type recognition methods leverage learning algorithms to improve the accuracy and robustness for classifying given sensing signals (Castanedo, 2013; De-La-Hoz-Franco et al., 2018). Combined, these efforts focus on context-level information with the time-resolution of minute or hour, which is coarse-grained. It is indeed challenging to achieve fine-grained, which we define as sub-second-level and event/action-level, ADL recognition non-intrusively and sparsely because each ADL consists of several events or actions. Nonetheless, fine-grained ADL monitoring provides detailed ADL action information, which enables a nuanced understanding of ADL patterns and, most importantly, provides knowledge of when changes in ADL patterns occur. A potential change in ADL patterns may be an indication of changes in disease status or safety for living independently. Prior attempts for fine-grained ADL monitoring combine electrical sensors and passive RFID sensors, where the on-wrist RFID provides locations and an electrical sensor provides appliance usage information. These methods (e.g., Fortin-Simard et al., 2014) require high-density sensor deployment and people carrying devices or tags during their activities. Older adults, especially those with cognitive impairments, may find it difficult to remember to wear or uncomfortable to wear such devices.
Two lines of research suggest that structural vibration and electrical load monitoring provide distinct and unique information about ADL patterns. On the one hand, researchers have noted that when people interact with their ambient environments their actions induce the structures to vibrate, and have used this vibration to infer various types of information (Pan et al., 2017b; Mirshekari et al., 2018) including the action (or motion) of the person (Fagert et al., 2017; Bonde et al., 2020). The distributed vibration sensors also provide spatial information in terms of indoor activities. Additionally, non-intrusive load monitoring methods have been shown to detect appliance usage duration (Berges et al., 2008) from aggregate measurements at the main electrical meter. The load monitoring sensor provides high temporal resolution appliance usage detection and recognition. Thus, we combine these two complementary non-intrusive and passive sensing modalities to cover two important aspects of ADL patterns—occupant action and appliance usage—with fine granularity.
Our system conducts event detection and event-based ADL recognition on these two sensing modalities. The system integrates these estimates over high-resolution time windows using an ensemble algorithm (Pan et al., 2019). The contributions of this work are as follows:
• We introduce a fine-grained (sub-second-level, event/action-level) ADL detection and recognition system using structural vibration and electrical sensing.
• We present an event-based ADL detection and recognition framework, and an ensemble algorithm to fuse ADL predictions from structural vibration and electrical sensing.
• We conduct real-world experiments to evaluate our systems and demonstrate its effectiveness and complementary nature of the selected sensing modalities.
In this extended version, we further highlight the complementary analysis on the spatiotemporal characteristics of the multimodal sensing configuration. The rest of the paper is organized as follows. Section 2 discusses the related work and contrast it to our approach. Then, section 3 presents the design of our system in detail. Next, section 4 demonstrates the results and analysis of real-world experiments and evaluations. Section 7 discusses limitations as well as future directions. Finally, we conclude in section 8.
2. Related Work
In this section, we introduce the related work in the domain of the Internet of Things (IoT). We summarize prior work on sensing systems and learning algorithms in three categories.
2.1. Multi-Modal ADL Monitoring Systems
Various cyber-physical sensing systems targeting ADL monitoring have been explored, including both coarse- and fine- grained ADL.
2.1.1. Coarse-Grained (Context-Level) ADL
Kokku et al. proposed the concept of activity signatures in the smart home environment with a variety of sensors (Kodeswaran et al., 2016a,b; Kokku, 2017). They leveraged temporal-, sensor-, and frequency-cut to determine the activity segments at the context-level, e.g., sleeping, bathing, eating. Their context-level activity segment is relatively coarse-grained, and in this work we target action-level fine-grained activity.
2.1.2. Fine-Grained (Action-Level) ADL
Fortin-Simard et al. fused electrical load and the passive RFID sensors to achieve home activity recognition, where the on-wrist RFID provides locations and electrical load sensor provides appliance usage information (Fortin-Simard et al., 2014). Moriya et al. explored this direction with Echonet Lite (Moriya et al., 2017). These systems allowed fine-grained activities monitoring. However, they either require dense deployments or people to wear devices, which may not be practical for the elderly with dementia. Compared to them, our system is device-free and can detect more types of movements without requiring human subjects to wear any device nor dense deployment on each monitored appliance.
2.2. Structural Vibration-Based Human Sensing
Structural vibration signals have been used for human information acquisition in a passive and non-intrusive way. It has been explored to obtain occupant information (Poston et al., 2017) including identity (Pan et al., 2017b), location (Mirshekari et al., 2018), heart rate (Jia et al., 2017), hand washing activities (Fagert et al., 2017), office activities (Bonde et al., 2020), etc. When the occupant interacts with ambient objects, such as floor, table, walls, bed, sink, etc., the interactions induce the structure to vibrate in a unique way such that their frequency components reflect the mode excited by different excitation sources (Fagert et al., 2017). Compared to other sensing modalities, it does not require that the user wear a device and, as a result, it allows ubiquitous indoor activity monitoring.
2.3. Electrical Sensing for Appliance Usage Monitoring
Non-Intrusive Load Monitoring (NILM) has been explored as an efficient way to monitor in-home appliance usage and related activities by disaggregating the total electrical usage of a building into its constituent components (i.e., appliances) (Hart, 1992; Liao et al., 2014). Though the field has largely focused on inferring appliance usage using a variety of different approaches [e.g., voltage noise (Patel et al., 2007; Froehlich et al., 2010; Gupta et al., 2010), harmonic power (Berges et al., 2008; Giri et al., 2013), etc.] new research has started to look into derivative objectives, such as fault detection and diagnosis of appliance patterns and, relevant to this work, monitoring ADLs (e.g., Alcala et al., 2017).
Accurate detection and recognition of different appliance usage is an important aspect of ADL monitoring, and these prior works have shown the feasibility and robustness of the recognition. As a result, we believe the combination of structural vibration and electrical load covers two important aspects of human activity in home scenarios—with or without using appliances. We focus on the combination of these two non-intrusive sensing modalities.
3. System Design
To achieve non-intrusive fine-grained ADL detection and recognition for long-term monitoring, we measure two essential aspects of in-home activity—human actions (via structural vibration sensor) and appliances usage (via electrical sensor). As shown in Figure 1, our system first obtains signals from both structural vibration and electrical sensors. Then, it conducts event detection on signals from each sensor. Next, the system classifies the activities at the event-level. Finally, our system conducts an event-based prediction ensemble to provide accurate recognition for sub-second time windows.
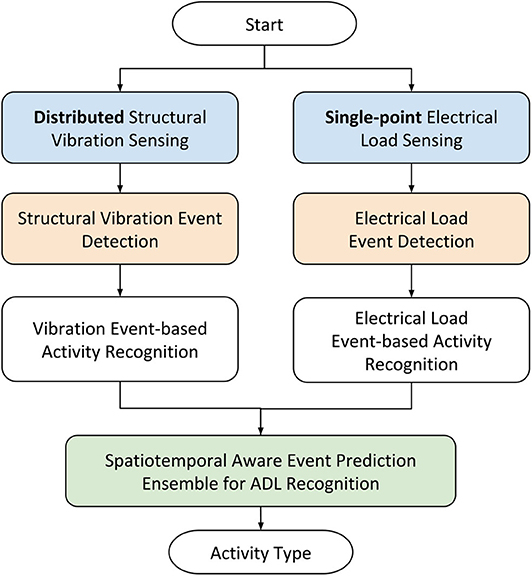
Figure 1. System overview.
3.1. Complementary Sensing Modalities
To achieve non-intrusive monitoring for smart home applications, we selected structural vibration and electrical sensor as the primary sensing modalities. These two sensing modalities are selected because they are both non-intrusive—indirectly inferring activities instead of directly measuring—and complementary with each other. Table 1 lists the different aspects of their complementary properties.
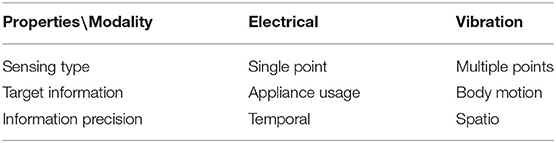
Table 1. Complementary sensing modalities.
The structural vibration sensing captures the human interaction with the ambient environment, which is mostly the impulsive excitation (Fagert et al., 2017; Han et al., 2017; Pan et al., 2017b; Poston et al., 2017; Mirshekari et al., 2018). It also captures the appliance machinery vibration, such as a motor or a compressor, as well as appliance usage induced vibration, such as water or food boiling. The structural vibration sensing system often consists of multiple sensors, each covers a range of 3–5 m radius. As a result, these sensors of different deployment locations can provide the spatial information of the activity when they collaboratively conduct the estimation.
On the other hand, the electrical sensor precisely detects the appliance usage time and duration, which the structural vibration sensing may not (Hart, 1992; Parson et al., 2012; Giri et al., 2013; Song et al., 2014). Since each appliance usage can trigger immediate changes in voltage signals, they can be accurately detected by the electrical load sensor when they are turned on or off. As a result, the electrical load sensing provides appliance usage information with high temporal precision.
Since the appliance usage, as well as human motion or interaction with the appliance, are the two significant aspects of human activities (Fortin-Simard et al., 2014; Moriya et al., 2017). Considering their advantage of capturing the spatial and temporal characteristics of these target activities, we believe that these two sensing modalities are complimentary for our purpose.
3.2. Sensing System
Our sensing system consists of structural vibration sensing and electrical sensing. The load sensor measures the appliances. The primary structural surfaces (e.g., the countertop and the floor) are equipped with vibration sensors to capture human action caused vibration.
3.2.1. Structural Vibration Sensing
The structural vibration can be used to infer the occupants' actions causing the vibration. When people interact with objects or structures around them, the interaction causes the surface of the object or structure to deform (Pan et al., 2017b; Poston et al., 2017; Mirshekari et al., 2018). The surface deformation causes mechanical waves dominated by the Rayleigh-Lamb wave. These waves propagate through the structural and are captured by the sensor. Since different activities or interactions excite different modes of the structure (Fagert et al., 2017), they induce vibration with different frequency domain characteristics, which can be used as features to recognize them. We place vibration sensors on the surfaces, including floor and countertops, where the human and appliance interact directly. A vibration sensor consists mainly of three modules—a geophone that obtains the surface vibration, an amplifier module that amplifies the surface waves, and an ADC module that converts the analog signal to digital. Figure 2A shows an example of the structural vibration sensor on a countertop. The Geophone in the figure is SM-24 (Input/Output, Inc., 2006). The opamp board has a modified gain for the monitored surface.
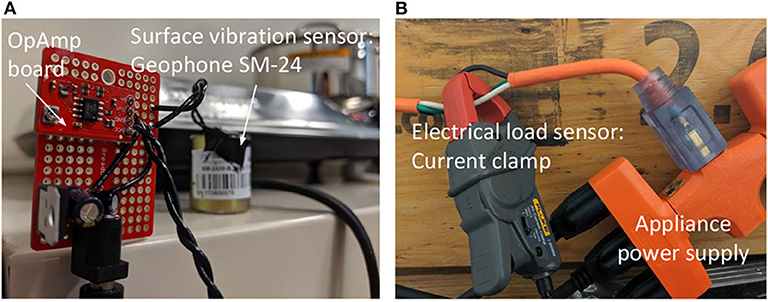
Figure 2. Structural vibration sensor and electrical load sensor used in this work. (A) Structural vibration sensor. (B) Electrical load sensing.
3.2.2. Electrical Sensing
All electrical measurements were collected using a 16-bit National Instruments (NI-9215) data acquisition interface. The current was measured with a Fluke i200 AC current clamp with a cut-off frequency of 10 kHz and voltage was measured with a Pico-TA041 Oscilloscope probe. Both measurements were done on a power strip to which all appliances in the testbed were connected to, as shown in Figure 2B. The setup we used is similar to the one used in Gao et al. (2014).
3.3. Event Detection
For each type of sensors, an event is defined as a segment of signal that has distinguishing characteristics compared to the signal segment when no human activities occur. Our system conducts event detection on raw sensor signals. The intuition is that when there are no activities—neither human interacting with the ambient environment nor appliance usage—the signals obtained by the two sensing modalities are considered as the ambient noise. We analyze the signal with a sliding window. The sliding window that covers the ambient noise signals has different signal energy distribution compared to that of an event (Pan et al., 2014). We model the sliding windows that cover the segments of signals known as ambient noise with Gaussian distribution, and we consider the tested sliding window that has significantly higher signal energy as part of an event. One event contains consecutive sliding windows that are detected as part of an event. We use anomaly detection algorithms (Pan et al., 2017b) to detect and extracts the signal segments that are not ambient noise as events. Figures 3A–C show examples of signals captured by different sensors and the events detected based on these signals. The solid green and red lines indicate the start and the end of an event, which have a significant signal energy difference compared to the ambient noise signal (the segments between x-axis 0 and 1 s). Figure 3D shows the label of the events. The event between 1 and 2 s is the interaction with the stove, which demonstrates detectable events for the countertop vibration sensor, as shown in Figure 3A. The events between 2.5 and 5 s are the footstep events, which showed a high signal to noise ratio (SNR) for the floor vibration sensor, as shown in Figure 3B. The event between 5 and 12 s is the kettle boiling water, which is consistent with the electrical load sensing detected event, as shown in Figure 3C.
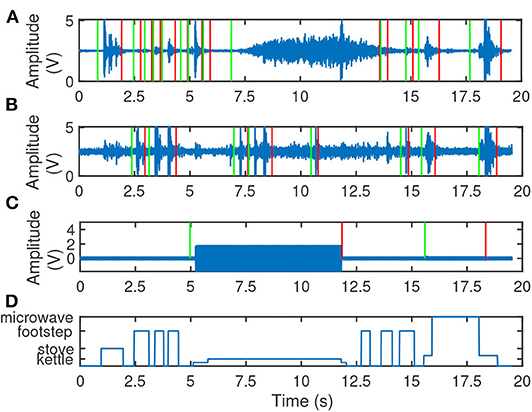
Figure 3. Examples of event detection. Solid blue lines in (A–C) are the sensor signals. Green lines mark the beginning of events, and red lines mark the end of events. (A) Countertop Vib. (B) Floor Vib. (C) Electrical load. (D) Labels.
3.4. Event-Based Activity Recognition
Our system enables non-intrusive passive sensing for action- or event-level ADL recognition. For each sensor, the system first conducts feature extraction on its detected event signal segments (section 3.4.1). These features are then used to train a classifier using the support vector machine (SVM) (section 3.4.2).
3.4.1. Feature Extraction and Normalization
For a detected event signal segment, our system extracts its frequency domain characteristics—the power spectral density—as features. We consider the power spectral density as the feature because it is efficient for both electrical load signal (section 3.4.1.1) and structural vibration sensing signal (section ??). The power spectral density is extracted from the signal segments that are normalized by their signal energy to reduce the activity completion variation from different people. For example, different people using electrical stove may turn the nob to different levels, which leads to different amplitude values for the electrical load signals.
3.4.1.1. Electrical sensing
The load sensor signals have an energy concentration approximately at 60 Hz in the frequency domain. It is because the local alternating current is 60 Hz. On the other hand, the non-linear loads in the circuit often induce the current harmonics, which is unique for the particular circuit of the appliance. As a result, the current harmonics induce frequency characteristics that are distinguishable for different appliances. Therefore, for events extracted from electrical sensing signals Event_Loadi, where i = 1...Nload, Nload is the number of events detected by the electrical load sensor, we first normalize the signal by its energy to reduce the variation caused by different appliance usage duration. Figure 4 shows the examples of the electrical load signal from different events. Appliances, such as kettle and stove are mainly linear load, while appliances, such as microwave have unique current harmonics due to their non-linear load.
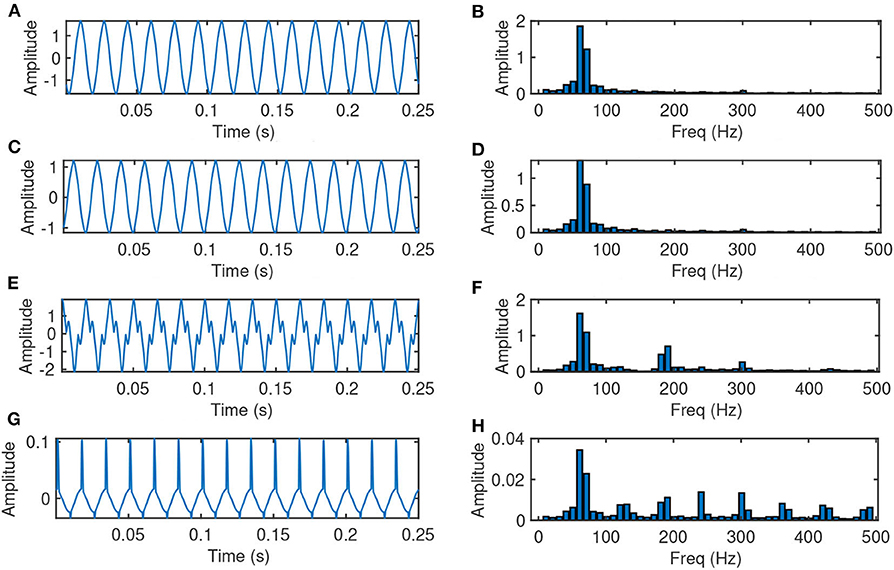
Figure 4. Examples of electrical load sensing events (normalized by the signal energy). (A) Kettle, time domain. (B) Kettle, freq domain. (C) Stove, time domain. (D) Stove, freq domain. (E) Microwave door, time domain. (F) Microwave door, freq domain. (G) Microwave, time domain. (H) Microwave, freq domain.
For appliances that are mainly linear load, i.e., their frequency components do not show current harmonics, which may make the accurate classification difficult with only features from the electrical load sensor. For example, the kettle and stove load signal shown in Figures 4B,D demonstrate similar frequency characteristics. In this case, we further explore the vibration signal captured during the same time duration of Event_Loadi. Figure 5 shows the time and frequency components during the period of time for stove and kettle events. We observe that even the electrical load signals in these cases do not show significant distinguishing characteristics, their vibration signal demonstrate a clear difference in the frequency domain. Therefore, our system extracts the signal of the same time duration of Event_Loadi from vibration sensors where the monitored surface has multiple appliances on it. We refer to this signal segment as Event_Load_Vibi,j, where j = 1...Smulti, and Smulti is the number of surfaces that has multiple appliances on them. Note that for signals collected from vibration sensors, the signal segment of the same time duration may not be detected as an event or a part of an event. The system takes the frequency domain characteristics of Event_Loadi and Event_Load_Vibi,j and concatenate them as the feature for the ith event detected by the electrical load sensor.
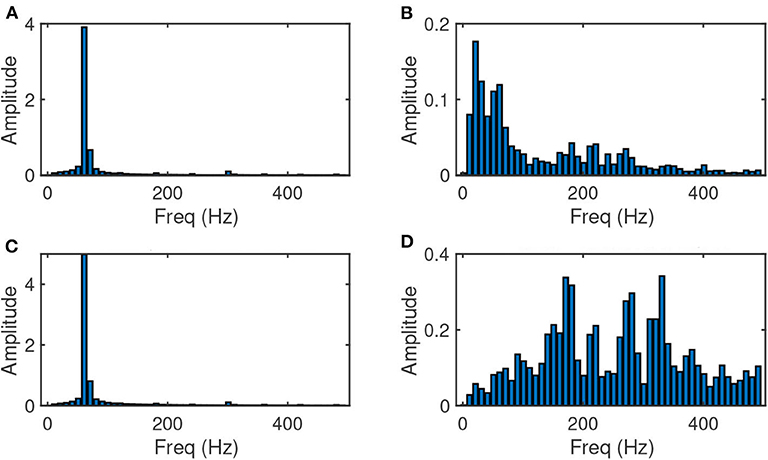
Figure 5. Examples of complementary electrical load sensing events (normalized by the signal energy). (A) Stove, electrical features. (B) Stove, vibration features. (C) Kettle, electrical features. (D) Kettle, vibration features.
3.4.1.2. Structural vibration sensing
Various human actions cause different parts of the structural surface to vibrate. Most of the human interaction with an ambient surface is impulsive, meaning the interaction excites the surface and induces vibrations dominated by the Rayleigh-Lamb waves (Pan et al., 2017a). For varying excitations occurring on the same surface, they will generate different responses in the natural frequencies of the surface structure (Fagert et al., 2017). For the events detected by vibration sensor on surface k during ti, we refer to this signal segment as Event_Vibk,i, where i = 1...Nvib, k ∈ [1...Nsurface]. Nvib is the number of events detected by the vibration sensor on the kth surface. Nsurface is the number of monitored surfaces.
To take into account the spatial characteristics of the signal, we further extract the signal segment of the same time duration ti of Event_Vibk,i from vibration sensors on another surface l, which we refer to as Event_Vib_Vibk,l,i, where l = 1...Nsurface, l ≠ k. Our system extracts the frequency components of Event_Vibk,i and Event_Vib_Vibk,l,i after normalizing the signal by energy, and concatenates the frequency components as the features for the ith event on surface k.
3.4.2. Classification With Support Vector Machine
Our system utilizes support vector machine (SVM) (Chang and Lin, 2011) to conduct the classification for the events detected by each sensor. SVM is a widely used classifier, and it aims to find the maximum-margin hyperplane w by minimizing the following loss function (for binary classification):
where (y1, x1), …(yl, xl) is training data, are training samples, yi = ±1, ∀i are training labels, and C is the penalty parameter that controls the generalization of the model. Based on our feature analysis, which will be introduced in detail later in section 5.2, features of events detected by vibration sensors are not linearly separable. As a result, our system trains the non-linear SVM model using the kernel function ϕ(·) (RBF kernel) to ensure the high class separability. Since we have more than two types of activities to classify, we decompose the multi-class classification problem to two-class classification problems to solve (Hsu and Lin, 2002; Chang and Lin, 2011).
3.5. Ensemble Events for ADL Recognition
Once the system obtains the event-based classification predictions from each sensor, it further conducts prediction ensemble on the sliding window at a sub-second level, and then outputs the activity recognition at the event-level as shown in Figure 6. Since the type and duration of events detected by different sensors vary, the ensemble occurs at a sub-seconds sliding window level instead of the event-level. We selected the sliding window that is smaller than a single impulsive structural vibration signal segment empirically.
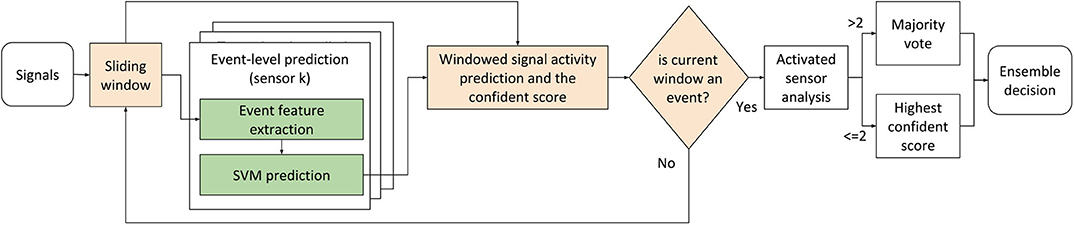
Figure 6. Ensemble algorithm.
Our system first applies a sliding window through the target sensing time duration. For each sliding window on the signal from each sensor, our system assigns it as an event if the majority of the samples are part of a detected event. Since we use the SVM to predict the event categories, a confidence score between 0 and 1 can be calculated based on the distance between the data point and the margin (Chang and Lin, 2011). Therefore, for a sliding window of a particular event, we also assign the prediction score to it.
For each window, the system collects the prediction values and confidence scores from all sensors. The system first conducts a weighted majority vote if more than two sensors predict the window as an event. The weights are assigned equally over vibration sensors on each surface and the electrical load sensor. For example, if there are multiple sensors on the same surface, e.g., floor, the information from the multiple sensors will be combined. In addition, since different sensors may detect different event durations and types, there may be no more than two sensors detecting an event within a sliding window. When that happens, the system outputs the single sensor decision with the highest prediction score as the final decision of the system instead of conducting a majority vote.
4. Experiments
To evaluate our system, we facilitated engagement in ADL through real-world experiments with multiple appliances in a kitchen scenario. In this section, we first define the ADL, at the event-level, that were conducted in the kitchen in the scenario in section 4.1. Then, we introduce the experimental setup and data collection procedure in section 4.2. Next, we demonstrate the statistics of the collected dataset in section 4.3. Finally, we explain the ground truth collection and data labeling procedure in section 4.4.
4.1. Kitchen Scenario Definition
The performance of ADL is critical to ensure safety and independence in the home. Changes in ADL are associated with disability and institutionalization. The Lawton Instrumental Activities of Daily Living Scale is a commonly used tool to assess the elderly's ability to live independently (Lawton, 2000). Critical components of the Lawton tool include food preparation and housekeeping.
We focused on tasks related to meal preparation and housekeeping and they are in Table 2 below. We assessed these ADL in adults with no identified physical or cognitive impairments, as the intent of this study was the detection of normal ADL. The table depicts how the structural vibration sensors and electrical load sensors detect different events within the same ADL.
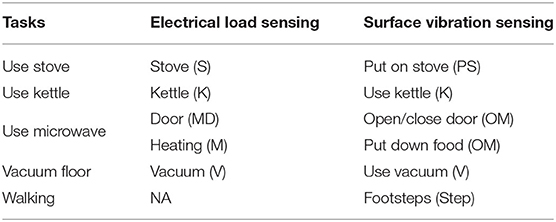
Table 2. Target kitchen activities and their acronyms.
4.2. Experimental Setup and Data Collection
We conducted real-world experiments in a kitchen setup in laboratory to evaluate our system. The experiments follow the guideline of the IRB protocol. Figure 7A shows the photos of the experiments, and (B) shows the schematic of the setup. The experiment setup is on a wooden floor structure with an area of 10 × 7 ft. We setup a countertop with three appliances—electrical stove, a kettle, and a microwave on it. There is a vacuum cleaner on the side of the floor as shown in Figure 7B.
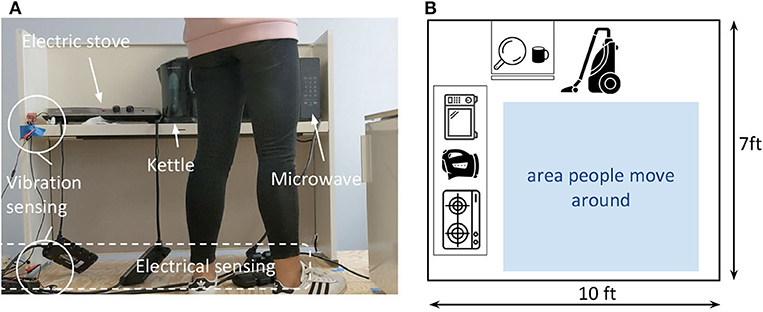
Figure 7. Experimental setup. (A) Side view of the experiment setup, photo. (B) Top view of the experiment setup.
We used two distributed structural vibration sensors to monitor the target area, and we placed one on the countertop and one on the floor, as circled out in Figure 7. We used one single-point electrical load sensor to monitor the load of a power strip, where we connect the target appliances—stove, kettle, microwave, and vacuum. We also provide a pot to boil water on the stove, and a mug to heat water using the microwave.
In total, five human subjects are invited to conduct the experiments and we refer to them as P1 to P5. For each trial of data collection, we require the participant to conduct a sequence of tasks listed in Table 2. The details of the task procedures are as follows:
• use stove: the participant takes the pot, puts it on the stove, turns on the stove, and then turns off the stove after about 20 s.
• use kettle: the participant puts down the kettle, turns on the kettle, and then turns off the kettle after about 20 s.
• use microwave: the participant opens the microwave door, puts the cup in it, closes the microwave door and turns it on for about 30 s.
• vacuum floor: the participant picks up the vacuum cleaner, turns on the machine, vacuums the area marked in blue square in Figure 7B, and turns off the machine.
P1 and P2 conducted all the activities in each trials. P3, P4, and P5 conducted a subset of the activities based on their preference. For example, in some trials if they select to use the stove for cooking, they will not use the microwave, and vice verse. For each participant, we collect five trials of activity data.
4.3. Dataset Statistics
We further analyze the collected and labeled data in terms of event duration and number. Figure 8 demonstrates the corresponding stats from the data collected from the two people who conducted all target types of activities. The blue bars show the overall event duration and the red bars show the count of each type of events conducted over the eight target fine-grained activities. We can observe a clear bias in both event duration and number. Furthermore, this bias is also not consistent over the type of events. For example, kettle usage (K) has the highest overall duration, but the number of events is relatively low. On the other hand, the number of footsteps is high, while its duration is low due to the short period of events for each footstep. Therefore, if we compare all the events' activity recognition accuracy in either event duration or number, it will be biased.
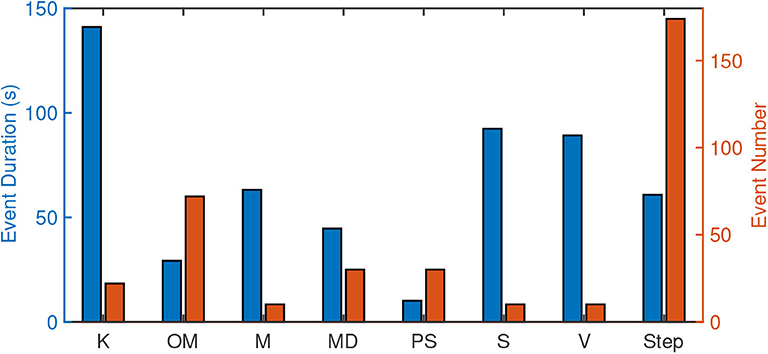
Figure 8. Experiment data stats.
4.4. Ground Truth and Labeling
We use a camera to record experiments as the ground truth. The video records from the angle below the waist so that the identity of the human subjects is not recorded. Figure 7 shows an example view of the ground truth recording. The events listed in Table 2 are labeled on a frame by frame basis manually.
5. Module Performance Analysis
In this section, we evaluate the individual performance of event detection module in section 5.1 and event-based activity recognition module in section 5.2. For module performance analysis, P1 and P2's data is used since they performed all types of target events.
5.1. Event Detection Analysis
5.1.1. Baseline and Metrics
We use detection with signals from only one sensor as baselines and compare it to our ensemble event detection. Since the dataset is biased in terms of event duration and event number, we evaluate the event detection by both event level and sample level detection accuracy. For each labeled event, we extract their indexes of [E1...EL], where L is the sample number in the event. For the evaluated signal, we extract the detection event indexes [DA1...DAM], where M is the sample number of the detected event. If the majority elements of the segment are part of an event, i.e., the number of samples in [DA1...DAM] ∩ [E1...EL] is larger than L/2, we consider this event detected and we report the true positive rate. . At the sample-level, we calculate their precision and recall as metrics to evaluate the detection module. and . Based on the calculated precision and recall, we further report the sample-level F-1 score .
5.1.2. Event-Level Detection Accuracy
To avoid the bias over different event duration and number, we first compare the detection rate of each type of activities at the event level. The vibration sensors on different surfaces are sensitive to events with different spatial characteristics. For events that occur on the floor, the floor vibration sensor demonstrates higher accuracy—Detect.Accevent for vacuum and walking are respectively 90 and 87%. For the activity occur on the countertop, the vibration sensor on the countertop achieves higher accuracy—Detect.Accevent for operating kettle, microwave, and stove are respectively 90, 93, and 100%. On the other hand, the electrical load sensor achieves the highest accuracy for events of appliances usage—Detect.Accevent for turn on the microwave, open the microwave door, turn on the stove, and turn on the vacuum are respectively 100, 97, 100, and 100%. The average detection rates over eight types of events are 62, 44, 65, and 97% in respectively for the three single sensor baselines and our approach, which is 1.5× to 2.2× improvement compared to the baselines.
5.1.3. Sample-Level Detection Accuracy
The electrical load sensor achieves a mean Detect.Precisionsample of 99%. However, because not all the activities can be measured by the electrical load sensor, its Detect.Recallsample is 52%. The vibration sensors on two surfaces showed similar precision and recall rate—the mean Detect.Precisionsample are 78 and 83% and the mean Detect.Recallsample are 60 and 59%. Because they are complementary in detecting events that occur on different surfaces, the ensemble detection achieved a mean Detect.Recallsample of 86%, which is a 1.4× improvement compared to that of only using one sensor for detection. Our approach achieves the highest F-1 score Detect.F1sample = 0.83.
5.2. Event-Based Activity Recognition Analysis
For event-level ADL recognition, different sensors perform differently due to their spatio-temporal variation even using the same classification algorithm. We conduct the classification with 80% data for training and 20% data for testing through cross-validation.
5.2.1. Metrics
We evaluate the event-based activity recognition by the classification accuracy at the event-level over each sensor. Since the number of detected events for each type of activity is biased, we report (1) the average classification accuracy as the mean of multiple types of activities recognition accuracy, , where NType = 8 is the number of types of events listed in Table 2, and (2) the overall recognition accuracy as the true positive rate of all detected events (with unbalanced numbers of events for each type), . Figure 9 demonstrates the average classification accuracy in bars, where blue, red, and yellow bars are the accuracy for electrical sensing, vibration sensor on the countertop, and vibration sensor on the floor, respectively. The dash lines are the overall recognition accuracy for the corresponding sensing modalities.
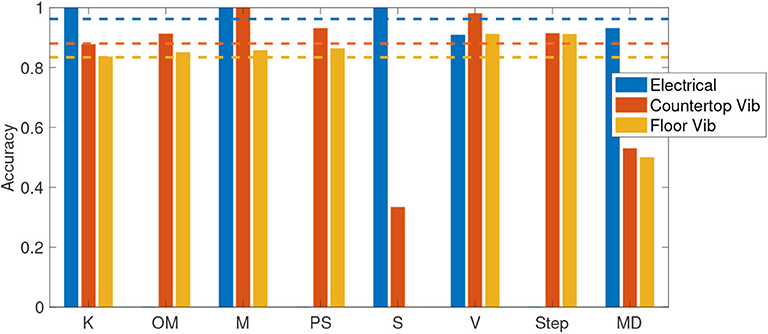
Figure 9. Event-based classification accuracy.
5.2.2. Electrical Load Sensor
The electrical load sensor achieved an All.Acc of 96.25% when only considering activities that were detected by the electrical load sensor. The error could be caused by the noise from a load of ambient appliances. The Avg.Acc for the five detectable activities (K, M, S, V, MD) is 97%. However, if we take all eight types of activities into account, this average classification accuracy drops to 61% since it cannot detect and classify the rest three activities.
5.2.3. Countertop Surface Vibration Sensor
The vibration sensor on the countertop captures all types of activities and achieved an All.Acc of 88.04%. Human actions, such as operating appliances and walking (OM, PS, V, Step), induce impulsive structural vibrations, which achieved over 90% prediction accuracy. Appliances that induce signature machinery vibration, such as the microwave (M), achieved 100% prediction accuracy. Unlike the microwave, stove (S) and kettle (K) do not cause the machinery vibration via drive motor, however, the boiling may or may not cause the vibration that can be detected by the sensor on the countertop.
The misclassification mostly occurs between the operation of the microwave (OM) and the open status of the microwave door (MD). This could be caused by the similar spatial characteristics of these events, i.e., both on the microwave, and the similar impulsive signals induced by open/close door and putting down the mug when the microwave door is open. Since the microwave door open induces a signature current change, the ensemble prediction achieves a higher accuracy when taking both sensing modalities into account. The Avg.Acc of eight types of activities with the countertop vibration sensor is 81%.
5.2.4. Floor Vibration Sensor
For the vibration sensor on the floor, we observe that most of the stove activities are misclassified as the footsteps (75%). This could be caused by the ambient impulsive floor vibration that is not induced by stove activities being captured by the sensor, i.e., people's micromotion or other building activities. We will further discuss this activity overlapping situation in the discussion section. The kettle usage, i.e., turning on/off the kettle, and the footsteps are misclassified with each other at a rate up to 13%, which could be caused by the similarity between these two types of impulses. Because when the kettle usage induced vibrations to travel through the countertop and floor structures, these structures and their contacting surface will alter the frequency components of the signal. When this happens, the spatial information extracted from fusing data from distributed sensors can increase the prediction accuracy. The Avg.Acc of eight types of activities with the floor vibration sensor is 72%.
In summary, for single sensor, the event-based activity recognition module showed over 70% average classification accuracy and over 80% overall recognition accuracy. We will further demonstrate the ensemble recognition accuracy by fusing these prediction results in section 6.
6. End-to-End System Performance Analysis
The end-to-end system outputs the sub-second sliding window level prediction. As a result, the end-to-end system performance is evaluated by this window-level ensemble activity recognition accuracy as . We first compare our ensemble approach to the state-of-the-art baselines (section 6.1) to demonstrate the importance of combining different sensing modalities. Then we further explore the robustness of the system to the variation with different temporal resolution (section 6.2) and across different human subjects whose data are not included in the training dataset (section 6.3).
6.1. Complementary Sensing Modalities Analysis
Since the ensemble activity recognition is conducted on each sliding window (section 3.5), we evaluate the prediction accuracy for sliding windows. We consider a window size of 1/8 s for the sliding window because the types of events we investigate (e.g., footstep induced vibration events) has the minimum duration that is approximate as the selected window size.
6.1.1. Compared to Single Sensor
Figure 10 demonstrates the classification accuracy for each type of activity with bars from light to dark shades representing results using (1) countertop vibration sensor, (2) floor vibration sensor, and (3) electrical sensor. Our ensemble approach is presented by green bars.
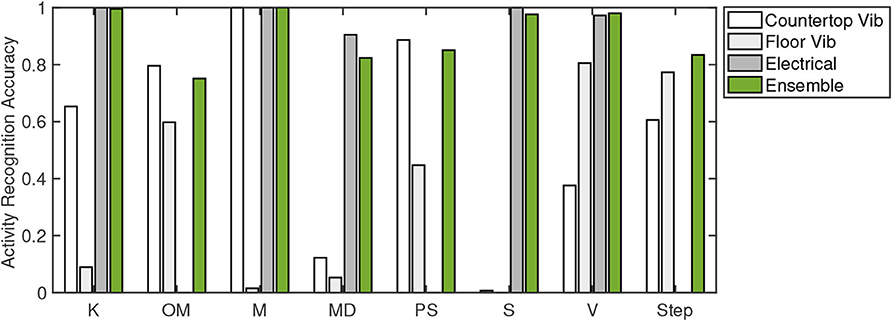
Figure 10. Sliding window level ADL recognition accuracy—compared to single sensor performance.
The observation for the three single sensor baselines are consistent with the confusion matrices discussed in section 5.2—each sensor achieves high accuracy for different events. For example, the vacuum is detected mostly by the floor vibration sensor and the electrical sensor and achieved the highest (93%) recognition accuracy among all the methods. The placing item on the stove (PS) and the stove heating (S) are detected, respectively by the vibration sensor (91%) and the electrical sensor (100%), which results in an average stove usage recognition accuracy of 45 and 50% for these two sensing modalities, and an average accuracy of 92% for our ensemble approach.
Our ensemble approach achieved the highest classification accuracy for half of the events, and the average accuracy over eight events is 90%, which is a 1.5× to 2.6× improvement compared to the baselines (56, 35, and 61%). The average values for the baselines here are calculated at the sliding window level, which is different from the average values in section 5.2 calculated at the event level.
6.1.2. Compared to Different Sensor Combinations
We further compare different sensor combinations to demonstrate the spatiotemporal complementary characteristics of the system. Figure 11 compares the activity recognition accuracy between different sensor combinations. The countertop and floor vibration combined approach achieve an average of 64% accuracy over eight types of activities, which is higher than that of the single sensor approach. It is because that the vibration sensors on two surfaces are complementary in special characteristics, which allows high confidence and accuracy for the events occurring on each surface. The single vibration and electrical load combination demonstrated a lower accuracy when detecting footsteps, interacting with microwaves and stoves. We believe these activities have significant spatial characteristics. When their spatial characteristics are fused by our ensemble approach, it captures more information that the signal characteristics from every single sensor. In summary, the complementary spatial characteristics of the vibration sensors improved the event-level ADL recognition accuracy and the complementary temporal characteristics of the two sensing modalities further increased the accuracy furthermore.
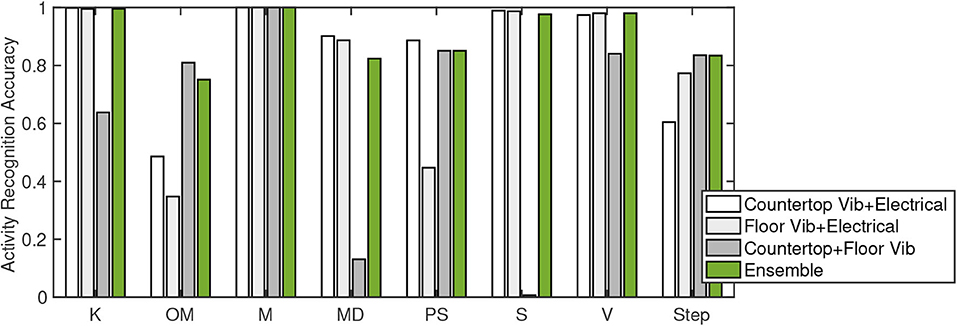
Figure 11. Sliding window level ADL recognition accuracy—sensor combination analysis.
6.2. Robust to Temporal Resolution Variation
The sliding window size determines the system output's temporal resolution. We further explored the system robustness to different temporal resolution activity recognition. We vary the window size from 2 to 1/128 s over five levels, which are 2, 1/2, 1/8, 1/32, and 1/128, respectively. Figure 12 demonstrates the system performance with x-axis as sensor combinations—three single sensors, the fusion of distributed structural vibration sensor, and our ensemble method—and y-axis as activity recognition accuracy. The accuracy calculated with different sliding window sizes are presented by different color bars. We observe that, for the baseline sensor combinations, the activity recognition accuracy has fluctuation when different window sizes are applied. On the other hand, for our ensemble algorithm, the accuracy values are stable over different window sizes. Our ensemble algorithm achieves a window-level activity recognition accuracy of 88%, which is the highest compared to the baseline combinations.
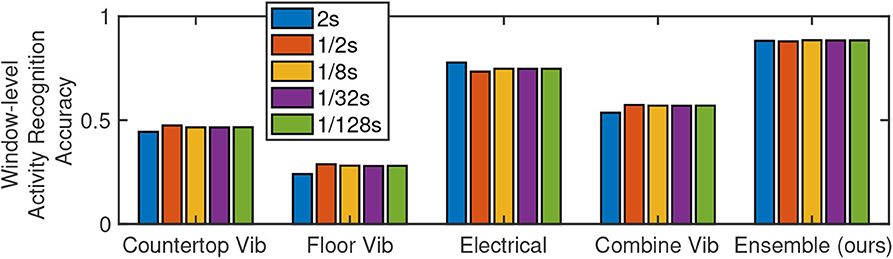
Figure 12. ADL recognition accuracy at different temporal resolution (different window sizes area used).
6.3. Robust to Personal Variation
The subject performs ADL differently in various aspects, e.g., speed, strength, interaction. As a result, their ADL may cause different signal characteristics (data distribution) (Han et al., 2017). To understand the system's robustness to the individual action variation, we further evaluate the model trained on P1 and P2's data and test it on that of the other three participants.
We plot the average classification accuracy over eight types of activities in Figure 13, where bars from light to dark shades of gray represent the accuracy for the countertop vibration sensor, the floor vibration sensor, and the electrical sensor. We further plot the accuracy for different sensor combinations in different shades of blue. Our ensemble approach is plotted as green bars.
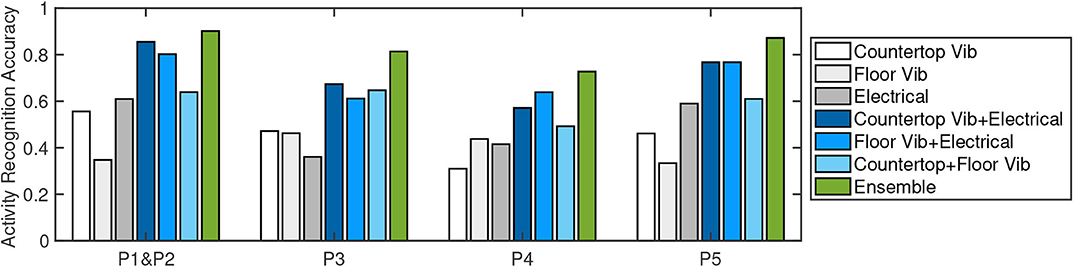
Figure 13. ADL recognition accuracy when training on two persons' data (P1 & P2) and testing on different people (P3, P4, and P5).
We can see that for different people, the accuracy of different methods varies. For example, for P5, the electrical sensor achieves higher accuracy compared to P3 and P4. While for P4, the floor vibration sensor achieves the highest accuracy among baselines. Despite the variation, three single sensor baselines for P3, P4, and P5 showed comparable accuracy (between 30 and 60%) compared to that of P1 and P2. Our ensemble approach achieves the highest accuracy compared to the baselines, which are 81, 73, and 87%, respectively for P3, P4, and P5. Compared to the case where the training and testing data are from the same person different trials, the average accuracy of the three participants drops to 80%, but it is still 20% higher than baselines when the training and testing samples are from the same person.
7. Discussion
This work highlights the potential for non-intrusive fine-grained ADL monitoring to enable ADL pattern change detection. We further discuss the current limitations and future directions in this section. The key directions we plan to further explore beyond this work include: (1) the recognition and segmentation of activities when the same person conducts different activities simultaneously (section 7.1), and (2) based on the detection and recognition, how can we conduct behavior level monitoring for long term in-home monitoring (section 7.2). Once these directions have been explored, it would also be important to explore the sensitivity of our solution to errors introduced by NILM algorithms when relying on their estimates for appliance-level measurements. We plan to collect more data under long-term in-home scenarios, which would include more types of activities and more variation over the same type of activities.
7.1. Overlapping Activities: Multiple People, Multiple Activities
When one or more persons conduct multiple activities within the same sensing area, these activities signals—in both sensing modalities—may overlap. For example, when the person is using a stove, they may walk around and use other appliances. When signal overlapping occurs, it alters the signal characteristics (i.e., features), used for classification. Prior work on disaggregating information for electrical load monitoring would allow the simultaneous appliance usage monitoring.
The direct separation of the structural vibration signal when multiple excitation sources' signal mix, however, is a challenge. Prior work on blind source separation cannot be directly applied here due to the structural dependency of the signal, which makes the assumption of signal independence invalid. Recent work on structural vibration sensing activity recognition utilizes the domain knowledge to achieve activity recognition without separating the overlapped signals (Bonde et al., 2020). However, this work target coarse-grain activities with limited categories instead of fine-grained activities we focused on.
With these prior work on overlapping activities recognition, we can further explore the association between these two sensing modalities under the activity overlapping scenarios. For example, we can combine the historical data where the non-overlapping activity with appliances used, as well as the disaggregation of the electrical sensing, to achieve fine-grained activity recognition from overlapping structural vibration signals.
7.2. Behavior Level Monitoring: Metrics and Parameters
Our aging society has a desire to independently live in the home. Non-intrusive in-home monitoring of ADL has the potential to support safety and independence for these older adults. Information patterns in engagement in ADL are critical, as engagement is known to be associated with disability, institutionalization, and all-cause mortality. With non-intrusive in-home monitoring, changes in patterns can be immediately identified and appropriate supports or care can be deployed to ensure safety and independence in the home for the older adult. This study is a step in showing that non-intrusive in-home monitoring detects ADL in adults with no known physical or cognitive limitations. These findings may be able to extend to older adults who begin to experience changes in their capacity for the performance of ADL. For example, when an older adult takes longer to engage in a cooking task or forgets to turn the stove off, non-intrusive in-home monitoring could detect a change in behavior that notifies family or health-care providers that can visit the older adult to ensure health and safety in the home.
On the other hand, changes in patterns of ADL may cause the interaction between humans and the structural changes, which may lead to data distribution change causing learning or classification error. To combat this potential limitation, continuous learning approaches may be needed to adapt to such data distribution changes. Another challenge is the metric to measure the behavior changes, especially for multilevel activity monitoring. The abnormal behavior detected at different granularity may indicate different aspects of the disease progression. A third challenge is the differences between subjects, i.e., the definition and measurement of the anomaly may vary.
8. Conclusion
We presented a non-intrusive fine-grained ADL monitoring system through ambient structural vibration and electrical sensing in this paper. We highlighted the complementary information acquisition for these two sensing modalities and how to acquire high time- and type-resolution monitoring in this work. Both pieces of information may be used for the development of smart home applications seeking to monitor engagement in ADL. Our system first conducts event-level detection and recognition and then applies an ensemble algorithm on the recognition results from each sensor over the target time period to achieve accurate event-level ADL monitoring. In the real-world experiments (common kitchen activities), our system achieved an average of 90% accuracy for ADL recognition, which is an up to 2.6× improvement compared to the baselines.
Data Availability Statement
The datasets presented in this study can be found in online repositories. The names of the repository/repositories and accession number(s) can be found below: https://doi.org/10.5281/zenodo.3745900 (Pan et al., 2020).
Ethics Statement
The studies involving human participants were reviewed and approved by CMU IRB Protocol STUDY2018-00000515. The patients/participants provided their written informed consent to participate in this study.
Author Contributions
SP, MB, JR, PZ, and HN: conception and design of the study and drafting/revising the manuscript. SP: acquisition of data and analysis and/or interpretation of data. All authors contributed to the article and approved the submitted version.
Funding
This research was supported in part by Highmark, and the National Science Foundation (under grants CMMI-1653550). The views and conclusions contained here are those of the authors and should not be interpreted as necessarily representing the official policies or endorsements, either express or implied, of UC Merced, CMU, University of Pittsburgh, Stanford, NSF, or the U.S. Government or any of its agencies. The authors declare that this study also received funding from Intel and Google. The funders were not involved in the study design, collection, analysis, interpretation of data, the writing of this article or the decision to submit it for publication.
Conflict of Interest
The authors declare that the research was conducted in the absence of any commercial or financial relationships that could be construed as a potential conflict of interest.
Acknowledgments
This paper was an expanded version of Fine-Grained Recognition of Activities of Daily Living through Structural Vibration and Electrical Sensing in the Proceedings of the 6th ACM International Conference on Systems for Energy-Efficient Buildings, Cities, and Transportation, New York, 13 November 2019.
References
Alcala, J., Urena, J., Hernandez, A., and Gualda, D. (2017). Assessing human activity in elderly people using non-intrusive load monitoring. Sensors 17:351. doi: 10.3390/s17020351
Azimi, I., Rahmani, A. M., Liljeberg, P., and Tenhunen, H. (2017). Internet of things for remote elderly monitoring: a study from user-centered perspective. J. Amb. Intell. Hum. Comput. 8, 273–289. doi: 10.1007/s12652-016-0387-y
Berges, M., Goldman, E., Matthews, H. S., and Soibelman, L. (2008). Training load monitoring algorithms on highly sub-metered home electricity consumption data. Tsinghua Sci. Technol. 13, 406–411. doi: 10.1016/S1007-0214(08)70182-2
Bonde, A., Pan, S., Mirshekari, M., Ruiz, C., Noh, H. Y., and Zhang, P. (2020). “OAC: overlapping office activity classification through iot-sensed structural vibration,” in Proceedings of the International Conference on Internet of Things Design and Implementation (Sydney, NSW). doi: 10.1109/IoTDI49375.2020.00028
Castanedo, F. (2013). A review of data fusion techniques. Sci. World J. 2013, 1–19. doi: 10.1155/2013/704504
Chang, C.-C., and Lin, C.-J. (2011). Libsvm: a library for support vector machines. ACM Trans. Intell. Syst. Technol. 2:27. doi: 10.1145/1961189.1961199
De-La-Hoz-Franco, E., Ariza-Colpas, P., Quero, J. M., and Espinilla, M. (2018). Sensor-based datasets for human activity recognition-a systematic review of literature. IEEE Access 6, 59192–59210. doi: 10.1109/ACCESS.2018.2873502
Fagert, J., Mirshekari, M., Pan, S., Zhang, P., and Noh, H. Y. (2017). Monitoring hand-washing practices using structural vibrations. Struct. Health Monit. 2017, 1–10. doi: 10.12783/shm2017/14133
Fortin-Simard, D., Bilodeau, J.-S., Gaboury, S., Bouchard, B., and Bouzouane, A. (2014). “Human activity recognition in smart homes: combining passive RFID and load signatures of electrical devices,” in 2014 IEEE Symposium on Intelligent Agents (IA) (Orlando, FL: IEEE), 22–29. doi: 10.1109/IA.2014.7009454
Froehlich, J., Larson, E., Gupta, S., Cohn, G., Reynolds, M., and Patel, S. (2010). Disaggregated end-use energy sensing for the smart grid. IEEE Perv. Comput. 10, 28–39. doi: 10.1109/MPRV.2010.74
Gao, J., Giri, S., Kara, E. C., and Berges, M. (2014). “PLAID: a public dataset of high-resoultion electrical appliance measurements for load identification research: demo abstract,” in Proceedings of the 1st ACM Conference on Embedded Systems for Energy-Efficient Buildings (New York, NY: ACM), 198–199. doi: 10.1145/2674061.2675032
Giri, S., Berges, M., and Rowe, A. (2013). Towards automated appliance recognition using an emf sensor in nilm platforms. Adv. Eng. Inform. 27, 477–485. doi: 10.1016/j.aei.2013.03.004
Gupta, S., Reynolds, M. S., and Patel, S. N. (2010). “Electrisense: single-point sensing using EMI for electrical event detection and classification in the home,” in Proceedings of the 12th ACM International Conference on Ubiquitous Computing (Copenhagen: ACM), 139–148. doi: 10.1145/1864349.1864375
Han, J., Pan, S., Sinha, M. K., Noh, H. Y., Zhang, P., and Tague, P. (2017). “Sensetribute: smart home occupant identification via fusion across on-object sensing devices,” in Proceedings of the 4th ACM International Conference on Systems for Energy-Efficient Built Environments (Delft: ACM), 2. doi: 10.1145/3137133.3137152
Hart, G. W. (1992). Nonintrusive appliance load monitoring. Proc. IEEE 80, 1870–1891. doi: 10.1109/5.192069
Hsu, C.-W., and Lin, C.-J. (2002). A comparison of methods for multiclass support vector machines. IEEE Trans. Neural Netw. 13, 415–425. doi: 10.1109/72.991427
Jia, Z., Bonde, A., Li, S., Xu, C., Wang, J., Zhang, Y., et al. (2017). “Monitoring a person's heart rate and respiratory rate on a shared bed using geophones,” in Proceedings of the 15th ACM Conference on Embedded Network Sensor Systems (Delft: ACM), 6. doi: 10.1145/3131672.3131679
Kodeswaran, P., Kokku, R., Mallick, M., and Sen, S. (2016a). “Demultiplexing activities of daily living in iot enabled smarthomes,” in IEEE INFOCOM 2016-The 35th Annual IEEE International Conference on Computer Communications (San Francisco, CA: IEEE), 1–9. doi: 10.1109/INFOCOM.2016.7524359
Kodeswaran, P. A., Kokku, R., Sen, S., and Srivatsa, M. (2016b). “Idea: a system for efficient failure management in smart iot environments,” in Proceedings of the 14th Annual International Conference on Mobile Systems, Applications, and Services (Singapore: ACM), 43–56. doi: 10.1145/2906388.2906406
Kokku, R. (2017). “Activity signatures in smart IOT environments,” in International Conference on Communication Systems and Networks (Bengaluru: Springer), 72–76. doi: 10.1007/978-3-319-67235-9_6
Lawton, M. (2000). “Lawton instrumental activities of daily living scale,” in The Merck Manual of Geriatrics, ed. D. J. Mason (Philadelphia, PA: Lippincott Williams & Wilkins), 45.
Liao, J., Stankovic, L., and Stankovic, V. (2014). “Detecting household activity patterns from smart meter data,” in 2014 International Conference on Intelligent Environments (Shanghai: IEEE), 71–78. doi: 10.1109/IE.2014.18
Mirshekari, M., Pan, S., Fagert, J., Schooler, E. M., Zhang, P., and Noh, H. Y. (2018). Occupant localization using footstep-induced structural vibration. Mech. Syst. Signal Process. 112, 77–97. doi: 10.1016/j.ymssp.2018.04.026
Moriya, K., Nakagawa, E., Fujimoto, M., Suwa, H., Arakawa, Y., Kimura, A., et al. (2017). “Daily living activity recognition with echonet lite appliances and motion sensors,” in 2017 IEEE International Conference on Pervasive Computing and Communications Workshops (PerCom Workshops) (Kona, HI: IEEE), 437–442. doi: 10.1109/PERCOMW.2017.7917603
Pan, S., Berges, M., Rodakowski, J., Zhang, P., and Noh, H. Y. (2019). “Fine-grained recognition of activities of daily living through structural vibration and electrical sensing,” in Proceedings of the 6th ACM International Conference on Systems for Energy-Efficient Buildings, Cities, and Transportation (New York, NY), 149–158. doi: 10.1145/3360322.3360851
Pan, S., Berges, M., Rodakowski, J., Zhang, P., and Noh, H. Y. (2020). Fine-Grained Activities of Daily Living Data With Structural Vibration and Electrical Load Sensing (Version 1). Zenodo. Available online at: http://doi.org/10.5281/zenodo.3745900
Pan, S., Bonde, A., Jing, J., Zhang, L., Zhang, P., and Noh, H. Y. (2014). “Boes: building occupancy estimation system using sparse ambient vibration monitoring,” in Sensors and Smart Structures Technologies for Civil, Mechanical, and Aerospace Systems 2014, Vol. 9061 (San Diego, DC: International Society for Optics and Photonics), 90611O. doi: 10.1117/12.2046510
Pan, S., Ramirez, C. G., Mirshekari, M., Fagert, J., Chung, A. J., Hu, C. C., et al. (2017a). “Surfacevibe: vibration-based tap & swipe tracking on ubiquitous surfaces,” in 2017 16th ACM/IEEE International Conference on Information Processing in Sensor Networks (IPSN) (Pittsburgh, PA: IEEE), 197–208. doi: 10.1145/3055031.3055077
Pan, S., Yu, T., Mirshekari, M., Fagert, J., Bonde, A., Mengshoel, O. J., et al. (2017b). “Footprintid: Indoor pedestrian identification through ambient structural vibration sensing,” in Proceedings of the ACM on Interactive, Mobile, Wearable and Ubiquitous Technologies, Vol. 1, 89 (Hawaii). doi: 10.1145/3130954
Parson, O., Ghosh, S., Weal, M., and Rogers, A. (2012). “Non-intrusive load monitoring using prior models of general appliance types,” in Twenty-Sixth AAAI Conference on Artificial Intelligence (Toronto, ON: ACM).
Patel, S. N., Robertson, T., Kientz, J. A., Reynolds, M. S., and Abowd, G. D. (2007). “At the flick of a switch: detecting and classifying unique electrical events on the residential power line (nominated for the best paper award),” in International Conference on Ubiquitous Computing (Innsbruck: Springer), 271–288. doi: 10.1007/978-3-540-74853-3_16
Poston, J. D., Buehrer, R. M., and Tarazaga, P. A. (2017). A framework for occupancy tracking in a building via structural dynamics sensing of footstep vibrations. Front. Built Environ. 3:65. doi: 10.3389/fbuil.2017.00065
Rodakowski, J., Skidmore, E. R., Reynolds, C. F. III., Dew, M. A., Butters, M. A., et al. (2014). Can performance on daily activities discriminate between older adults with normal cognitive function and those with mild cognitive impairment? J. Am. Geriatr. Soc. 62, 1347–1352. doi: 10.1111/jgs.12878
Song, H., Kalogridis, G., and Fan, Z. (2014). “Short paper: time-dependent power load disaggregation with applications to daily activity monitoring,” in 2014 IEEE World Forum on Internet of Things (WF-IoT) (Seoul: IEEE), 183–184. doi: 10.1109/WF-IoT.2014.6803150
Keywords: heterogeneous, ensemble, non-intrusive human sensing, electrical load sensing, structural vibration sensing, fine-grained activity recognition, activity of daily living (ADL), complementary spatiotemporal characteristics
Citation: Pan S, Berges M, Rodakowski J, Zhang P and Noh HY (2020) Fine-Grained Activity of Daily Living (ADL) Recognition Through Heterogeneous Sensing Systems With Complementary Spatiotemporal Characteristics. Front. Built Environ. 6:560497. doi: 10.3389/fbuil.2020.560497
Received: 09 May 2020; Accepted: 31 August 2020;
Published: 08 October 2020.
Edited by:
Babak Moaveni, Tufts University, United StatesReviewed by:
Donghyeon Ryu, New Mexico Institute of Mining and Technology, United StatesMingming Song, Tufts University, United States
Copyright © 2020 Pan, Berges, Rodakowski, Zhang and Noh. This is an open-access article distributed under the terms of the Creative Commons Attribution License (CC BY). The use, distribution or reproduction in other forums is permitted, provided the original author(s) and the copyright owner(s) are credited and that the original publication in this journal is cited, in accordance with accepted academic practice. No use, distribution or reproduction is permitted which does not comply with these terms.
*Correspondence: Shijia Pan, c3BhbjI0JiN4MDAwNDA7dWNtZXJjZWQuZWR1