
94% of researchers rate our articles as excellent or good
Learn more about the work of our research integrity team to safeguard the quality of each article we publish.
Find out more
METHODS article
Front. Built Environ., 25 November 2020
Sec. Wind Engineering and Science
Volume 6 - 2020 | https://doi.org/10.3389/fbuil.2020.558706
This article is part of the Research TopicNatural Hazards Engineering Research Infrastructure (NHERI) 2016-2020: Mitigating the Impact of Natural Hazards on Civil Infrastructure and CommunitiesView all 16 articles
 Gregory G. Deierlein1*
 Frank McKenna2
 Adam Zsarnóczay1
 Tracy Kijewski-Correa3
 Ahsan Kareem3Wael Elhaddad2
 Laura Lowes4
 Matthew J. Schoettler2
 Sanjay Govindjee2
With the goal to facilitate evaluation and mitigation of the risks from natural hazards, the Natural Hazards Engineering Research Infrastructure’s Computational Modeling, and Simulation Center (NHERI SimCenter) is developing computational workflows for regional hazard simulations. These simulations enable research to combine detailed assessments of individual facilities with comprehensive regional-scale simulations of natural hazard effects. By integration of multi-fidelity and multi-resolution models to assess natural hazard impacts on buildings, infrastructure systems and other constructed facilities, the approach enables the engineering analysis of public policies and socio-economic impacts. Effective development of platforms for high-resolution regional simulations requires modular workflows that can integrate state-of-the-art models with information technologies and high-performance computing resources. In this paper, the modular architecture of the computational workflow models is described and illustrated through testbed applications to evaluate regional building damage under an earthquake and a hurricane scenario. Developed and disseminated as open-source software on the NHERI DesignSafe Cyberinfrastructure, the computational models and workflows are enabling multi-disciplinary collaboration on research to mitigate the effects of natural hazard disasters.
Much of the world’s population lives in regions susceptible to earthquakes, tropical cyclones (hurricanes) or other natural hazards, where the risks are exacerbated by buildings and aging civil infrastructure that often are not designed to resist the hazards. These conditions, combined with the lack of information and technologies to characterize the performance of buildings and infrastructure, present enormous challenges for planning, design and management of communities that are resilient to natural hazards. Important decisions are often made in the absence of quantitative analyses about how communities will be impacted by natural hazards and how best to mitigate their devastating effects. While knowledge and data gained through field observations and experiments are fundamental to addressing these challenges, computational simulations are an essential component of the science and engineering needed to evaluate and mitigate the potential devastating effects of natural hazards.
Over the past decade, many reports have been developed that outline research needs and challenges to address the risks posed to society from natural hazards (e.g., DHS, 2010; Fenves et al., 2011; NIST, 2014, 2017). The recently published National Hazards Engineering Research Infrastructure Science Plan (NHERI, 2020) outlines three grand challenges and five research questions, all of which depend on integration of data and models through computational simulations. Specifically, simulations are critical to (1) characterize natural hazard phenomena, (2) evaluate their damaging effects on buildings, civil infrastructure and other physical assets, (3) quantify the socio-economic consequences of this damage, and (4) evaluate the effectiveness of alternative strategies to mitigate and recover from the damage. Each of these components entail simulations at varying scales, from detailed analyses of localized response of individual buildings or infrastructure components to multi-scale analyses of regionally distributed communities and infrastructure systems. The challenges are multi-disciplinary and require development and management of large datasets to translate data and analysis results between the modules.
The NHERI SimCenter was established by the National Science Foundation (NSF) to develop computational software tools that support research and education in natural hazards engineering. This paper describes the background and details of the SimCenter’s ongoing development of computational workflows to integrate software applications for simulating earthquake and hurricane effects on communities. The computational workflows are illustrated in two testbed applications to quantify the effects of an earthquake and a hurricane over urban regions.
The SimCenter’s computational framework for natural hazards engineering leverages foundational advancements in performance-based engineering to integrate models and data from the physical sciences, engineering, and social sciences to evaluate and design strategies to create resilient communities. The performance-based approach aims to take full advantage of advances in computational modeling of earthquakes and storms and their damaging effects on buildings, transportation and utility infrastructure, and other constructed facilities.
Modern approaches to performance-based engineering for natural hazards trace back about 25 years to work in earthquake engineering risk assessment and rehabilitation. Two significant early milestones were the publication of the FEMA 273 NHERP Guidelines for the Seismic Rehabilitation of Buildings (FEMA, 1997) and the first release of the HAZUS software for regional earthquake risk assessment in 1997 (Kircher et al., 2006; Schneider and Schauer, 2006). Subsequently, FEMA 273 has evolved into the ASCE 41 standard for seismic evaluation and retrofit of buildings (ASCE, 2017), and HAZUS has been expanded to assess regional risks from floods, hurricanes and other hazards (Vickery et al., 2006; FEMA, 2018a). The FEMA P-58 Seismic Performance Assessment of Buildings guidelines (FEMA, 2018b), which leverages research by the Pacific Earthquake Engineering Research (PEER) center and other groups, established a comprehensive methodology with explicit damage and consequence models that rigorously incorporate uncertainties in earthquake hazards and their damaging effects (Moehle and Deierlein, 2004; Krawinkler and Miranda, 2004). Continuing efforts are underway to improve and extend comprehensive performance-based methods for the design and assessment of facilities to hurricanes, tsunamis and other hazards (e.g., Barbato et al., 2013; Lange et al., 2014; Bernardini et al., 2015; Attary et al., 2017; Ouyang and Spence, 2020).
The basic framework of performance-based engineering for natural hazards is illustrated in Figure 1. This figure was originally developed for earthquake engineering design, but the concept is generally applicable to other natural hazards. Moving from left to right, the process begins with the definition of a constructed facility, based on its design features and location. The next steps are to perform (1) a hazard analysis to characterize the hazard effects (e.g., earthquake ground shaking) that the facility is subjected to, (2) structural analyses to assess the response of the facility to the hazard, (3) damage analyses to quantify damage to facility components associated with the imposed deformations and forces, and (4) consequence analyses to evaluate the resulting risks to life safety, economic losses, and downtime. Input and output variables from each stage of the assessment are clearly defined as part of an underlying probabilistic formulation to propagate statistical data through the analyses. The resulting performance data inform decisions about the design and/or risk management of the facility.
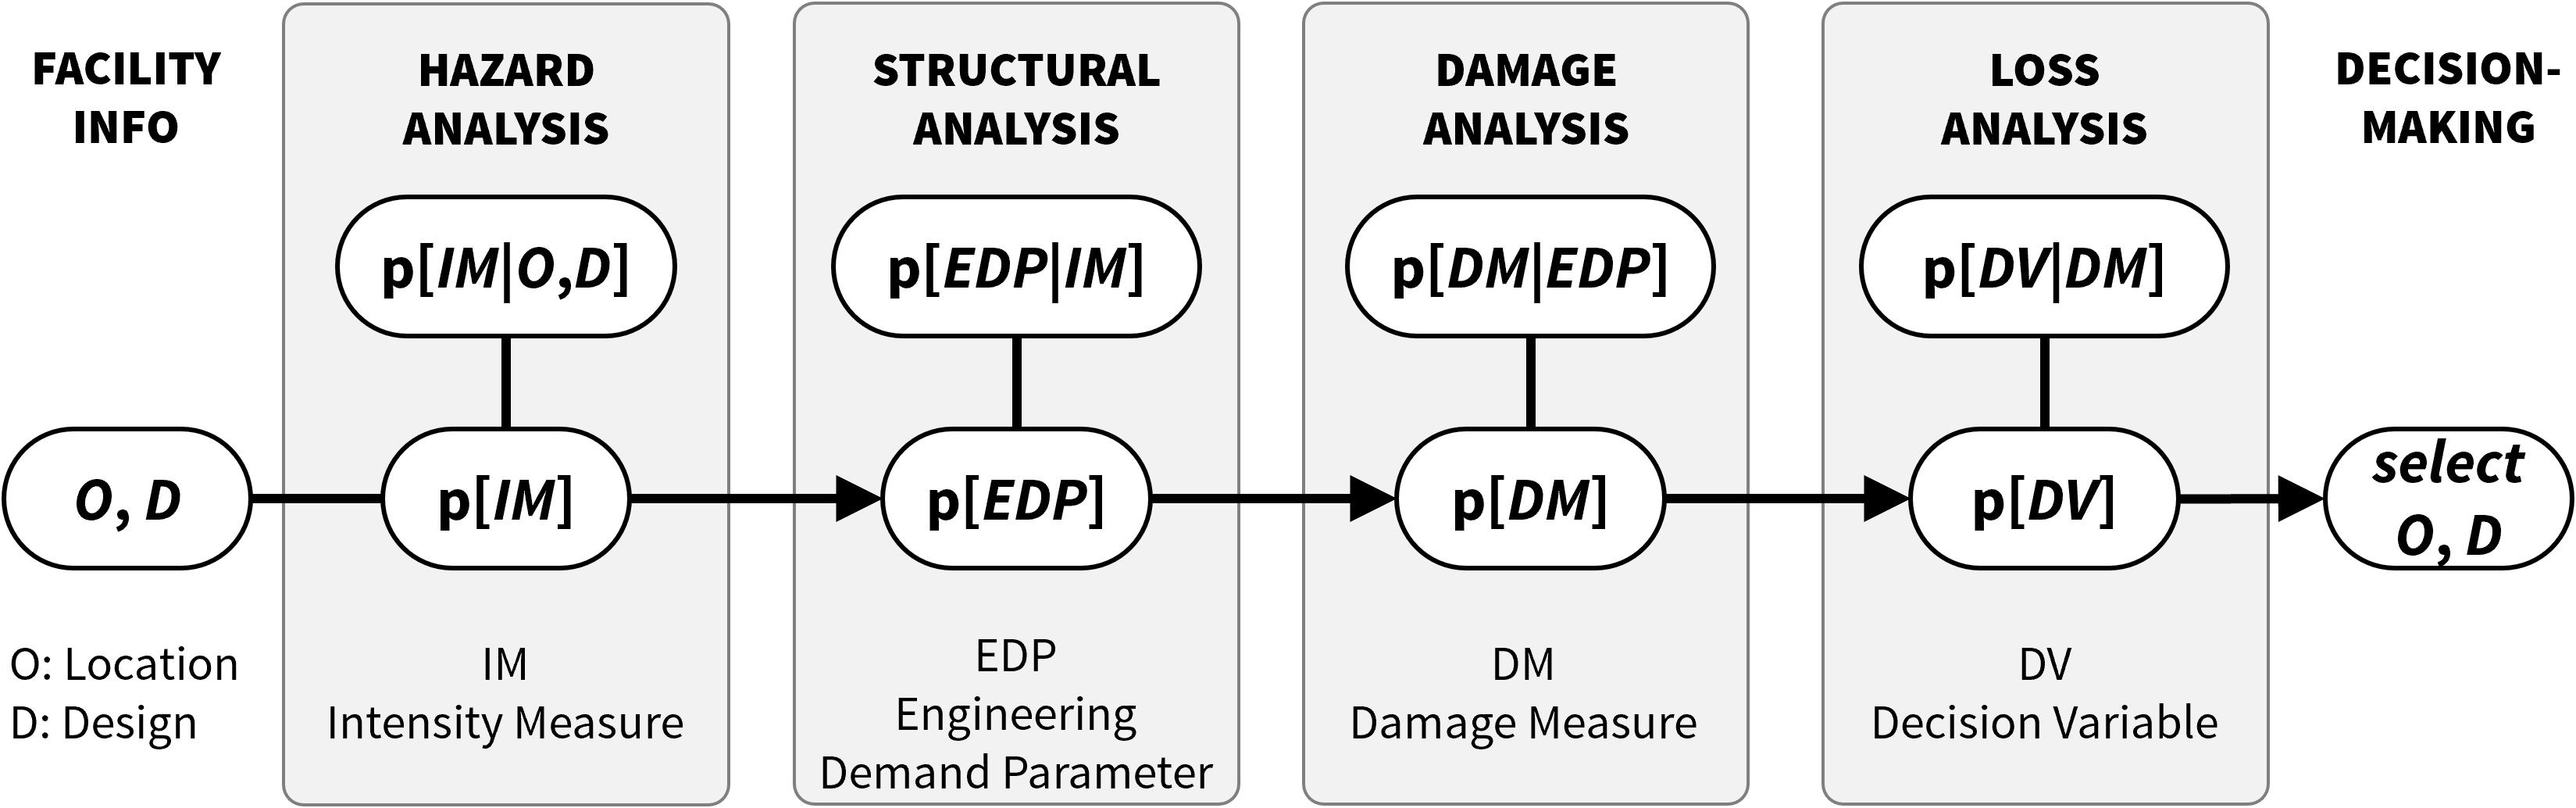
Figure 1. Framework for performance-based engineering (after Porter, 2003).
Historically, methods for regional risk assessment (e.g., HAZUS) and performance-based design (e.g., FEMA P-58) were developed independently, where the former relied on simplified damage and loss models to assess large inventories of facilities, and the latter focused on detailed analyses of individual facilities. This evolution reflected both the primary goals of the methods and the capabilities of computational modeling technologies to perform the analyses. With modern high-performance computing systems, information technologies, and high-fidelity models, the assessment methods are converging to permit high-resolution simulations of regional models. In the SimCenter’s framework, high-resolution multi-fidelity regional analyses are facilitated by cloud-enabled high-performance computing and informational technologies to create computational workflows.
Theory and experimentation have long been regarded as the two fundamental pillars of science and engineering. With the advent of high-performance computing and information technologies, computational and data-enabled science has become a third pillar. Numerical simulations are now used to both validate theory and inform experimentation. Validated numerical applications are routinely used to simulate the behavior of configurations that cannot be physically tested, e.g., extending data from laboratory experiments of structural components to enable simulation of buildings or simulating the response of communities experiencing regionally distributed natural hazard effects.
High-resolution simulations are now enabled by parallel computers and cloud computing resources. Parallel computing allows simulations to run faster as they utilize many processing cores of one or multiple CPUs on dedicated high performance parallel computers such as those available through NSFs Extreme Science and Engineering Discovery Environment (XSEDE), e.g., the TACC Frontera system (TACC, 2020). The research capabilities of advanced computing resources is further enabled by cloud-based information systems, which provide links to data from experiments, observation, and sensors. Such data is available through the DesignSafe Data Depot and other sources accessible through the World Wide Web.
For natural hazards engineering research, the data is diverse, dynamic, distributed and extensive. While manual gathering and processing of small data sets is possible, the overwhelming proliferation of data can inhibit its use. To help address this, the SimCenter provides a series of applications (SimCenter, 2020) that enable researchers to integrate online data and cloud computing resources. These applications perform their simulations using scientific workflows, which link together software applications, databases, and software libraries (Deelman et al., 2015). The basic concept is illustrated in Figure 2, where each puzzle piece represents a component of the hazard simulation that is encapsulated using pre- and post-processors to facilitate data transfer between modules. An example of such a workflow is an application (Zsarnóczay et al., 2019) that automates a FEMA P-58 type performance assessment of a building model by (1) querying the PEER NGA database server for a selection of ground motion records, (2) simulating the non-linear dynamic response of the building to the selected records using a high performance computer, (3) performing a FEMA P-58 damage and loss evaluation, incorporating the latest FEMA P-58 fragilities obtained from the web (ATC, 2020b), and (4) displaying the results to the user in graphical or tabular form. This workflow for a single building can be integrated into a workflow for detailed regional simulation of communities with large inventories of buildings. Examples of two regional simulations are presented later in the paper for an earthquake and a hurricane scenario.
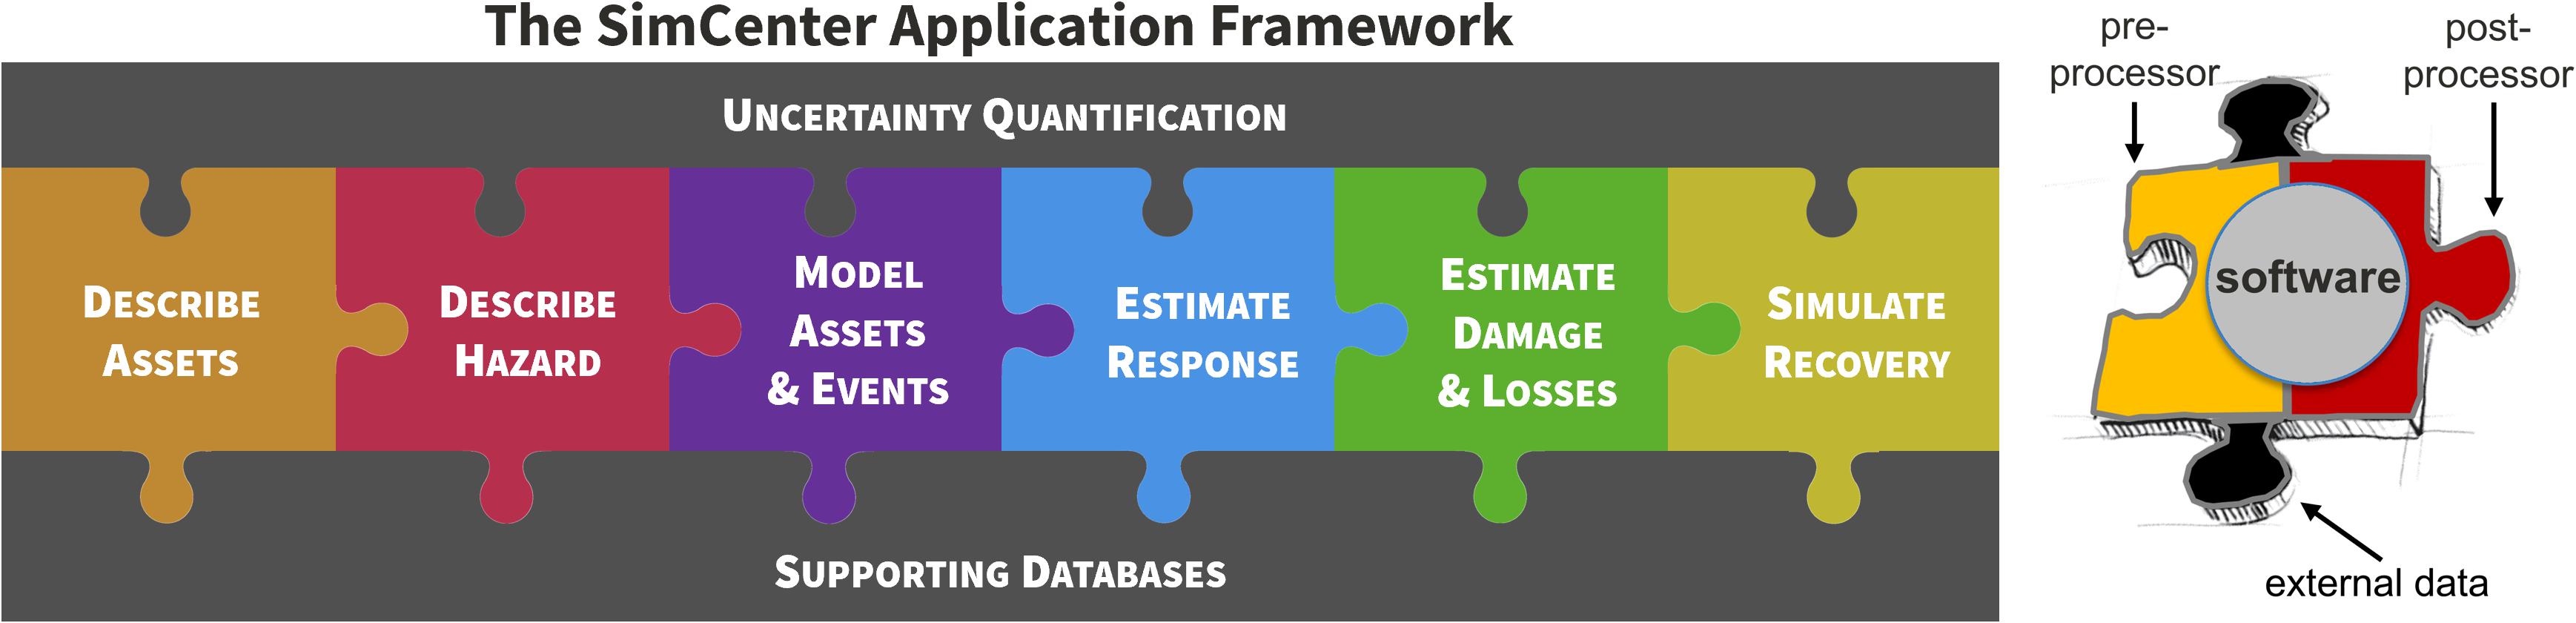
Figure 2. Modules of the software application framework developed by the SimCenter.
The SimCenter’s strategy for studying the effects of natural hazard from individual facilities to regional simulation is through the creation of an application framework for scientific workflow systems. Scientific workflow systems are applications that enable users to build, launch, and monitor scientific workflows. Referring to the jigsaw representation of a workflow shown in Figure 2, the framework allows users to (1) select from different applications for each jigsaw piece, (2) build their workflow, and (3) then launch and monitor the running workflow. When running the workflow, the system will launch the individual applications and pass the needed input and output data between the applications. The application framework is designed to be modular and extensible, such that researchers can introduce their preferred application for any step in the process. This functionality is achieved by standardizing the flow of information through the definition of standard interfaces. To facilitate the introduction of user-supplied workflow components, we have developed templates for pre- and post-processing links into the workflow. Included are links to databases that support the workflow, along with modules that provide routines for uncertainty quantification. Thus, new software components can be conveniently added or reconfigured by creating new pre- and post-processing links. The overall aim is to leverage existing and newly developed user-specified software by providing the ability to reconfigure and tailor the workflow tools to address specific disaster research inquiries.
In contrast to general purpose scientific workflow systems, e.g., Taverna (Oinn et al., 2003), Galaxy (Goecks et al., 2010), and Pegasus (Deelman et al., 2015), the SimCenter workflows are constrained and optimized for a limited number of applications that are systematically assembled for natural hazards engineering. The workflow architecture is aimed at facilitating use and reuse of workflows by a broad range of natural hazards engineering researchers with varying levels of software skills. Some of the SimCenter applications employ simpler workflows that address only specific portions of the natural hazards application framework, whereas others encompass comprehensive regional simulation systems, include asset inventories, advanced loading options for earthquake and hurricane scenarios, fragility curves from HAZUS and FEMA P-58, supporting databases, and tools for uncertainty quantification. To facilitate use, reuse, and further development by researchers in natural hazards engineering, the software systems and workflows are designed following a best practice guide for workflows (Hettne et al., 2012), including: (1) modularity with clear interfaces to facilitate adaptation and extension, (2) well defined and visualizable outputs, (3) thorough testing and verification, (4) documentation with examples of data input and output, and (5) utilization of stable service providers (PEER and DesignSafe-CI) that allow the workflows to be readily executed from outside the local computing environment.
The four main components (tasks) of regional natural hazard analyses consist of (1) developing an inventory of the physical assets, such as buildings, transportation systems and components, and utility systems and components, (2) quantifying the characteristics of the natural hazard event (e.g., earthquake ground shaking, hurricane wind flows and storm surge) that can impact the physical assets and the community, (3) assessing the damaging effects of the natural hazard on the physical assets, and (4) evaluating the life-safety risks and other socio-economic consequences of the damage on the affected communities. This last step provides key information to assess disruptions to communities and helps inform planning for recovery, which is key to community resilience. Further details of these four components are outlined below with specific emphasis on earthquakes and hurricanes, which are the current focus of SimCenter developments.
Within the context of natural hazard risk assessment, the asset inventory encompasses information describing the locations and characteristics of buildings, transportation and infrastructure system components, industrial and port facilities, and other physical assets that are at risk of damage from the natural hazard. Ideally, the asset inventory should include all characteristics of the components necessary to evaluate the impact of the natural hazard effects (e.g., ground shaking, strong wind, storm surge) through response, damage and loss analyses. For example, for buildings subjected to earthquake ground shaking, the inventory should include information on the building height and floor area, building structural system and materials, foundation, façade, interior partitions, mechanical and electrical systems, architectural finishes. Where this information is not explicitly known for every facility in the study region, it can be inferred, using rule-based models and machine learning methods, from the building age, function, and other available characteristics.
Looking beyond the direct damage and losses, the inventory should include information that can facilitate assessment of the asset damage to the community functions and recovery. For buildings this may include information on building occupancy and use, e.g., whether it is a medical facility that is part of a regional hospital network. For network components, this includes information on the component functionality within the overall system, e.g., for water distribution systems this may include data on pipe pressure, pumps, storage, flow capacity, connectivity, etc.
For many assets, the required inventories are not readily available and must be assembled from various data sources. For building inventories, conventional data sources include tax assessor and other publically available property databases created by local and state governments, real estate databases, building permit records, and some specialty databases (e.g., CoreLogic, 2020; Emporis, 2020). For transportation and infrastructure systems, inventory databases are typically maintained by government agencies or private organizations. In some cases, the databases are proprietary, which can limit how the data is accessed, used, and shared.
Automated collection and interpretation of images is another rapidly growing resource for inventory development. This may include images collected by satellites, drones, or crowd sourcing, which may be available through publicly accessible open source or proprietary databases. Emerging machine learning algorithms, coupled with high-performance cloud-based computing, offer unprecedented capabilities for automated image interpretation. Advanced statistical and artificial intelligence methods can further enhance the capabilities to combine information from multiple data streams.
For regional assessments, characterization of the natural hazard typically involves calculating the hazard and its damaging effects for one or more scenario events. While the general concept of the analysis is common to all hazards, the specific details can vary considerably. The following discussion focuses on the effects of earthquakes and hurricanes to illustrate the key concepts and outline implementation details for these hazards.
Earthquakes are typically characterized by the size of rupture on an earthquake fault, e.g., using moment magnitude, Mw, which is a measure of energy release that depends on the fault mechanism, the rupture area and slip amount, rock strength, and other parameters. The resulting ground shaking in the affected region can be determined through various means. The most conventional approach for this uses ground motion prediction equations (GMPEs) to calculate intensity measures of ground shaking as a function of the earthquake Mw, distance to the fault rupture, site conditions, and other parameters. Typical ground motion intensity measures include peak ground acceleration, velocity, or displacement, spectral (period dependent) acceleration, velocity, or displacement, ground duration, and other measures. Where seismogram time series of ground motions are required for subsequent response and damage analyses, the ground motion time series can be obtained by generating samples from a numerical stochastic model or selecting and scaling historical ground motion recordings that are selected and scaled to match the site intensity measures. For example, one can calculate a target response spectrum using GMPEs and then select and scale recorded ground motions whose response spectra matches the target. The GMPEs used in this approach are the same (or similar) to ones used to create probabilistic seismic hazard maps. However, whereas seismic hazard maps represent a statistical combination of ground motion intensities from multiple earthquake events with various return periods that are independently evaluated for each site, the ground motion realizations used for regional hazard analyses are from one or more distinct earthquake events, where the models preserve the spatial correlation in the variability of earthquake shaking across a region.
An alternative approach to the conventional method using GMPEs is to directly simulate earthquake fault ruptures and the resulting ground motions using mechanistic (physics-based) models, stochastic (statistical) models, or hybrid models that combine mechanistic and stochastic models. Similar to the GMPE approach, the direct simulations begin with a definition of an earthquake fault rupture, which provides input to wave propagation models that directly generate ground motion seismograms. Examples of this direct simulation approach include the Southern California Earthquake Center’s (SCEC) Broadband Platform and Cybershake project (Graves et al., 2011), the Lawrence Livermore National Laboratory’s SW4 simulation platform Petersson and Sjogreen (2017), and the USGS M9 simulations (Frankel et al., 2018). These all employ physics-based methods to simulate the ground motions via the equations of motion for solid materials, including accounting for the local geologic and fault conditions. The main challenges associated with these methods are (1) collecting the data required to characterize the local fault and geologic characteristics (e.g., earthquake basins), and (2) the large computational demands – especially for full 3D models.
The SimCenter applications and workflows support both the traditional GMPE-based approach and the direct simulation approach, where either can provide ground motion seismograms for one or multiple realizations of earthquake events (Mw on a selected fault) for regionally distributed sites. Applications and workflows for the traditional approach employ earthquake hazard information available from USGS data, along with the PEER NGA ground motion database. Applications and workflows for simulated ground motions utilize tools to generate stochastic ground motions, or alternatively, tools to access and select seismograms from databases of pre-simulated earthquake events. The selected seismograms can either be used directly as input for non-linear dynamic analyses of structures (including models of the underlying soils) or to characterize intensity measures (e.g., spectral accelerations) of ground motions as input for analyses or damage models for structures.
Hurricanes (tropical cyclones) are commonly classified by the Saffir-Simpson scale (category) in terms of 1 min maximum sustained wind speeds. For SimCenter applications, hurricane models have been developed to generate either wind speeds or their time histories, whereby the wind loading effects on buildings and other facilities can be estimated by detailed computational fluid dynamics (CFD) analyses or other simplified methods. Further, Monte Carlo simulations of hurricanes can be carried out using hurricane wind field models, beginning with characterization of the hurricane track parameters that are translated into wind speeds.
Along the track of a hurricane, the characteristic indicators of the hurricane include the radius of maximum winds (RMW), intensity measures (maximum wind speeds or central pressure difference), shape parameter (Holland-B), sea surface temperature (SST) and track information (initial location, translation speed, and heading). The statistical approaches for characterizing hurricanes include sampling of parameters from probabilistic models that are estimated using an observation database from the National Oceanic and Atmospheric Administration (NOAA). In the NOAA database, the statistical best fit of the empirical track for past hurricanes has been synthesized by data fitting over heterogeneous sources. For example, by utilizing the full track model, the genesis location can be randomly selected from the historical record or generated based on its distribution function (Vickery et al., 2009). Starting from the genesis location, the track is generated by Markov-type models, represented by auto-regressive functions in terms of hurricane parameters (latitude translation speed, sea surface temperature, etc.) as well as a random error term (Vickery et al., 2000b). The track-information then engenders other parameters by the statistical relationship models which are usually represented as expressions involving uncertainties as well.
The mean wind speed at the local site is predicted using the output of the preceding step. This requires solving the three-dimensional non-linear, hydrodynamic, primitive equation system describing dry air motion in the hurricane boundary layer. To simplify the problem, a two-dimensional slab (height-averaged) model may be utilized (Vickery et al., 2000a). Alternatively, there are efforts to supplement these formulations with semi-empirical analyses informed by the three-dimensional equations of motion (e.g., Kepert, 2011; Snaiki and Wu, 2018). The wind speeds are solved at the gradient height, which are then converted to near-ground heights by the boundary layer wind speed profile given by statistical models in the form of equations or specific values (Vickery et al., 2009). The local terrain in this model scale is accounted for by the surface drag coefficients. Solving these equations is time-consuming, and surrogate models have been developed as an alternative to speed-up the computations (Vickery et al., 2000a,b).
By carrying out the above simulation for multiple realizations, the statistical characteristics of local hurricane winds may be determined (for example, the cumulative probability distribution of wind speeds), which together with the turbulence characteristics of hurricane winds can be used as the input for the ensuing analysis. Examples of software platforms that apply these methods include Weather Research and Forecasting (WRF) (Davis et al., 2008), HAZUS (Vickery et al., 2006), and the Florida Public Hurricane Loss Model (Hamid et al., 2010).
In the current SimCenter application tools, there are several possible approaches for characterizing the wind hazard. One approach provides access to the simplified (and quick to determine) wind speeds from the ASCE 7-16 (ASCE, 2016) maps with different mean recurrence times that is available through an API to the Applied Technology Council hazards website (ATC, 2020a). For more detailed site-specific studies, the SimCenter supports tools for implementing the Monte Carlo based scheme, described previously, to simulate the reference level winds for different recurrence intervals. The use of surrogate models based on established storm parameters can expedite the estimation of these wind speeds. These wind speeds can be used with simplified models to determine wind pressures or as direct input to damage and loss functions. Alternatively, the wind speed histories, along with the terrain consistent features of atmospheric flow prescribed in standards or derived from data-driven models of specific storms, can be used to characterize inflows for CFD analyses. To characterize the in-flow conditions for CFD computations, the SimCenter has developed an application, called TinF (Turbulance Inflow, Mackenzie-Helnwein et al., 2019), to simulate wind velocity fluctuations that are consistent with the statistical and spectral features of wind fields simulated in wind tunnels using scaled roughness blocks and barriers in advance of the location of the target structure under study.
For more advanced studies, a nested multi-scale simulation involving the three-dimensional equations of motion for the atmosphere would better represent a hurricane wind field at multiple scales, i.e., from large scales down to building scales by wrapping WRF type models around Large Eddy Simulations (LES) for assessing loads on buildings and their response to tropical storm winds. This level of advanced workflow and their software implementation is not directly part of the SimCenter workflow applications. However, similar to physics-based earthquake simulations, the SimCenter workflows can be adapted to ingest simulated wind histories, which are developed by advanced three-dimensional simulations that are run outside of the SimCenter applications.
The computational simulations of storm surge hazards require: (1) the hurricane wind field to drive the model; (2) the topography and bathymetry along the coastline; and (3) the land use/land cover data for the simulation of wave run up on shore. The coupling of a storm surge, nearshore wave, and wave run-up will yield geospatially-distributed time-dependent responses, which typically describe the mean water elevation, max water elevation, max water depth, and significant wave height (or limit of moderate wave action). Such responses can be generated either by a high-fidelity model or a surrogate model tuned to a database of results from these models.
Numerical models for storm-surge simulations are typically based on single-layer-depth averaged differential equations describing fluid motion driven by storm winds. The available numerical models differ in their computational solution strategies, which have implications on the spatial and temporal resolution of the simulations, the required computational resources and runtimes, and the required input data and model parameters. Generally, these models capture the amplitude of long-period, gravity waves, but they do not simulate short-period wave effects. Typical models include, for example, Sea, Lake and Overland Surge from Hurricanes (SLOSH), which solves equations using local grids; ADvanced CIRCulation (ADCIRC), which is commonly regarded as the state-of-the-art in coastal storm-surge simulation and capable of providing significantly more accurate simulations than methods based on SLOSH (Resio and Westerink, 2008); and GEOCLAW, which lies between SLOSH and ADCIRC in terms of modeling resolution and computational cost (Mandli et al., 2016).
To simulate local wave effects, in addition to the long-wave surge heights, ADCIRC simulations have been coupled with different nearshore wave models, such as Simulating Waves Nearshore (SWAN), which computes random short-crested wind-generated waves in coastal regions and inland waters (Kennedy et al., 2012); or Steady-State Spectral Wave model (STWAVE, Smith et al., 2001), which is a steady-state finite difference spectral model for nearshore wind-wave growth and propagation based on the wave action balance equation.
Supplementary wave run-up simulations are required to capture the interaction of waves with the shoreline and any coastal protective features along coastal transects. To this end, inputs from the nearshore wave models can be fed into a one-dimensional Boussinesq model, executed at the pre-selected transects to estimate the wave run-up overland (Demirbilek et al., 2009). Wave run-up calculations are executed at transect locations generally selected by segmenting the defined coastline in the areas of interest and selecting the transect density proportional to computational demand.
In lieu of repeated high-fidelity simulations (e.g., ADCIRC plus STWAVE/SWAN analyses), surrogate models can provide a simplified description of a storm scenario based on a small number of model parameters corresponding to its characteristics at landfall (i.e., those parameters depicted in the hurricane wind field model). The scenarios in the database of high-fidelity simulation results are then parameterized according to the surrogate model parameter vector to create an input-output training dataset. The surrogate model is then built to approximate this input-output relationship using a Kriging metamodel coupled with Principal Component Analysis (Jia and Taflanidis, 2013). Subsequently, surrogate models can be used to efficiently generate storms and their attendant features for risk and impact assessments of coastal regions.
Performance assessment of inventory assets (i.e., buildings, bridges, utility infrastructures, etc.) can follow one of several approaches, depending on the desired resolution and available information and tools for the assessment. Shown in Figure 3 is an illustration of three alternative modeling approaches for evaluating asset performance. Path I in the figure represents cases where a single vulnerability function is used to determine one or more decision variables for an asset type directly from the hazard intensity measure. This path is employed in HAZUS and other similar tools for wind events, where, for example, building loss ratios are directly related to hurricane wind speeds. The Path I vulnerability curves typically distinguish between asset types based on general characteristics, age, and condition (e.g., single-family 1–2 story wood frame house, construction date, good condition). Path II uses two layers of functions, where the first (fragility) function relates hazard intensity to asset damage, and the second (consequence) function relates the damage state to the decision variable. This approach is also available in HAZUS to assess damage and loss for seismic events. Path III, the most refined approach, is employed in the FEMA P-58 method for seismic performance assessment of buildings. In FEMA P-58, a non-linear structural analysis (or an alternate empirical function) is used to calculate so-called engineering demand parameters, such as lateral drifts, accelerations, or internal forces, that are induced by earthquake ground motions. Component fragility functions are then used to relate the engineering demands to damage, which define the input to consequence functions to evaluate the associated replacement or repair measures for each component. The component level consequences are then aggregated to determine the decision variable(s) for the complete facility.
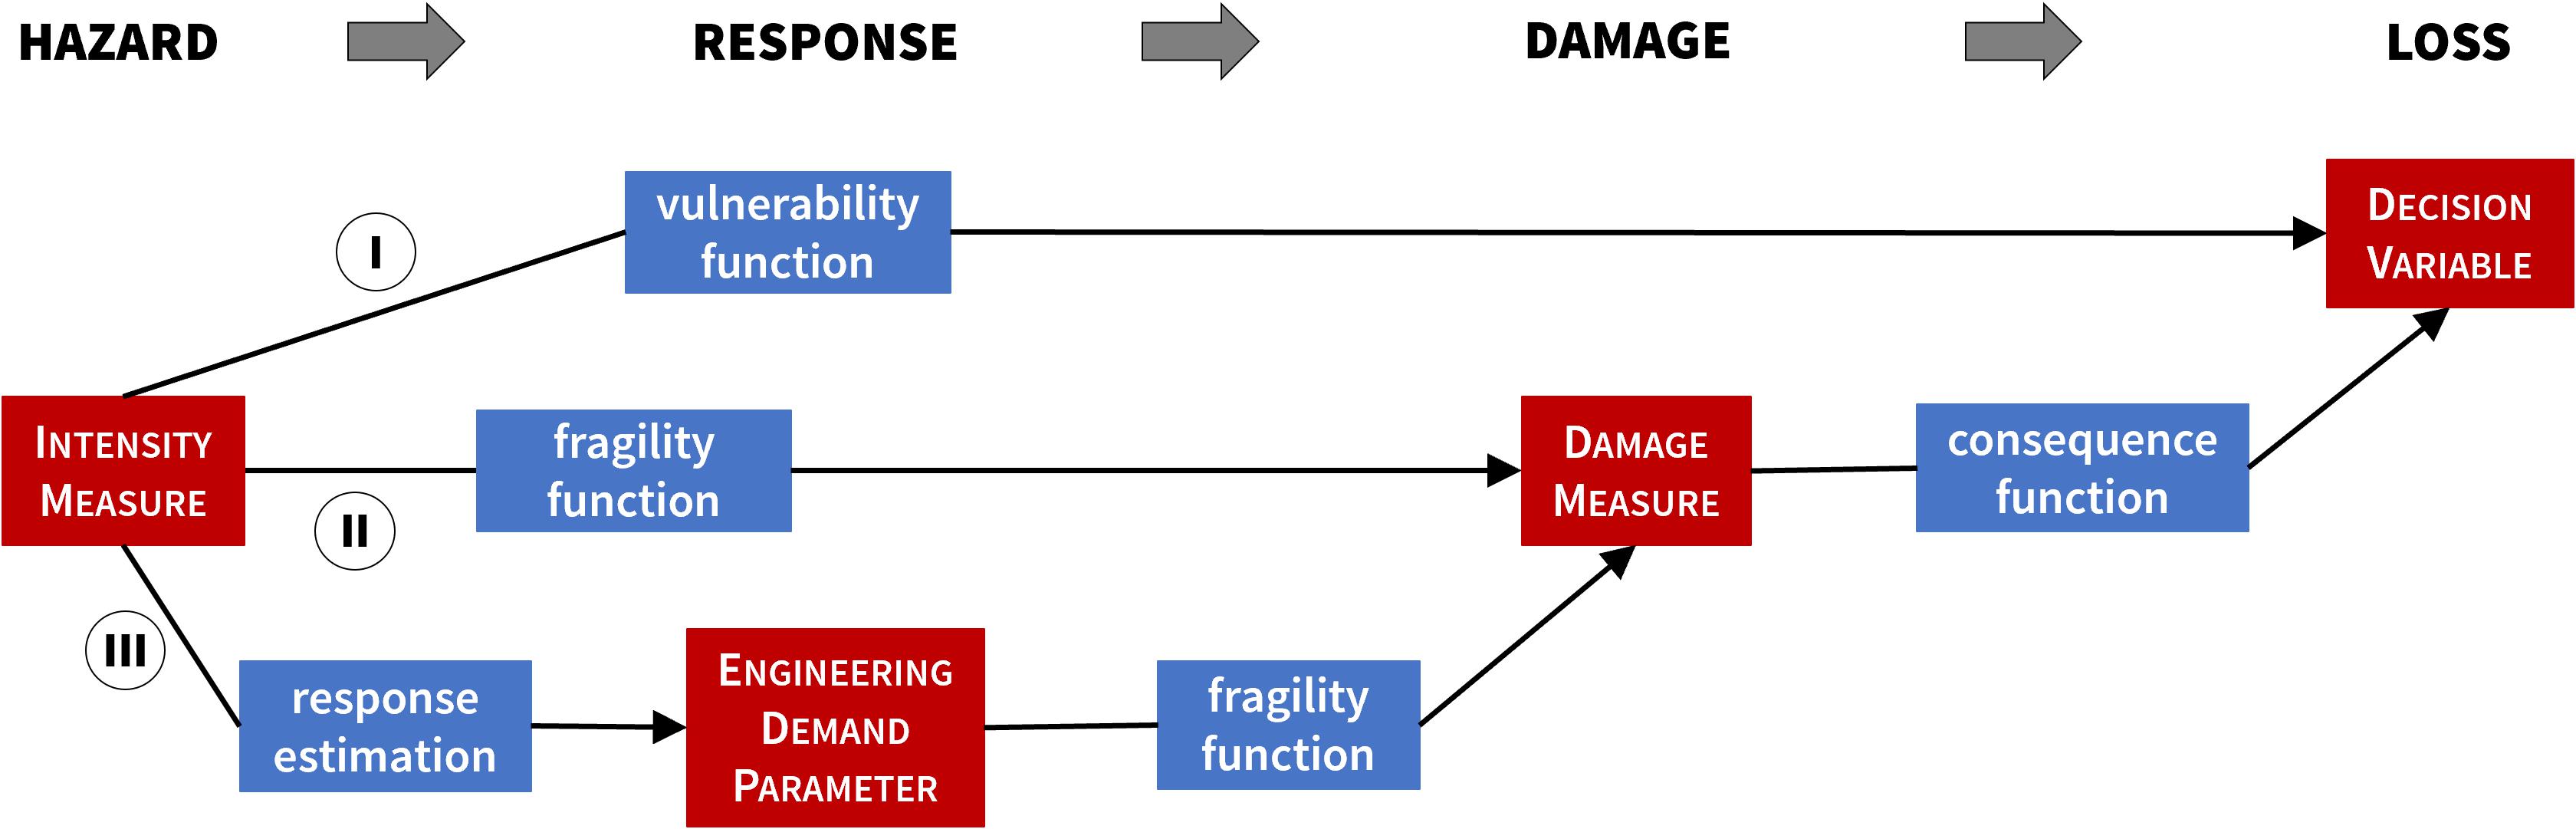
Figure 3. Schematic workflows for asset performance assessment.
In concept, any of the three paths outlined in Figure 3 can be adapted to evaluate the performance of practically any type of asset (i.e., buildings, transportation or lifeline components) to any natural hazard, although the details of the models and calculations can vary significantly. Moreover, since each asset is evaluated independently, alternative paths can be used for the various assets in the inventory. For example, detailed (Path III) analyses could be used for unique assets whose performance is vital to the community (e.g., tall buildings, hospitals, major bridges, power plants) while the less detailed Path I analyses could be used for assets for which simpler damage-prediction models are adequate (e.g., single-family homes, roads and highway overpasses, utility substations).
Where individual assets are part of a larger network, another layer of analysis and assessment is required to evaluate the performance of the network. For example, within a potable water network, the functionality of the network to deliver water will depend on the damage and repair times for individual pipe segments, storage tanks, pump stations, etc. Similarly, the performance of a transportation network will depend on the damage and repair of individual bridges, roadway segments, and interchanges between systems. In many cases, the network system analyses can be carried out using the same software that is used to simulate standard service functionality of the system, provided that the reduced functional state of the components and the boundary conditions (e.g., post-event transportation demands) are adjusted to reflect the natural hazard effects.
To assess and promote resilience to natural hazards, a final stage in the assessment is to understand and quantify the recovery from natural hazard disasters. This is important to more fully appreciate how disasters can affect communities and to develop strategies to promote recovery and, thereby, minimize the long-term effects of natural disasters. While the asset damage and estimated repair/replacement costs and time are important input data, recovery modeling goes beyond this to evaluate availability and management of resources and many other socio-economic factors that can impede or otherwise influence the recovery process. For recovery of individual buildings and infrastructure systems, some guidelines have been proposed to characterize and estimate impeding factors and offer suggested steps to facilitate recovery (e.g., REDI, 2013; Davis and Shamma, 2019). Frameworks for community resilience and recovery have been proposed (e.g., Bruneau et al., 2003; NIST, 2016a,b,c; Johnson, 2019), and work is underway by the NIST Center for Risk-Based Community Resilience Planning (Nist-COE, 2020) to develop computational models to support disaster resilience planning and post-disaster recovery. Development of models to quantitatively simulate regional recovery, such as with agent-based models, is a continuing research need that the SimCenter tools can be extended to support.
As mentioned previously, the SimCenter’s strategy to study effects of natural hazards from the individual building level to the regional simulation level is through the creation of an application framework for scientific workflow systems. Shown in Figure 4 is a more detailed abstraction of the framework, where the items listed across the bottom of the figure represent key components and the applications shown higher in the figure are workflow applications that the SimCenter has developed (McKenna, 2020). Figure 5 shows how the workflow components and applications are organized around cloud computing with supporting tools (e.g., Wilson et al., 2017; Dooley et al., 2018) to manage data transfer and interface with remote service providers, particularly those of the Texas Advanced Computing Center (TACC, 2020).
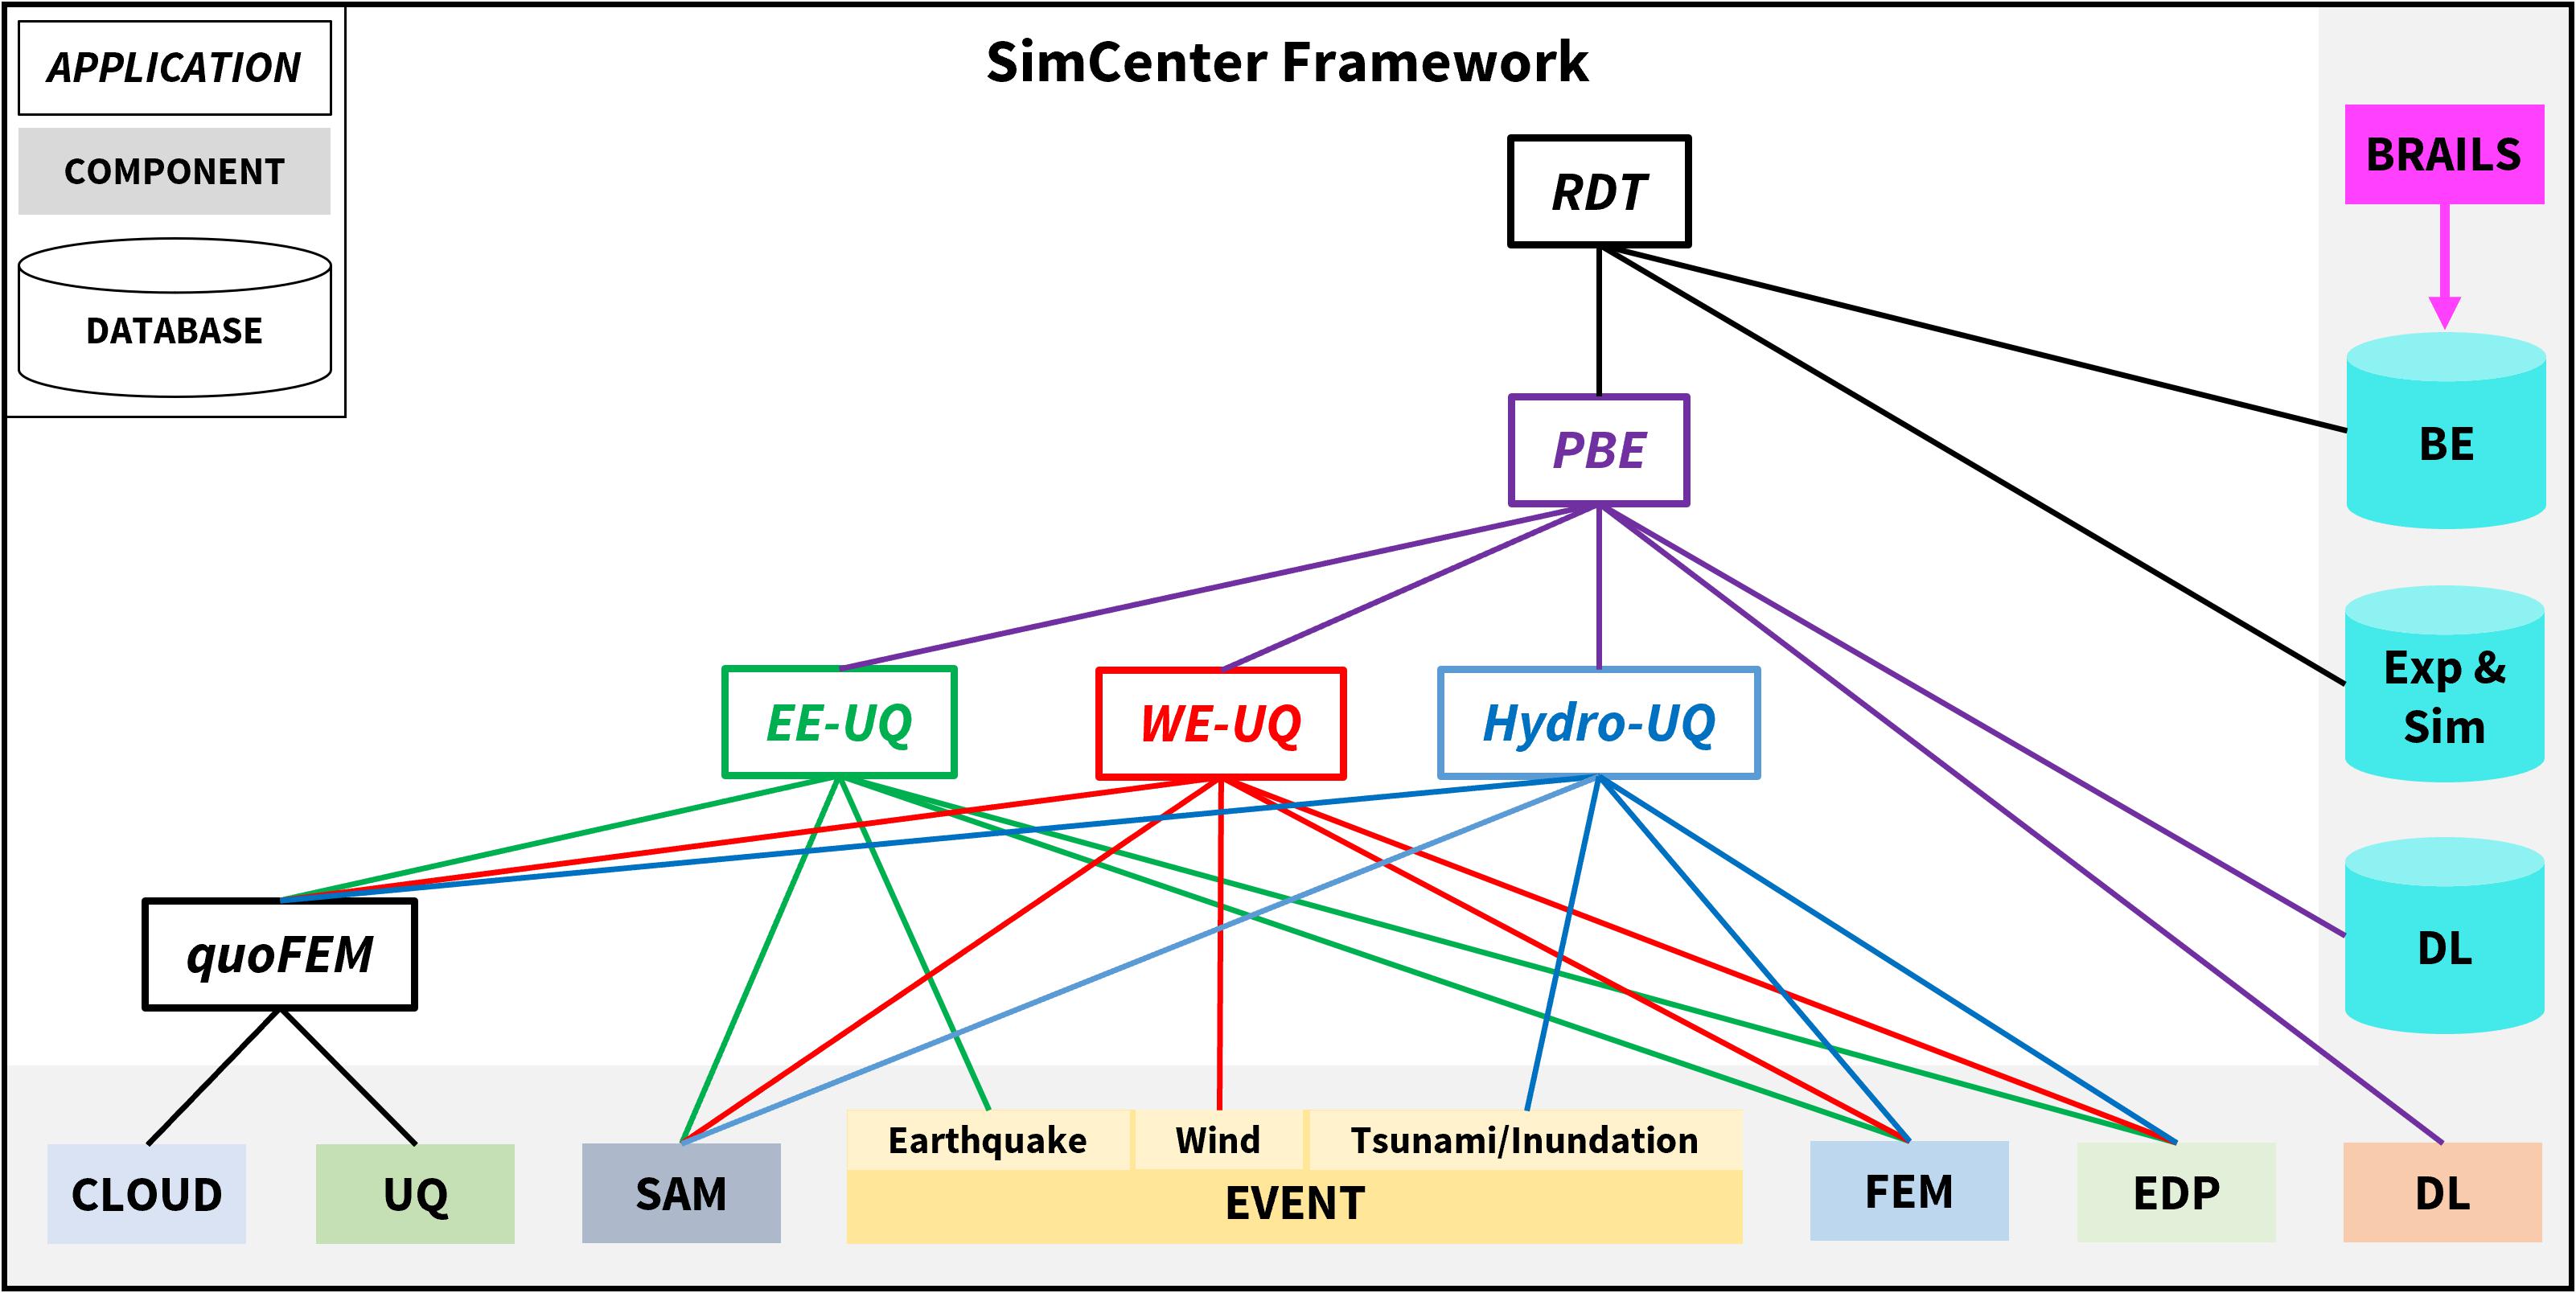
Figure 4. SimCenter framework components and applications.
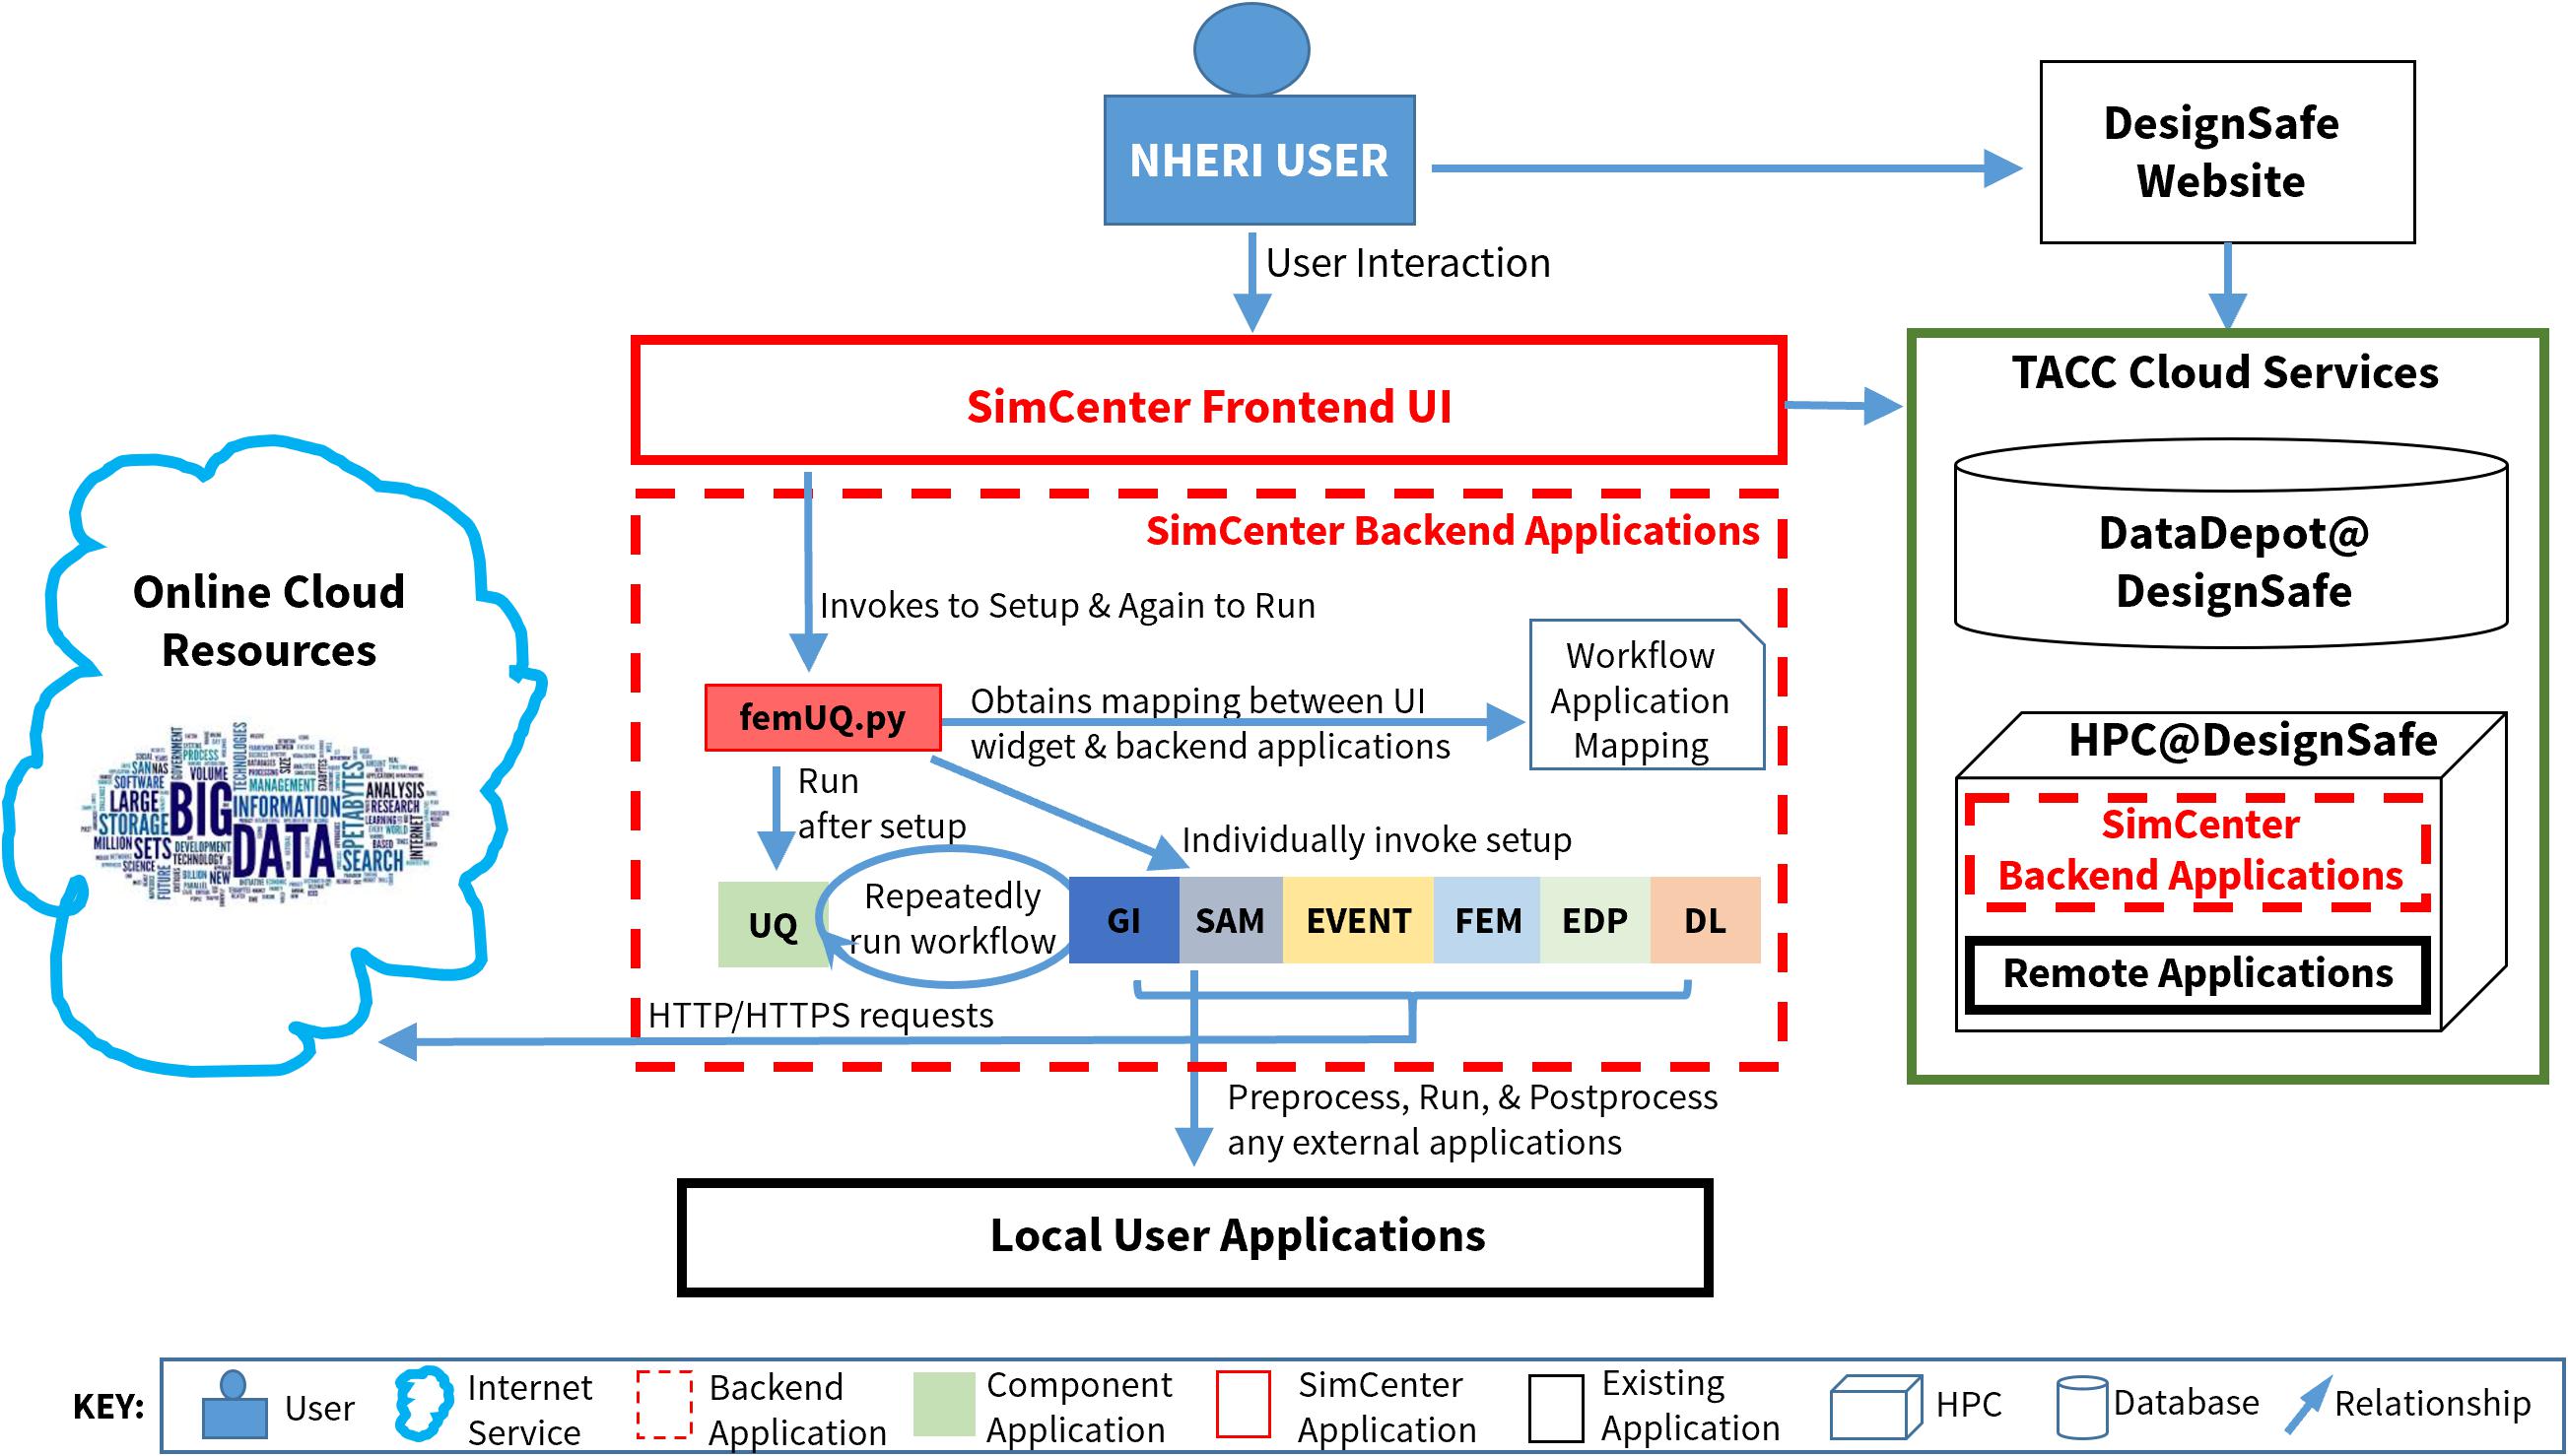
Figure 5. Integration of the SimCenter framework into the NHERI computational environment.
The SimCenter framework components include the following:
BE—Built Environment Inventory: The BE consists of meta-data and data files that define the inventory of physical assets for a regional simulation, including buildings, transportation components and systems, utility infrastructure components and systems, etc. By providing a framework to organize and store databases on DesignSafe, the SimCenter aims to promote best practices for collection and sharing inventory data. To help facilitate development of inventories, the SimCenter has developed artificial intelligence (AI) tools for building inventory data collection (BRAILS—Building Recognition using AI at Large Scale; Wang et al., 2019) and for data enhancement (SURF—Spatial Uncertainty Research Framework; Wang, 2019), along with web data query/collection techniques.
EVENT—Hazard Event: The EVENT consists of meta-data and data files that define the hazard data (e.g., earthquake ground motions, wind fields, storm surge inundation, tsunami inundation). For earthquake hazard studies, the SimCenter workflow tools include software applications for (i) generating earthquake target spectra from the USGS OpenSHA web service, (ii) selecting and scaling recorded ground motions from the PEER NGA database, (iii) generating simulated stochastic ground motions, and (iv) ingesting simulated ground motions from databases of simulated and recorded ground motions. For wind and storm surge studies, the workflow can support (i) generating wind field time histories stochastically or using OpenFOAM (2020), (ii) incorporating experimental wind tunnel datasets utilizing online resources such as Vortex Winds (Kareem and Kwon, 2017) and the TPU Aerodynamic Database (TPU, 2020), or a user’s own local dataset, and (iii) interfaces for querying and ingesting wind speeds and storm surge inundation heights from external applications.
SAM—Structural Analysis Model: The SAM is the workflow component that includes rule-based, AI and other types of applications to translate descriptive information from the built environment inventory into information to create finite element or other types of models to simulate the structural response to the hazard effects.
FEM—Finite Element Modeling: The FEM module consists primarily of wrappers for input/output to existing finite element software to simulate the response of structures and geotechnical materials to earthquake ground shaking, wind, storm surge wave loading, and tsunami wave loading. Such analyses could also encompass CFD and structure-fluid interaction. OpenSees (2020) and OpenFOAM (2020) are the main open source applications that are called by the current FEM wrappers.
EDP—Engineering Demand Parameters: The EDP represents the workflow component that defines and manages the output of hazard-induced deformation or other demands from a finite element or other type of analysis model for input into the damage and loss assessment.
DL—Damage and Losses: DL is the workflow component where damage and losses are calculated for the assets in the built environment inventory. Since these calculations are essential to all performance assessments and not readily available in existing software, the SimCenter developed an application framework called PELICUN, Probabilistic Estimation of Losses, Injuries, and Community Resilience Under Natural Disasters (Zsarnóczay, 2019; Zsarnóczay and Deierlein, 2020), to generalize the FEMA P-58 methodology to evaluate damage and losses in buildings and other facilities under earthquakes, hurricanes and other hazards. Referring back to Figure 3, PELICUN supports multiple paths for calculating DVs, from simplified (path I) approaches using vulnerability functions to the most detailed approach (path III). The PELICUN framework is customizable to permit a wide range of methods to address multiple facility types, multiple hazards, and multiple levels of refinement.
UQ—Uncertainty Quantification: The UQ component provides an interface to software and routines for methods of uncertainty quantification, which can be interfaced with other components. One of the registered applications supported by UQ is DAKOTA (Adams et al., 2019), which offers a range of methods for uncertainty quantification.
Cloud: Workflow component that manages communication with remote computing and data service providers and sending/receiving data over the web.
DL Data: Databases of fragility curves for damage and loss calculations for various types of facilities (buildings, bridges, infrastructure) subjected to demands from various hazards (earthquake, wind, surge).
Exp/Sim Data: Databases of experimental and/or computational research data that is utilized for machine learning SAM applications and code validation.
While researchers can develop specialized workflows that include their own applications, along with applications and libraries of the SimCenter framework (Figure 4), the required computer programming skills and familiarity with the application framework may inhibit widespread utilization of the computational tools. To facilitate broad use of the framework components for standard research studies, several desktop applications have been developed. The desktop applications are scientific workflow systems with graphical user interfaces that create workflows to (1) run the associated computations either on the user’s local computer or seamlessly with cloud computing resources, and (2) view the results of the workflows. These desktop applications have initially been implemented to run SimCenter framework components, and they can be modified to include user-supplied components. These desktop applications include:
quoFEM: The Quantified Uncertainty with Optimization for the Finite Element Method application facilitates the routine uncertainty quantification calculations by combining software systems for uncertainty quantification and optimization with finite element analysis to run locally or on high performance computing cloud resources. As shown in Figure 4, quoFEM is built with the UQ and cloud computing resources of the framework.
EE-UQ: This is an earthquake engineering application to determine the response, including UQ, of a structure to an earthquake excitation. The tool focuses on the structural model and will evolve to include soil-structure interaction models imposing boundary conditions necessary to impart the earthquake motion. The application builds upon quoFEM, adding the SAM, earthquake EVENT and FEM components of the framework.
WE-UQ: This is a wind engineering application to assess the response of buildings to wind loading, taking into account that the properties of the building and the wind loads are not known exactly, and given that the simulation software and the user make simplifying assumptions in the numerical modeling of the structure. It is similar in composition to EE-UQ, but with a wind EVENT component.
Hydro-UQ: This is a planned (future) application to assess the response of structures to water flows from storm surge or tsunamis. This tool will be similar to EE-UQ and WE-UQ, but with tsunami and coastal inundation EVENT components.
PBE: The performance-based engineering application is an extensible workflow application to evaluate the performance of buildings or other assets to natural hazards. The current release provides researchers a tool to assess the performance of a buildings to earthquake ground shaking, building off the EE-UQ application. As shown in Figure 4, future releases are anticipated to extend the features to assess building performance to wind (building off the WE-UQ application) and water flows (building off the planned Hydro-UQ application) by adding the DL component.
RDT: The Regional Decision Tool is under development to facilitate regional hazard scenario studies of the sort described in the next section of this paper.
To demonstrate the features and capabilities of the cloud-based regional simulations, computational workflows are described for two testbed studies that utilize components of the SimCenter framework. One is an earthquake scenario for the San Francisco Bay area, and the second is a hurricane scenario for the Atlantic City region of the New Jersey coast. Additional testbeds, including one looking at earthquake risk to a water distribution system in Memphis, are also under development.
The San Francisco Bay Area encompasses three large cities, San Francisco, Oakland and San Jose, which together with the surrounding communities have a population of about 7.7 million people. The seismic hazard in the San Francisco Bay Area is dominated by the San Andreas and Hayward faults that straddle the region. The San Andreas Fault is located just to the west of San Francisco and is capable of a magnitude Mw 8 earthquake, such as the Mw ∼7.8 event that occurred in 1906. The Hayward Fault, which runs up the eastern edge of the Bay Area, is capable of a magnitude Mw 7 earthquake, such as the Mw ∼6.7 event that occurred in 1868. Recently, the USGS completed an earthquake scenario study for a Mw 7 event on the Hayward fault, which provided an opportunity to contrast existing regional assessment methods with the SimCenter’s computational workflow.
The SimCenter workflow tools were applied to assess the performance of 1.84 M buildings in the San Francisco Bay Area due to a Mw 7.0 earthquake rupture on the Hayward fault. Probabilistic assessment of earthquake consequences with building (parcel) level resolution at this scale is only feasible using high performance computing resources, which is facilitated by SimCenter’s regional Workflow for Hazard and Loss Estimation (rWHALE, Elhaddad et al., 2019). The testbed focuses on assessment of response, damage, repair costs, and repair times for all 1.84 M buildings in the simulation.
This study used a parcel-level inventory of buildings in the Bay Area that was developed by UrbanSim (Waddell, 2002) using public resources such as the City and County of San Francisco’s data portal (DataSF, 2020) and tax assessor databases. The database includes locations (latitude, longitude), total floor areas, number of stories, year of construction, and the occupancy type for each building. The available information about location and building geometry were refined by merging the UrbanSim database with the publicly available Microsoft Building Footprint data (Microsoft, 2020) for the testbed area. These data were used to populate two additional attributes, replacement cost and structure type, based on a ruleset that considers local design practice and real estate pricing. For further details about the database and ruleset see Elhaddad et al. (2019).
The ground motions for the Mw 7.0 Hayward earthquake were simulated by Rodgers et al. (2019) at the Lawrence Livermore National Lab (LLNL) using the SW4 finite difference code (Petersson and Sjogreen, 2017). SW4 solves the elasto dynamic equations of motion in the time domain for a 3D solid. A 77 × 13 km rupture surface was projected onto the fault geometry in the 3D geologic and seismic model for the Bay Area (USGS, 2018) with a hypocenter near the San Leandro salient. Waveforms were sampled in three dimensions on a 2 km grid over the 120 × 80 km surface of a 35 km deep solid body. The resulting waveforms capture ground shaking reliably over the 0–5 Hz frequency domain for sites with a characteristic shear wave velocity above 500 m/s. The computations were run using more than 8,000 nodes (∼500,000 processors) on the Cori Phase-II cluster (NERSC, 2020).
The raw results at 2301 grid points were processed by the SimCenter and converted to the JSON file format used by our workflow applications. These data provide sets of three-component seismograms for grid points spaced every 2 km throughout the study region. The ground motions are assigned to buildings using a nearest-neighbor search algorithm, where the four nearest grid points are identified for each building and a set of 25 seismograms are assigned by weighted random sampling of the set of time histories from the nearest grid points. The weight of each grid point is inversely proportional to its squared distance from the building.
The non-linear response of buildings to ground shaking is simulated using OpenSees (OpenSees 2020) and an application, MDOF-LU, that generates an idealized structural analysis model based on structure type, height, plan area, year of construction and the type of occupancy. The MDOF-LU application is based on a method developed by Lu et al. (2014) that uses the building configurations in the HAZUS earthquake technical manual and corresponding capacity curve descriptions to define a multi-story non-linear shear-column finite element model with lumped masses.
Each of the 1.84 M building models is analyzed for 25 pairs of 2D ground motions, where the peak story drift ratios and peak floor accelerations are recorded for subsequent damage and loss analyses. The approximations and uncertainties in the structural model and behavior are considered by treating the initial stiffness and the damping ratio as random variables with a 0.1 coefficient of variation. These uncertainties are propagated through the analysis using different realizations of the stiffness and damping parameters for each of the 25 non-linear dynamic analyses for each building.
The building performance assessment was performed on a story-level basis using PELICUN (Zsarnóczay and Deierlein, 2020), where damage and losses are calculated with story-level fragility functions based on the peak story drift and floor acceleration demands. The story-based damage and loss fragility functions are derived from corresponding building-level damage and loss functions from the HAZUS earthquake model (FEMA, 2018a) based on the characteristic data for each building (e.g., year of construction, structure type, occupancy type). Collapse safety limit states are evaluated directly from the story drift demands, where a collapse of one or more stories is considered as partial collapse of the entire building. The story drift and floor accelerations from 25 non-linear analyses of each building are used to define multivariate lognormal distributions of peak drifts and accelerations for each story of the building, and the dispersion in the drift and acceleration demands is inflated by 0.22 to account for additional modeling uncertainties not considered in the non-linear dynamic analyses. Using the distributions of earthquake demands, and damage and loss functions, PELICUN generates 20,000 realizations of damage and losses for each building, and stores statistics of the resulting performance data that are relevant for regional-scale evaluation. The results are output as HDF5 (Hierarchical Data Format) files that can be processed and visualized through MatLab, Python, Jupyter notebooks, or converted to CSV format.
Although the applications used in this testbed and rWHALE are available on multiple platforms, analyses on desktop computers are typically limited to small test runs before starting the full set of computations on a high-performance cluster computer. For perspective, the analyses for this study of 1.84 M buildings (each represented by a simplified non-linear MDOF model analyzed for 25 ground motions with OpenSees, and subsequently 20,000 damage/loss realizations with PELICUN) required about 16 h of computing time on 12,800 Intel Knights Landing cores on Stampede2 (TACC, 2020), made available by DesignSafe. Staff at the SimCenter and DesignSafe collaborated to develop and fine-tune the details of rWHALE to maximize performance. In particular, (1) the size and number of files, file operations, and memory use need to be kept under control, and (2) versions and special characteristics of the hardware, external tools, compilers, and dependencies need to be considered in allocating resources and other decisions in processing the analyses.
The SimCenter testbed workflow provides an opportunity to test and improve rWHALE with the ultimate goal of allowing researchers to run such simulations without having to concern themselves with details of the high-performance computing environment. The simulation is controlled by data and configuration text files, prepared in the JSON file format. The default data file includes the building information and ground motion data. The configuration file assigns workflow applications to the various tasks in the workflow and sets a small number of parameters (such as the number of samples generated) to configure the workflow applications. Researchers can customize their simulations by downloading and modifying these files. Currently, rWHALE is controlled either through the web interface of DesignSafe or through a terminal after logging in to Stampede2 (TACC, 2020).
An example of the resulting losses calculated for the Mw 7.0 Hayward scenario are shown in Figure 6. The color shading represents the loss ratios for each building, calculated as the mean repair costs normalized by the building replacement value. Also shown in the figure is a comparison to the loss ratios reported in the USGS Mw 7.0 Haywired Earthquake Scenario (Hudnut et al., 2018). Exposure and losses in the Haywired scenario were calculated using the HAZUS software. While it is instructive to compare results between the two studies, there are differences in the input data, scope and goals of the studies which are important to keep in mind. As the main purpose of the SimCenter testbed was to assemble and exercise the computational workflow, the models and results in the SimCenter study are preliminary, based on readily available information and implemented by a small team over a couple months. This contrasts with the multi-year multi-investigator Haywired study, whose goal is to inform earthquake planning and preparedness for the San Francisco Bay Area.
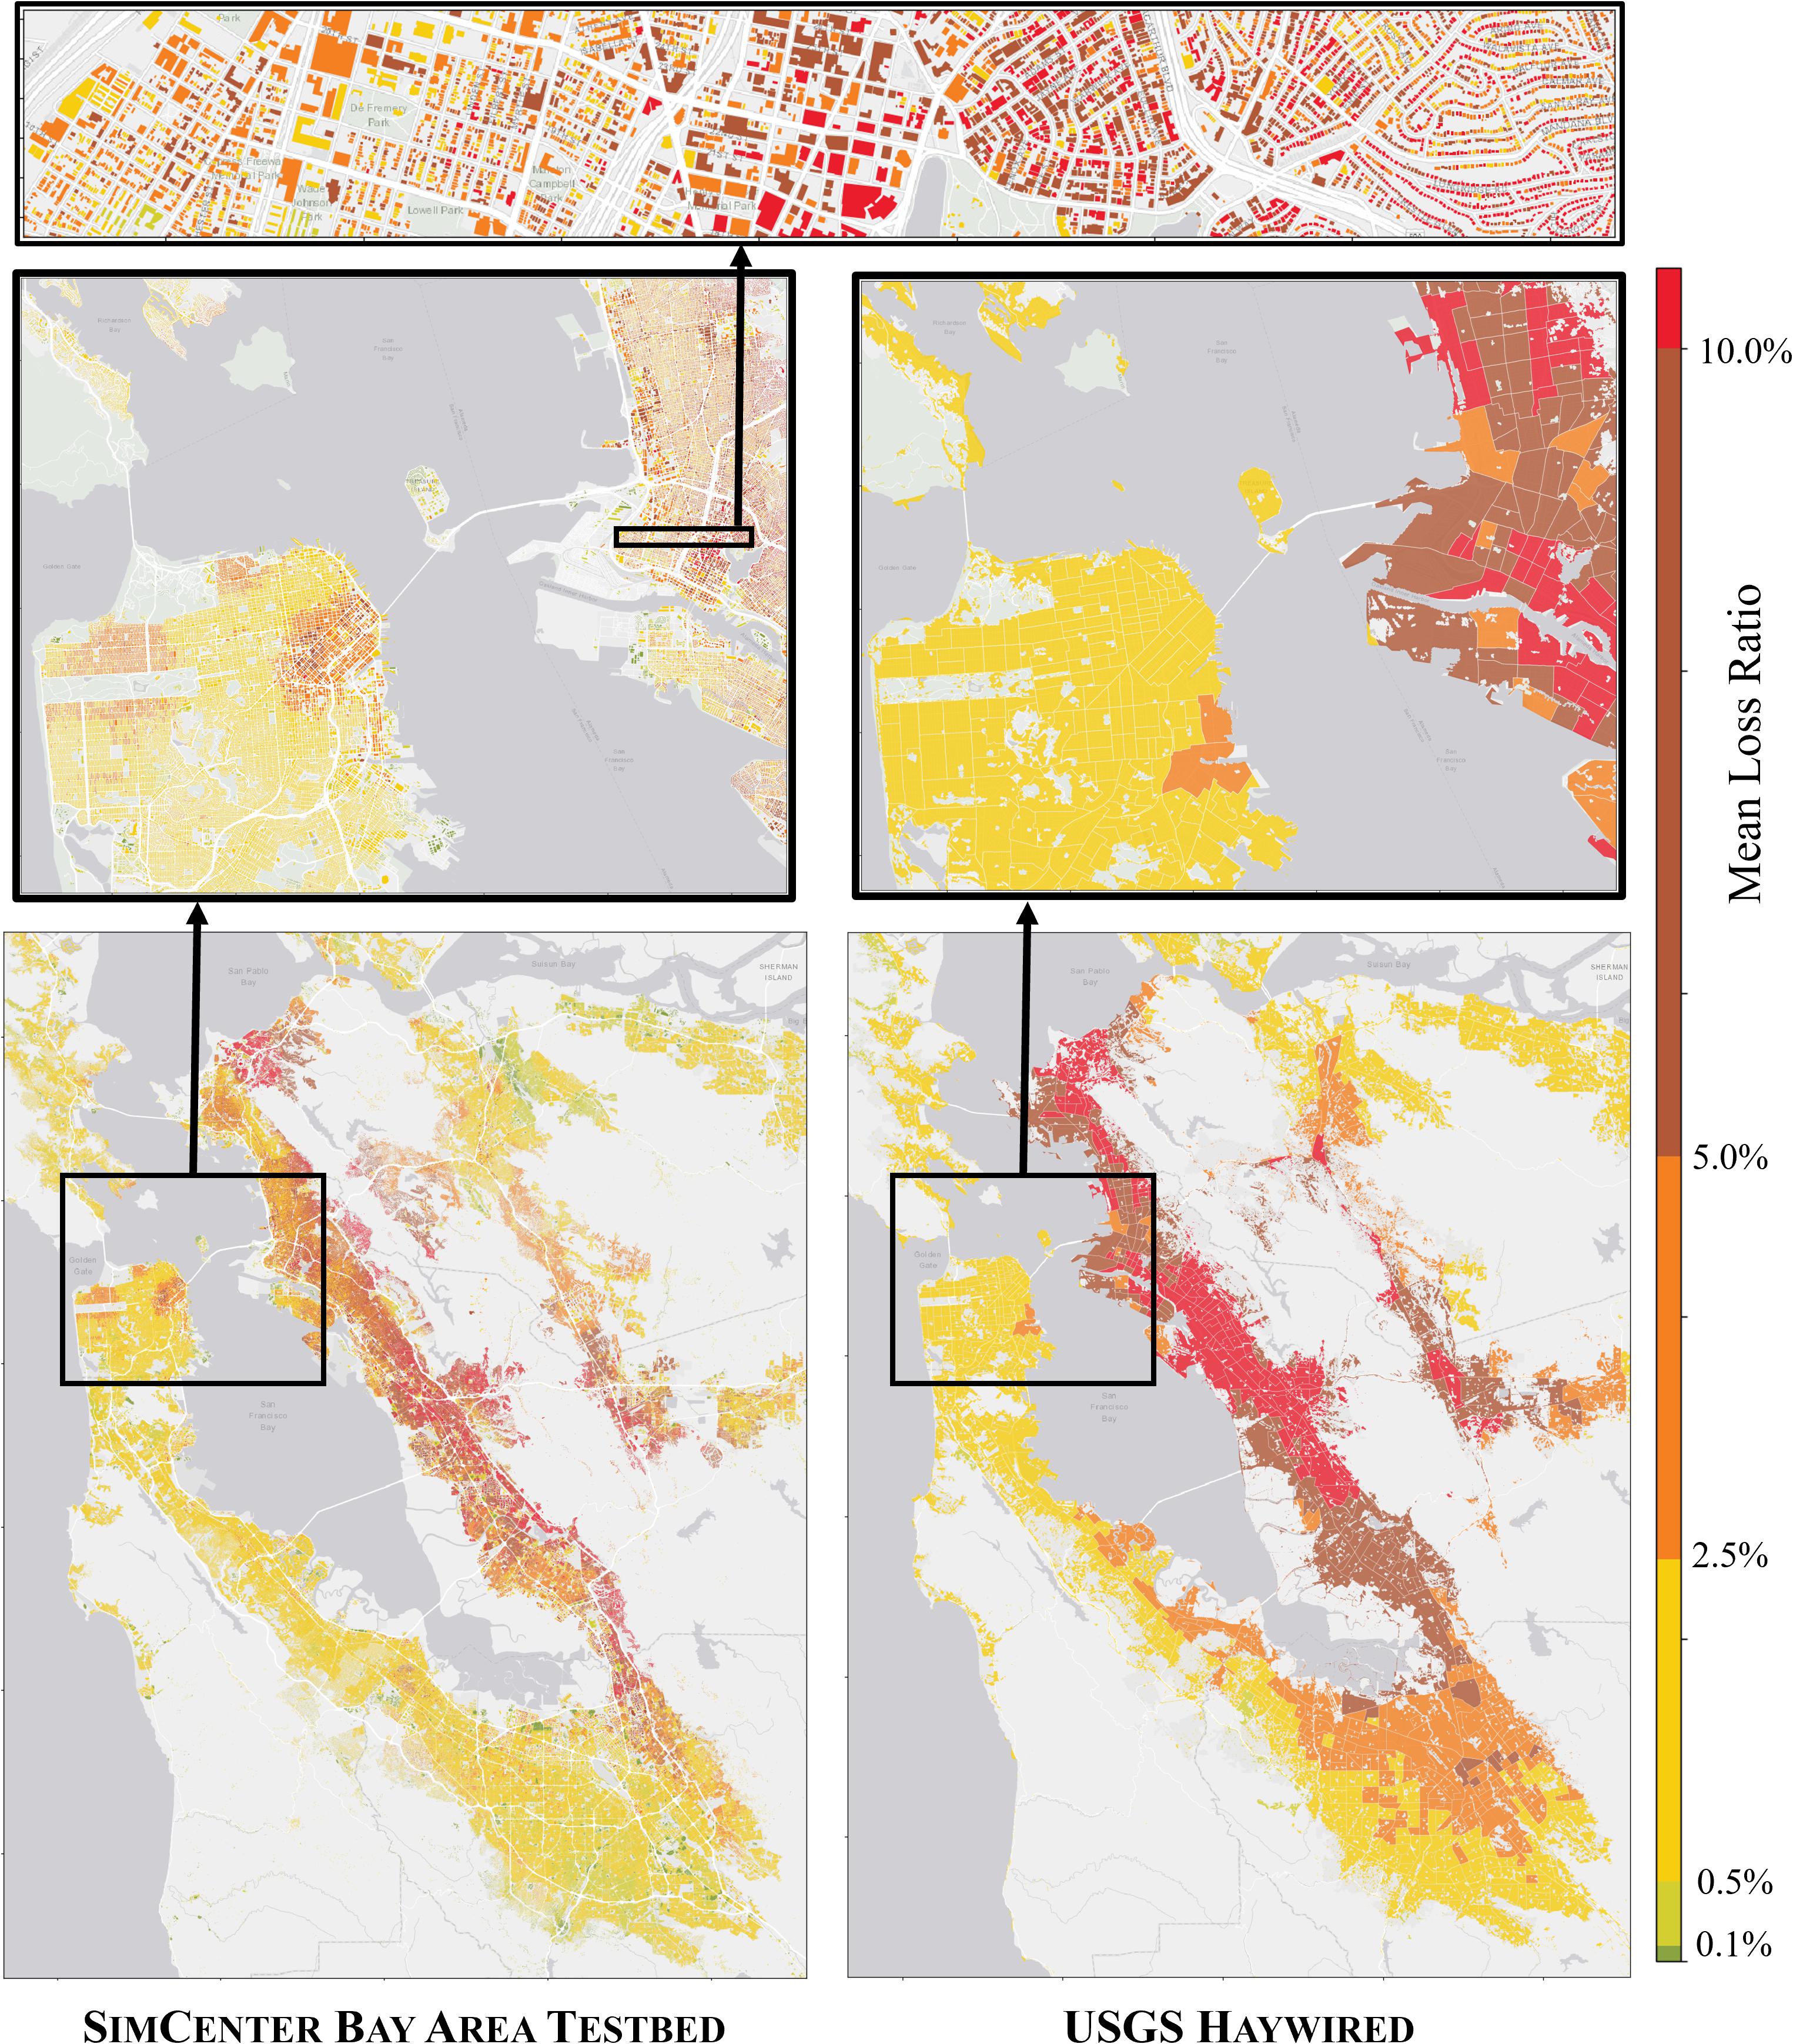
Figure 6. Comparison of building loss ratios from San Francisco testbed—SimCenter (left), USGS-Haywired (right).
Both studies were based on Mw 7.0 Hayward fault ruptures simulated using the SW4 software by the LLNL research group, however, the ground motion time histories are different for the two studies. Epicenters for the two earthquake scenarios are close (East Oakland and San Leandro for Haywired and SimCenter, respectively), but other rupture characteristics are different and the SimCenter ground motions were simulated with more recent versions of the SW4 engine and the USGS geophysical model of the Bay Area. In general, the ground motions used in the SimCenter study are less severe than those used in the earlier Haywired study, and they are in better agreement with expectations based on past earthquake data.
The Haywired study extends over an area including the counties of Monterey, Sacramento, and Sonoma, whereas the SimCenter testbed is limited to the central six counties from Santa Clara to Marin. Due to the larger coverage, the Haywired study had a larger total building population (3.04 M), but the number of buildings in the six central counties in the Haywired study (1.71 M) is comparable to the number in the SimCenter database (1.84M). There are, however, large differences in the total square footage (in the central six counties) and inventory value (replacement values) between the building exposure databases, which make comparisons of total losses between the two studies questionable.
To reduce the influence of the differences in the building exposure values in the two studies, the comparison is limited to damage and loss ratios in the six central counties. The average loss ratio over the entire building population is less in the SimCenter testbed (∼3% of replacement value) as compared to the Haywired study (∼5% of replacement value). Nevertheless, as shown in Figure 6, the geographical distribution of losses shows good agreement between the two. The SimCenter study predicts a larger ratio of non-structural to structural damage (7.5:1 vs. 4.5:1 in the Haywired study) and considerably smaller fractions of the building stock being collapsed (less than 0.01 vs. 0.8%) and red-tagged (0.1 vs. 10%). Accordingly, the proportion of buildings that sustain minor or no damage is higher in the SimCenter study compared to Haywired (58 vs. 49%). These results are consistent with the less intense ground motions in the SimCenter scenario, and they highlight the sensitivity of results of such complex studies to inventory data, models for response, damage, and losses, and the input ground motions.
An important distinction between the HAZUS-based Haywired study and the SimCenter workflow simulation is the level of resolution in the assessment and the propagation of various sources of uncertainty throughout the simulation. Whereas the HAZUS-based study aggregates building damage and losses based on census track (zip code) data, the SimCenter workflow has resolution down to the building parcel level, and it can disaggregate losses within a building down to individual components on each floor. This feature, coupled with a detailed description of the probability distributions of damage and losses for each building, can allow urban planners and policy makers to query various possible outcomes–including the rare, but catastrophic ones–of the earthquake scenario. High-resolution results (see upper panels in Figure 6) provide valuable data for exercises in emergency response, and simulations of post-disaster recovery. In addition, the SimCenter workflow and underlying tools facilitate the combination of models with varying levels of fidelity, where for example, performance for some buildings can be determined using simplified HAZUS type loss functions, while performance for other buildings can be determined using the detailed non-linear structural analysis models and FEMA P-58 component-based damage and loss functions. As such, the high-resolution and multi-fidelity workflow simulations offer increased opportunities to explore questions related to land use planning and zoning, seismic design and retrofit requirements, public policy and administrative initiatives, and other actions to enhance community resilience.
Wind and coastal hazards affect a wide spectrum of the built environment, from low-rise wood-frame residential construction through to tall, flexible buildings susceptible to dynamic wind effects. The selection of Atlantic City for the hurricane testbed prioritized a locale where (1) both of these extremes of building type were present within a compact footprint, (2) open-data was sufficient to describe the building inventory, and (3) high-fidelity characterizations of wind, storm surge and wave action were readily available to exercise computational workflows for damage assessment. The open data inventory and development of a Storm Hazard Projection (SHP) tool in the NJ Coast project (Kijewski-Correa et al., 2019; NJ Coast, 2020) makes New Jersey, and specifically Atlantic City, well suited for the hurricane hazard testbed, offering a well-defined metro area with a blend of low-rise commercial (1–3 stories), industrial, high-rise hotels/casinos (over 20 stories), and single/multi-family residential construction. The testbed domain, shown in Figure 7, includes 20,654 parcels with diverse building typologies (wood-frame, masonry, steel/RC frames, metal building systems) spread across five municipalities.
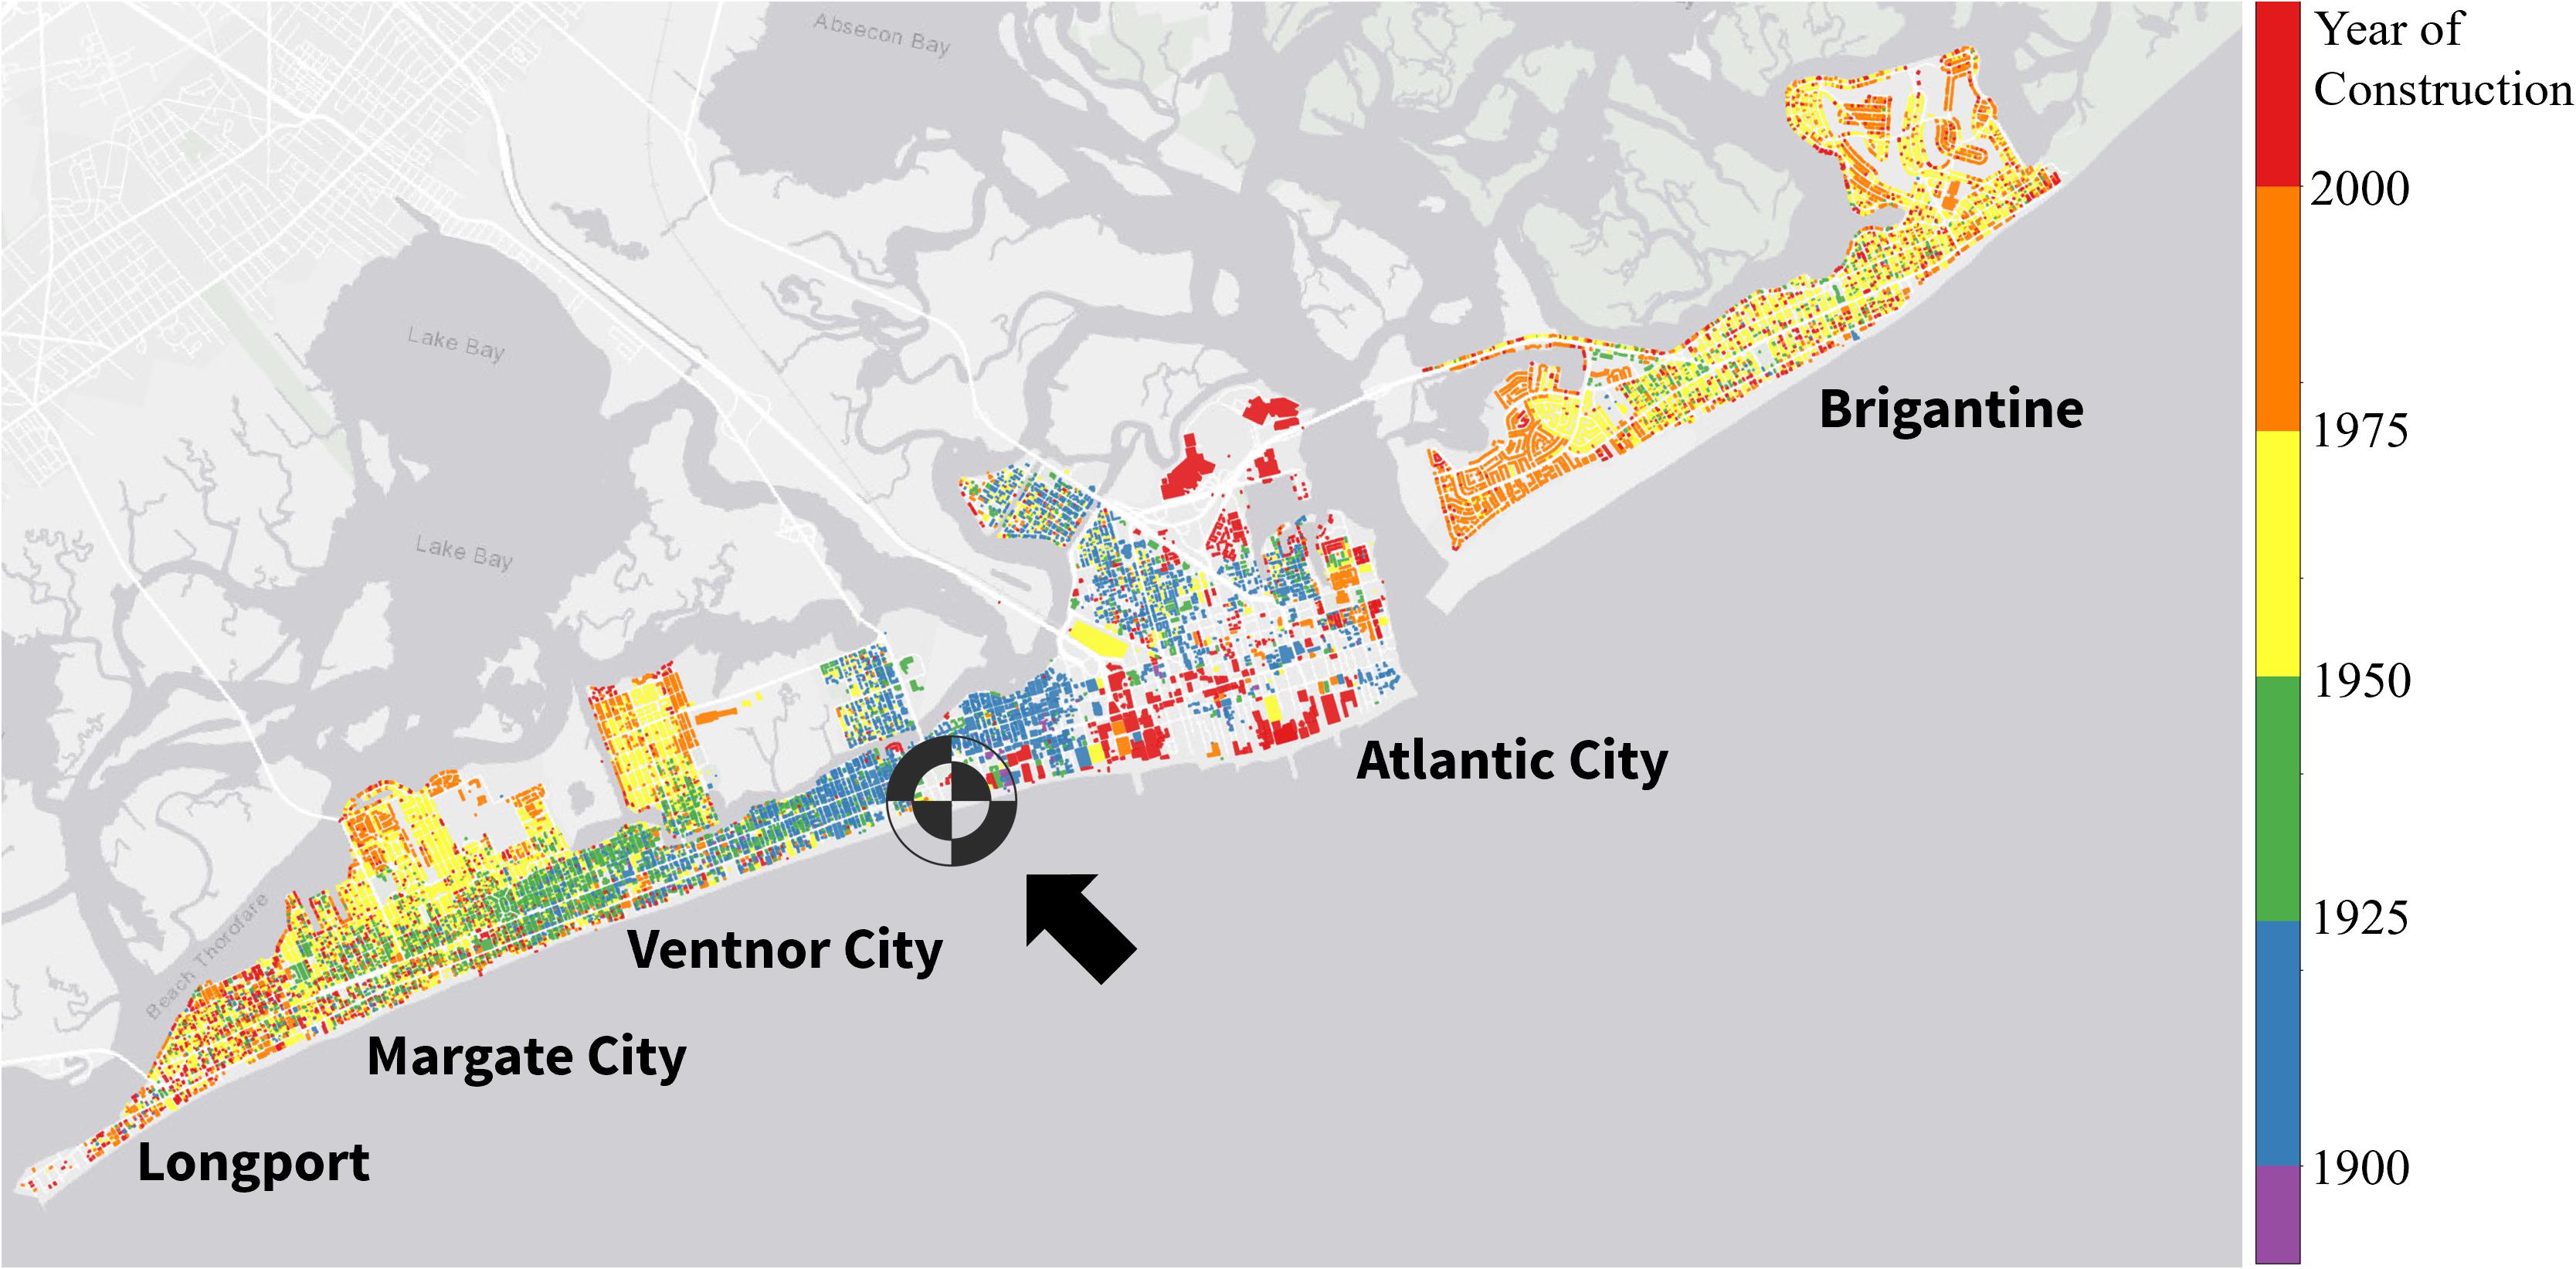
Figure 7. Atlantic City testbed inventory (across five municipalities) by year of construction with landfall location marked by target icon.
The following sections describe the initial approach to each module of the workflow, which prioritized wind effects on wood-frame residential construction, as well as module capabilities to be added in future releases of the testbed. The workflow was initially demonstrated for a hazard scenario estimated using the NJcoast SHP Tool and a Maximum of Maximums approach across 25 hurricane tracks with Category 5 intensity (central pressure differential of 75–100 mbar, RMW of 15.4–98 mi) making landfall near the Atlantic City Beach Patrol Station (39.348308, −74.452544) under average tides. This scenario is sufficient to inundate the entire inventory and generate significant wave run-up in some locales.
The description of assets in the inventory adopts an augmented parcel approach that initiates with the assignment of HAZUS-consistent building classifications through a series of rulesets using fields common in tax assessor data, called MOD IV in the New Jersey database (NJGIN, 2020). To overcome inevitable gaps and errors in these large state-wide datasets, a SimCenter developed AI-powered Spatial Uncertainty Research Framework package, SURF (Wang, 2019), is employed to discover patterns in the dataset and to enhance it. SURF employs a neural network, which is trained on the raw dataset to learn the patterns of building attributes; it is then used to predict values for parcels that have empty data fields. As roof geometry is not a standard field in MOD IV data, satellite imagery is processed to further augment the basic parcel data. The SimCenter developed application Building Recognition using Artificial Intelligence at Large Scales, BRAILS (Wang et al., 2019), is used to interpret satellite images of building roofs, which are collected from Google Maps. The satellite images are labeled with shape types to form a dataset, upon which a Convolutional Neural Network is trained so that it can give rapid predictions of roof types when given new images of roofs. Microsoft Building Footprint data is used as the location index when downloading images automatically from Google Maps. While more complex roof shapes could, in theory, be classified, the current use of HAZUS damage and loss functions required the use of similitude measures to define each roof as an “effective” gable, hip or flat geometry. Using BRAILS, this classification was achieved with approximately 85% accuracy based on validation studies. BRAILS is under active development and in the next iteration of the testbed it is expected to be able to extract fully three-dimensional building geometries using satellite plus StreetView imagery, enabling fluid pressures to be calculated over building surfaces. Automated image processing of this type can also mine detailed dimensional and geometric data (e.g., roof pitch, eave length, elevations of lowest horizontal structural member, etc.), as well as classify building components (e.g., envelope cover, foundation systems, breakaway walls, and more).
The initial implementation of the testbed directly integrates the highly efficient, linear analytical model for the boundary layer winds of a moving hurricane developed by Snaiki and Wu (2017a, b) as implemented in the NJcoast SHP Tool. To account for the exposure in each New Jersey county, an effective roughness length (weighted average) of the upwind terrain is used based on the Land Use/Land Cover data reported by the state’s Bureau of GIS. While the model is fully height-resolving and time-evolving, for a given five parameter hurricane scenario, the wind hazard is characterized by the maximum 10 min mean wind speed observed during the entire hurricane track. This is reported at the reference height of 10 m over a uniform grid (0.85-mile spacing, 1.37 km), which is then accordingly adjusted for compatibility with the averaging interval assumed by the HAZUS Hurricane Damage and Loss Model. Alternatively, the basic wind speeds defined in ASCE 7–16 are also available as inputs to the simulation by taking advantage of the Applied Technology Council (ATC) Hazards by Location API (ATC 2020a). Wind fields described by either approach are then locally interpolated to the site of each parcel in the inventory.
Coastal hazard descriptions use the outputs of the aforementioned SHP Tool, which estimates storm surge and total run up due to the breaking of near-shore waves for an arbitrary hurricane scenario using surrogate modeling techniques (Jia and Taflanidis, 2013; Jia et al., 2015). The SHP Tool leverages the US Army Corps of Engineers (USACE) NACCS: North Atlantic Coastal Comprehensive Study (Nadal-Caraballo et al., 2015), which contains over 1,000 high-fidelity numerical simulations of hurricanes using the ADCIRC (Luettich et al., 1992) storm surge model, coupled with STWAVE (Smith et al., 2001) to capture the additional effects of waves offshore. The NACCS database was further enhanced with wave run-up simulations that capture the interaction of the waves with site-specific bathymetry/topography (2015 USGS CoNED Topobathy DEM: New Jersey and Delaware (1888–2014) dataset) to project the total run up inland, along transects spaced 0.5 km apart along the New Jersey coast. This results in a prediction of storm surge height at the USACE-defined save points along the New Jersey coast that are, on average, 200 m apart, with finer resolution in areas with complex topographies. The SHP Tool was executed for the testbed scenario to estimate the depth of storm surge above ground, geospatially interpolated to 110,000 nearshore locations at approximately 120 m spacing, accompanied by the Limit of Moderate Wave Action (LiMWA) and wet-dry boundary, respectively, defining the extent of damaging waves and inundation over land at each of the transect points. These are then interpolated to the location of the coastal parcels to express the property exposure to storm surge and possibly damaging wave action.
The initial implementation of the hurricane testbed, which is described here, is limited to consideration of wind damage and losses. Further, the calculation of wind effects does not require structural analysis to estimate EDPs, but rather adopts an approach (Path II in Figure 3) where damage and losses are calculated directly from the wind speed. Damage and loss functions from the HAZUS Hurricane Damage and Loss Model (FEMA, 2018a) were implemented in PELICUN to support HAZUS’s 3520 different wooden building configurations available for hurricane loss modeling. The HAZUS functions consist of tabular data to describe the fragility or expected losses as a function of wind speed. These data were used to calibrate coupled damage and loss models to estimate the damage state and the corresponding expected loss ratio for each building configuration in PELICUN. Continuous functions (Normal or Lognormal cumulative distribution functions) were fit to the synthetic data by maximizing the likelihood of the observations assuming a Binomial distribution of outcomes at each discrete wind speed in the HAZUS database. Only data up to 200 mph wind speeds were used because the substantial reduction in the number of observations introduces significant measurement error above that level. Coupling the damage and loss models in this way ensures more realistic outcomes (e.g., a building with no damage cannot have total loss when the two models are coupled), and the parameterized models allow for more efficient storage and computations within the workflow.
The HAZUS damage and loss functions are grouped into five main classes by building material, with additional subclasses by building type. For each building class, e.g., wood single-family homes 1–2 + stories, a collection of attributes are used to define key features of the load path and components (e.g., roof shape, secondary water resistance, roof deck attachment, roof-wall connection, shutters, garage) as well as the exposure (terrain roughness previously estimated in the Wind Hazard Model) to assign the corresponding fragility. A rules engine was developed using a combination of historical New Jersey model building codes, surveys capturing owner-driven mitigation actions (e.g., Javeline and Kijewski-Correa, 2019), and market data to assign these attributes to each parcel based on age and other available building information (e.g., MOD IV data). Libraries of damage and loss functions associated with storm surge from the USACE and other recent studies in the literature are planned for future releases of PELICUN. Eventually, these damage and loss descriptions will be supplemented with more advanced models as the testbed is progressively refined to include component-based fragilities and fault-trees that capture cascading damage sequences resulting from breaches of the building envelope.
The first implementation of the hurricane testbed adopted the augmented parcels approach to assemble required building information and the analytical hurricane wind field described previously. Shown in Figure 8 are the results of the initial analyses of wind damage to wood-frame residential houses, determined based on the assumptions and techniques described above. The categories of damage states and loss ratios, shown in Figure 8, follow from the HAZUS fragility functions and the rule-based engine developed to associate the appropriate function with each building. The ability to resolve damage and losses to specific properties provides a level of granularity that is not currently available to planning authorities. These capabilities to execute high-resolution damage scenarios are valuable to guide hurricane mitigation investments in Atlantic City, which is undergoing redevelopment in the aftermath of Hurricane Sandy to make the city more resilient to future storms and hurricanes.
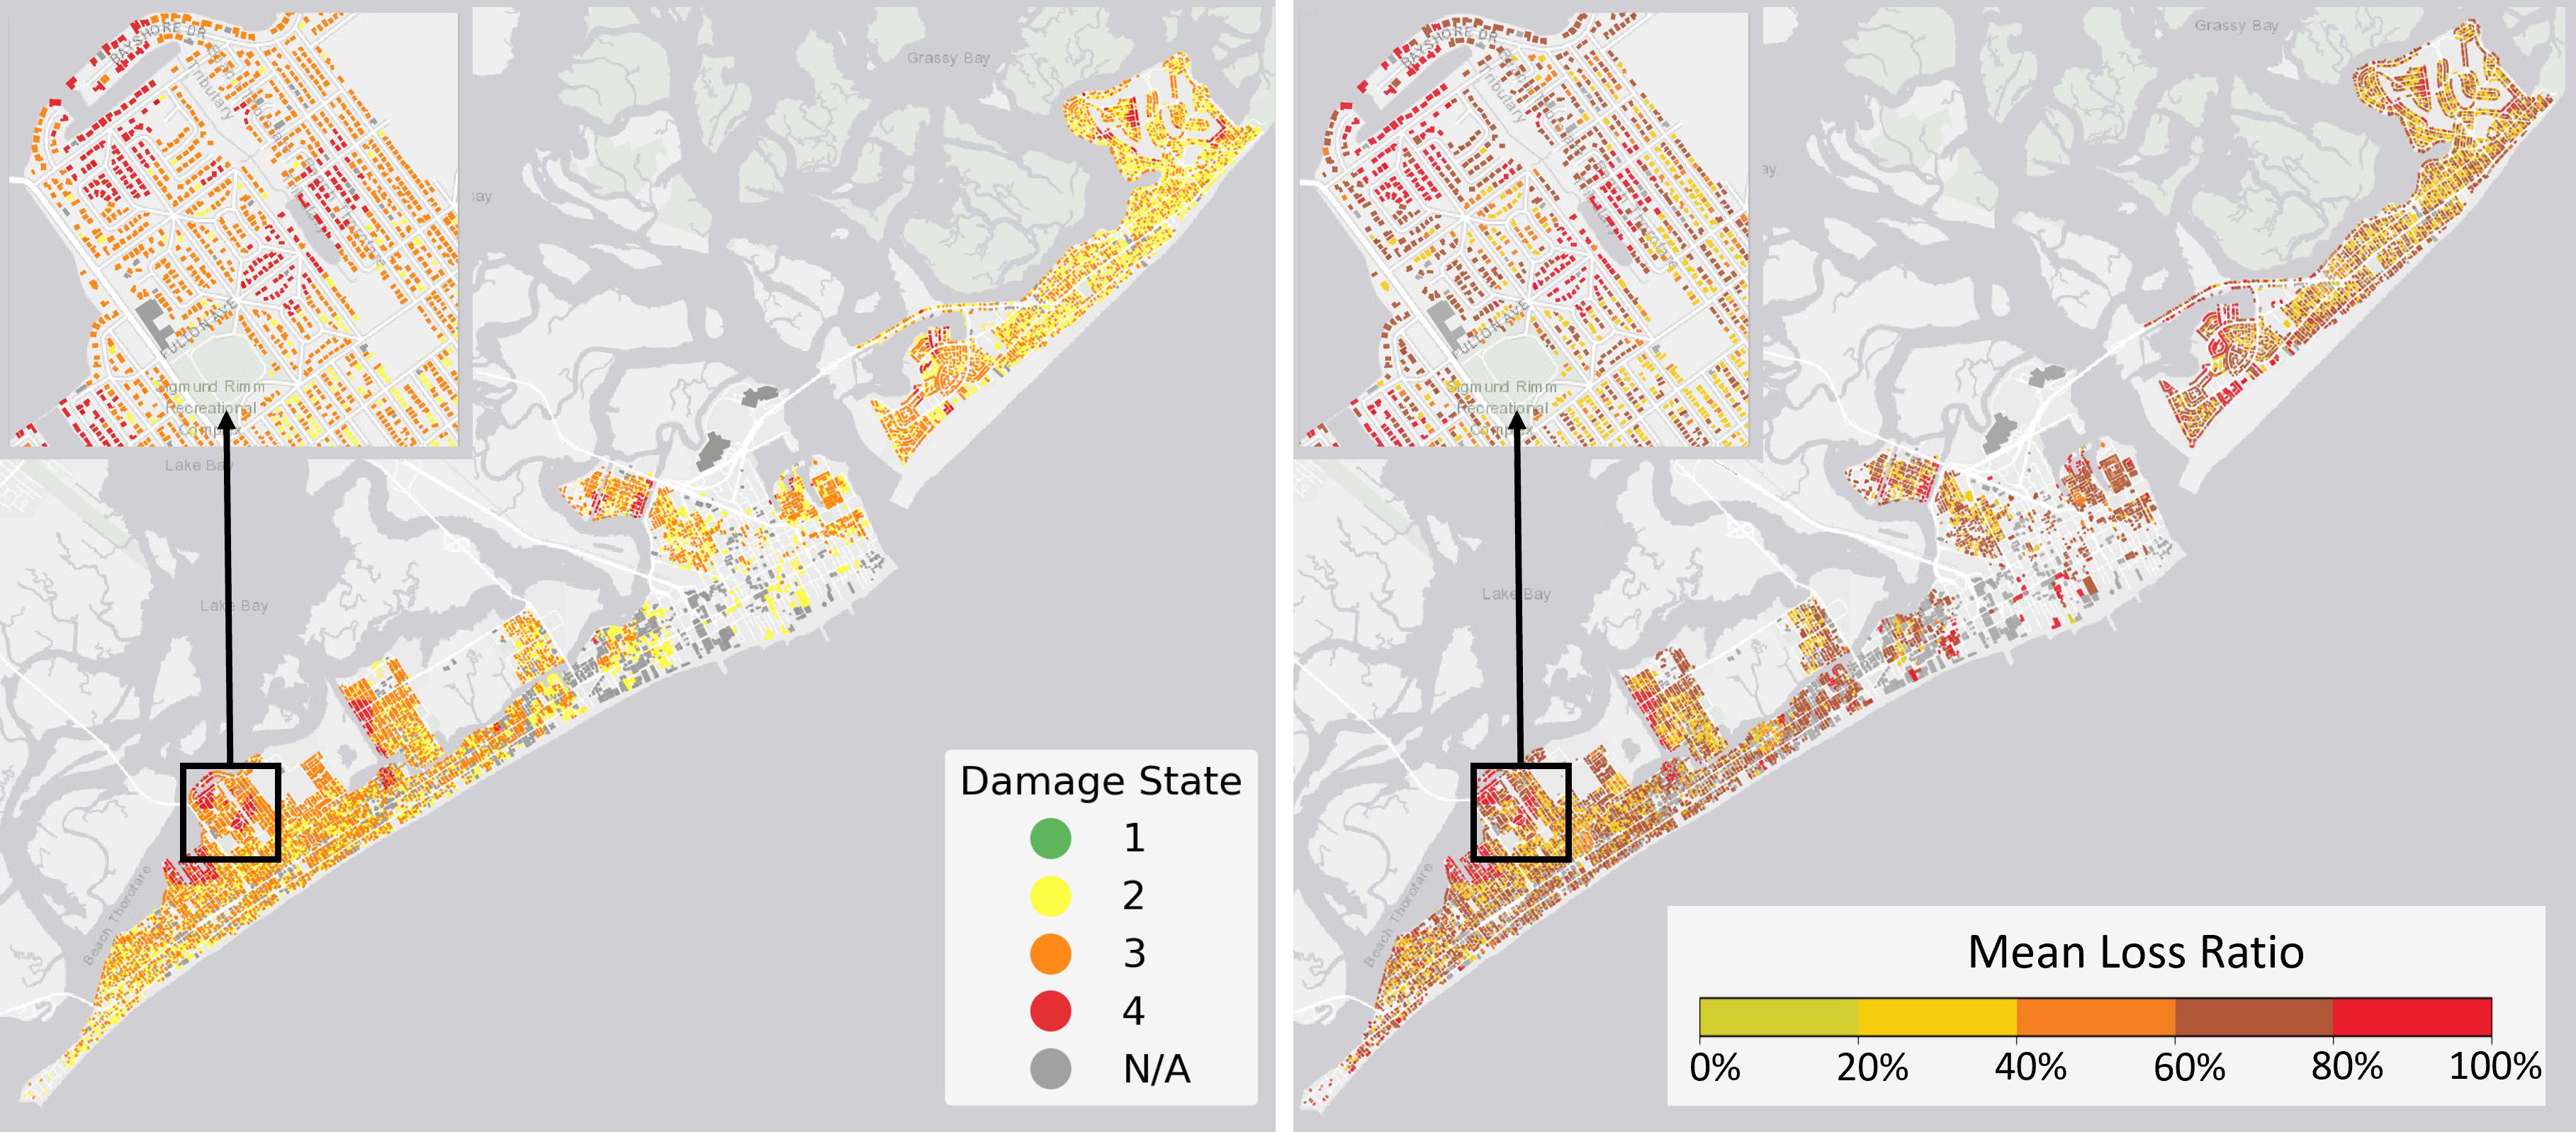
Figure 8. Atlantic City testbed for category 5 hurricane wind scenario: damage states (left) and mean loss ratio (right).
As described in this paper, the computational open source workflow tools and applications that have been released and continue to be developed by the SimCenter are organized around a framework to facilitate the integration and sharing of models and data for comprehensive analyses of natural hazards and their effects on the built environment. The development and testbed applications of these workflows have identified how open data and high-fidelity simulation capabilities can shift the paradigm from empirical fragilities projecting losses over census blocks to direct simulation of site-specific building performance for natural hazard scenarios. These applications have also identified gaps and limitations of available data and models and how the contributions of the research community can be leveraged to advance regional simulation of damage, consequences, and recovery of buildings and lifeline systems. The SimCenter looks forward to continued collaboration with the NHERI research community to develop and expand computational workflows for integrating data and simulation models across the multidisciplinary fields of natural hazards engineering.
Publicly available datasets were analyzed in this study. This data can be found here: https://simcenter.designsafe-ci.org.
Specific contributions beyond general planning, review and editing include: GD: outline, drafted main body, earthquake modeling, overall detailed editing. FM and WE: cloud computing framework. AZ and WE: earthquake testbed. TK-C: hurricane testbed. AK: hurricane modeling. All authors contributed to preparation of the manuscript.
The authors declare that the research was conducted in the absence of any commercial or financial relationships that could be construed as a potential conflict of interest.
The SimCenter was financially supported by the National Science Foundation under Grant CMMI-1612843. Any opinions, findings, and conclusions or recommendations expressed in this material are those of the authors and do not necessarily reflect the views of the National Science Foundation. We would like to acknowledge (1) the contributions and collaboration with many faculty, post-doctoral researchers, students and staff who have contributed to the SimCenter’s work, and (2) the support and close collaboration with DesignSafe, which facilitates access to high-performance computing and information technologies for SimCenter tools.
Adams, B. M., Bohnhoff, W. J., Dalbey, K. R., Ebeida, M. S., Eddy, J. P., Eldred, M. S., et al. (2019). Dakota, A Multilevel Parallel Object-Oriented Framework for Design Optimization, Parameter Estimation, Uncertainty Quantification, and Sensitivity Analysis: Version 6.11 User’s Manual. Sandia Technical Report SAND2014- 4633. doi: 10.2172/1177048
ASCE (2016). Minimum Design Loads for Buildings and Other Structures, ASCE 7-16. Virginia, VA: American Society of Civil Engineers.
ASCE (2017). Seismic Evaluation and Retrofit of Existing Buildings, ASCE 41-17. Virginia, VA: American Society of Civil Engineers.
Attary, N., Unnikrishnan, V. U., van de Lindt, J. W., Cox, D. T., and Barbosa, A. R. (2017). Performance-Based Tsunami Engineering methodology for risk assessment of structures. Engine. Struct. 141, 676–686. doi: 10.1016/j.engstruct.2017.03.071
Barbato, M., Petrini, F., Unnikrishnan, V. U., and Ciampoli, M. (2013). Performance-Based Hurricane Engineering (PBHE) Framework. Struct. Safety 45, 24–35. doi: 10.1016/j.strusafe.2013.07.002
Bernardini, E., Spence, S. M. J., Kwon, D. K., and Kareem, A. (2015). Performance-Based Design of High-Rise Buildings for Occupant Comfort. J. Struc. Engr. ASCE 141, 4014244–4014241. doi: 10.1061/(ASCE)ST.1943-541X.0001223
Bruneau, M., Chang, S. E., Eguchi, R. T., Lee, G. C., O’Rourke, T. D., Reinhorn, A. M., et al. (2003). A Framework to Quantitatively Assess and Enhance the Seismic Resilience of Communities. Earthquake Spectra 19, 733–752. doi: 10.1193/1.1623497
Davis, C. A., and Shamma, J. (2019). Improving Resilience of Southern California Water Supply Aqueduct Systems to Regional Earthquake Threats. Bridge 49, 60–67.
Davis, C., Wang, W., Chen, S. S., Chen, Y., Corbosiero, K., DeMaria, M., et al. (2008). Prediction of Landfalling Hurricanes with the Advanced Hurricane WRF Model. Monthly Weather Rev. 136, 1990–2005. doi: 10.1175/2007mwr2085.1
Deelman, E., Vahi, K., Juve, G., Rynge, M., Callaghan, S., Maechling, P. J., et al. (2015). Pegasus: a Workflow Management System for Science Automation. Fut. Gener. Com. Syst. 46, 17–35. doi: 10.1016/j.future.2014.10.008
Demirbilek, Z., Nwogu, O. G., Ward, D. L., and Sanchez, A. (2009). Wave transformation over reefs: evaluation of one dimensional numerical models.” Report ERDC/CHL TR-09-1. Washington, DC: US Army Corps of Engineers.
DHS (2010). Proceedings of the Tsunami Research Colloquium. North Carolina, NC: University of North Carolina Chapel Hill.
Dooley, R., Brandt, S. R., and Fonner, J. (2018). “The Agave Platform: An Open, Science-as-a-Service Platform for Digital Science,” in Proceedings of the Practice and Experience on Advanced Research Computing, (New York, NY: ACM). doi: 10.1145/3219104.3219129
Elhaddad, W., McKenna, F., Rynge, M., Lowe, J. B., Wang, C., and Zsarnoczay, A. (2019). NHERI-SimCenter/WorkflowRegionalEarthquake: rWHALE (Version v1.1.0). http://doi.org/10.5281/zenodo.2554610
FEMA (1997). NEHRP guidelines for the seismic rehabilitation of buildings, FEMA 273. Washington, DC: Federal Emergency Management Agency.
FEMA (2018a). HAZUS – Multi-hazard Loss Estimation Methodology 2.1, Earthquake Model Technical Manual. Washington, DC: Federal Emergency Management Agency.
FEMA (2018b). Seismic Performance Assessment of Buildings, 2nd-Edition Edn. Washington, DC: Federal Emergency Management Agency.
Fenves, G. L., Poland, C. D., Crewe, A. J., Eguchi, R. T., Hajjar, J. F., Lynch, J. P., et al. (2011). Grand Challenges in Earthquake Engineering, National Research Council. Washington, D.C: National Academies Press, 90.
Frankel, A., Wirth, E., Marafi, N., Vidale, J., and Stephenson, W. (2018). Broadband synthetic seismograms for magnitude 9 earthquakes on the Cascadia megathrust based on 3D simulations and stochastic synthetics (part 1): Methodology and overall results. Bull. Seismol. Soc. Am. 108, 2347–2369. doi: 10.1785/0120180034
Goecks, J., Nekrutenko, A., and Taylor, J. (2010). Galaxy: a comprehensive approach for supporting accessible, reproducible, and transparent computational research in the life sciences. Genome Biol. 11:R86. doi: 10.1186/gb-2010-11-8-r86
Graves, R., Jordan, T. H., Callaghan, S., et al. (2011). CyberShake: A Physics-Based Seismic Hazard Model for Southern California. Pure Appl. Geophys. 168, 367–381. doi: 10.1007/s00024-010-0161-6
Hamid, S., Golam Kibria, B. M., Gulati, S., Powell, M., Annane, B., Cocke, S., et al. (2010). Statistical Methodology. Int. Ind. Statist. Assoc. 7, 552–573. doi: 10.1016/j.stamet.2010.02.004
Hettne, K., Wolstencroft, K., Belhajjame, K., Goble, C., Mina, E., and Dharuri, H. (2012). Best Practices for Workflow Design: How to Prevent Workflow Decay, Rome: SWAT4LS.
Hudnut, K. W., Wein, A. M., Cox, D. A., Porter, K. A., Johnson, L. A., Perry, S. C., et al. (2018). The HayWired earthquake scenario – We can outsmart disaster, USGS, Fact Sheet 2018-3016. Virginia, VA: USGS, doi: 10.3133/fs20183016
Javeline, D., and Kijewski-Correa, T. (2019). Coastal Homeowners in a Changing Climate. Clim. Change 152, 259–276. doi: 10.1007/s10584-018-2257-4
Jia, G., and Taflanidis, A. A. (2013). Kriging metamodeling for approximation of high-dimensional wave and surge responses in real-time storm/hurricane risk assessment. Com. Methods Appl. Mechanics Engin. 26, 24–38. doi: 10.1016/j.cma.2013.03.012
Jia, G., Taflanidis, A. A., Nadal-Caraballo, N. C., Melby, J., Kennedy, A., and Smith, J. (2015). Surrogate modeling for peak and time dependent storm surge prediction over an extended coastal region using an existing database of synthetic storms. Nat. Hazards 81, 909–938. doi: 10.1007/s11069-015-2111-1
Johnson (2019). “Recovery Planning with U.S. Cities,” in The Routledge Handbook of Urban Disaster Resilience: Integrating Mitigation, Preparedness, and Recovery Planning, ed. L. Michael Peacock (London: Routledge). doi: 10.4324/9781315714462-23
Kareem, A., and Kwon, D. K. (2017). A Cyber-Based Data-Enabled Virtual Organization for Wind Load Effects on Civil Infrastructures: VORTEX-Winds. Front. Built Environ. 3:1–32. doi: 10.3389/fbuil.2017.00048
Kennedy, A. B., Westerink, J. J., Smith, J., Taflanidis, A. A., Hope, M., and Hartman, M. (2012). Tropical cyclone inundation potential on the Hawaiian islands of Oahu and Kauai. Ocean Modelling. 5, 54–68. doi: 10.1016/j.ocemod.2012.04.009
Kepert, J. D. (2011). Choosing a Boundary Layer Parameterization for Tropical Cyclone Modeling. Monthly Weather Rev. 140, 1427–1445. doi: 10.1175/MWR-D-11-00217.1
Kijewski-Correa, T. L., Taflanidis, A. A., Vardeman, C. II, Kennedy, A. B., and Wu, T. (2019). “Collaborative Geospatial Environments for Rapid Risk Assessment in Support of Situational Awareness and Resiliency Planning,” in ICONHIC 2019 2nd International Conference on Natural Hazards & Infrastructure, (Chania: ICONHIC), 23–26.
Kircher, C. A., Whitman, R. V., and Holmes, W. T. (2006). HAZUS Earthquake Loss Estimation Methods. Nat. Hazards Rev. 7, 45–59. doi: 10.1061/(asce)1527-6988(2006)7:2(45)
Krawinkler, H., and Miranda, E. (2004). “Performance-based earthquake engineering,” in Earthquake Engineering: From Engineering Seismology to Performance-Based Engineering, eds Y. Bozorgnia and V. V. Bertero (BocaRaton: CRC Press). doi: 10.1201/9780203486245.ch9
Lange, D., Devaney, S., and Usmani, A. (2014). An application of the PEER performance based earthquake engineering framework to structures in fire. Engine. Struct. 66, 100–115. doi: 10.1016/j.engstruct.2014.01.052
Lu, X., Han, B., Hori, M., Xiong, C., and Xu, Z. (2014). A coarse-grained parallel approach for seismic damage simulations of urban areas based on refined models and GPU/CPU cooperative computing. Adv. Engine. Soft. 70, 90–103. doi: 10.1016/j.advengsoft.2014.01.010
Luettich, R. A., Westerink, J. J., and Scheffner, N. W. (1992). ADCIRC: An advanced three-dimensional circulation model for shelves, coasts, and estuaries. Report 1. Theory and methodology of ADCIRC-2DDI and ADCIRC-3DL, Dredging Research Program Technical Report DRP-92-6. Vicksburg, MS: U.S Army Engineers Waterways Experiment Station.
Mackenzie-Helnwein, P., Wan, J., and McKenna, F. (2019). NHERI-SimCenter/TurbulenceInflowTool: Versions 1.0.2. Switzerland: Zenodo. http://doi.org/10.5281/zenodo.3516436
Mandli, K. T., Ahmadia, A. J., Berger, M., Calhoun, D., George, D. L., Hadjimichael, Y., et al. (2016). Clawpack: building an open source ecosystem for solving hyperbolic PDEs. J. Comp. Sci. 2:68. doi: 10.7717/peerj-cs.68
McKenna, F. M. (2020). SimCenter Software Architecture, NHERI SimCenter Report No. 2020-X. Berkeley: University of California.
Microsoft (2020). Microsoft Building Footprint Database for the United States. Washington, DChttps://www.microsoft.com/en-us/maps/building-footprints: Microsoft.
Moehle, J. P., and Deierlein, G. G. (2004). “A Framework Methodology for Performance-Based Earthquake Engineering,” in 13th World Conference on Earthquake Engineering, (Vancouver: WCEE).
Nadal−Caraballo, N. C., Melby, J. A., Gonzalez, V. M., and Cox, A. T. (2015). North Atlantic Coast Comprehensive Study – Coastal Storm Hazards from Virginia to Maine, ERDC/CHL TR-15-5. Vicksburg, MS: U.S. Army Engineer Research and Development Center.
NERSC (2020). Cori Cray XC 40 Computer. Berkeley: National Energy Research Scientific Computing Center. (https://docs.nersc.gov/systems/cori/).
NHERI (2020). Natural Hazards Engineering Research Infrastructure – Five-Year Science Plan, Multi-Hazard Research to Make a More Resilient World. Berkeley: NHERI. https://www.designsafe-ci.org/facilities/nco/science-plan/
NIST (2014). Measurement Science R&D Roadmap for Windstorm and Coastal Inundation Impact Reduction, NIST GCR 14-973-13. Gaithersburg, MD: National Institute of Standards and Technology, 130.
NIST (2016a). Community Resilience Planning Guide for Buildings and Infrastructure Systems, Volume I, NIST Special Publication 1190. Gaithersburg: National Institute of Standards and Technology.
NIST (2016b). Community Resilience Planning Guide for Buildings and Infrastructure Systems, Volume II, NIST Special Publication 1190. Gaithersburg: National Institute of Standards and Technology.
NIST (2016c). Critical Assessment of Lifeline System Performance: Understanding Societal Needs in Disaster Recovery, NIST GCR 16-917-39. Gaithersburg: National Institute of Standards and Technology.
NIST (2017). Strategic Plan for the National Windstorm Impact Reduction Program, Prepared by Interagency Coordinating Committee of the National Windstorm Impact Reduction Program. Gaithersburg: National Institute of Standards and Technology https://www.nist.gov/system/files/documents/2018/09/24/nwirp_strategic_plan.pdf.
Nist-COE. (2020). Center for Risk-Based Community Resilience Planning, A NIST-funded Center of Excellence. Colorado: Colorado State University. http://resilience.colostate.edu/
NJ Coast (2020). Storm Hazard Projection Tool. New Jersey: NJ Coast. https://njcoast.us/resources-shp/.
Oinn, T., Addis, M., Ferris, J., Marvin, D., Senger, M., Greenwood, R., et al. (2003). Taverna: a tool for the composition and enactment of bioinformatics workflow. Bioinformatics 20, 3045–3054. doi: 10.1093/bioinformatics/bth361
Ouyang, Z., and Spence, S. M. J. (2020). A Performance-Based Wind Engineering Framework for Envelope Systems of Engineered Buildings Subject to Directional Wind and Rain Hazards. J. Struc. Engrg. ASCE 146:04020049. doi: 10.1061/(asce)st.1943-541x.0002568
Petersson, N. A., and Sjogreen, B. (2017). SW4, version 2.0 [software], Computational Infrastructure of Geodynamics. Switzerland: Zenodo. doi: 10.5281/zenodo.1045297
Porter, K. A. (2003). “An overview of PEER’s performance-based earthquake engineering methodology,” in Proceedings of ninth international conference on applications of statistics and probability in civil engineering (ICASP9), (San Francisco: ICASP9), 8.
REDI (2013). REDiTM Rating System, Resilience-based Earthquake Design Initiative for the Next Generation of Buildings. San Francisco: REDI.
Resio, D. T., and Westerink, J. J. (2008). Modeling of the physics of storm surges. Phys. Today 61, 33–38. doi: 10.1063/1.2982120
Rodgers, A. J., Petersson, N. A., Pitarka, A., McCallen, D. B., Sjogreen, B., and Abrahamson, N. (2019). Broadband (0-5 Hz) Fully Deterministic 3D Ground-Motion Simulations of a Magnitude 7.0 Hayward Fault Earthquake: Comparison with Empirical Ground-Motion Models and 3D Path and Site Effects from Source Normalized Intensities. Seismol. Res. Lett. 90:17.
Schneider, P. J., and Schauer, B. A. (2006). HAZUS – Its Development and Its Future. Nat. Hazards Rev. ASCE 7, 40–44. doi: 10.1061/(asce)1527-6988(2006)7:2(40)
SimCenter (2020). NHERI Computational Modeling and Simulation Center. Available online at: https://simcenter.designsafe-ci.org/
Smith, J. M., Sherlock, A. R., and Resio, D. T. (2001). STWAVE: Steady-state spectral wave model user’s manual for STWAVE, Version 3.0,” Defense Technical Information Center. Vicksburg, MS: US Army Corps of Engineering. doi: 10.21236/ADA392582
Snaiki, R., and Wu, T. (2017a). A linear height-resolving wind field model for tropical cyclone boundary layer. J. Wind Engine. Industr. Aerodyn. 171, 248–260. doi: 10.1016/j.jweia.2017.10.008
Snaiki, R., and Wu, T. (2017b). Modeling tropical cyclone boundary layer: Height-resolving pressure and wind fields. J. Wind Engine. Industr. Aerodyn. 170, 18–27. doi: 10.1016/j.jweia.2017.08.005
Snaiki, R., and Wu, T. (2018). A Semi-empirical model for mean wind velocity profile of land falling hurricane boundary layers. J. Wind Engine. Industr. Aerodyn. 179, 273–286. doi: 10.1016/j.jweia.2018.08.004
TPU (2020). Aerodynamic Database, Tokyo Polytechnic University. Tokyo: Tokyo Polytechnic University.
USGS (2018). 3-D geologic and seismic velocity models of the San Francisco Bay region. Virginia, VA: USGS. https://earthquake.usgs.gov/data/3dgeologic.
Vickery, P. J., Skerlj, P. F., and Twisdale, L. A. (2000b). Simulation of hurricane risk in the US using empirical track model. J. Struct. Engine. ASCE 126, 1222–1237. doi: 10.1061/(asce)0733-9445(2000)126:10(1222)
Vickery, P. J., Wadhera, D., Powell, M. D., and Chen, Y. (2009). A Hurricane Boundary Layer and Wind Field Model for Use in Engineering Applications. J. Appl. Meteorol. Climatol. 48, 381–405. doi: 10.1175/2008jamc1841.1
Vickery, P., Lin, J., Skerlj, P., Twisdale, L., and Huang, K. (2006). HAZUS-MH Hurricane Model Methodology. I: Hurricane Hazard, Terrain, and Wind Load Modeling. Nat. Hazards Rev. 7, 82–93. doi: 10.1061/(asce)1527-6988(2006)7:2(82)
Vickery, P., Skerlj, P., Steckley, A., and Twisdale, L. (2000a). Hurricane Wind Field Model for Use in Hurricane Simulations. J. Struct. Engine. 126, 1203–1221. doi: 10.1061/(asce)0733-9445(2000)126:10(1203)
Waddell, P. (2002). UrbanSim: Modeling Urban Development for Land Use, Transportation, and Environmental Planning. J. Am. Planning Assoc. 68, 297–314. doi: 10.1080/01944360208976274
Wang, C., Yu, Q., McKenna, F., Cetiner, B., Yu, S. S., Taciroglu, E., et al. (2019). NHERI-SimCenter/BRAILS: v1.0.1 (Version v1.0.1). Switzerland: Zenodo. http://doi.org/10.5281/zenodo.3483208
Wilson, L. A., Fonner, J. M., Esteban, O., Allison, J. R., Lerner, M., and Kenya, H. (2017). Launcher: A simple tool for executing high throughput computing workloads. J. Open Source Soft. 2:289. doi: 10.21105/joss.00289
Zsarnóczay, A. (2019). NHERI-SimCenter/pelicun: pelicun v2.0.0 (Version v2.0.0). Switzerland: Zenodo. http://doi.org/10.5281/zenodo.3491100
Zsarnóczay, A., and Deierlein, G. G. (2020). “PELICUN – A Computational Framework for Estimating Damage, Loss and Community Resilience,” in Proceedings, 17th World Conference on Earthquake Engineering, (Sendai: WCEE).
Zsarnóczay, A., McKenna, F., Wang, C., Elhaddad, W., and Gardner, M. (2019). NHERI-SimCenter/PBE: Release v2.0.0 (Version v2.0.0). Switzerland: Zenodo. http://doi.org/10.5281/zenodo.3491145
Keywords: natural hazard, earthquake, hurricane, workflow, disaster, loss assessment, simulation, cloud-based
Citation: Deierlein GG, McKenna F, Zsarnóczay A, Kijewski-Correa T, Kareem A, Elhaddad W, Lowes L, Schoettler MJ and Govindjee S (2020) A Cloud-Enabled Application Framework for Simulating Regional-Scale Impacts of Natural Hazards on the Built Environment. Front. Built Environ. 6:558706. doi: 10.3389/fbuil.2020.558706
Received: 03 May 2020; Accepted: 23 October 2020;
Published: 25 November 2020.
Edited by:
Franklin Lombardo, University of Illinois at Urbana-Champaign, United StatesReviewed by:
Mohammad Aghababaei, Texas A&M University, United StatesCopyright © 2020 Deierlein, McKenna, Zsarnóczay, Kijewski-Correa, Kareem, Elhaddad, Lowes, Schoettler and Govindjee. This is an open-access article distributed under the terms of the Creative Commons Attribution License (CC BY). The use, distribution or reproduction in other forums is permitted, provided the original author(s) and the copyright owner(s) are credited and that the original publication in this journal is cited, in accordance with accepted academic practice. No use, distribution or reproduction is permitted which does not comply with these terms.
*Correspondence: Gregory G. Deierlein, Z2dkQHN0YW5mb3JkLmVkdQ==
Disclaimer: All claims expressed in this article are solely those of the authors and do not necessarily represent those of their affiliated organizations, or those of the publisher, the editors and the reviewers. Any product that may be evaluated in this article or claim that may be made by its manufacturer is not guaranteed or endorsed by the publisher.
Research integrity at Frontiers
Learn more about the work of our research integrity team to safeguard the quality of each article we publish.