 Mohammad A. Alhassan
 Khairedin M. Abdalla
 Mohammad E. AL-Shatnawi
94% of researchers rate our articles as excellent or good
Learn more about the work of our research integrity team to safeguard the quality of each article we publish.
Find out more
ORIGINAL RESEARCH article
Front. Built Environ., 30 September 2020
Sec. Computational Methods in Structural Engineering
Volume 6 - 2020 | https://doi.org/10.3389/fbuil.2020.00144
This article is part of the Research TopicOPTARCH2019 – Optimization Driven Architectural DesignView all 4 articles
Shear lagging, resulting from non-uniformity of stress distribution around the connection, is one of the most important design considerations in steel construction since it reduces the load capacity of tension members. In this paper, the rationality of the AISC provisions for calculating the shear lag factor (U) for W and WT-sections was assessed. In the current AISC provisions, there is an enormous difference in the calculated value of U using two allowed for W and WT sections; yet the AISC allows using the largest value for U. Accordingly, this study was conducted to investigate the reasonable value of U in W and WT-sections based on finite element analysis (FEA). Two criteria were used to calculate this lagging for 50 sizes of W sections and 50 sizes of WT sections. For each section size, three models with different connection lengths were created, which results in 150 models for W sections and 150 models for WT-sections. For each section type, the influence of the bolt diameter, the connection eccentricity, flange width, depth, flange area, and gross-sectional area were evaluated individually through a parametric study. It was shown that the calculated values for U based on the two cases allowed by the AISC provisions were comparable for shallow W and WT sections, but differ enormously for larger sections. Accordingly, a new equation was developed for a more reasonable calculation of U for any W and WT standard size.
Tension members experience stress concentration at the edges if the member cross-sectional components are not totally connected since portion of the cross-section is effective in transferring the load. Thus, the shear lag impact might be characterized as the non-linear stress distribution (non-uniform or inelastic) resulting in a decreased resistance in tension members. Moreover, in the connections with eccentricity, the application of axial load does not concur with the centroidal axis of the member, leading to secondary out of plane bending. An understrength fracture occurs and the total capacity of the member is significantly reduced as a result of these combined effects of connection eccentricity, shear lag, and stress concentration. In bolted connections, elements of the member directly connected to transverse rivets receive and transfer loads through the bolts. During this process, some load is resisted by direct tension of the element receiving it, while the rest of the load is moved to adjacent elements through shear. This process will continue until the total applied load is in equilibrium. Elements receiving force by shear transfer lag behind the elements receiving it directly via rivets. This lagging creates an unequal distribution of stresses around the member connected side, which is called the shear lag effect; i.e., the stress in the elements away from the bolts lag the stresses in the element near bolts. Thus, as the loading increases, the region near the bolts with higher stresses enters into the plastic zone and starts rupturing before the gross-section of the member reaches its ultimate capacity. The most widely used equation that considers the shear lag effect was proposed by Chesson and Munse (1963), which was adopted by ANSI/AISC 360-16 (American Institute of Steel Construction [AISC], 2010) and CAN/CSA-S16-14 (Canadian Standards Association [CSA], 2014). Based on 218 tests of riveted and bolted end connection angles, the out-of-plane eccentricity and connection length L were considered to affect the shear lagging most significantly and were selected for the development of Eq. 1 for calculating U:
Where U is the net section efficiency factor or the shear lag factor, is the out-of-plane eccentricity, and L is the connection length. Out-of-plane eccentricity is the perpendicular distance from the face of the connected part to the centroid point of the section, and connection length is the distance between the two outmost bolts. This equation was then validated using more than 1,000 test data. Good accuracy with deviation under 10% was achieved.
Several studies previously investigated the shear lag factor effect on various steel members, especially angles and channels. Kulak and Wu (1997) investigated various variables affecting shear lag on bolt-connected members. Nelson (1953) tested 18 single angle tension members with bolted connections to investigate the strain distribution and deformation of specimens at all stages up to failure. Kennedy and Sinclair (1969) tested 721 single-angle, single bolted connections to investigate the influence of the edge distance and the end distance on net section efficiency. March (1969) led a series of tests on single-angle members in tension and compression. The effect of plastic behavior was studied during ultimate loading of the sections. Yip and Cheng (2000) performed an experimental program consisting of 23 angle and channel specimens to study the shear lag effect. The connection length and cross-sectional geometry were the major studied parameters. Chung and Ip (2000) investigated the finite element modeling of bolted connections between cold-formed steel strips and hot-rolled steel plates under shear. Orbison et al. (2002) investigated the effect of in-plane eccentricity, which is often neglected in the current shear lag equations. Gupta and Gupta (2002) presented simple equations for predicting the load caring capacity of single and double angles in tension. Pan (2004) investigated the shear lag effect on bolted cold formed steel tension members. Fifty-four channel sections with different dimensions were tested using bolted connections. Paula et al. (2008) presented experimental results of 66 specimens carried out on cold-formed steel angles fastened with bolts under tension. Kulak and Grondin (2001) performed a statistical study on the evaluation of LRFD rules for block shear capacities in bolted connections with test results. It was stated that there were two equations to predict the block shear capacity but that the one including the shear ultimate strength in combination with the tensile yield strength seemed unlikely. Examination of the test results on gusset plates revealed that tensile ductility is insufficient to permit shear fracture to occur. Gupta and Gupta (2002) conducted finite element analysis to evaluate the stress distribution in the angle at design loads predicted by previously developed equations on the basis of experimental results. Epstein (1992) performed an experimental study on double-row, staggered, and unstaggered bolted connections of structural steel angles. Gaylord et al. (1992) presented a similar equation as Chesson and Munse (1963). The authors suggested that the effective net area of the tension member was a function of four factors: steel ductility, fabrication methods, connection efficiency, and shear lag effects. Kouhi and Kortesmaa (1990) conducted a series of tests on double-shear bolted connections. Steel with yield strength of 90 ksi (640 MPa) was used. The bolts were arranged in two configurations: two in one line and four in two lines. The bearing resistance and block shear resistance of the specimens were evaluated.
The reviewed literature indicates the importance of shear lagging as a major design consideration in steel construction since it reduces the load capacity of tension members. Accordingly, the main objective of this finite element analysis (FEA)-based study is to evaluate the rationality of the AISC 360-16 provisions for calculating the shear lag factor (U) and to propose a new equation for a more reasonable calculation of U for any W and WT standard size. The AISC 360-16 provisions listed in Specification D (Table D3.1 Shear Lag Factors for Connections to Tension Members) show an enormous difference in the calculated U using Case 2 and Case 7 for W and WT sections; especially for large sections; yet the AISC 360 allows using the largest value for U. Two criteria were used to calculate this lagging for 50 sizes of W sections and 50 sizes of WT sections. Three different bolt sizes were evaluated for each model with different connection lengths, resulting in a total of 150 models for W sections and 150 models for WT-sections. For each section type, the influence of the bolt diameter, connection eccentricity, flange width, depth, flange area, and gross-sectional area were evaluated.
Finite element (FE) models were created to investigate the U of W and WT sections for tension members. The commercial FE program ABAQUS version 6.13 (Hibbit et al., 2012) was employed, which uses the central difference method for the explicit time integration method in which instant equilibrium can be expressed when displacement is known. Explicit analysis has a few advantages over standard analysis as it uses less computer storage and computational time, which is more dynamic for solving discontinuous processes. Standard ASTM A992 structural steel was used for all of the investigated sections with a yield strength (Fy) of 50 ksi (345 MPa), ultimate fracture strength (Fu) of 65 ksi (450 MPa), Poisson’s ratio of 0.30, and elastic modulus of 30,000 ksi (200,000 MPa). The ABAQUS functions “damage initial” and “damage evolution” were employed to define the fracture criteria, which was initiated once the fracture strain is reached. The “damage evolution” indicated how the von Mises stress in the elements decreased to zero when fracture strain was reached, which was a linear reduction when the fracture element experience elongation of 0.0001 in. or higher. This means that once the fracture strain was reached, the stress in the elements declines immediately to zero. The curve turned to the descending branch as more elements in the critical section fracture. A linear solid element with reduced integration C3D8R was used to create the FE models and converging was ensured by refining the mesh size. The final mesh size was selected to be 0.125 in. (3 mm), which showed less than 2% variation in the results when using a lower mesh size of 0.0625 in. (1.5 mm) that required more than 1 h of running time per model compared with about 20 min for the selected mesh size.
The typical models of the bolted W and WT specimens are shown in Figures 1, 2, respectively. The leading edge of the gusset plate was restrained in all directions. For connections, the global contact interaction with normal behavior of “hard” contact and tangential behavior of “penalty” friction formulation was prescribed for all parts. The “Hard” contact means that no penetration was allowed on each contact surface. A value of 0.25 was adopted as the friction coefficient, which is the measured average nominal coefficient of various steels (Vasarhelyi and Chiang, 1967). The length of the bolt shank was selected as the sum of the thickness of the beam and the gusset plate, and the part of the bolt outside the nut was omitted. The bolt shank, the nut, and the washer were created as a unity, thereby indicating that the interaction among these parts was not considered. Preload was applied on each bolt at the first step of loading to ensure tight contact (snug-tight during testing). The quantity of the preload was set to 70% of the bolt tensile strength.
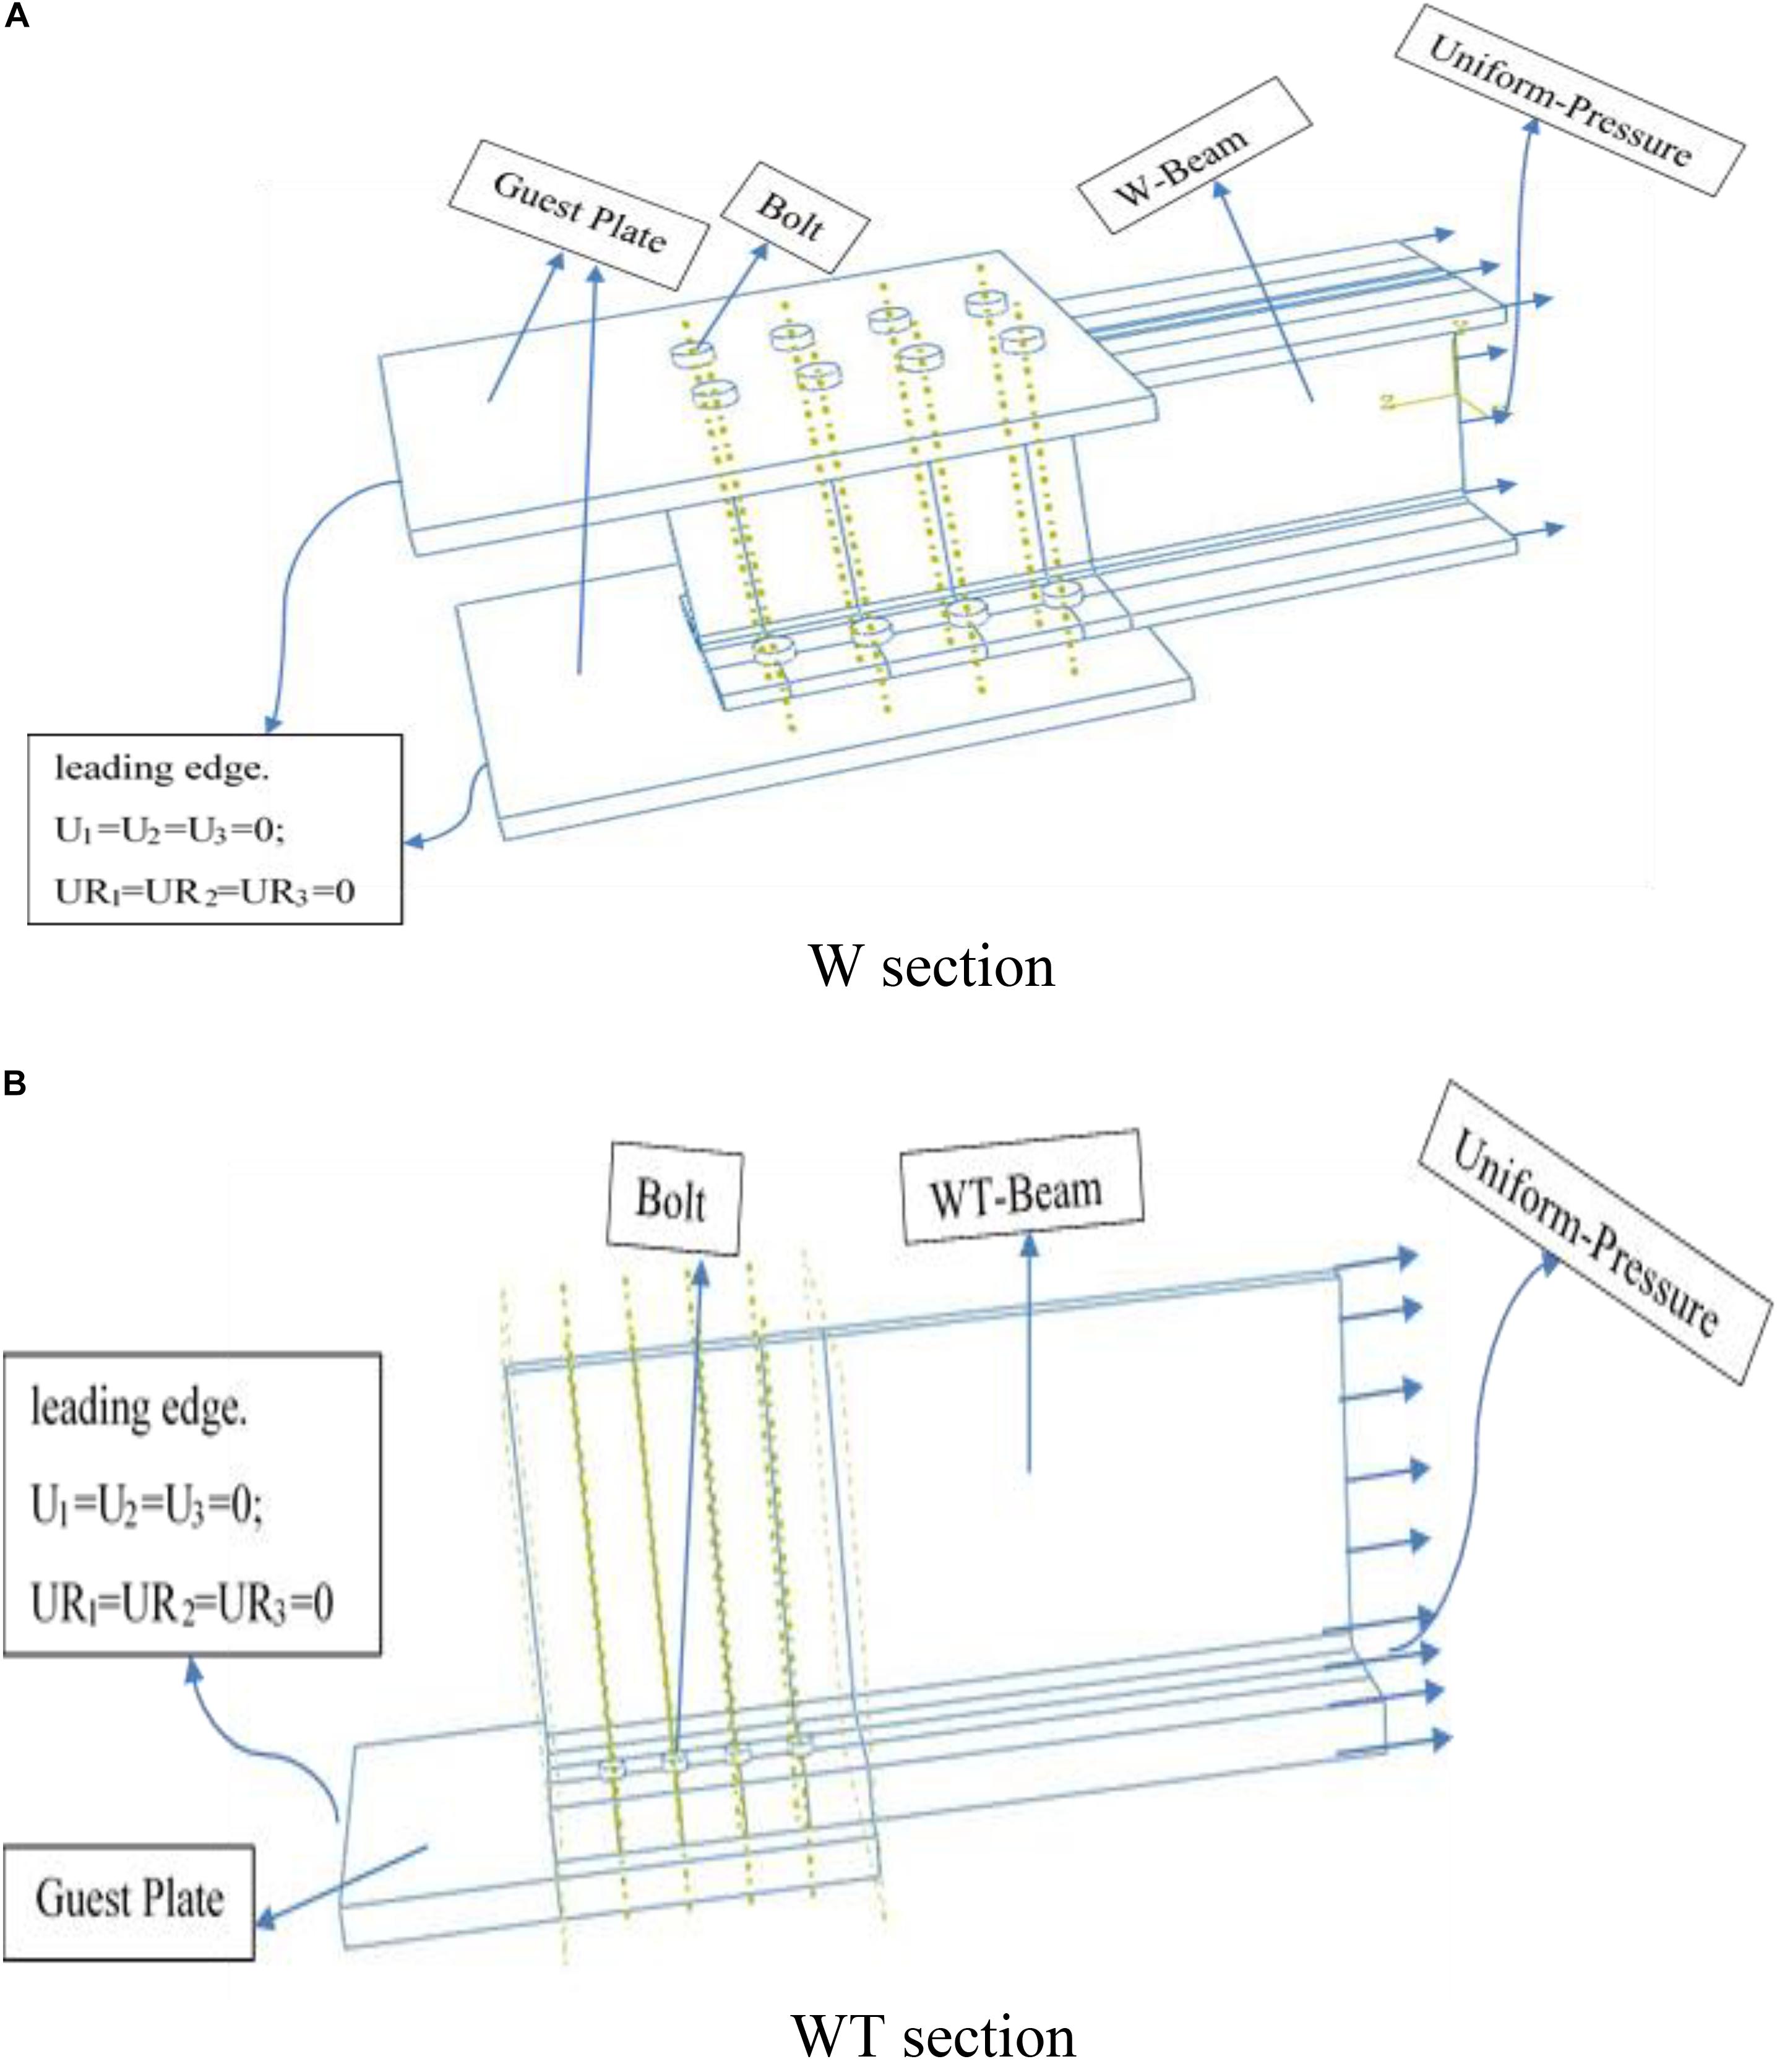
Figure 1. Typical FE model of bolted. (A) W section and (B) WT section.
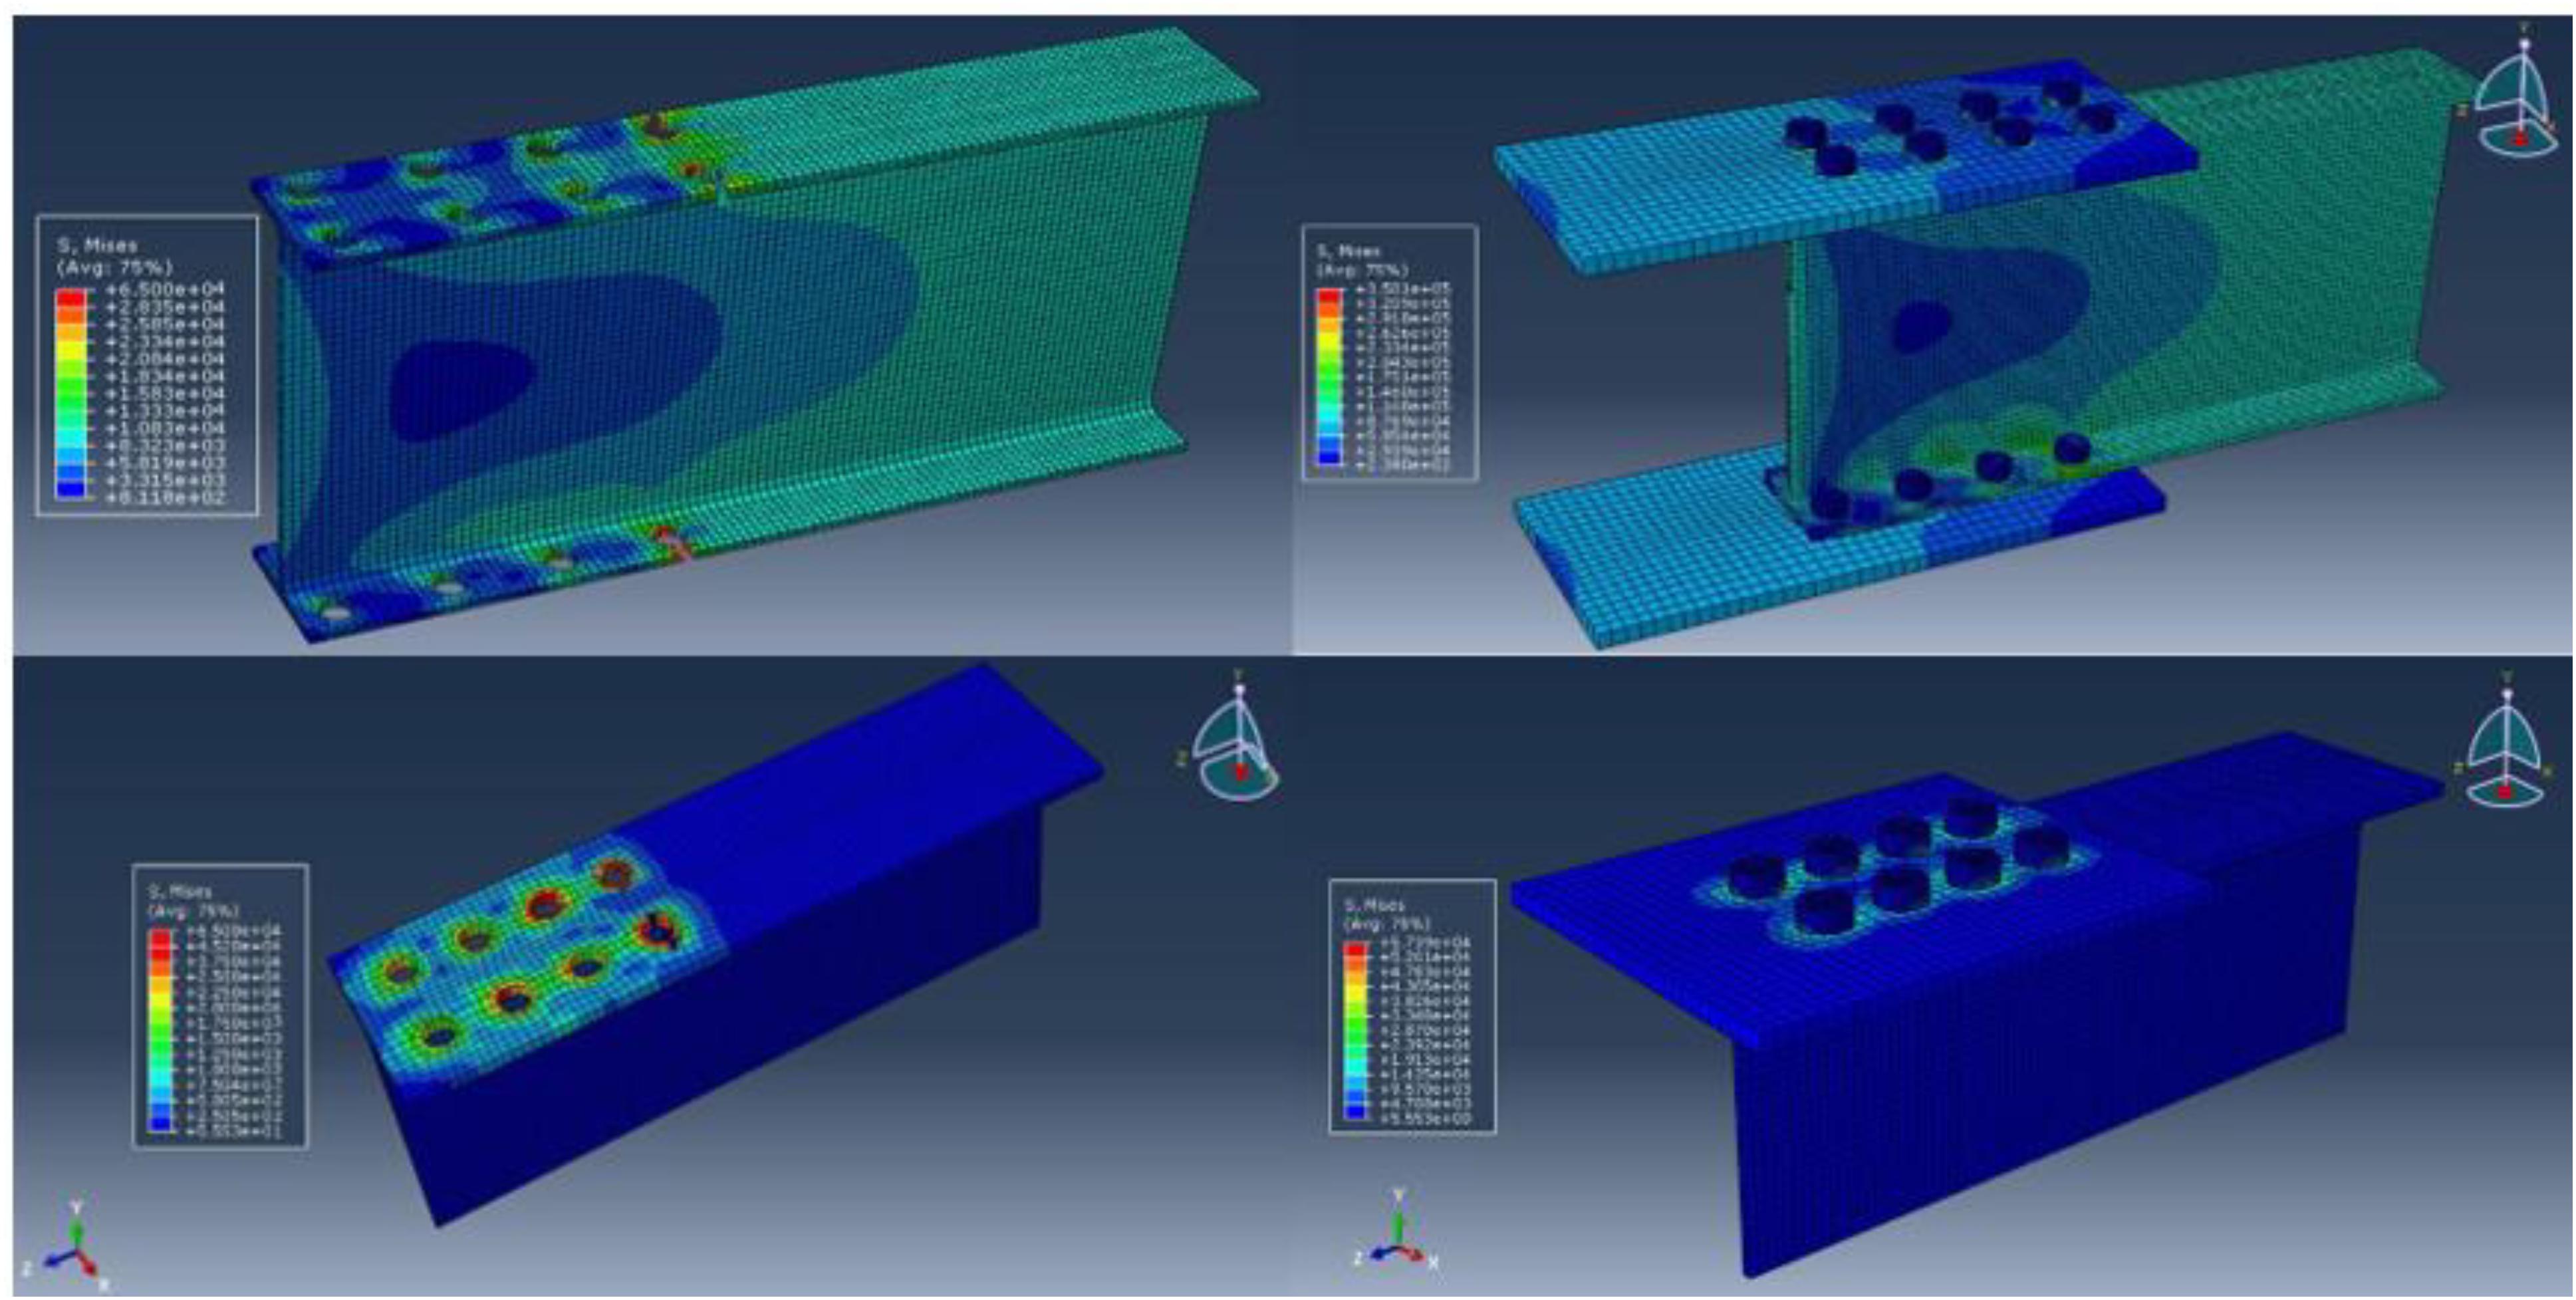
Figure 2. Sample meshing and stress contours generated from the FEA.
A clearance of 0.08 in. (2 mm) was present between each bolt shank and bolt hole. Prior to loading, the bolts were made to contact with the bolt holes to eliminate any slip. This approach was taken to prevent any undesired computational error that could occur when the bolt shank bore on the bolt hole. Slip between the bolt shank and the bolt hole was also eliminated through pre-loading. A longitudinal uniform pressure (tension) was applied at the end of the member. The magnitude of the maximum applied load adopted depends on the ultimate load that can be carried by the section without connection. The period of loading is fixed for all sections at one step loading, which is 1-min (60 s) long with linear increasing, starting with 0 kip at 0 s and increasing to the maximum at 60 s. Figure 2 shows sample meshing and stress contours generated from the FEA.
Two criteria were taken into consideration for computing the reduction in the ultimate tensile strength of a given cross section. The first criterion was by inspecting the ultimate tensile load carried by the section and calculating the area that was effective during the load transfer. Then, the amount of the reduction in the net area can be obtained and related to U. This process was done using Eqs 2 and 3. Where Pn is the nominal tensile load capacity, Φt is the strength reduction factor, and An is the net cross-sectional area. The obtained results for U using this criterion were denoted as Up. The second criterion depends on the stress values and contours in each element in the member generated from the FEA and comprised of computing the effectiveness ratio in each element by dividing the stress value in the element by the yield stress. Then, the weight averages for all elements were calculated and related to U. The obtained results for U using this criterion were denoted as UE.
Six specific models were analyzed to evaluate the influence of the diameter of the bolt for two W-sections (W16 × 45 and W12 × 22) with three different bolt diameter sizes (0.5, 0.75, 1 in.). The simulated two sections were selected based on the authors experience as initial representative sections with three standard bolt diameters. Figures 3, 4 show the FEA results for the W16 × 45 and W12 × 22 sections with different bolt sizes, respectively. Table 1 summarizes the FEA results of the two sections, which indicates that the influence of the bolt diameter is insignificant, since the difference in U among the three bolt sizes was less than 0.05%. Other W sections were not simulated since the results were insignificant. Also, it was consistent in the results that the performance of the WT section follows a similar trend to the W sections; i.e., the bolt size has a minor effect. It is also notable that the AISC provisions does not consider the bolt size in the U calculation, which supports the findings of this study. Therefore, the study focused on providing a simplified model through integrating the most significant parameters; i.e., flange width, depth, and number of bolts. Integration of the bolt size may provide complication that is not desired by the code and practitioners.
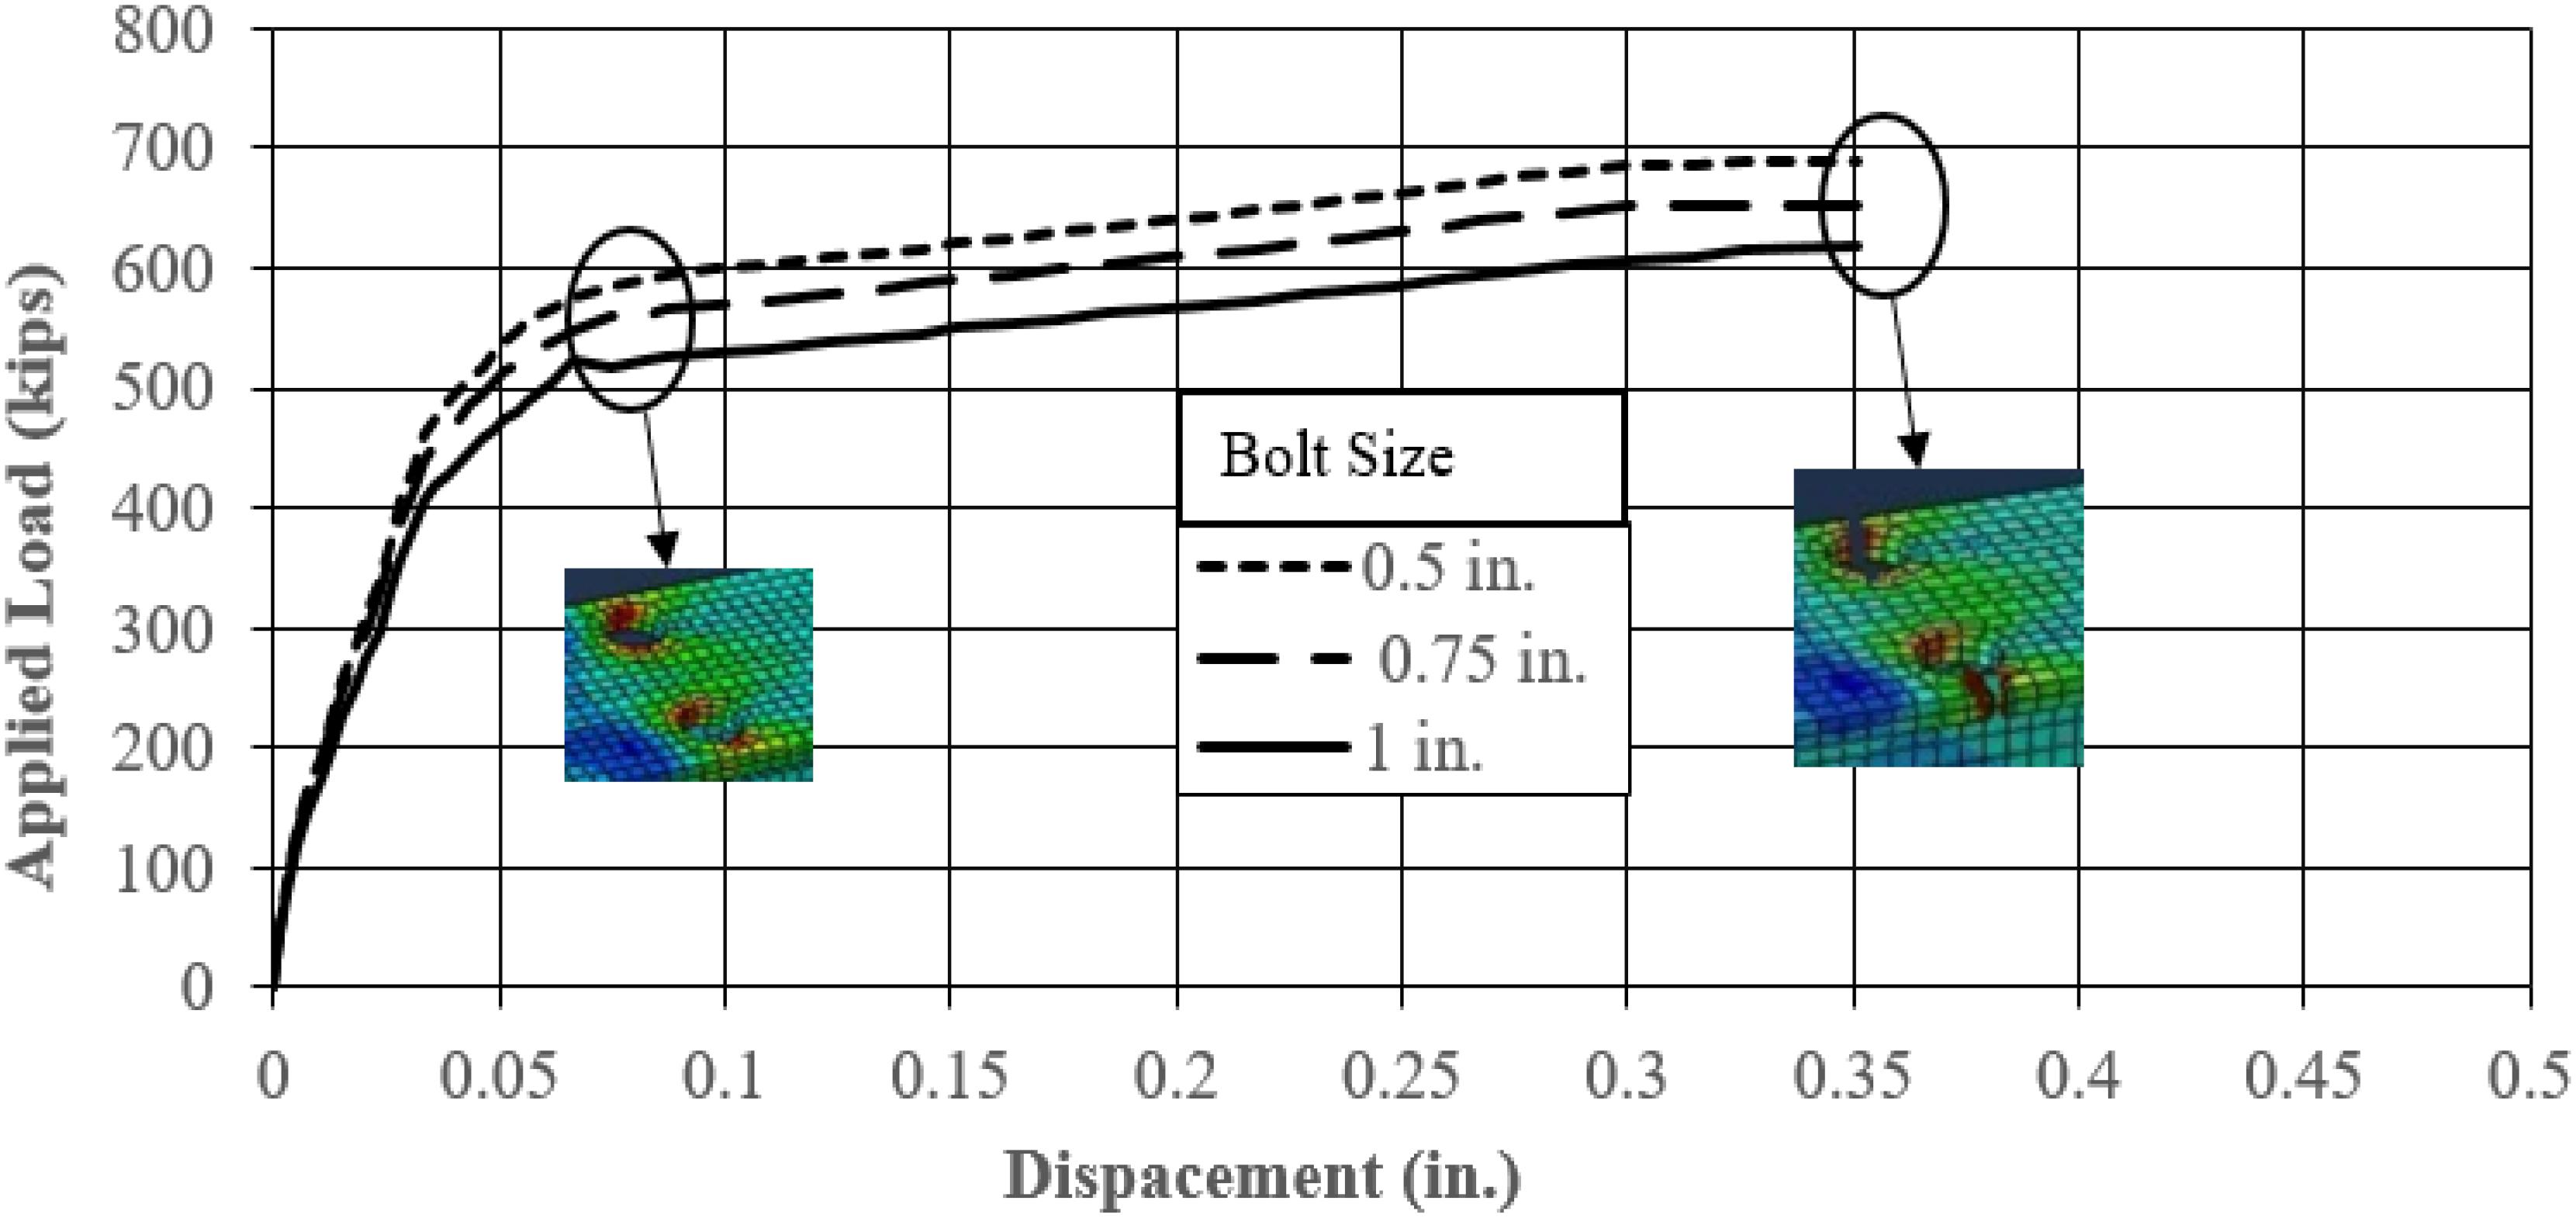
Figure 3. FEA results for the W16 × 45 section with different bolt size.
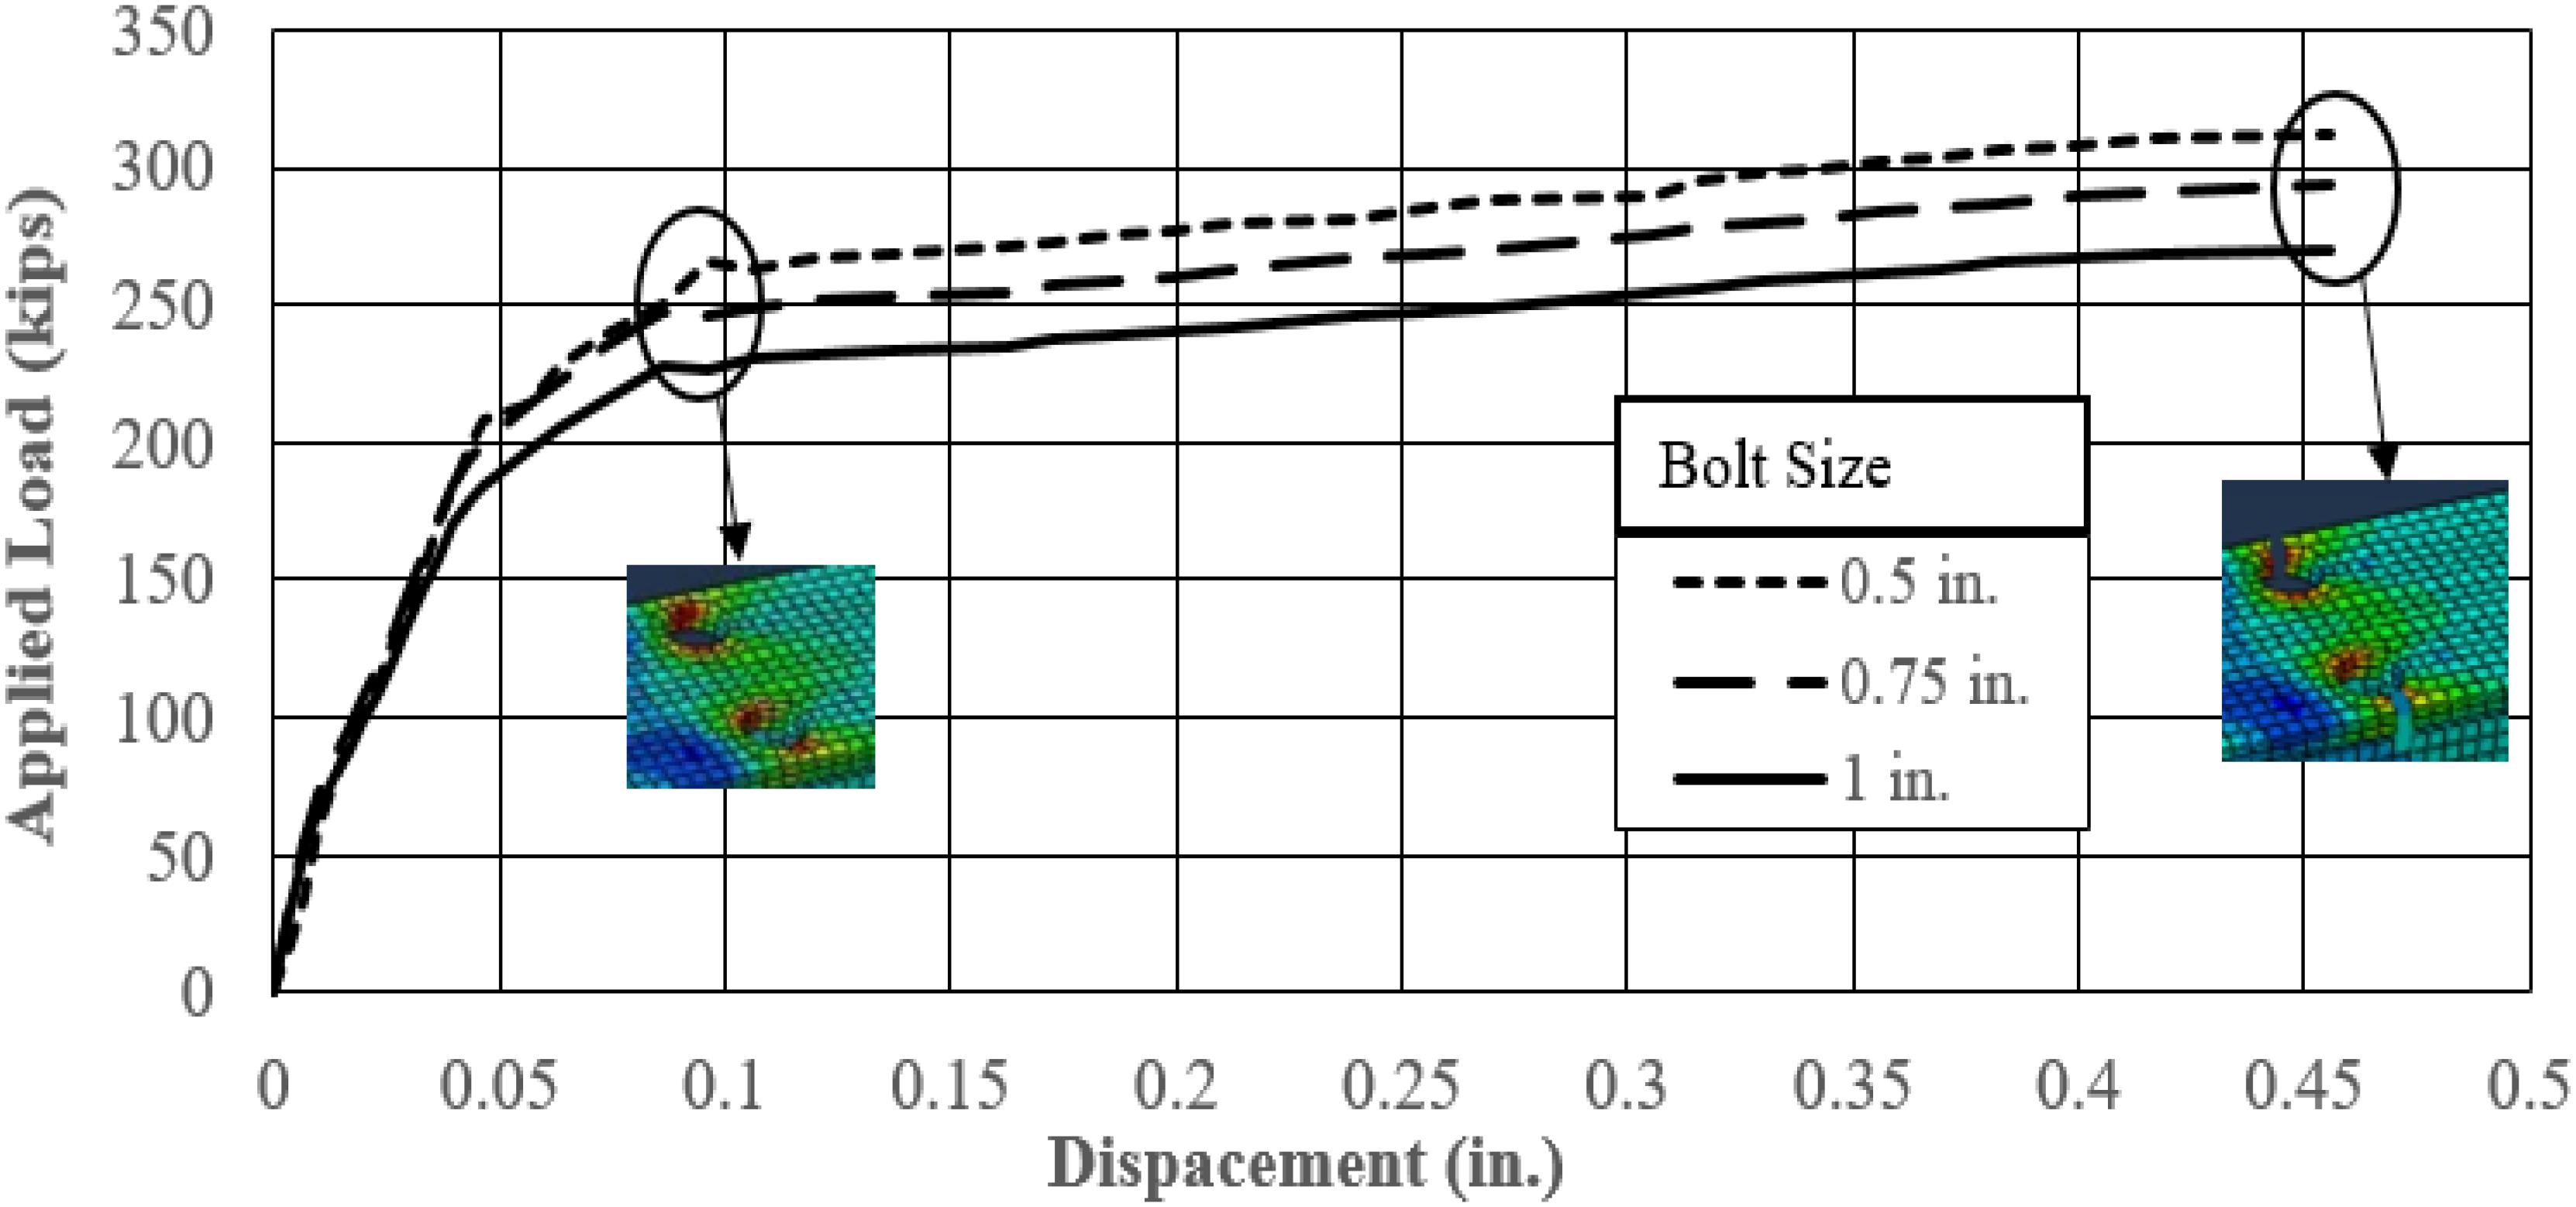
Figure 4. FEA results for the W12 × 22 section with different bolt size.
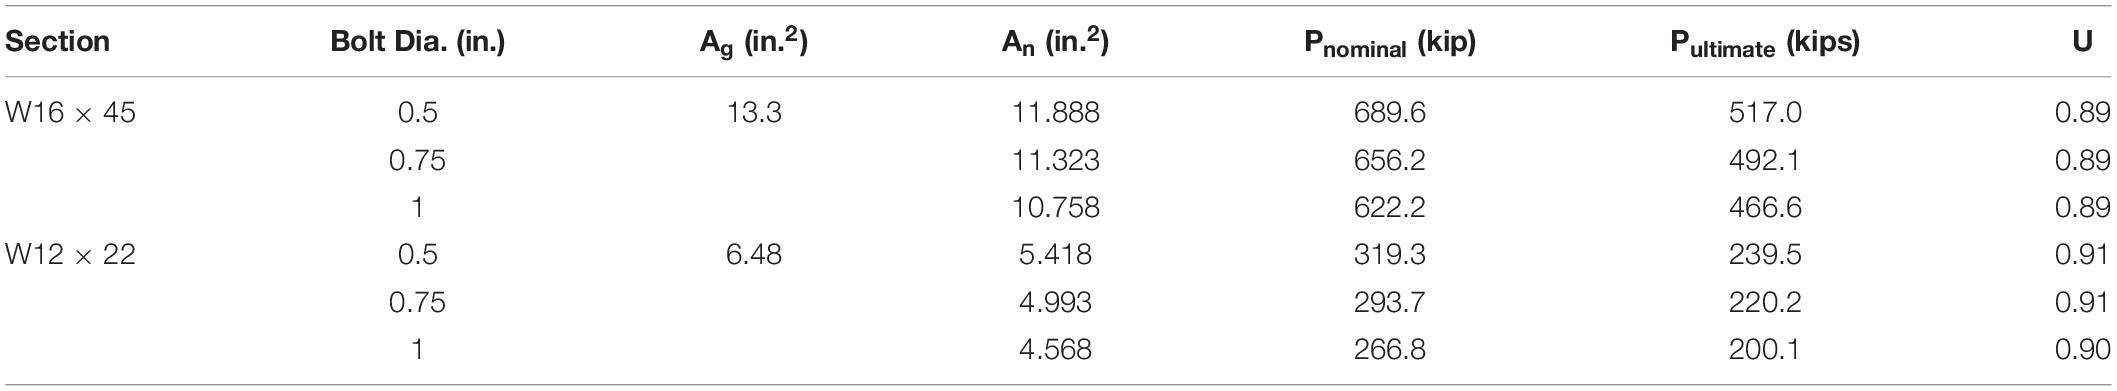
Table 1. FEA results for the W16 × 45 and W12 × 22 sections with different bolts sizes.
Calculation of U using the AISC Code (Table D3.1: Case 7) for W and WT sections, does not take into account the length of the connection. It considers only the ratio between the flange width and depth of the section to determine U. Specification J3.3 of the AISC Code indicates that the minimum distance (s) between the centers of bolt holes is times the nominal diameter (d) of the fastener. The bolt diameter of the studied case was 0.75 in. with a minimum spacing of 2 in. The AISC Specification J3.5 indicates that the maximum edge distance for bolt holes is 12 times the thickness of the connected part (but not more than 6 in.), and that the maximum spacing for bolt holes is 24 times the thickness of the thinner part (but not more than 12 in.). Figure 5 compares the value of U calculated according to the second criterion with different connection lengths (12, 9, 7.5 in.) with corresponding spacing (4, 3, 2.5 in. between the centers of the bolt holes) for the selected W and WT sections. The results indicate that for all analyzed W and WT sections, the U value increases as the connection length increases. For the W sections, the increase in U as the connection length increases was more pronounced for the larger sections, while in the WT sections, there was no such general trend, but was instead rather random.
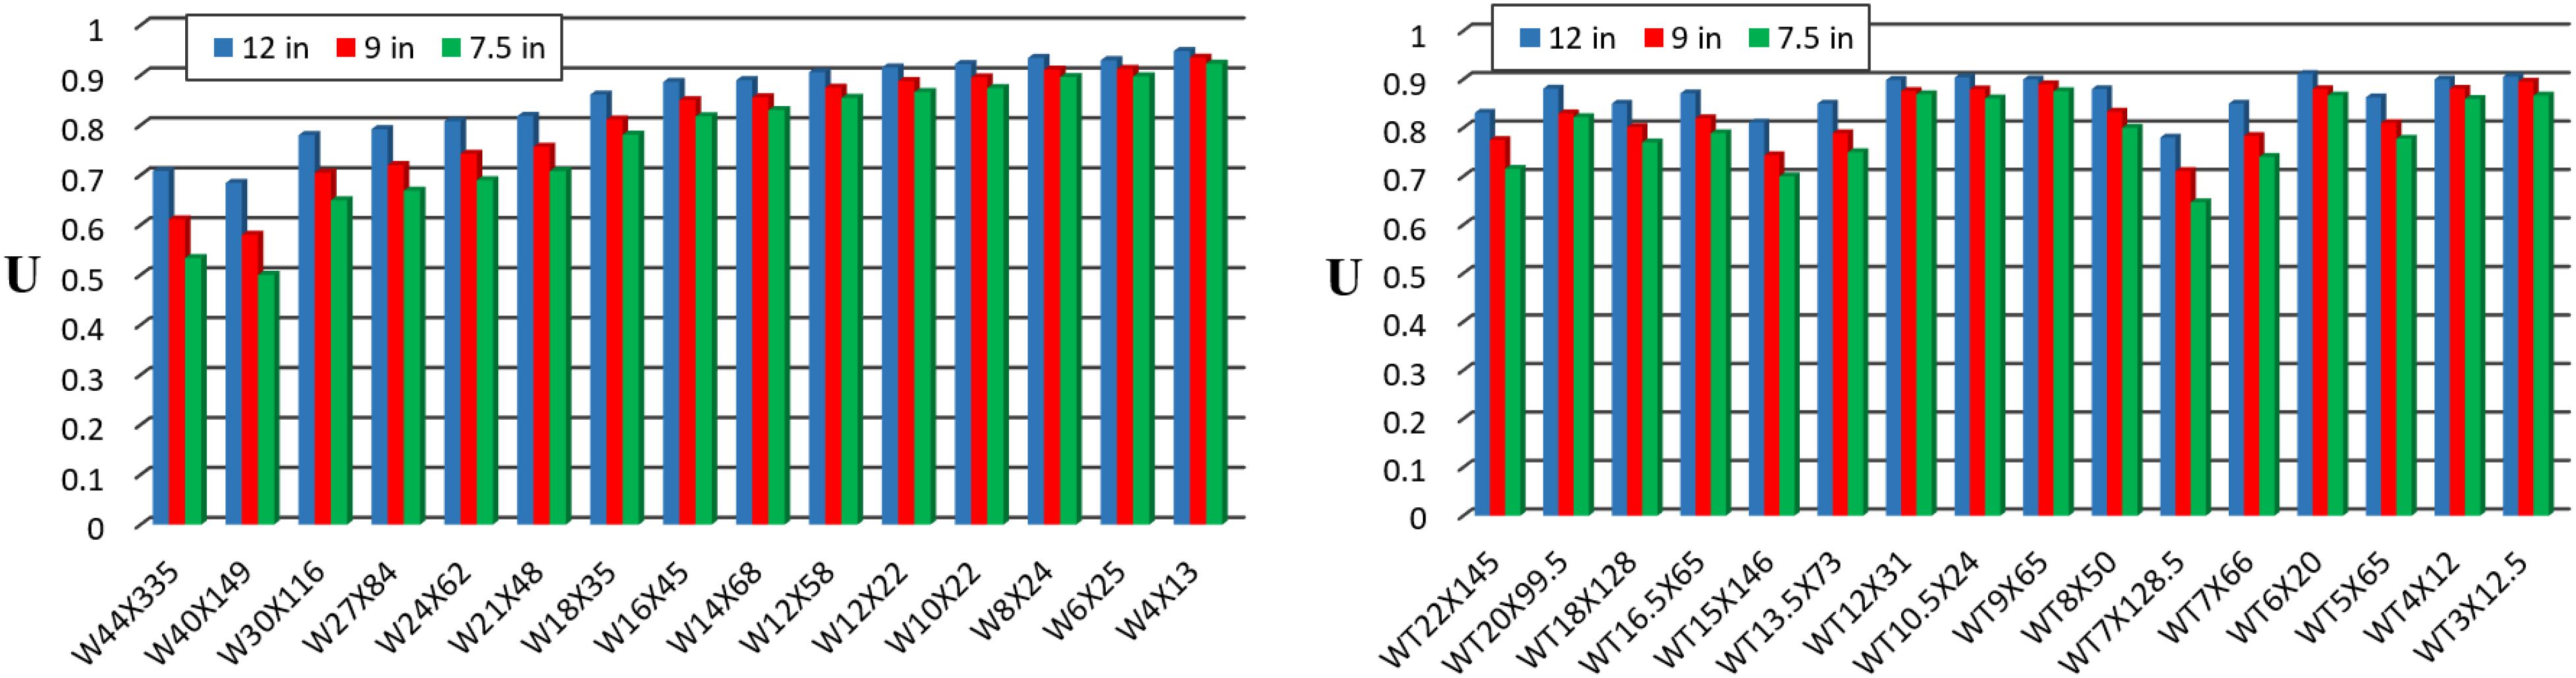
Figure 5. U values for the selected W and WT sections with different connection lengths.
The section geometric properties that affect U include: the connection eccentricity (), flange width (bf), member depth (d), flange area or area of gross connected elements (Af), and member gross-sectional area (Ag). The AISC Code considers the effect of eccentricity through Munse and Chesson’s Equation (Eq. 1). However, in Case 7 of Table D3.1, if bf/d is greater or equal to 2/3, U is allowed to be taken as 0.9, otherwise U is taken to be 0.85. The larger value of U from Eq. 1 and Case 7 is permitted. In most sections, 0.9 or 0.85 is larger than the calculated U using Eq. 1, and so the effect of is ignored. For the investigated W and WT-sections, Figure 6 shows the obtained trend using the FEA between the U values and different eccentricities for 12 in. connection length respectively. The results clearly indicate that for the W sections, the relation between and U is generally an inverse relationship. This inverse relationship was more pronounced when comparing the sections with different depth, but for the in same series sections (same depth); there was no direct relation between and U. For the WT sections, there was no trend between and U.
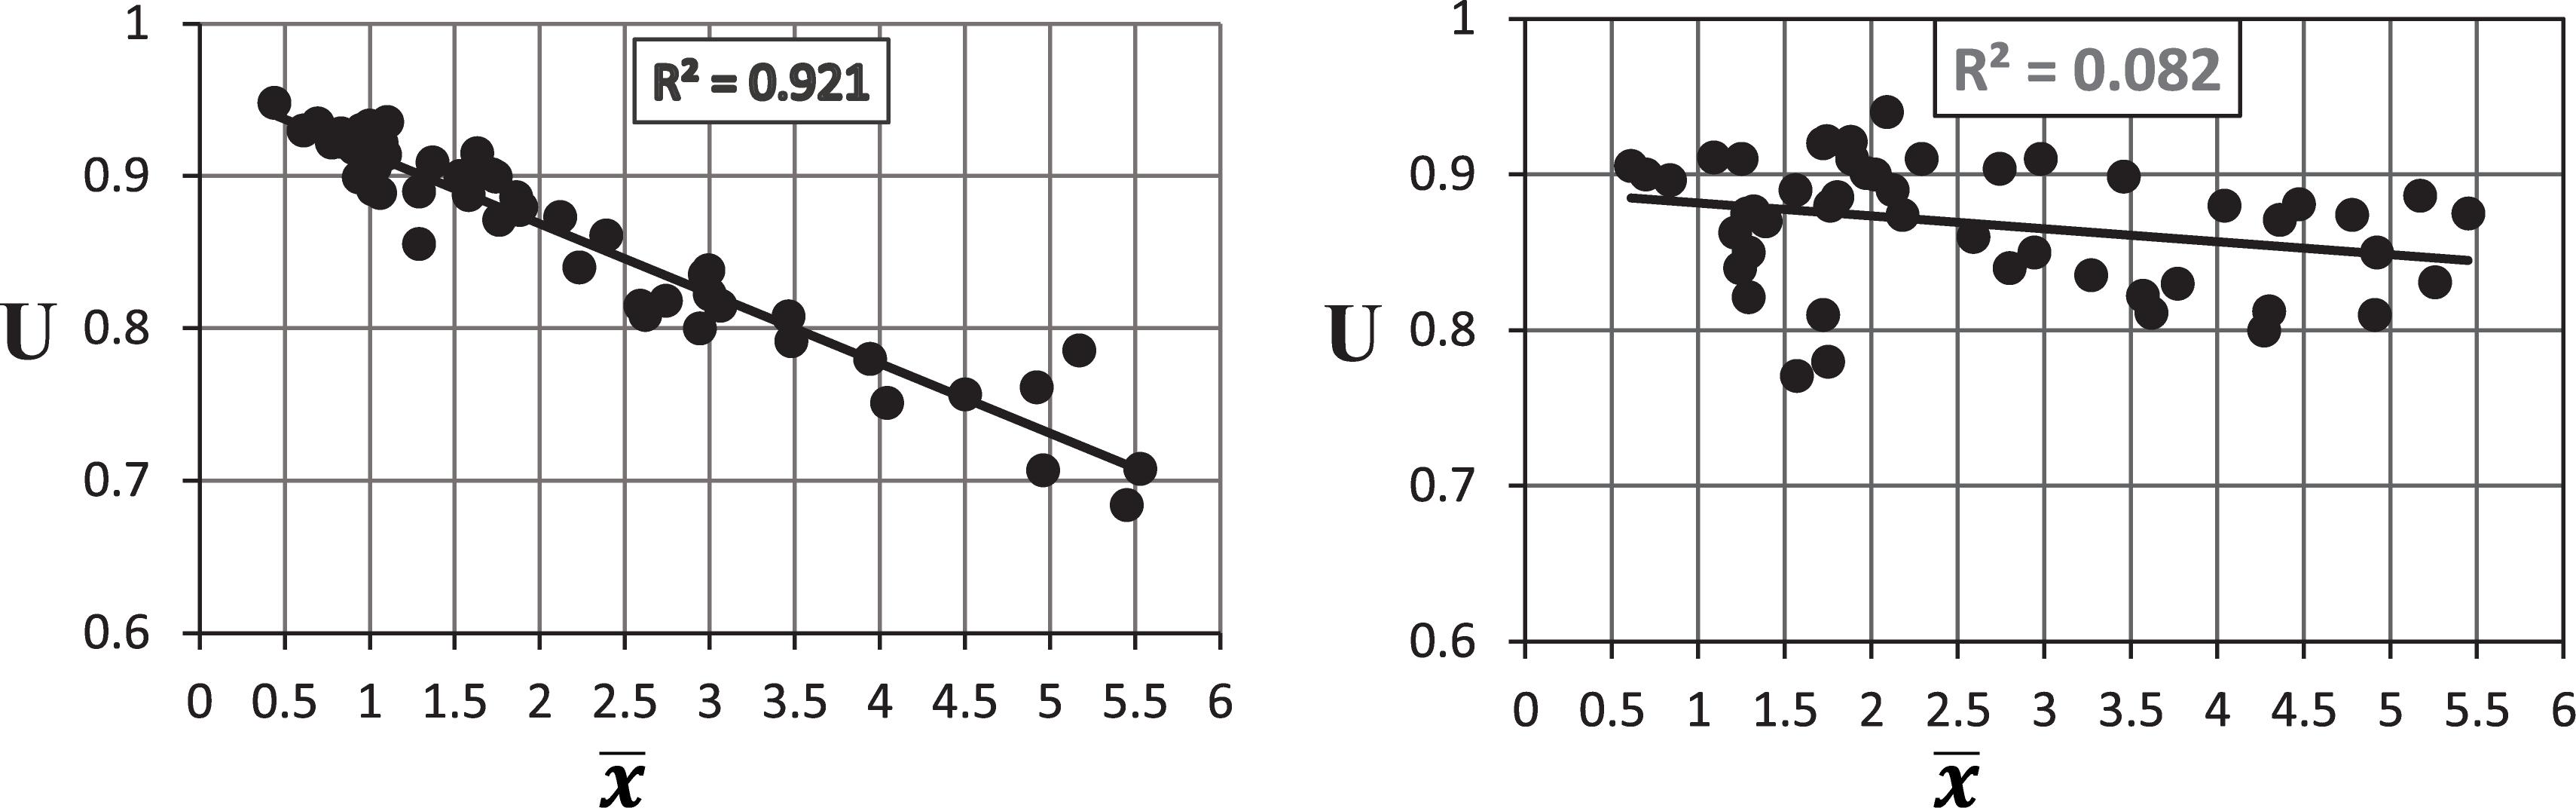
Figure 6. U vs. d based on FEA for W (left) and WT (right) sections (12 in. connection).
Figure 7 shows the relation between bf and U for the investigated W and WT-sections. The results indicate no direct trend between the bf and U, especially in the case of two sections in the same series or the close depth sections compared together. However, when the two sections are clearly different in terms of bf, there was a general difference in U; nearly an inverse relation between bf and U. Figure 8 shows the trend between U for the investigated W and WT-sections with different d at 12 in. connection length. The results indicate with a strong correlation coefficient (R2 = 0.91) that for the W sections, the relation between d and U is generally a direct inverse relationship. For the WT sections, there was no trend between d and U.
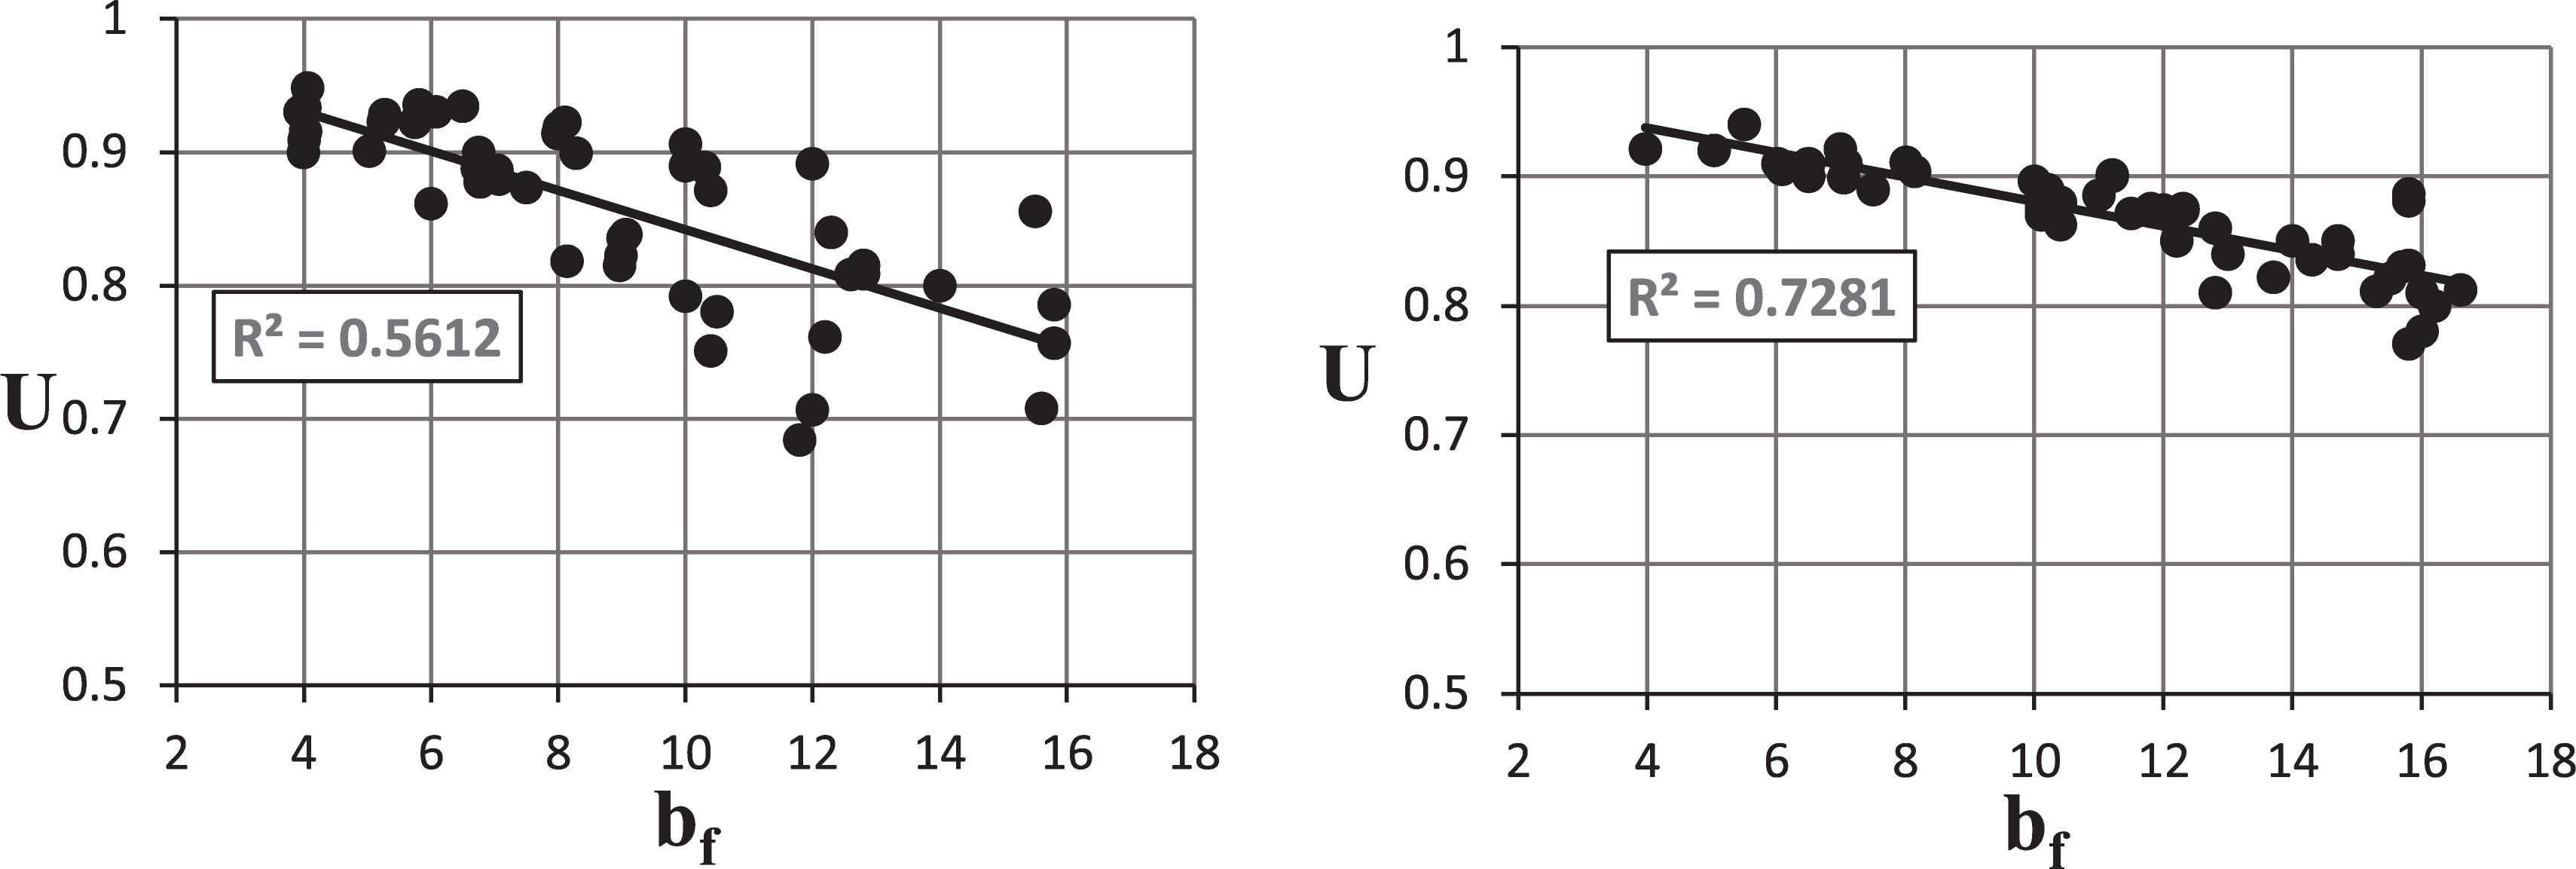
Figure 7. U vs. bf based on FEA for W (left) and WT (right) sections (12 in. connection).
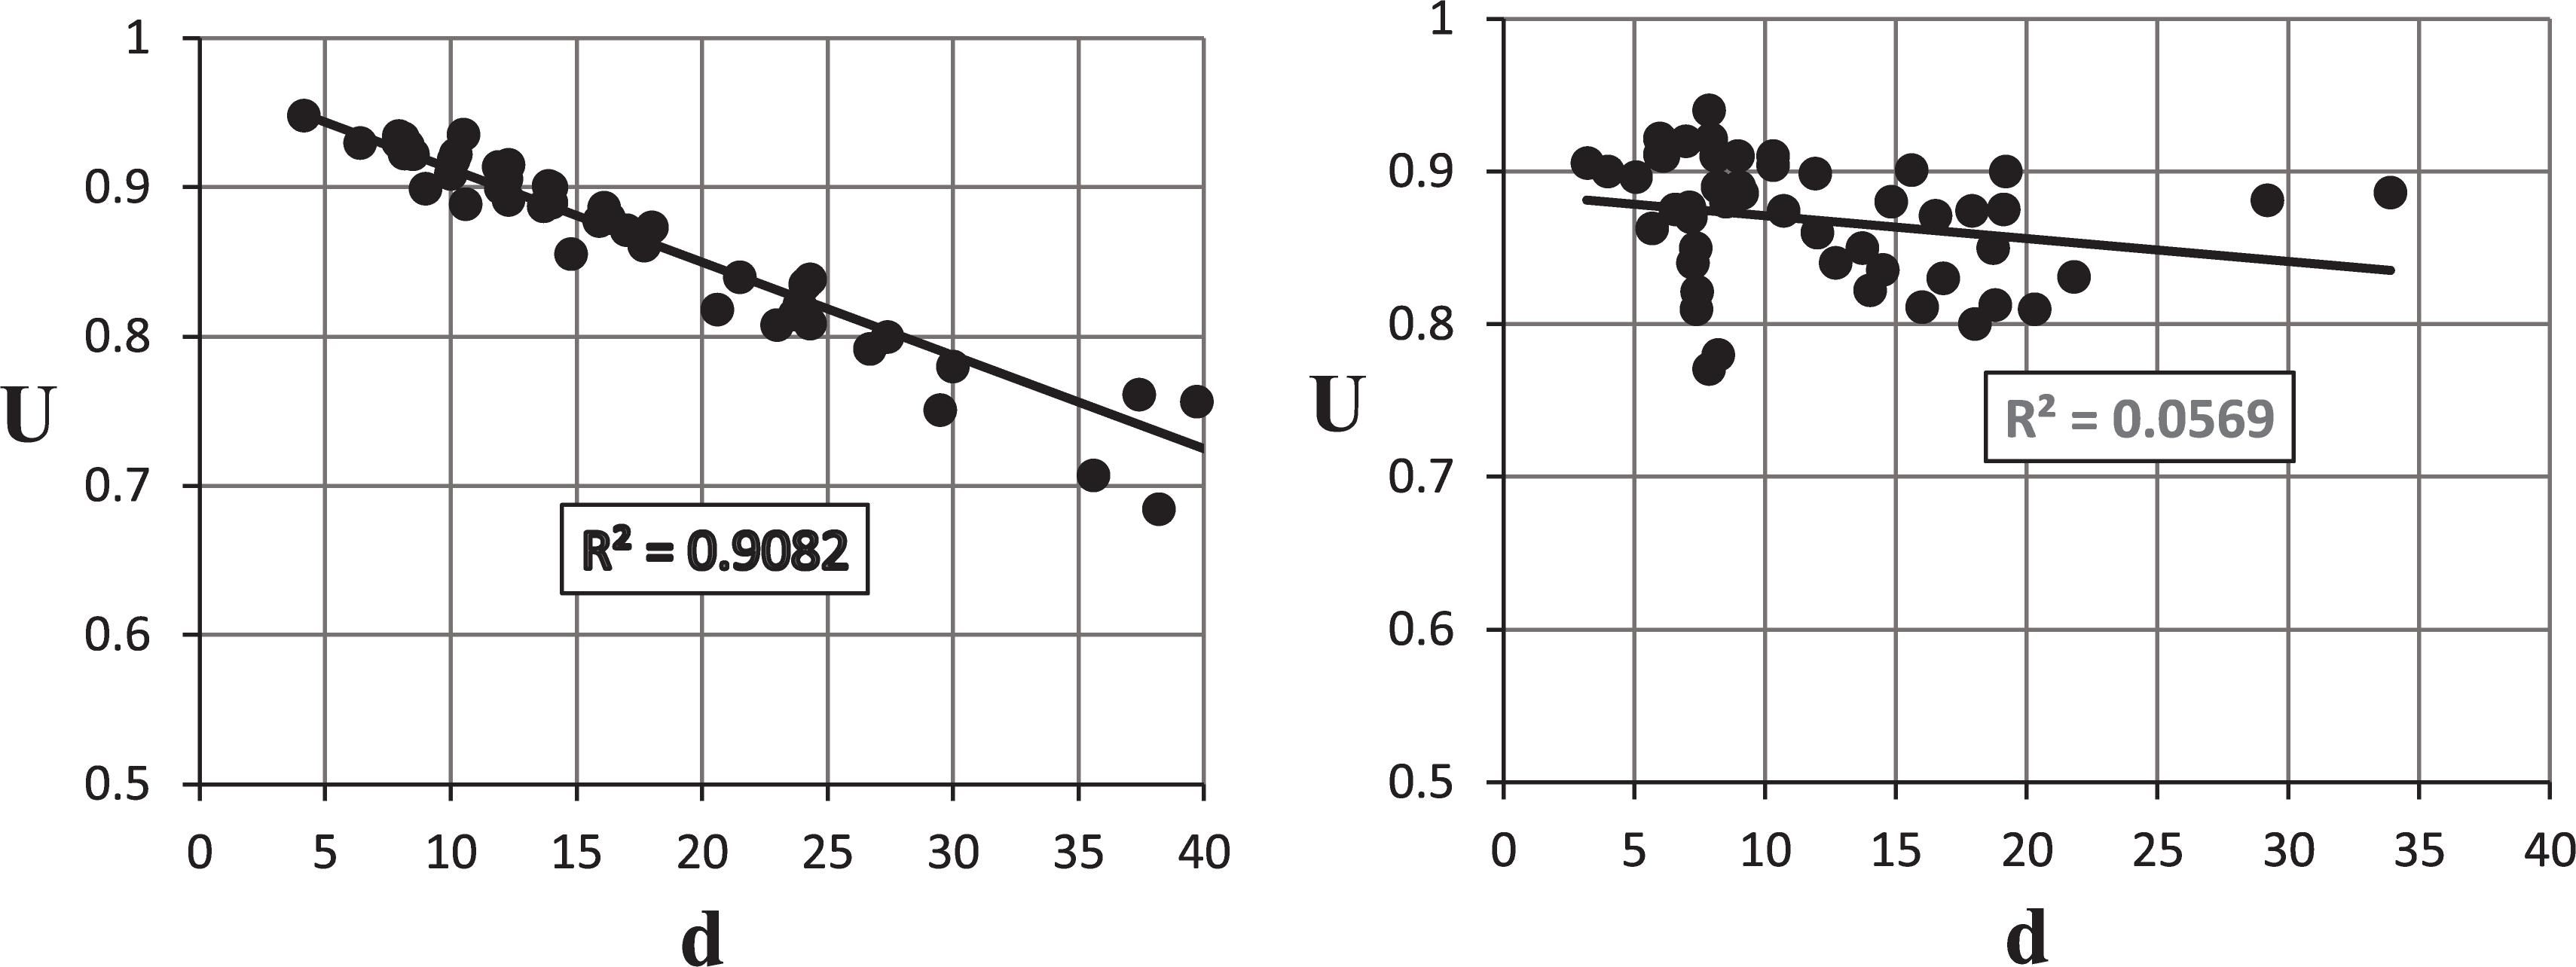
Figure 8. U vs. d based on FEA for W (left) and WT (right) sections (12 in. connection).
The flange area (Af) in this study represents the gross-connected area in the member, which includes the influence of the flange width (bf) and the influence of the thickness of the flange (tf). The effect of this area is mentioned in the AISC Code as a ratio between Af and Ag for the member, and that the U should not be taken as less than this ratio. Figure 9 shows the trend between U and Af based on12 in. connection length for the investigated W and WT-sections. The correlation is weak for the W sections and moderate for the WT sections. In terms of the effect of Ag, Figure 10 indicates nearly moderated correlation for the W sections, and moderate correlation for the WT sections. The trends between Ag and U and Af and U were almost comparable.
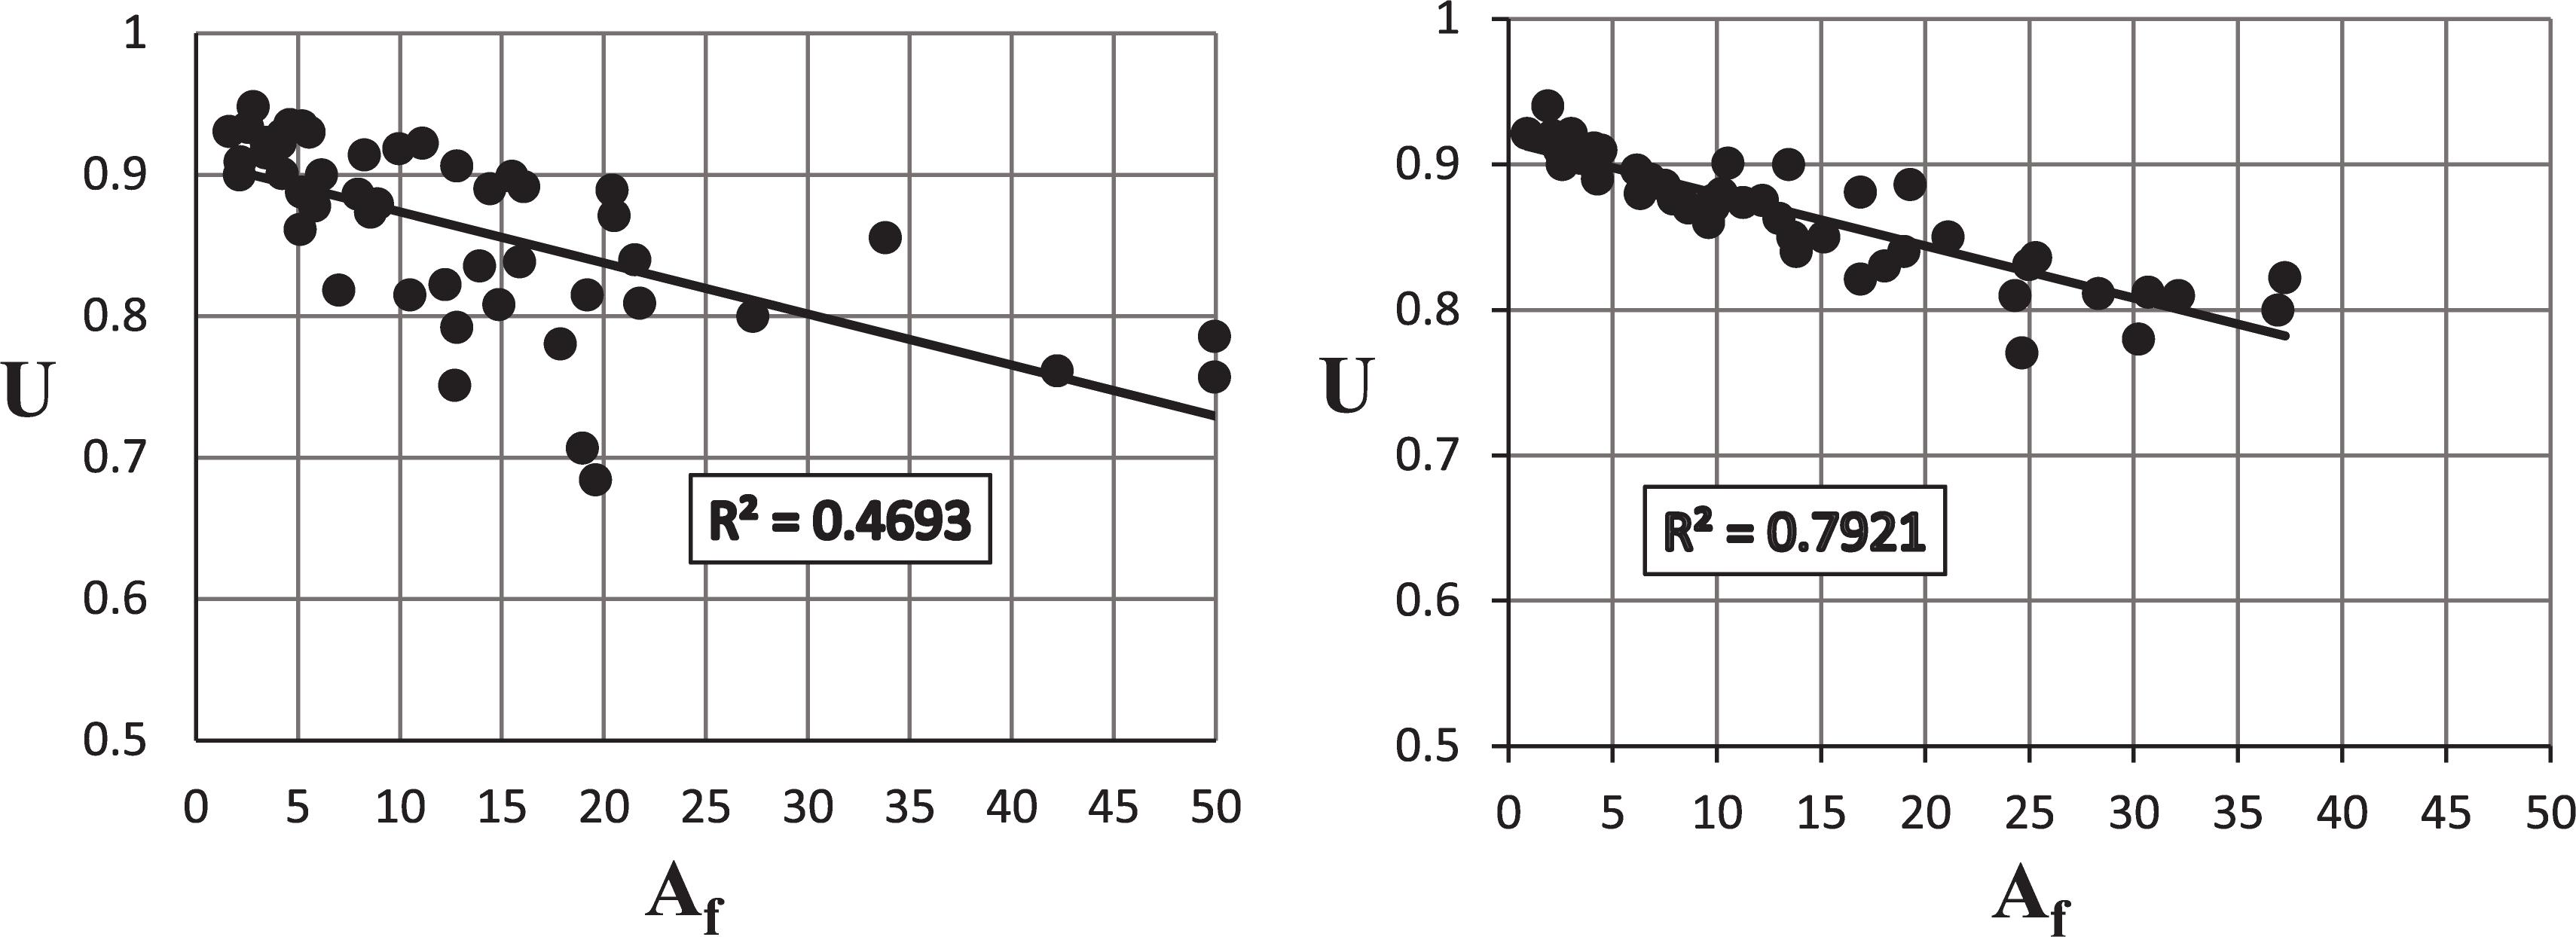
Figure 9. U vs. Af based on FEA for W (left) and WT (right) sections (12 in. connection).
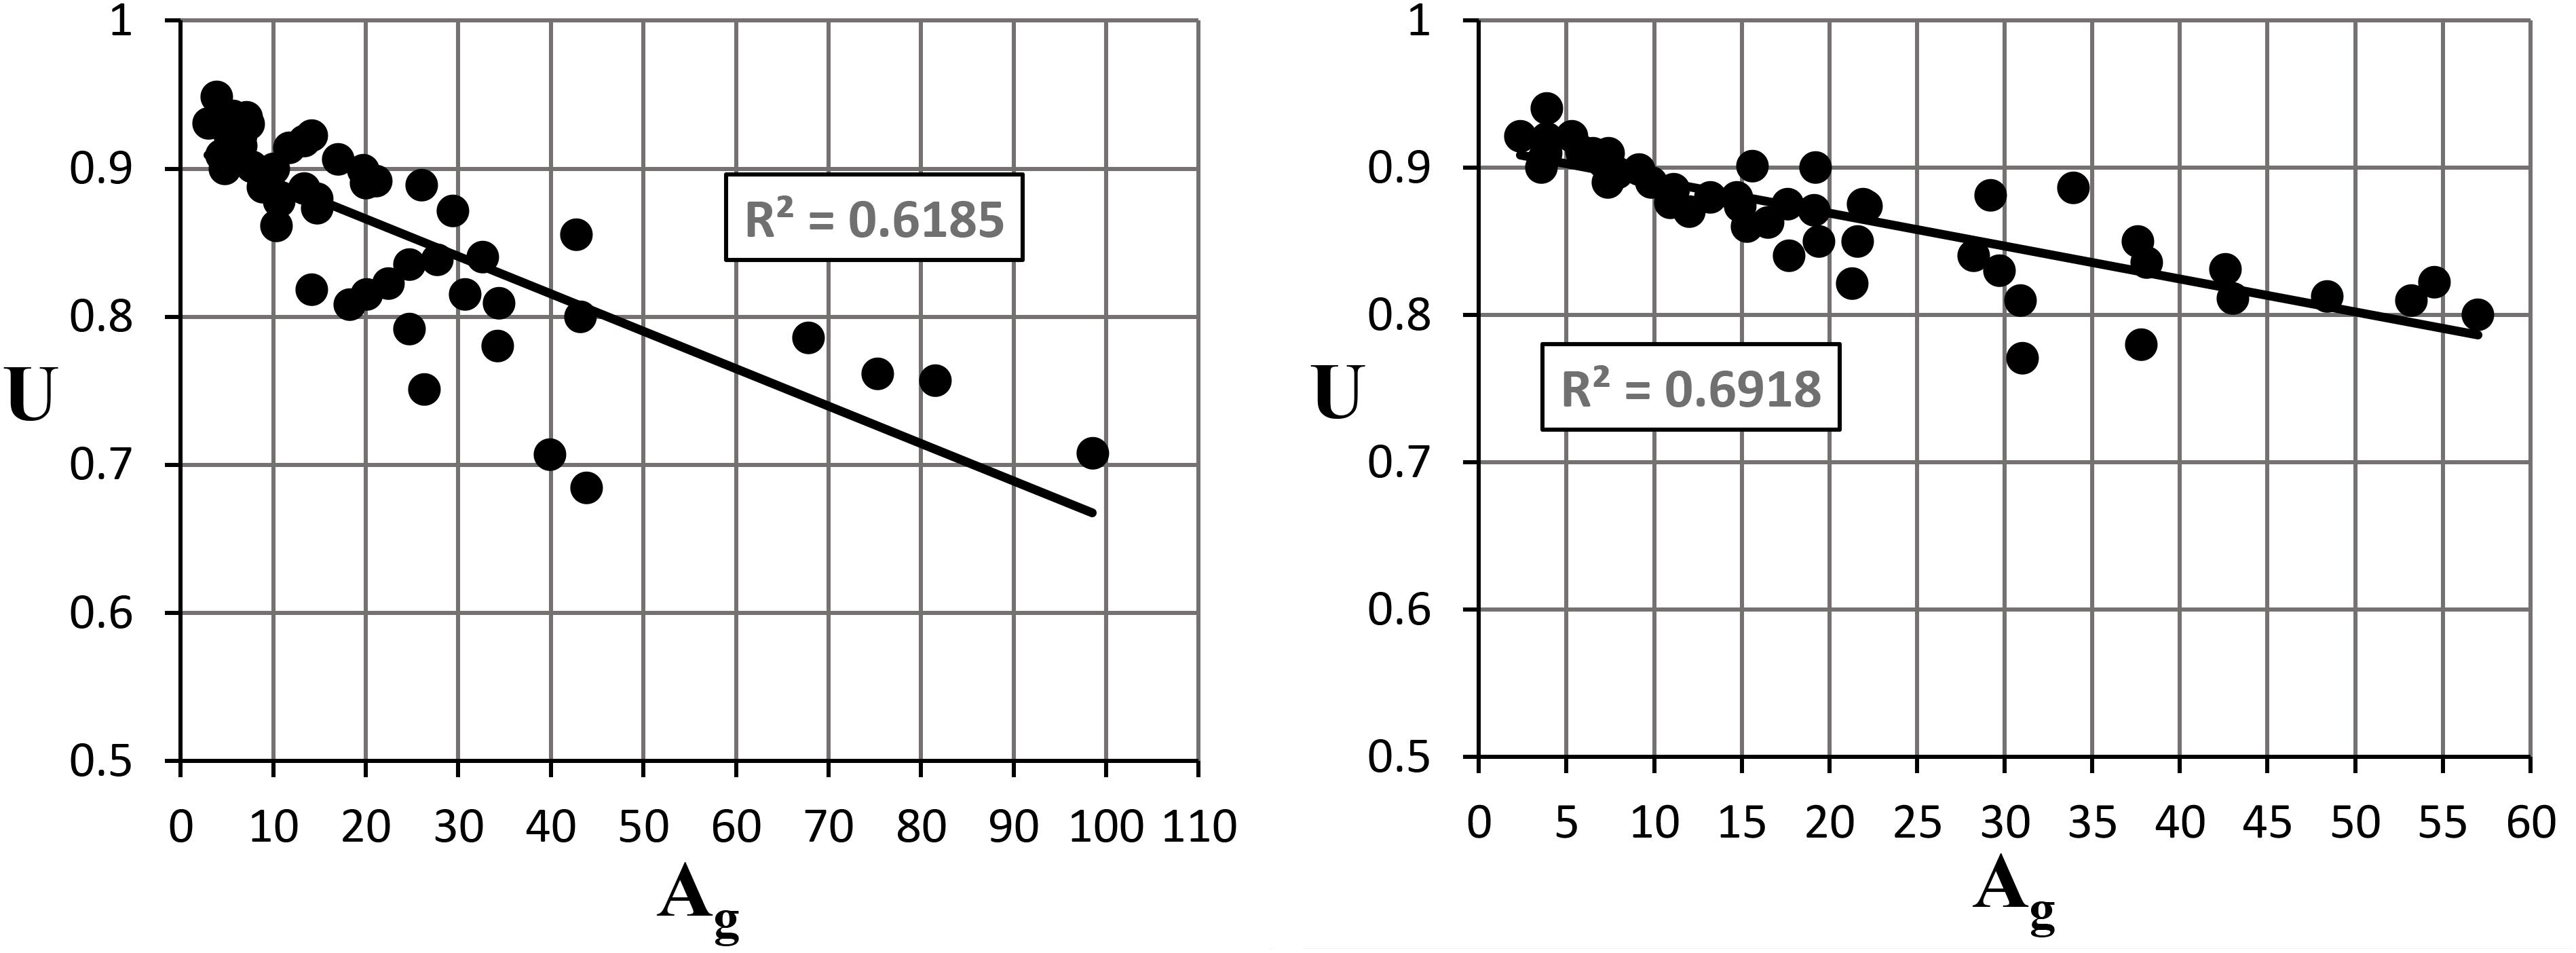
Figure 10. U vs. Ag based on FEA for W (left) and WT (right) sections (12 in. connection).
The FEA results indicated that the geometric properties and connection length are the dominant factors that affect U for both the W and WT sections. Regression analysis was then employed in order to identify the most reasonable relationship between U and combined section geometric properties and connection length. In order to avoid overfitting in the regression analysis, all geometric properties and connection length that affect U were considered. In addition, mathematical operations and ratios between these factors were used. The relationship between U and each geometric property was investigated individually and then combined together; i.e., bf with d, with the connection length, and Ag with Af. Based on the observed relationships, the parameters were merged together and investigated against U to obtain the most reasonable model with higher R2. For the W and WT sections, it was identified that U is strongly correlated with the multiplication of the ratios of eccentricity to connection length with width to depth with gross-area to flange area as shown in Figure 11. Based on this, Eq. 4 represents a proposed model for calculating U for W and WT sections. In order to evaluate the reliability and rationality of the proposed model, Figure 12 represents the correlation between U calculated using the FEA results and U calculated using Eq. 4 for the investigated W and WT sections with 12, 9, and 7.5 in. connection length. A strong correlation can be obviously seen which testifies about the accuracy and effectiveness of the proposed model.
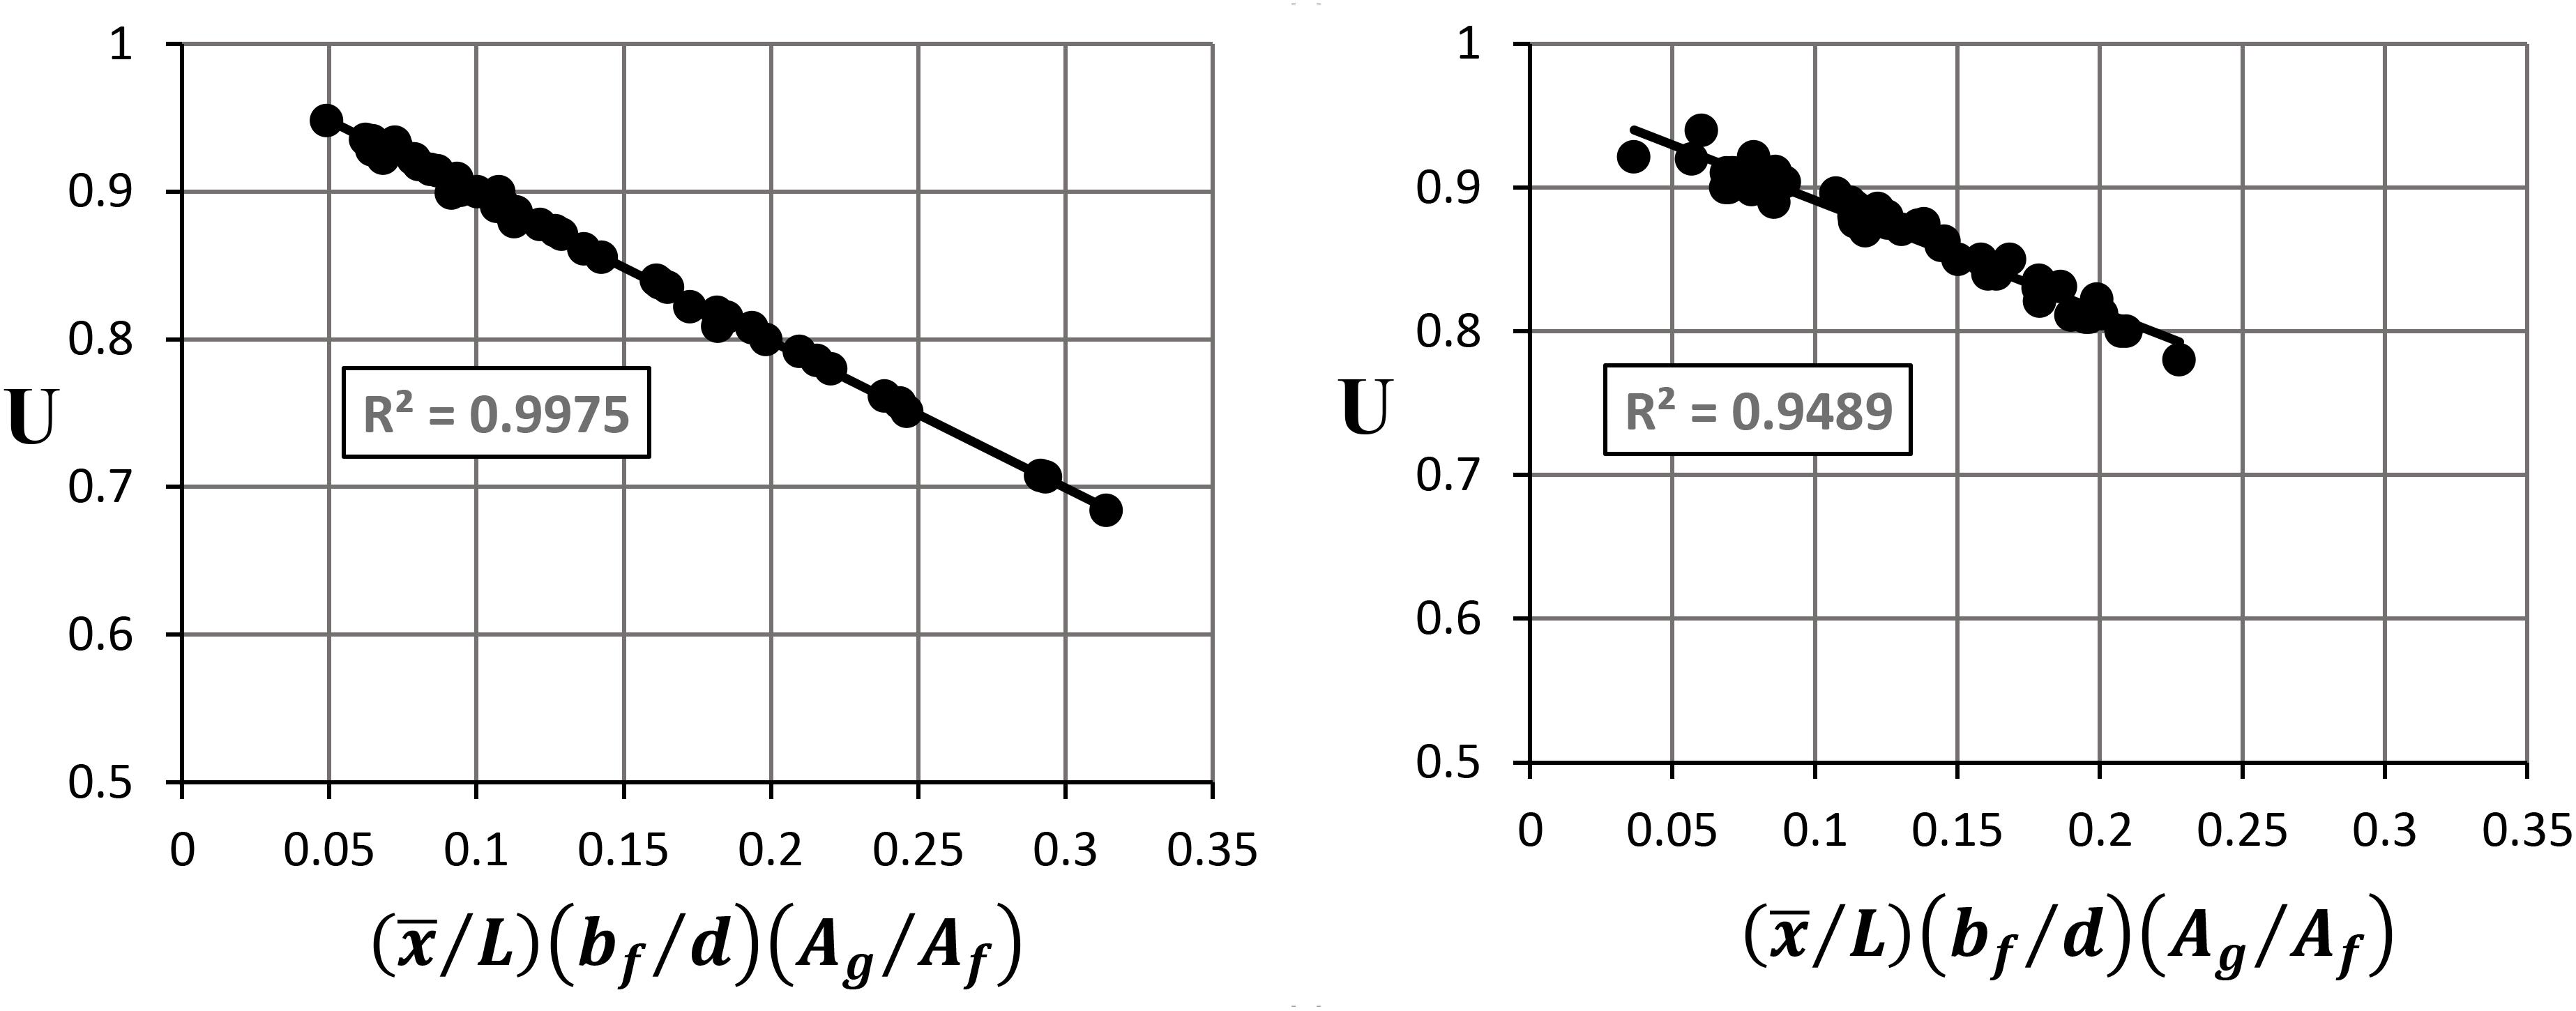
Figure 11. U vs. for W (left) and WT (right) sections.
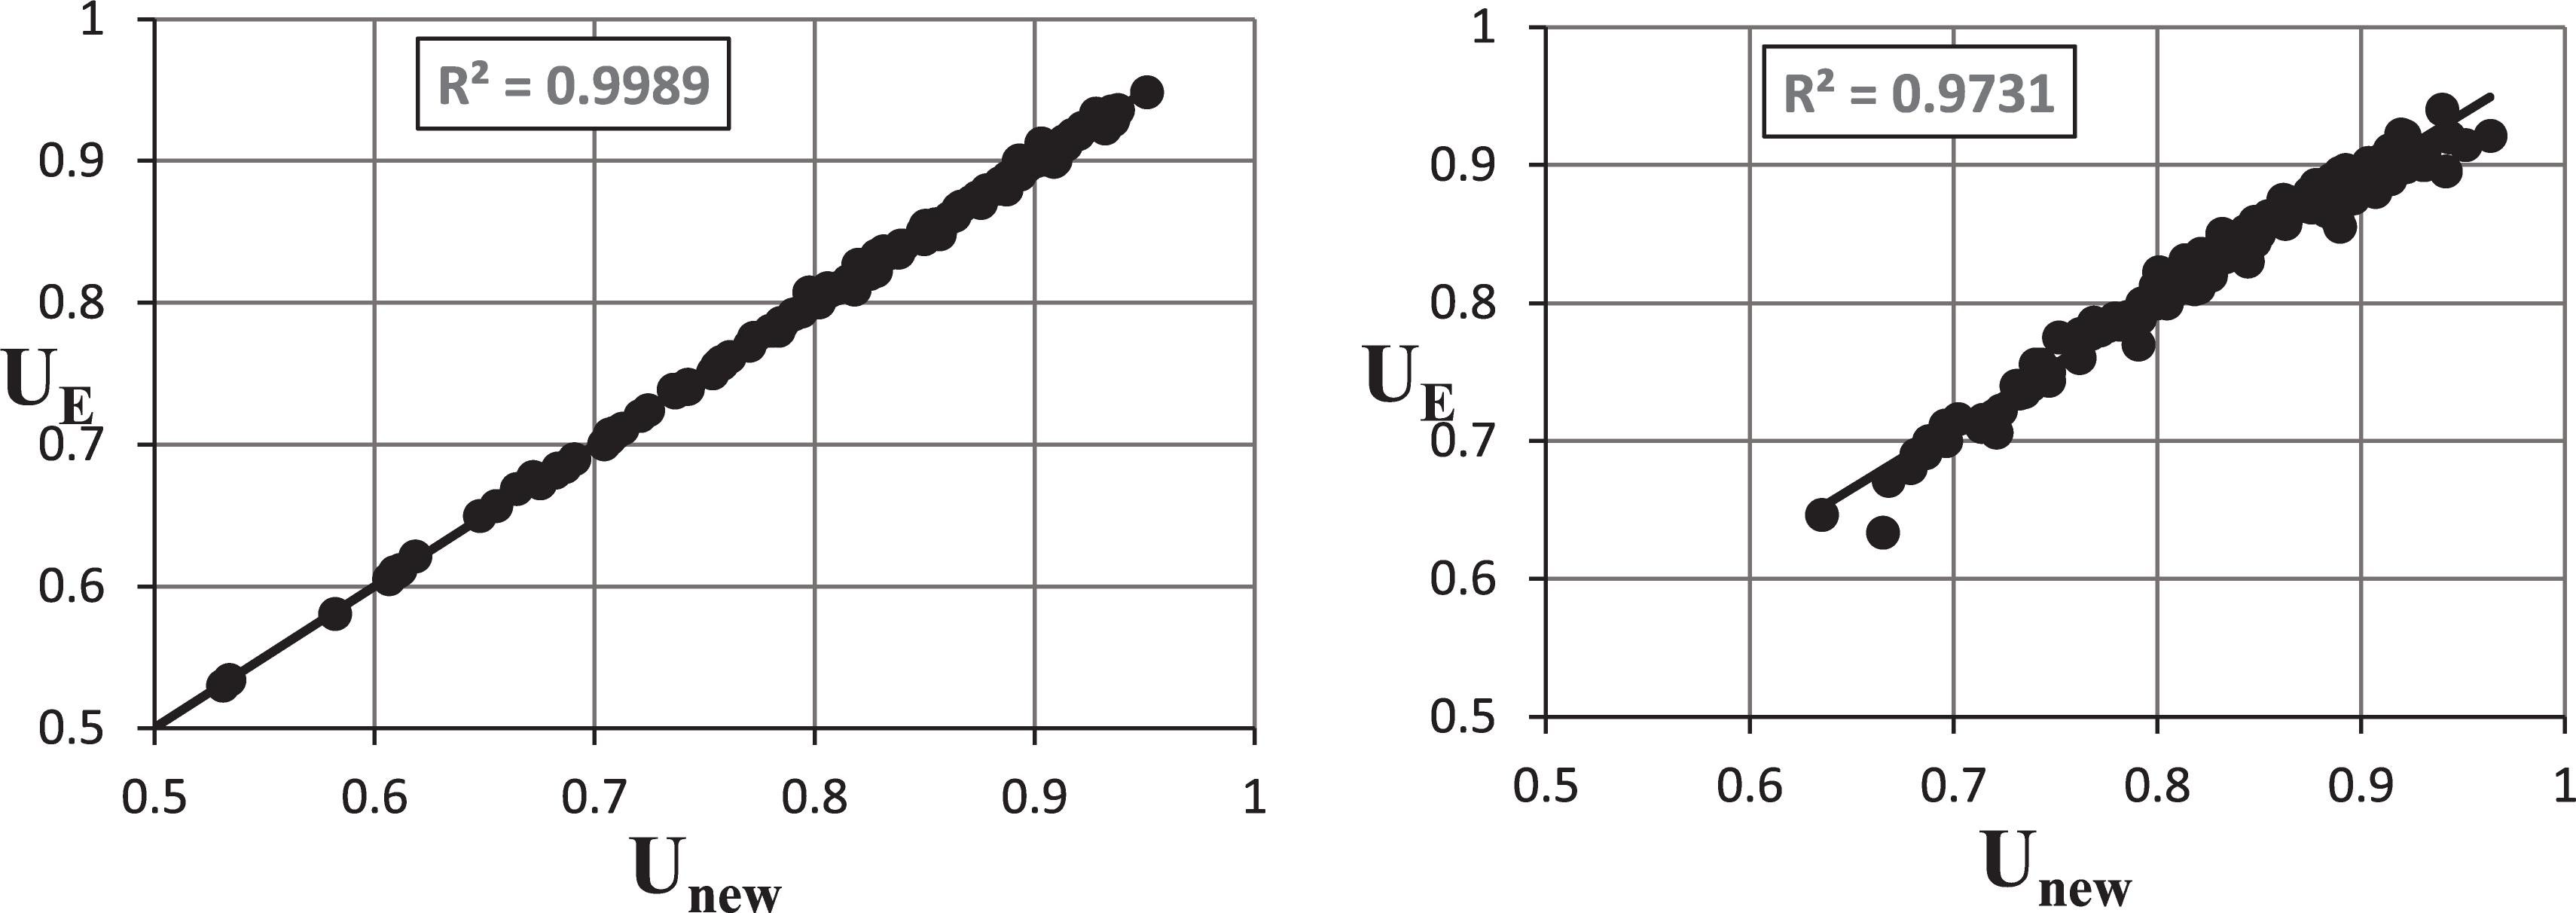
Figure 12. UE (FEA) vs. Unew (proposed) for W (left) and WT (right) sections.
The high R2 of the proposed model is an indication of good prediction, but it is not sufficient by itself and does not guarantee overfitting. Therefore, a precise cross-validation method was used in order to determine how well the proposed model fits new observations by using predicted R2 values. In this statistical technique (K-fold cross-validation), part of the data is set aside as training data and the model is constructed on both training and the remaining test data. The results from training and test data are then compared and an appropriate model is selected. The initial data set was first partitioned into 5 subsets (K = 5) with an equal number of records in each subset (10 records). This was repeated three times: for 12 in. connection length, 9 in. connection length, and 7 in. connection length. This produced 30 models (15 for W-sections and 15 for WT-sections); all obtained based on different subsets. The obtained models were then used to predict the missing observations of testing data. Some of these models are linear regression include all geometric properties and others are non-linear regression include combinations and ratios between the geometric properties, eccentricity, and the connection length. The obtained R2 of each of these models are shown in Table 2. The results show that the obtained values of R2 for all models are strongly comparable with R2 of the proposed model for the shear lag factor, indicating the fitting is appropriate.
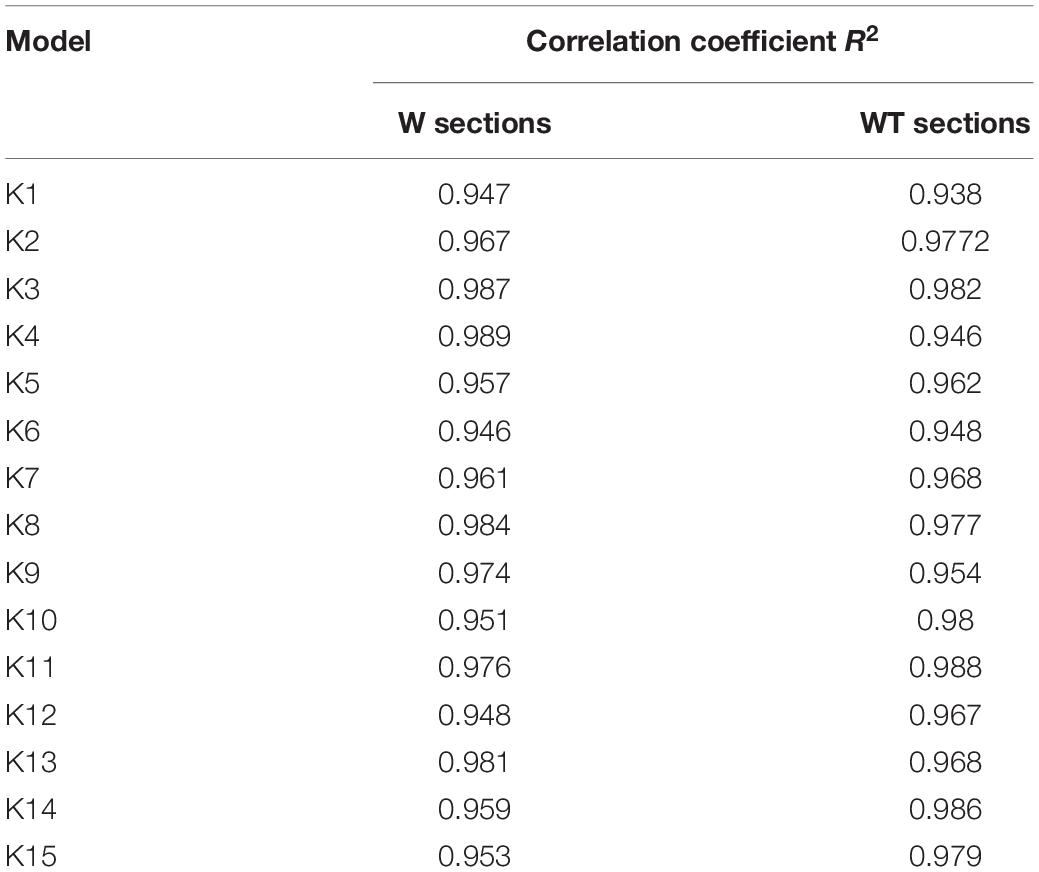
Table 2. Correlation coefficient R2 obtained based on the K-fold cross-validation method.
Based on the findings of this study, the following conclusions are made:
1. The provisions for the shear lag factor prescribed in AISC Code are irrational when applied to bolted W and WT sections. For some W and WT sections, enormous difference occurs between the U results obtained using Case 2 and Case 7 of Table D3.1 (AISC Specification D), yet the Code allows the use of the larger value, which is risky.
2. A new model for calculating U was developed for W and WT sections, which maintains the general shape of the Munse and Chesson equation with the integration of the effect of the section properties through normalized ratios.
3. Comparing the proposed equation for calculating U with the Munse and Chesson equation indicates that the latter one is conservative and not effective for all geometric properties.
4. The FEA results obtained in this study denies the claim that the upper limit for U is 0.9, rather the U value could be higher than 0.9.
5. The section depth is the main geometric property affecting U. Maximum U (maximum net area efficiency) can be achieved with minimum section depth (W4 sections series). That is why the range for U in W sections is wider than the range in WT sections.
6. Length of the connection plays a significant factor in the value of the shear lag factor. Whilst this was ignored in the shear lag factor calculations for most of the sections in the AISC code, the proposed equations have taken the length of the connection into account.
7. The bolt diameter has minimal effect on U since, for similar sections, the difference in U when the bolt diameter changes from 0.75 to 1 in. or 0.5 in. was less than 0.05%.
The raw data supporting the conclusions of this article will be made available by the authors, without undue reservation, to any qualified researcher.
MA: conceptualization, methodology, supervision, writing – reviewing, and editing. KA: conceptualization, methodology, supervision, reviewing, and editing. MA-S: investigation, draft preparation, and analysis. All authors contributed to the article and approved the submitted version.
The authors declare that the research was conducted in the absence of any commercial or financial relationships that could be construed as a potential conflict of interest.
We acknowledge the support of the Jordan University of Science and Technology (JUST).
American Institute of Steel Construction [AISC] (2010). AISC 360-10: Specifications for Structural Steel Buildings. Chicago, IL: American Institute of Steel Construction.
Canadian Standards Association [CSA] (2014). CAN/CSA-S16-14 Limit States of Design of Steel Structures. Etobicoke, ON: Canadian Standards Association.
Chesson, E., and Munse, W. H. (1963). Net section design. J. Struct. Eng. 89, 67–106. doi: 10.1016/0029-5493(85)90095-0
Chung, K. F., and Ip, K. H. (2000). Finite Element Modelling of Bolted Connections between cold formed steel strips and hot rolled steel plates under static shear loading. Eng. Struct. 22, 1271–1284. doi: 10.1016/S0141-0296(99)00082-6
Epstein, H. I. (1992). An experimental study of block shear failure of angles in tension. Eng. J. Am. Inst. Steel Constr. 29, 75–84.
Gaylord, E. H., Gaylord, C. N., and Stallmeyar, J. E. (1992). Design of Steel Structures. New York: McGraw Hill Book Company.
Gupta, M., and Gupta, L. M. (2002). Net section efficiency of bolted steel angles under tension steel in construction. Tech. J. Inst. Steel Dev. Growth 3, 71–77.
Hibbit, H. D., Karlsson, B. I., and Sorensen, E. P. (2012). ABAQUS User Manual, Version 6.13. Providence, RI: Simulia.
Kennedy, J. B., and Sinclair, G. R. (1969). Ultimate capacity of single bolted angle connections. J. Struct. Div. 95, 1645–1660.
Kouhi, J., and Kortesmaa, M. (1990). Strength Tests on Bolted Connections Using High-Strength Steels (HSS Steels) as a Base Material. Oulu: VTT Technical Research Center of Finland Ltd.
Kulak, G. L., and Grondin, G. Y. (2001). AISC rules for block shear in bolted connections. Eng. J. Am. Inst. Steel Constr. 4, 199–203.
Kulak, G. L., and Wu, E. Y. (1997). Shear lag in bolted angle tension members. J. Struct. Eng. 123, 1144–1152. doi: 10.1061/(ASCE)0733-9445(1997)123:9(1144)
Orbison, J. G., Barth, K. E., and Bartels, P. A. (2002). Net section in tension members with connection eccentricity. J. Struct. Eng. 128, 976–985. doi: 10.1061/(ASCE)0733-9445(2002)128:8(976)
Pan, C.-L. (2004). Prediction of the strength of bolted cold – formed channel sections in tension. Thin Walled Struct. 42, 1177–1198. doi: 10.1016/j.tws.2004.02.001
Paula, V. F. D., Bezerra, L. M., and Matias, W. T. (2008). Efficiency reduction due to shear lag on bolted cold-formed steel angles. J. Constr. Steel Res. 64, 571–583. doi: 10.1016/j.jcsr.2007.10.008
Vasarhelyi, D. D., and Chiang, K. C. (1967). Coefficient of friction in joints of various steels. J. Struct. Div. 93, 227–244.
Keywords: shear lag factor, tension members, WT-sections, finite element analysis 2, shear lag factor model
Citation: Alhassan MA, Abdalla KM and AL-Shatnawi ME (2020) Critical Evaluation of the Shear Lag Factor Provisions for W-Sections. Front. Built Environ. 6:144. doi: 10.3389/fbuil.2020.00144
Received: 11 June 2020; Accepted: 03 August 2020;
Published: 30 September 2020.
Edited by:
Snehashish Chakraverty, National Institute of Technology Rourkela, IndiaReviewed by:
Amin Mohebkhah, Malayer University, IranCopyright © 2020 Alhassan, Abdalla and AL-Shatnawi. This is an open-access article distributed under the terms of the Creative Commons Attribution License (CC BY). The use, distribution or reproduction in other forums is permitted, provided the original author(s) and the copyright owner(s) are credited and that the original publication in this journal is cited, in accordance with accepted academic practice. No use, distribution or reproduction is permitted which does not comply with these terms.
*Correspondence: Mohammad A. Alhassan, bWFhbGhhc3NhbkBqdXN0LmVkdS5qbw==
Disclaimer: All claims expressed in this article are solely those of the authors and do not necessarily represent those of their affiliated organizations, or those of the publisher, the editors and the reviewers. Any product that may be evaluated in this article or claim that may be made by its manufacturer is not guaranteed or endorsed by the publisher.
Research integrity at Frontiers
Learn more about the work of our research integrity team to safeguard the quality of each article we publish.