 Michael J. Harris
 Richard E. Christenson
95% of researchers rate our articles as excellent or good
Learn more about the work of our research integrity team to safeguard the quality of each article we publish.
Find out more
ORIGINAL RESEARCH article
Front. Built Environ. , 24 July 2020
Sec. Earthquake Engineering
Volume 6 - 2020 | https://doi.org/10.3389/fbuil.2020.00120
This article is part of the Research Topic Recent Advances and Applications of Hybrid Simulation View all 14 articles
Base isolation is a well-known technique used to reduce accelerations and inertial forces in structures during earthquakes. However, excessive displacements of the structure due to flexibility of the isolation layer bearings may contribute to moat wall impact events. These impact events have the potential to cause substantial structural damage. This impact behavior and the effects on structural dynamics have been shown to be highly complex and difficult to model by means of pure numerical simulation. In this paper, the cyber-physical technique called Real-Time Hybrid Simulation (RTHS) is employed to capture the uncertainties in force profiles of moat wall impacts and to analyze the complex interactions between impacts and the dynamics of base-isolated structures during earthquake excitations. It is shown that RTHS is capable of accurately capturing the interactions between the isolation layer and moat wall during impact events induced by ground motions. In addition, the RTHS technique is used to analyze the role played by moat wall material nonlinearities in reducing the inertial demand on the structure during impact events. Finally, possible extensions of the research to larger scales as well as consideration of additional moat wall variants are proposed.
Base isolation is a widely accepted approach aimed at protecting a structure from seismic excitations. This protection is generally accomplished through the use of flexible rubber bearings placed between the foundation and the bottom story (isolation layer) of the structure (Delfosse, 1977; Kelly, 1981, 1990). The flexible bearings reduce the fundamental frequency of the structure to the point that incoming ground excitations contain energy in a higher bandwidth than the resonance frequency and reduce the absolute acceleration of the structure (Jain and Thakkar, 2004; Warn and Ryan, 2012). This, in turn, reduces the inertial demand on the structure, but the relative displacements between the structure and the ground are substantially increased (Connor, 2003; Chopra, 2006). For this reason, the technique of base-isolation is often combined with additional energy dissipation devices such as viscous and/or magneto rheological dampers (Providakis, 2008; Hussain, 2018). This decreases the relative displacement of the base slab during ground motions, but also decreases the effectiveness of structural isolation while increasing accelerations (Thakkar and Jain, 2004; Chopra, 2006). This energy dissipation has been the focus of prior work using RTHS to analyze base isolation. Studies have focused on the use of smart energy dissipation devices in conjunction with isolation mechanisms (Lin et al., 2004; Chen et al., 2014; Asai et al., 2015), mid-story isolation techniques (Keivan et al., 2017; Zhang et al., 2017), and examination of the nonlinear characteristics of the base-isolation layer (Furinghetti et al., 2020). Even in the cases where added damping is used, if the relative displacement of the base isolation layer is large enough, the isolation layer may impact the foundation wall. This can cause damage to the foundation due to impact and increase the demand on the superstructure due to increased accelerations and inertial forces. Base-isolated structures are particularly vulnerable to long-period, long-duration earthquakes such as the Tohoku, Japan earthquake which occurred on March 11, 2011 as well as the Kumamoto, Japan earthquake which occurred on April 14, 2016 (Ariga et al., 2006; Takewaki et al., 2013; Hayashi et al., 2018).
In order to predict the effects of moat impacts and general pounding impacts on structures, numerous analytical studies have been conducted. The treatment of impact between structures is typically accomplished through the use of either impact or force methods with the force method being more prevalent because the impulse model is incapable of providing the forces between the impacting entities (Muthukumar and DesRoches, 2006; Polycarpou et al., 2013, 2014). Various numerical models have been developed for use in numerical simulations. Muthukumar and DesRoches (2006) discuss several approaches to numerical impact models based on impact theory including linear spring, Kelvin viscoelastic, Hertz nonlinear spring, and Hertzdamp hyperelastic models. These models have been used in a number of analytical studies to investigate the effects of impacts on structures including analyses based on purely linear behavior (Liu et al., 2014, 2017), viscoelastic impact behavior (Kun et al., 2009), and nonlinear impact behavior (Muthukumar and DesRoches, 2006). The models assumed a constant line of action and a lack of torsional forces. The viscous damping of the impact behavior was constructed based on assumed coefficients of restitution. The models also assumed the impacting bodies were lumped masses. However, when studying the response of diaphragms in buildings during pounding events, Cole et al. (2011) asserted that simplified lump mass models of impact behavior may be inadequate when describing the complexities associated with these impact events. This is due to the fact that lumped mass models do not consider the impact geometry and how this geometry will affect contact forces observed during impact events. Indeed, the actual impact geometry contains a large degree of uncertainty. Bamer et al. (2017) noted that contact forces have a profound effect on the interaction forces of impacts and examined the potential for simplifying the representation of these contact forces using techniques such as modal truncation. They concluded that as higher fidelity is introduced to the contact models, there is a notable increase in agreement between time history simulation results for these modal analysis methods, which performed well as compared to the full benchmark solution of the pounding problem being analyzed. In particular, they observed marked agreement between the benchmark solution and their proposed “Hybrid Substructure Truncation” technique. However, this higher fidelity and accuracy of contact models necessitates the use of increasingly smaller time steps during simulation in order to maintain stability (Bamer et al., 2017). Polycarpou et al. (2013) developed a methodology of treating impact events that helped to alleviate the need for a priori knowledge or assumptions regarding the stiffness, damping, and geometry of the region of impact between structures. This need for assumptions regarding the impact geometry underlies the highly uncertain nature of not only this geometry, but the force-displacement behavior of the impacting bodies. In addition to the above-mentioned impact studies, Masroor and Mosqueda (2013) developed a model for the force-displacement behavior of impacts based on empirical results of impact forces of a base-isolated structure during large scale testing. In their experimental results, the impact force time history approximates a half-sine pulse of frequency equal to roughly 8 Hz. On top of this half-sine pulse, there was also higher frequency behavior observed initially, but these higher frequency oscillations damp out rapidly. From their results, they constructed an impact model based on a cantilevered beam with distributed stiffness and damping used to represent soil backfill of the foundation wall. The proposed model showed good agreement with experimental results. All of these impact models attempt to strike a balance between computational efficiency and realism. However, the experimental studies of Masroor and Mosqueda have demonstrated the complexities and uncertainties involved with predicting the force-displacement behavior of the foundation wall.
The present study proposes the use of the dynamic testing technique, Real-Time Hybrid Simulation (RTHS), as a means of analyzing structural pounding in response to earthquake excitations. By replacing the analytical representation of impacting bodies with the physically measured restoring forces occurring during impact events, this approach eliminates the need to strike a balance between overly simplistic impact models and those that are computationally expensive. The use of a moat wall analog for the physical substructure within the RTHS loop enables the test to capture the uncertainties associated with impact geometry and the force-displacement of the materials by using measured feedback forces in place of a numerical calculation of the impact forces. In addition to alleviating the uncertainties associated with the impact geometry and behavior, RTHS is able to capture the effects of yielding within the moat wall. This phenomenon was shown to have a substantial effect on the dynamic response of the system by both Wolf and Skrikerud (1979) as well as Sarebanha et al. (2017).
Following this introduction, a discussion of the RTHS testing technique is provided, including both the history and implementation procedure. A description of the structure to be analyzed, and the substructuring methodology is also provided. The specialized equipment required to conduct RTHS testing is then discussed, and the specific equipment used for this work is outlined. Next, the experimental techniques used in this work are discussed. This discussion includes the selection of ground motions for testing, the selection and testing of the physical substructure, the technique used to transform full-scale numerical displacements to the lab scale and back, and the topic of actuator compensation. The results of the tests are presented which include the time histories of impact force behavior for the moment of impact with the physical substructure and the frequency content of this impact behavior. This is followed by time histories of the relative displacement of the isolation layer, the absolute acceleration time histories of the isolation layer, and the time histories of the reaction force of the moat wall acting on the base slab. The force-displacement behavior obtained during RTHS testing is then presented along with the deformation strain rate behavior. The above-mentioned experimental test results are compared with previous results by Masroor and Mosqueda (2013) as well as with results from analytical simulations based on elastic impact models as used by Liu et al. (2014, 2017). Finally, conclusions from this work are drawn and suggestions for future work are proposed.
Real-Time Hybrid Simulation is a testing technique wherein a structure is partitioned or substructured into physical and numerical components which are then coupled in real-time. An excitation is imparted on one or more substructures and the response of the entire structure is analyzed. Typically, the numerical substructure contains components of the structure that can be modeled analytically with great confidence, while the physical substructures are those containing strong nonlinearities, uncertainties, or properties that cannot be modeled in closed form. The first RTHS test was conducted by Hakuno et al. (1969) where a cantilevered structure was excited by base excitations imparted by a shaker. The real-time solutions of the equations of motion were obtained using an analog electronic computer. Due to inadequate control of the actuators, the test was considered unsuccessful (Takanashi and Nakashima, 1987).
Subsequently, the dynamic substructure testing of systems progressed using digital computers and testing was typically conducted on an extended time scale. This new approach to hybrid testing was termed Pseudo-dynamic Testing (PDT) (also known as Online Testing) and used the same hybrid substructuring approach, but coupled physical substructures with numerical substructures using digital means of numerical integration and extended timescales for testing (Mahin and Shing, 1985; Takanashi and Nakashima, 1987). Extending the timescale of testing reduced the burden on required computation power, and lessened the potential for instabilities stemming from inadequate actuator control. During testing, the complete system was partitioned into a physical substructure containing components of the structure that would likely undergo nonlinear deformation while the numerical substructure represented the remainder of the structure from which, boundary conditions to be imposed on the physical substructure were calculated. The solution of the equation of motion was calculated by a computer and this solution was used to define the boundary conditions at the interface between the numerical and physical substructures. Compatibility of the forces and displacement of the structure at the interface of the numerical and physical substructures are considered. This quasi-static method of structural testing was capable of capturing a number of phenomena associated with seismic excitation such as permanent deformation and hysteretic behavior (Takanashi and Nakashima, 1987). Despite the success of PDT, the extended time scale used for this technique prohibited accurate physical testing of rate-dependent components such as viscoelastic or friction dampers. To this end, a number of techniques have been used or developed to decrease the computational demand during testing including Frequency-Based Substructuring (Gordis, 1994), Convolution Integral Method (Kim et al., 2011), State Space Modeling (Su and Juang, 1994; Abbiati et al., 2019) and Partitioned Time Integration (Abbiati et al., 2019).
The increasing power of digital computers, the development of digital actuator control, and the improvement of D/A converters led to the re-introduction of real-time testing by a number of researchers (Nakashima et al., 1992). Horiuchi et al. (1996) analyzed the effects of hydraulic actuator delay on test setup and stability and proposed methods of compensating for this delay using a polynomial extrapolation technique. Additional compensation techniques were developed by Carrion and Spencer (2007) based on developing Laplace-domain polynomial fraction representation of the actuator dynamics and then multiplying the commanded displacement signal by the reciprocal of this polynomial fraction prior to sending the command signal to the actuator. This latter technique was used for actuator compensation during this study.
This paper discusses the use of RTHS to analyze the effects of moat-wall impacts on a base-isolated structure. The numerical substructure examined was a two degree of freedom (DOF) base-isolated structure which was excited numerically based on time history accelerations of earthquake records. During testing, the numerical displacement of the base isolation layer was computed and the relative displacement between the isolation layer and the ground was calculated. This relative displacement constraint was imposed on the physical substructure consisting of a moat wall analog located in the Structures Laboratory at the University of Connecticut. Imposing the boundary constraint compatibility between the physical and numerical substructures was accomplished through the use of a hydraulic actuator. If the relative displacement of the base slab was large enough, the actuator piston would impact the physical substructure of the moat wall analog. The reaction forces between the actuator piston and the physical substructure were then sensed by a force sensor on the tip of the actuator piston and then fed back into the numerical model as an impact force acting on the base slab. A schematic of the RTHS test is shown in Figure 1.
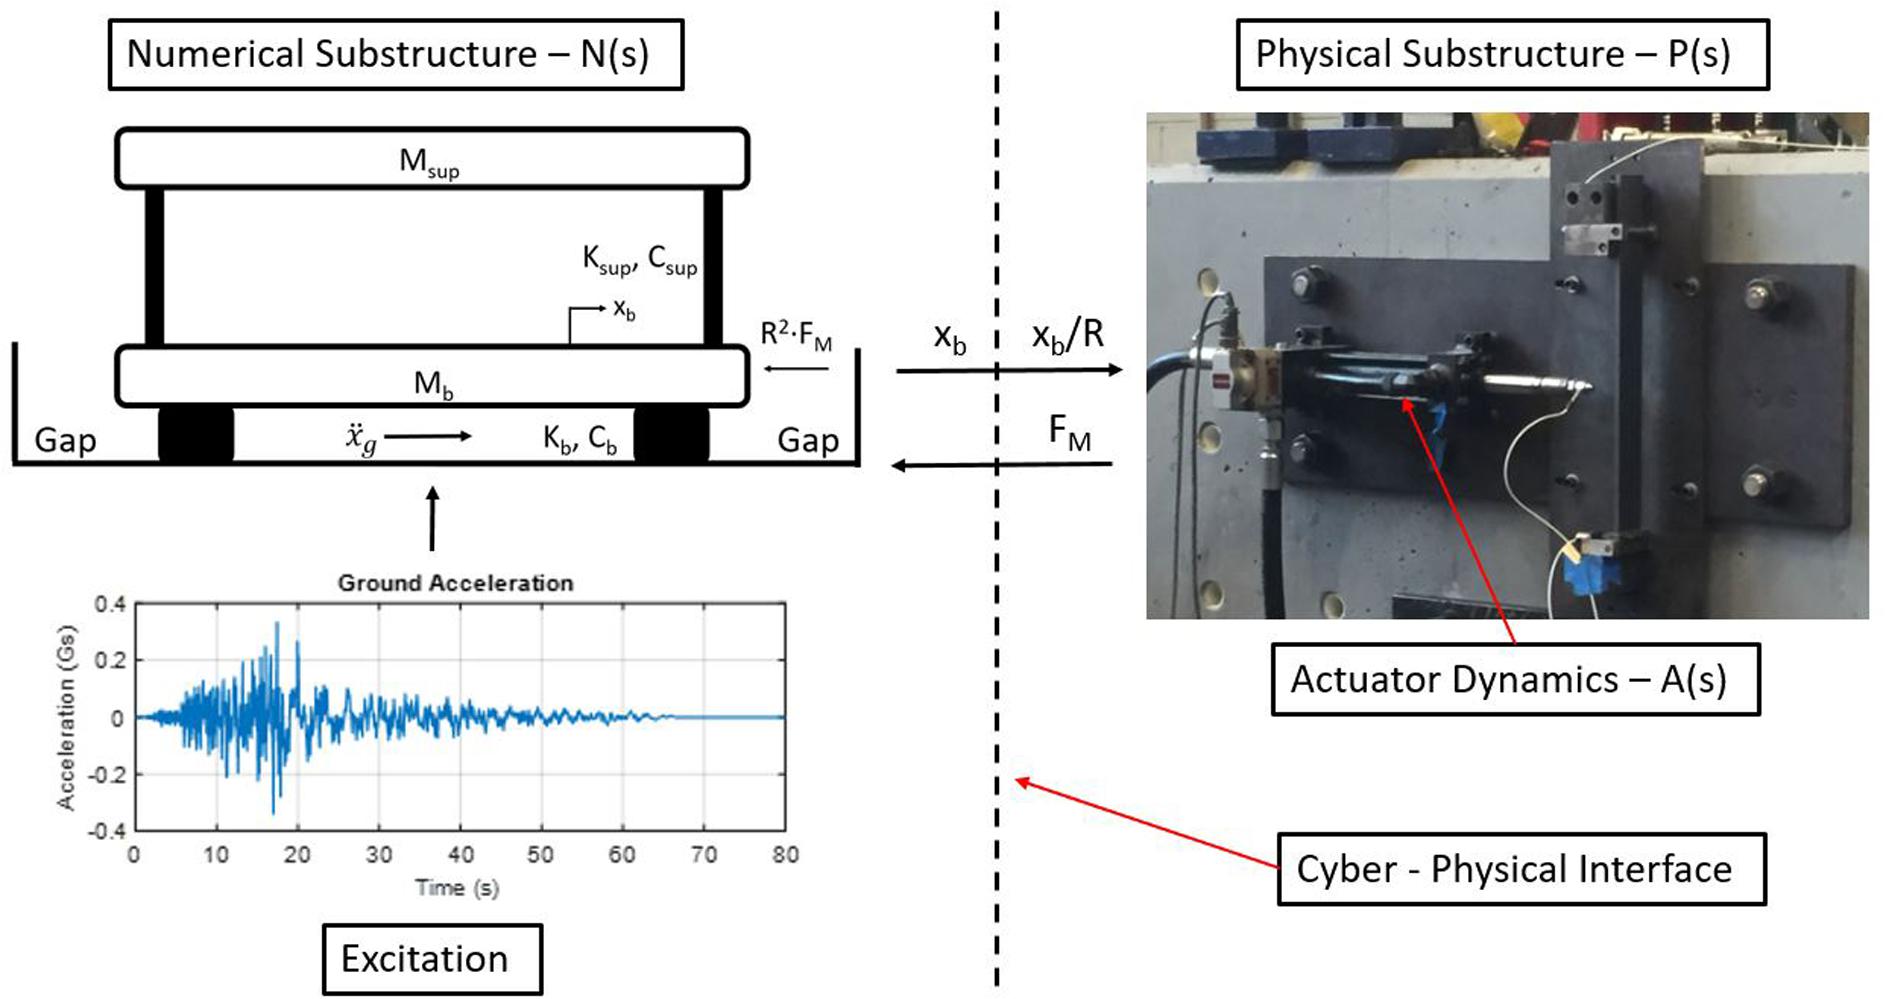
Figure 1. Schematic representation of a real-time hybrid substructure test.
The structure analyzed in this test was a scaled version of a 2DOF base-isolated structure designed to mimic the frequency-domain behavior of the first two modes of the three story structure base isolated structure used moat impact testing by Masroor and Mosqueda (2013). This structure was subdivided into a numerical substructure of the 2DOF base-isolated building and the physical substructure of the foundation wall. The 2DOF base isolated structure can be seen in Figure 1. In the Figure, Msup, represents the mass of the superstructure. The stiffness of the superstructure layer, Ksup, was tuned to match the fundamental period (0.67 s) of the superstructure tested by Masroor and Mosqueda. The mass and stiffness of the base isolation layer were tuned such that the fundamental frequency of the total structure matched that of the complete structure from the previous experiment (0.32 Hz). Structural damping was defined using Rayleigh damping with the damping ratios of the two modes set to 0.15 and 0.048 for the first and second modes and the mass ratio of the base slab to the mass of the superstructure was held constant at 0.56:1 which was consistent with the structure tested by Masroor and Mosqueda.
During both analytical studies as well as RTHS testing, a state space representation of the structure was used. The equation of motion describing the dynamics of the structure can be seen in Eq. 1 below.
where M, C, and K represent the mass, damping, and stiffness matrices respectively. The vector Gamma (Γ) represents the influence vector for the two DOFs of the structure with Γg being the influence vector based on the ground excitation which is equal to [1 1]T and Γm being the influence vector from the force of the moat impact which is equal to [1 0]T. Eq. 1 assumes a linear force-displacement (F-D) behavior of both the isolation bearings and superstructure. In regards to the linearity of the F-D behavior of the isolation layer, such viscoelastic behavior with damping ratios of 0.15 could be provided by devices such as High Damping Rubber Bearings (HDRB)s (Oh et al., 2016). By assuming the isolation bearings are linear in this initial study, the effect of the nonlinear behavior of the moat impact on the overall system response could be observed and analyzed. From, Eq. 1, the dynamics of the structure can be rewritten in state space form as the following:
where:
and:
The matrix Ass was the state matrix, Bss was the input matrix, Css was the output matrix, and Dss was the direct throughput matrix. These matrices are given as:
The output of the state space system y was a vector containing the calculated displacement of the base slab and superstructure as in Eq. 10. These output signals were used during the development of the figures within the section “Results and Discussion.”
The state space model of the structure was used to perform numerical simulations of structural dynamics in Simulink using a Runge-Kutta explicit numerical integration scheme with a fixed sampling time of 4,096–1 s. Within Simulink, the output signal y provided the signal of the analytically predicted displacement of the base isolation layer and superstructure. In addition, by twice differentiating the components of y, the predicted acceleration of the two stories was obtained.
The physical substructure meant to represent the moat wall was comprised of a simply supported beam made of low carbon steel (Right side of Figure 1). Steel was chosen to be consistent with studies performed by Masroor and Mosqueda (2013) during experimental analyses of moat impacts with a steel foundation. For this proof-of-concept RTHS test, the impacts of the base slab with one side of the foundation wall will be considered. The effects of single-sided pounding excitations of structures is a well-established field of study in structural dynamics (Wolf and Skrikerud, 1979; Pantelides and Ma, 1996). This type of pounding event tends to occur when a building has an adjacent structure on only one side or when the dynamic characteristics of a structure differ from adjacent structures on one side. Wolf and Skrikerud (1979) examined the time- and frequency-domain responses of dynamic systems where single-sided impacts were observed. They noted a strong amplitude-dependence on the overall dynamic behavior of the structure. They also examined the transient response of impacts between a nuclear reactor structure and an adjacent SDOF structure when subjected to an earthquake excitation. The studies showed the importance of considering pounding forces during the design phase of structures and promoting the beneficial effects of tuned mass damper systems for mitigating pounding damage. Pantelides and Ma (1996) examined the parameterization of single-sided impact events between SDOF systems and infinitely rigid constructs. They considered the effect that separation distance of structures has on the response. In addition, they examined the differences in dynamic response when considering elastic structures as opposed to elastic-perfectly plastic structures. They observed both a decrease in pounding as separation distance was increased as well as a decrease in the acceleration and pounding forces when considering inelasticity of the structure. They noted that this inelasticity may have benefited structural performance for structures in the past even when structural separation was inadequate.
The equipment required to conduct the RTHS test included sensors to measure the restoring force from the moat impact events, a real-time controller to calculate the response of the structure to the ground excitation and impact force, a hydraulic actuator system to enforce the calculated displacement of the base slab, and a data acquisition system used to collect response data of the test. These are elaborated upon below.
The reaction force of the moat wall was measured using a single axis PCB 208C04 piezoelectric force sensor with a maximum capacity of 4.45 kN (1000 lbs). The force sensor was accurate to within ±5% over the frequency range of 0.0003 to 36,000 Hz. A picture of the force sensor mounted to the actuator piston can be seen in Figure 2. The force sensor required an input electrical signal of 4 mA which was provided by a PCB 483C28 signal conditioner. A hemispherical attachment was mounted to the force sensor so as to improve the contact between the force sensor and beam during impacts. The mass of the attachment was small and the inertial effects on the force measurement were neglected. In addition, while both comprised of metal, the stiffness of the attachment was very large in comparison to the stiffness of the moat wall substructure. In the context of the RTHS test, this meant that the base slab was very stiff relative to the moat wall.
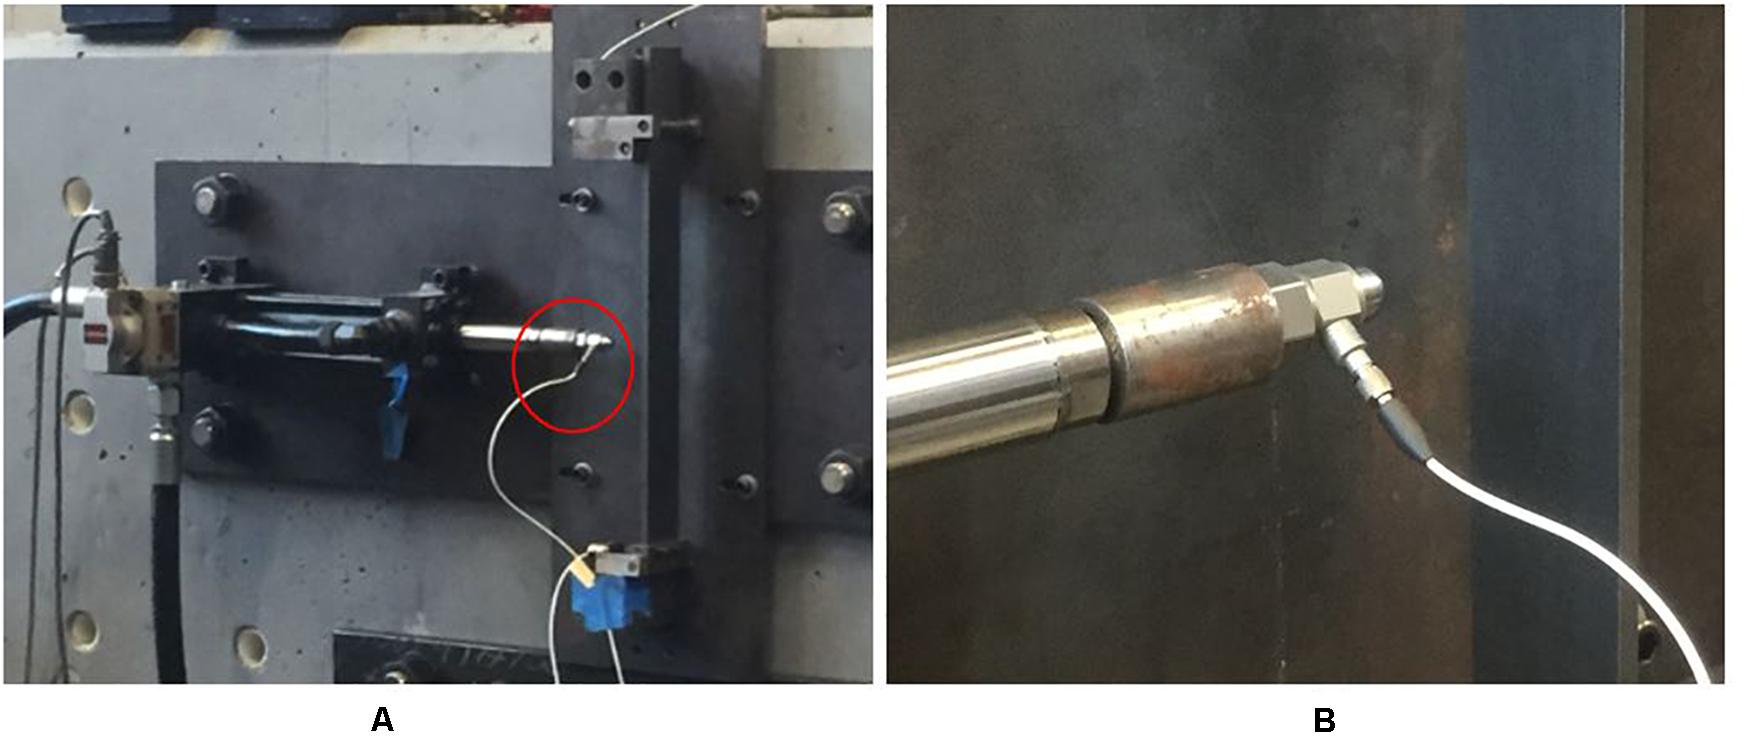
Figure 2. (A) The hydraulic actuator with the force sensor circled and (B) a close-up view of the force sensor mounted on the actuator piston.
A dSPACE 1103 real-time controller was used to conduct the RTHS testing. During testing, the controller was used to calculate the response of the 2DOF structure to the inertial force due to the ground excitation and restoring force of the moat impact. The displacement of the structure was calculated at each time step using a state space representation. Once calculated, the displacement of the base slab was then scaled to fit within the stroke limits of the actuator, compensated, and sent to the actuator. The dSPACE controller was running Simulink at a time step of 0.244 ms (4,096 Hz) using a Runge-Kutta explicit integration scheme. The dSPACE controller has 16 multiplexed analog inputs, each with a 16 bit resolution A/D converter as well as 8 analog outputs with 16 bit D/A converters and is capable of interfacing with MATLAB and Simulink. Of the available D/A converters, a total of four were used during testing. The analog signals produced corresponded to the ground acceleration, calculated base slab displacement, calculated superstructure displacement, and the absolute acceleration of the base slab respectively. There were two A/D converters used to collect the measured actuator displacement and the measured restoring force from the moat impacts.
The hydraulic actuator used was a Quincy Ortman servo-hydraulic actuator designed for dynamic testing applications. The actuator had a maximum capacity of 8.896 kN (2,000 lbs) with a maximum one-sided stroke limit of 8.5 cm (3.3 in). The frequency bandwidth of actuation for the actuator was 0–40 Hz. The hydraulic actuator was controlled with a Parker Hannifin Corporation analog controller. A Micropulse LVDT internal to the hydraulic actuator provided an analog output signal (±10 V) corresponding to the measured position of the cylinder. This measured displacement was assumed to correspond to the displacement of the base slab within the physical scale of the laboratory.
During testing, data collected included the ground acceleration input to the building, the displacement time histories of the base slab and superstructure, the measured displacement time history of the actuator, and the restoring force time history signal from the force sensor. The signals were collected with a DataPhysics SignalCalc Mobilyzer Dynamic Signal Analyzer with 32 input channels. This data acquisition unit allowed for adjustable sampling rates for data collection as well as providing anti-aliasing filters that are integrated into the A/D input channels. As the duration of a full time history sample was inversely related to the sample frequency, longer time histories (64.00 s duration) at sampling rates of 2,048 Hz were collected of the structural response over the full duration of the ground motion excitations and shorter time histories (10.67 s duration) at sampling rates of 12,288 Hz were collected to analyze the force profile during impact events.
The effects of moat impacts on a base-isolated structure during earthquake excitation were tested using the RTHS technique. In order to perform the tests, a total of 3 ground motions were selected from the suite of 50 ground motions put forth in the FEMA P695 document “Quantification of Building Seismic Performance Factors” (Federal Emergency Management Agency [FEMA], 2009). Of the three ground motions selected for testing, one ground motion represented a near-field pulse-like motion, one ground motion represented a near-field non-pulse-like motion, and one ground motion represented a far-field motion. The ground motions selected from each category were those predicted by numerical simulations to cause the largest absolute acceleration in the base-isolation layer during moat wall impacts. The specific ground motions selected have been identified in Table 1 and the time histories and frequency content of these ground motions have been plotted in Figure 3.

Table 1. Identifying information for ground motions used in testing.
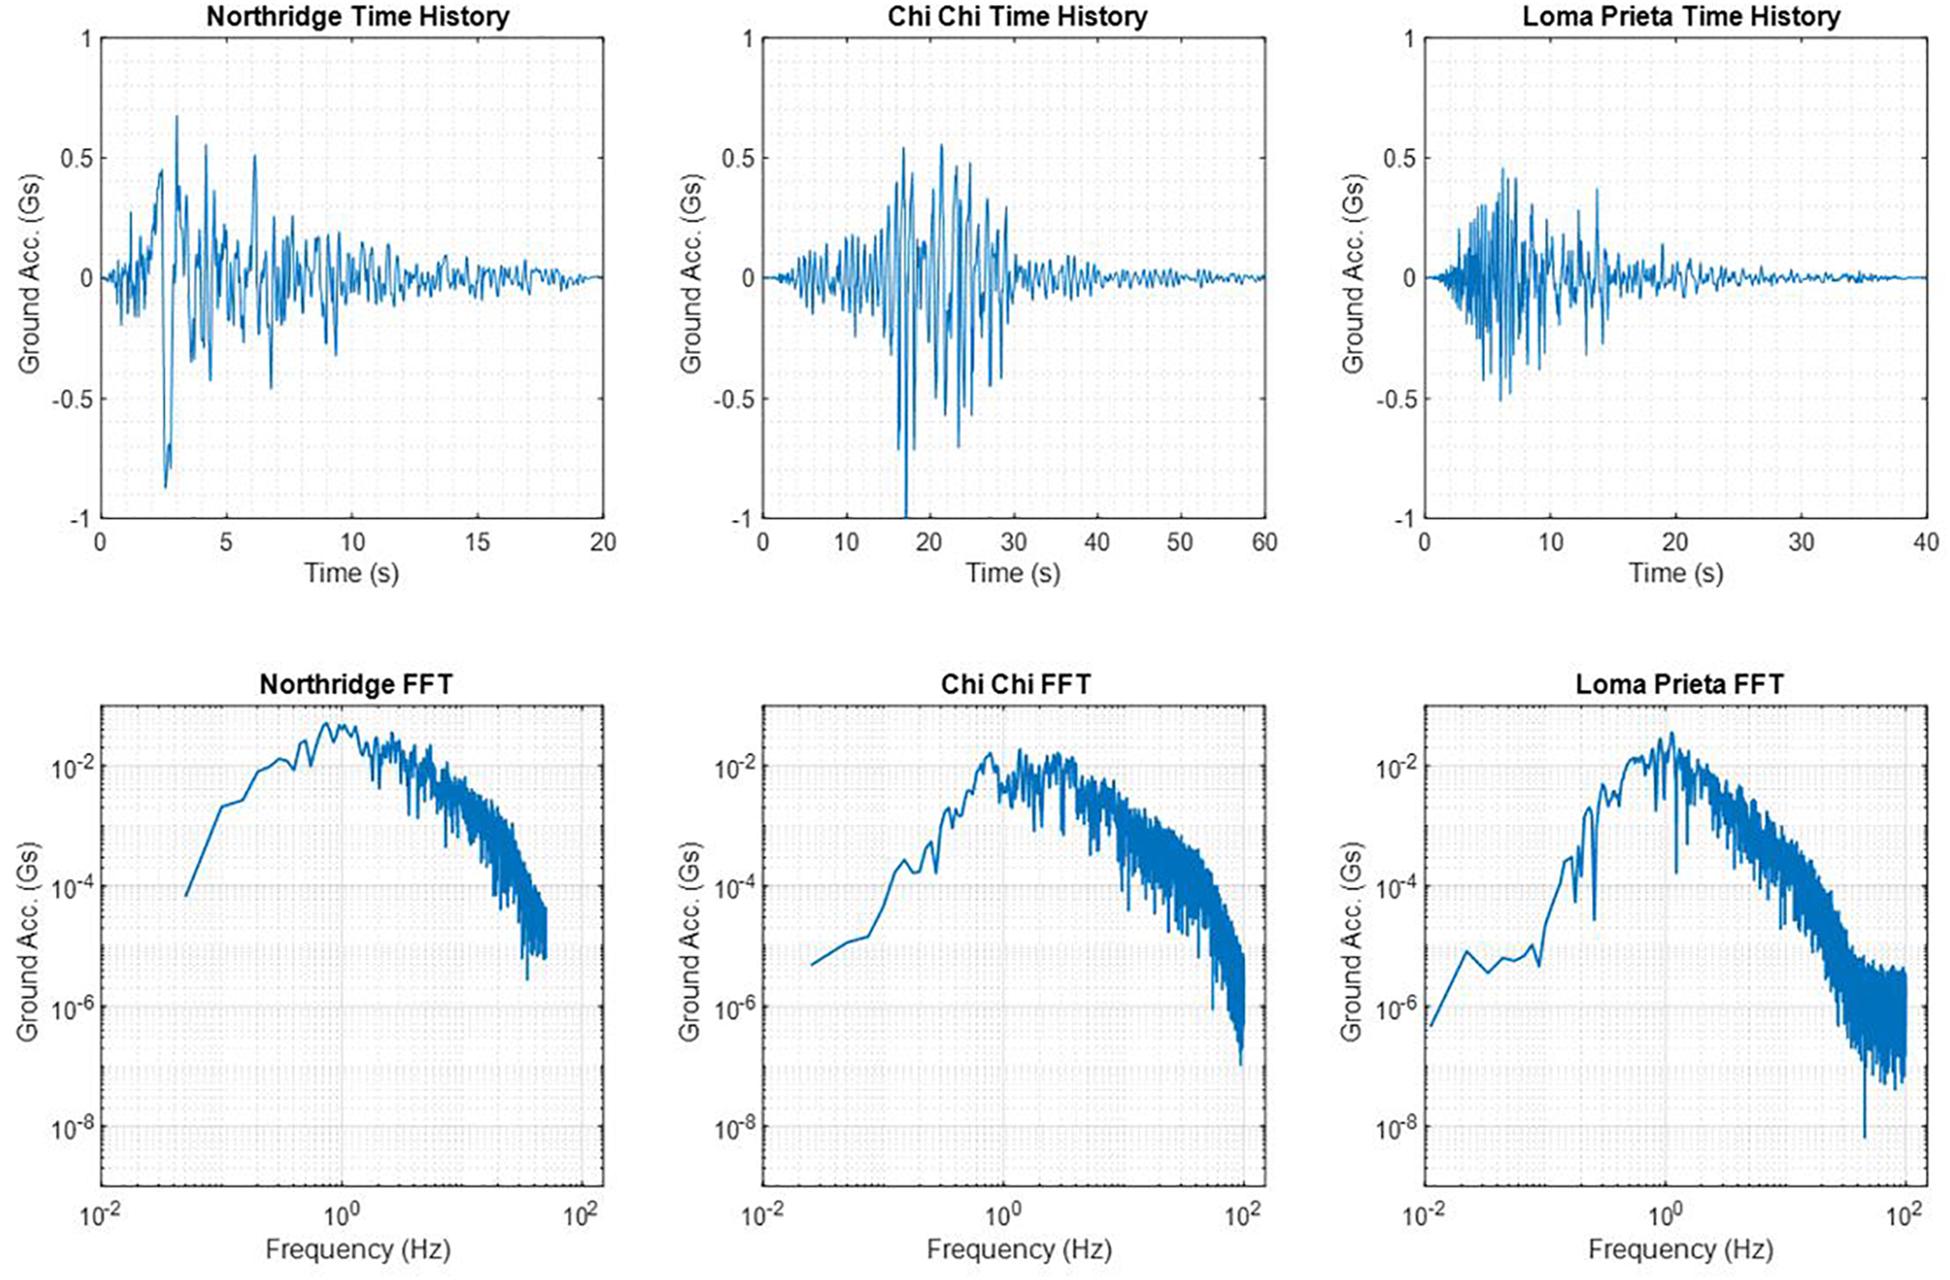
Figure 3. Time histories and frequency content of the ground motions used for testing.
The numerical substructure of the base-isolated structure was designed to exhibit the same response frequencies as the first two modes of the structure analyzed by Masroor and Mosqueda (2013) during laboratory testing of moat impacts of base isolated structures. The resonant frequencies of the structural modes of the numerical substructure were 0.32 and 1.5 Hz. The mass ratio of the base slab to that of the total mass of the superstructure is 0.56:1. These frequencies and mass ratios are consistent with the structure tested by Masroor and Mosqueda. Based on the size limitations imposed by the test setup however, the total mass of the structure needed to be scaled down. A discussion of the scaling of the mass of structure has been provided in following sections.
The physical substructure used in this work was a simply supported steel beam which would act as the moat wall during RTHS testing. A steel beam was used as the physical substructure during testing in order to facilitate comparisons of RTHS test results with steel moat wall impact results obtained by Masroor and Mosqueda (2013). This comparison of impact force time histories was used to ensure that the RTHS test was accurately capturing impact forces between the structure and moat wall. The steel beams used for the RTHS tests presented here were made of low carbon steel meeting the ASTM A 108 Standard. The dimensions and support conditions of the steel beams were constrained by the specifications of the PCB 208C04 force sensor which had a maximum load capacity of 4.45 kN (1,000 lbs). The steel beam had a span length of 38.74 cm (15.25 in), a width of 5.08 cm (2 in) and thickness of 0.64 cm (0.25 in). A simply supported steel beam with the dimensions listed was predicted to provide the ability to test material nonlinearities within the physical substructure while providing a margin of safety to not exceed the capacity of the force sensor.
The physical substructure in the RTHS test was a steel beam used to represent a moat wall on one side of a base isolated structure. During testing, the restoring force provided by this steel beam represented the restoring force of a moat impact event. The force-displacement behavior of the beam when subjected to a point load at midspan can be seen in Figure 4. From the initial slope of the force-deflection behavior within the elastic region of the curve, the stiffness of the beam was calculated experimentally as 1.787 kN/cm. This result can be compared to calculations using Timoshenko beam theory for a pinned-pinned beam (Roylance, 2000). The stiffness of the beam was calculated to be 1.790 kN/cm when assuming pure bending conditions and 1.784 kN/cm including the effects of shear deformation. As the two results differ by 0.34%, it was assumed that pure bending is the predominant mode of deformation within the steel beam. It was also noted that this analytical stiffness prediction based on pure bending differs by 0.17% from the experimentally obtained beam stiffness. Using this pure bending assumption, the strain at the point furthest from the neutral axis can be obtained from Eq. 11 (Beer et al., 2006):
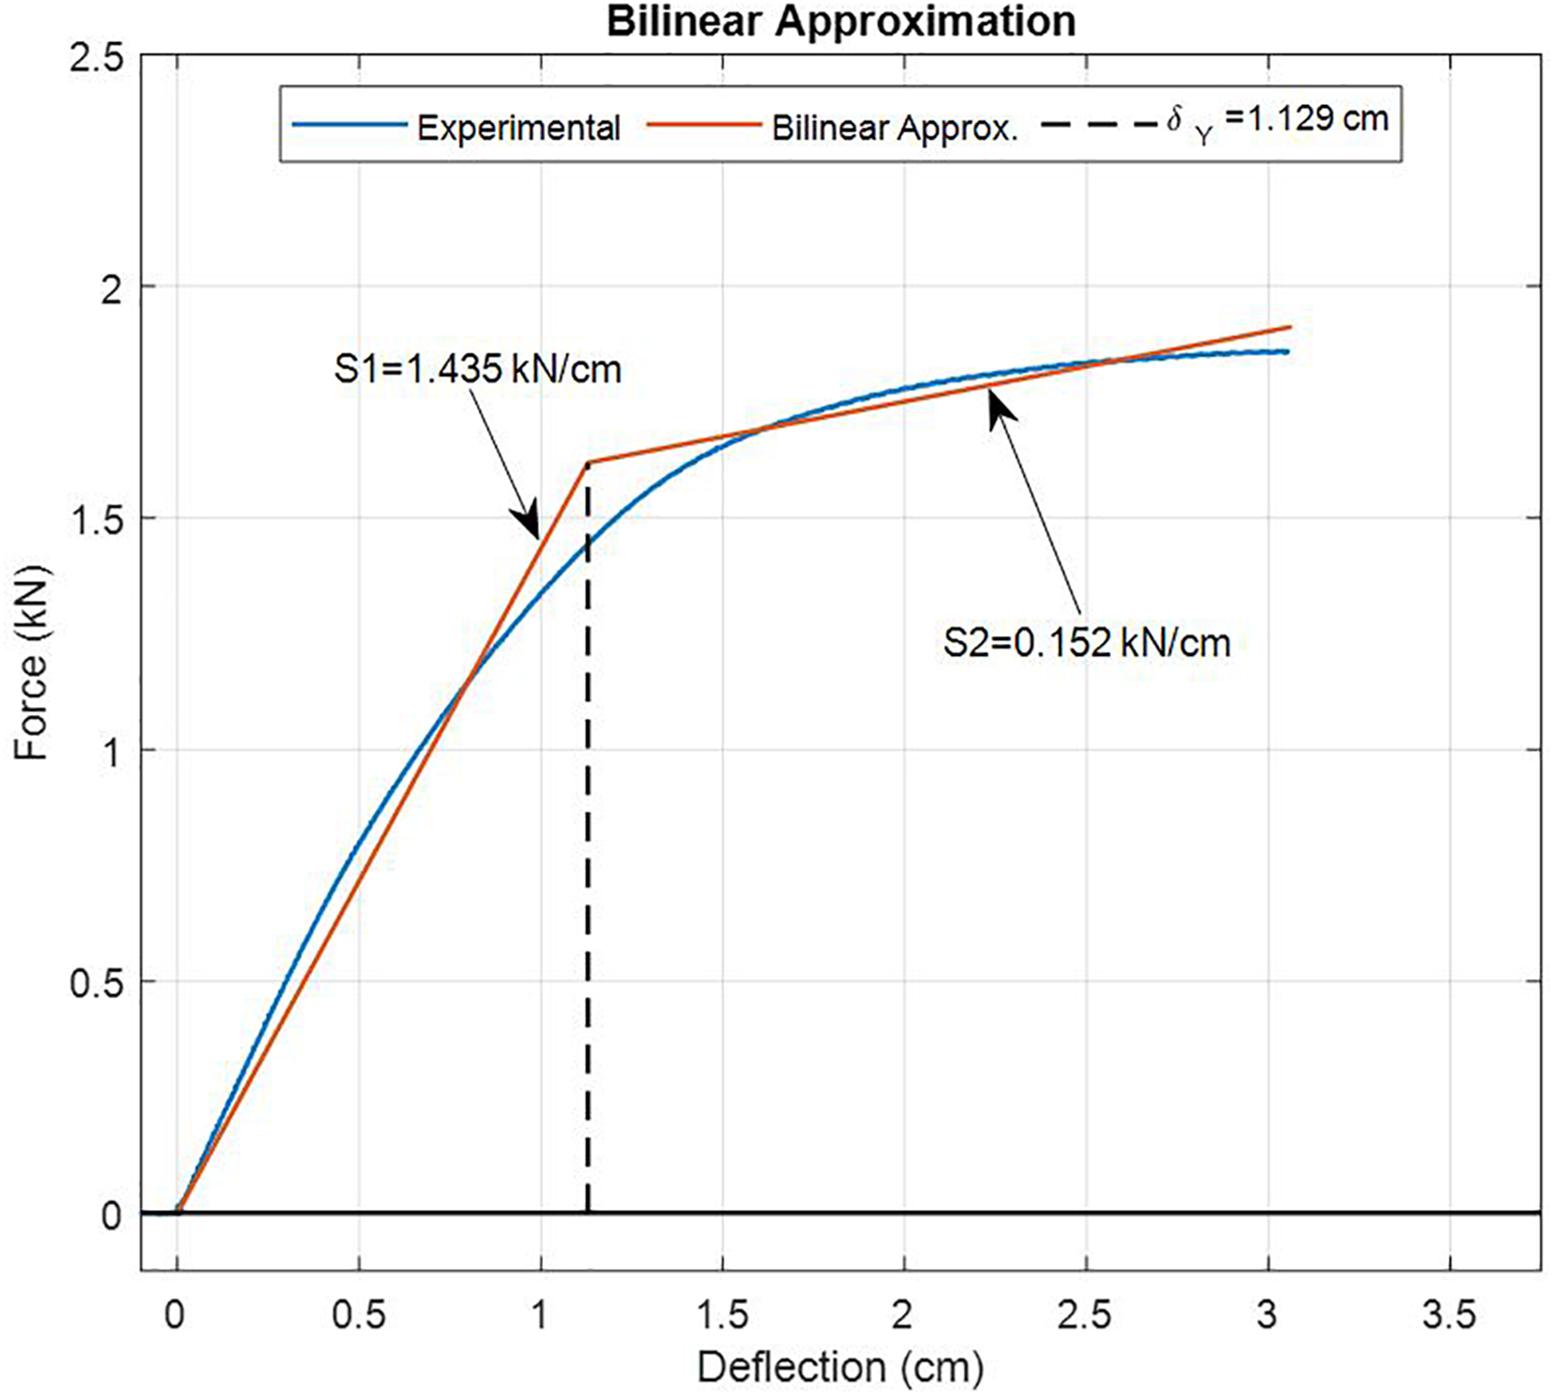
Figure 4. Force-deflection behavior for steel beam substructure.
In Eq. 11, c is the thickness of the beam (0.64 cm), and ρ is the radius of curvature for a given strain ε. The radius of curvature can be calculated from the geometry of the experimental setup as given by Eq. 12 (Weisstein, 2015).
Where l is the span length of the beam (38.74 cm) and δ is the deflection of the beam at midspan. Eqs. 11 and 12 to calculate the strain allowed for the analysis of how the deformation strain rate affected the stiffness of the physical substructure.
For purposes of numerical simulations, a bilinear representation of this force-displacement curve was constructed. This approximation can also be seen in Figure 4. Based on the bilinear approximation of the force-deflection curve, the deflection at the onset of yielding was approximately 1.13 cm (0.5 in); a result which was difficult to verify with calculations due to the complexity of plastic hinge formation. Similar to the work of Masroor and Mosqueda (2013), the bilinear approximation of the F-D behavior was used to develop an impact model for restoring forces acting on the base-isolated structure in response to ground motions. There were two types of impact scenarios examined. In the first scenario termed a “linear” impact scenario, the deflection of the beam substructure would stay within the deflection region of 0 < δ < 1.129 cm. The second type of impact scenario termed a “nonlinear” impact scenario, was a scenario designed to deflect the beam substructure so as to induce yielding, permanent deformation, and dissipate energy during the impact event. During this scenario, the value of δ would exceed the 1.129 cm calculated to be the yielding point of the bilinear approximation. The creation of linear or nonlinear impact scenario conditions was achieved by scaling the total mass of the structure. As the mass of the structure decreases, the total momentum of the structure is reduced, and the impact tends to cause smaller deflections in the moat wall. The mass ratio between the isolation layer and superstructure remained constant when scaling the total mass of the structure. In addition, the frequency response function of the structure was held constant when scaling the total mass of the structure. The procedure for scaling the mass of the total structure is further discussed later within the section “Mass Calibration for Linear and Nonlinear Deflection Testing.”
While in reality moat impacts are characterized by axial and shear forces as well as torques, this work studied a simplified version of an impact event where impacts were assumed to generate forces along the single line of action of the actuator piston. This force was the restoring force due to imparting bending within the physical substructure. The single line of action simplification has been used extensively the alleviate some of the computation expense of calculating impact forces. A summary of several of these impact models is provided in Muthukumar and DesRoches (2006). In reality, the impacts during RTHS testing undoubtedly contained shear forces and torques acting at the point of impact. However, the use of a single axis PCB 208C04 piezoelectric force sensor allowed for capturing of the restoring forces along the single line of action for feedback into the numerical substructure. In this manner, the physical substructure was treated as a spring acting in a single DOF, similar to the impact model used by Liu et al. (2017, 2014). Unlike the models used by Liu et al. however, use of a physical substructure and RTHS testing allowed for the incorporation of uncertainties in the impact behavior such as friction forces at supports and at the contact point as well as the dynamic characteristics of the moat wall during impact. It is noted, however, that future studies may look to expand the RTHS testing technique to examine more degrees of freedom during impact events through the use of 6DOF shake tables along with multiple 3DOF sensors at the impact interface.
The physical scale of the laboratory equipment used for this work necessitated scaling of either the ground motions used for testing, or the displacements and forces observed during testing. Procedures for scaling ground motions for time history analysis have been well-studied and documented both in research as well as in codes (American Society of Civil Engineers [ASCE], 2010; Wood and Hutchinson, 2012). Typically, scaling of ground motions has been performed during design or analysis of a structure so as to produce a suite of ground motions that match the expected spectral acceleration response at a building site if such ground motions are not available. The validity of the practice of scaling ground motions, while extensively researched, is still largely debated. Studies investigating the effects of scaling on nonlinear time history analyses of SDOF and MDOF systems have shown no appreciable difference in nonlinear deformations when careful scaling of ground motions is performed (Shome et al., 1998; Iervolino and Cornell, 2005) and FEMA has proposed that ground motions should be scaled by normalizing the peak ground velocity (Federal Emergency Management Agency [FEMA], 2009). At the same time, studies have arrived at different conclusions; stating that the scaling of ground motion suites may produce changes in the nonlinear displacement of a structure when compared to selection of an appropriate suite of ground motions that approximate the desired response spectra (Luco and Bazzurro, 2007). During this work, the decision was made to perform the numerical simulations of the structural response to ground motions using the full scale of the ground motion acceleration and not to adjust the ground motion such that the calculated displacement of the base slab would be within the limits of the stroke limits of the hydraulic actuator. Rather, the calculated displacement of the base slab due to the full ground motion was then scaled to accommodate the stroke limit of the actuator and the restoring force of the moat wall impact was adjusted so as to match the scale of the numerical simulation. This scaling procedure was similar to “Procedure 2” as described by Kumar et al. (1997). The decision to scale displacements and forces rather than ground acceleration was made for several reasons. First, as the main focus of this work sought to illustrate the ability of the RTHS technique to analyze the impact forces that occur during ground excitations, the question of accurate scaling of ground motions was beyond the intended scope of this paper. In addition, ensuring the compatibility and proper enforcement of boundary conditions is of paramount importance during RTHS testing. This work endeavored to illustrate the care that must be taken in order to ensure proper scaling was implemented. Scaling of the forces and displacements required the assumption that all impact forces scaled similarly including the restoring forces due to beam deflection, the contact forces, and any forces stemming from vibrations of the beam.
Due to limitations with the scale of the experiment, it was necessary to scale down the calculated displacement of the base slab as obtained from simulations in order to accommodate the stroke capacity of the hydraulic actuator used for the RTHS test. In simulating the structural response to the ground motions, it was observed that the displacement of the base slab regularly exceeded 0.25 m. The maximum one-sided stroke of the actuator, meanwhile, was only 8.5 cm. It was therefore necessary to scale down the structural response to such an extent that the displacement of the base slab could be accomplished by the actuator. However, scaling down the displacement commanded of the actuator had the effect of altering the apparent kinetic energy of the base slab as it moves in response to the ground motion and impacted the moat wall. Consequently, as the restoring force of a moat impact event was fed back into the simulation, the energy that is absorbed and dissipated by the moat wall must be scaled back up properly such that the kinetic energy losses of the base slab were of the correct magnitude within the simulation. The procedure used for developing the scale factors as well as for converting between simulated and actuator displacements have been outlined in the paragraphs to follow.
The scale of the experiment necessitated a careful analysis to be sure that the change in kinetic energy of the structure within the simulation was equal to the energy absorbed and dissipated by the steel beam during the impact event. In the case of a beam deflecting within the linear regime, the stored potential energy within the beam can be calculated from Eq. 13.
Within Eq. 13, K is the stiffness of the beam and δ is the deflection of the beam. The size of the beam substructure as well as the stroke limit of the hydraulic actuator were substantially smaller than a full-scale test of the moat impact and therefore, it was necessary that the calculated displacement of the base slab be scaled so as to accommodate the stroke limit of the actuator. For testing, a scale factor R was defined as:
where was the maximum desired actuator displacement and was the maximum displacement of the base slab as calculated during time history simulations where moat wall impacts were not considered. The analytically obtained maximum displacement of the structure where moat impacts were ignored provided the maximum uncontrolled displacement to be expected from a particular ground motion. Generating a scale factor from this uncontrolled displacement would provide assurance that the actuator would stay within its desired stroke limits. The maximum desired actuator displacement was set to 7.303 cm (2.875 in) based on the maximum one-sided stroke limit of the actuator 8.382 cm (3.3 in). The maximum simulated displacement and scale factor R was determined for each earthquake analyzed. This scale factor was the reduction factor required to stay within the desired stroke limits of the actuator in the case of an uncontrolled test if no moat wall were present. At the same time, the kinetic energy of the isolation layer was given by Eq. 15.
In Eq. 15, vslab represented the velocity of the base slab at the instant of impact with the beam. Eq. 15 implies that when scaling the displacement by the scale factor R the kinetic energy of the base slab scales by R2. When scaling the restoring force back into the scale of the numerical simulation, care must be taken such that the restoring force of the beam substructure would be consistent with the scale of the simulation. Knowing that the relationship between the simulation space and laboratory space was given by Eq. 16,
and knowing that the potential energy of the beam during impact was proportional to the square of the beam deflection as shown by Eq. 11, the restoring force of the beam must be multiplied by R2 when transitioning from the actuator to the simulation scale in order for it to be consistent with the scale of the numerical simulation. This has been further derived in Eqs 17 and 18.
A numerical simulation was constructed using MATLAB/Simulink to analyze the response of the base-isolated structure to the three earthquake records selected from those outlined in FEMA P695 (Federal Emergency Management Agency [FEMA], 2009) and to calibrate the mass of the base slab such that the impact with the moat impacts would induce either linear or nonlinear deflection within the beam. Initially, the response of the structure was simulated neglecting the effect of moat wall impacts in order to determine the maximum displacement and subsequently define the scale factor R for each individual record. During the next round of simulations, moat wall impacts were simulated based on the bilinear approximation of the F-D behavior of the physical substructure. A description of the F-D behavior as implemented in the numerical simulation can be seen in Eq. 19 where Fm represented the restoring force from the moat wall impact.
Within the Simulink model two dead zone blocks were included to simulate bilinear approximation of the moat wall F-D behavior as described above. The dead zone blocks returned a zero value if the displacement of the base slab was within a certain “dead” range defined as the gap distance. Beyond the dead range, the dead zone blocks returned the magnitude by which the displacement of the base slab had exceeded the limits of the dead range. In this manner, scaling the output of a single dead zone block by 1.4345 kN/cm were able to simulate linear elastic impacts similar to the impact model used by Liu et al. (2014, 2017). At the same time, summation of two dead zone blocks were used to simulate the bilinear approximation of the stiffness behavior if the second block as a gap corresponding to the displacement where the approximation takes on the less stiff slope within the bilinear approximation of the restoring force of the moat wall.
Within the simulation, the moat impact events were simulated as if they were occurring within the lab. The structure was excited with a ground acceleration and the calculated isolation layer displacement was divided by R and sent through the dead zone blocks in order to simulate the actuator impacts with the steel beam substructure. The output from the dead zone blocks was then multiplied by R2, and fed back into the simulation as negative feedback that was summed with the inertial force acting on the isolation layer due to the ground motion excitation. The moat wall gap distance was set to 3.784 cm (1.875 in) in the (+) displacement direction to match the experimental settings of the laboratory. The gap distance was set to a sufficiently large value in the (−) displacement direction such that the impacts would only occur in the (+) displacement direction. This simulated the experimental setup where only one-sided impacts would be considered and the actuator could extend 3.784 cm prior to impacting the steel beam.
Using the described simulation architecture above, the mass of the structure within the simulation was then scaled and the impact behavior analyzed using the bilinear approximation of the force-deflection behavior of the beam. In order to induce linear deflections in the beam, the mass of the structure was calibrated such that the maximum simulated deflection of the beam substructure was 0.635 cm (0.25 in). The maximum deflection during nonlinear impacts was 2.477 cm (0.975 in). The calibration of the mass for the linear and nonlinear impacts was performed by recursively increasing or decreasing the mass of the structure such that the maximum simulated deflection of the beam substructure lies within 1% of the desired beam deflection. Limitations of this simulation technique included the assumption that the impact was perfectly elastic, with no energy loss from the system during impacts. During analytical simulations, the only energy dissipation within the system was due to damping within the structure itself. This was not entirely accurate when compared to the experimental setup. The energy dissipation by the friction of the bearings at the supports, as well as contact friction between the base slab and moat wall were neglected. In addition, energy converted to noise and vibrations within the beam was not considered.
The hydraulic actuators utilized during RTHS testing exhibit inherent dynamics that could potentially affect the accuracy and stability of an RTHS test. These dynamics are observed in Figure 5 as magnitude attenuations and phase lags between the commanded and measured displacement of the actuator. A phase lag in an RTHS test behaves as an apparent time delay which effectively results in negative damping within the feedback loop of the test setup (Horiuchi et al., 1996). Apparent time delays caused by actuator dynamics have the potential to destabilize the test setup, and thus, actuator compensation is utilized to help ensure test stability.
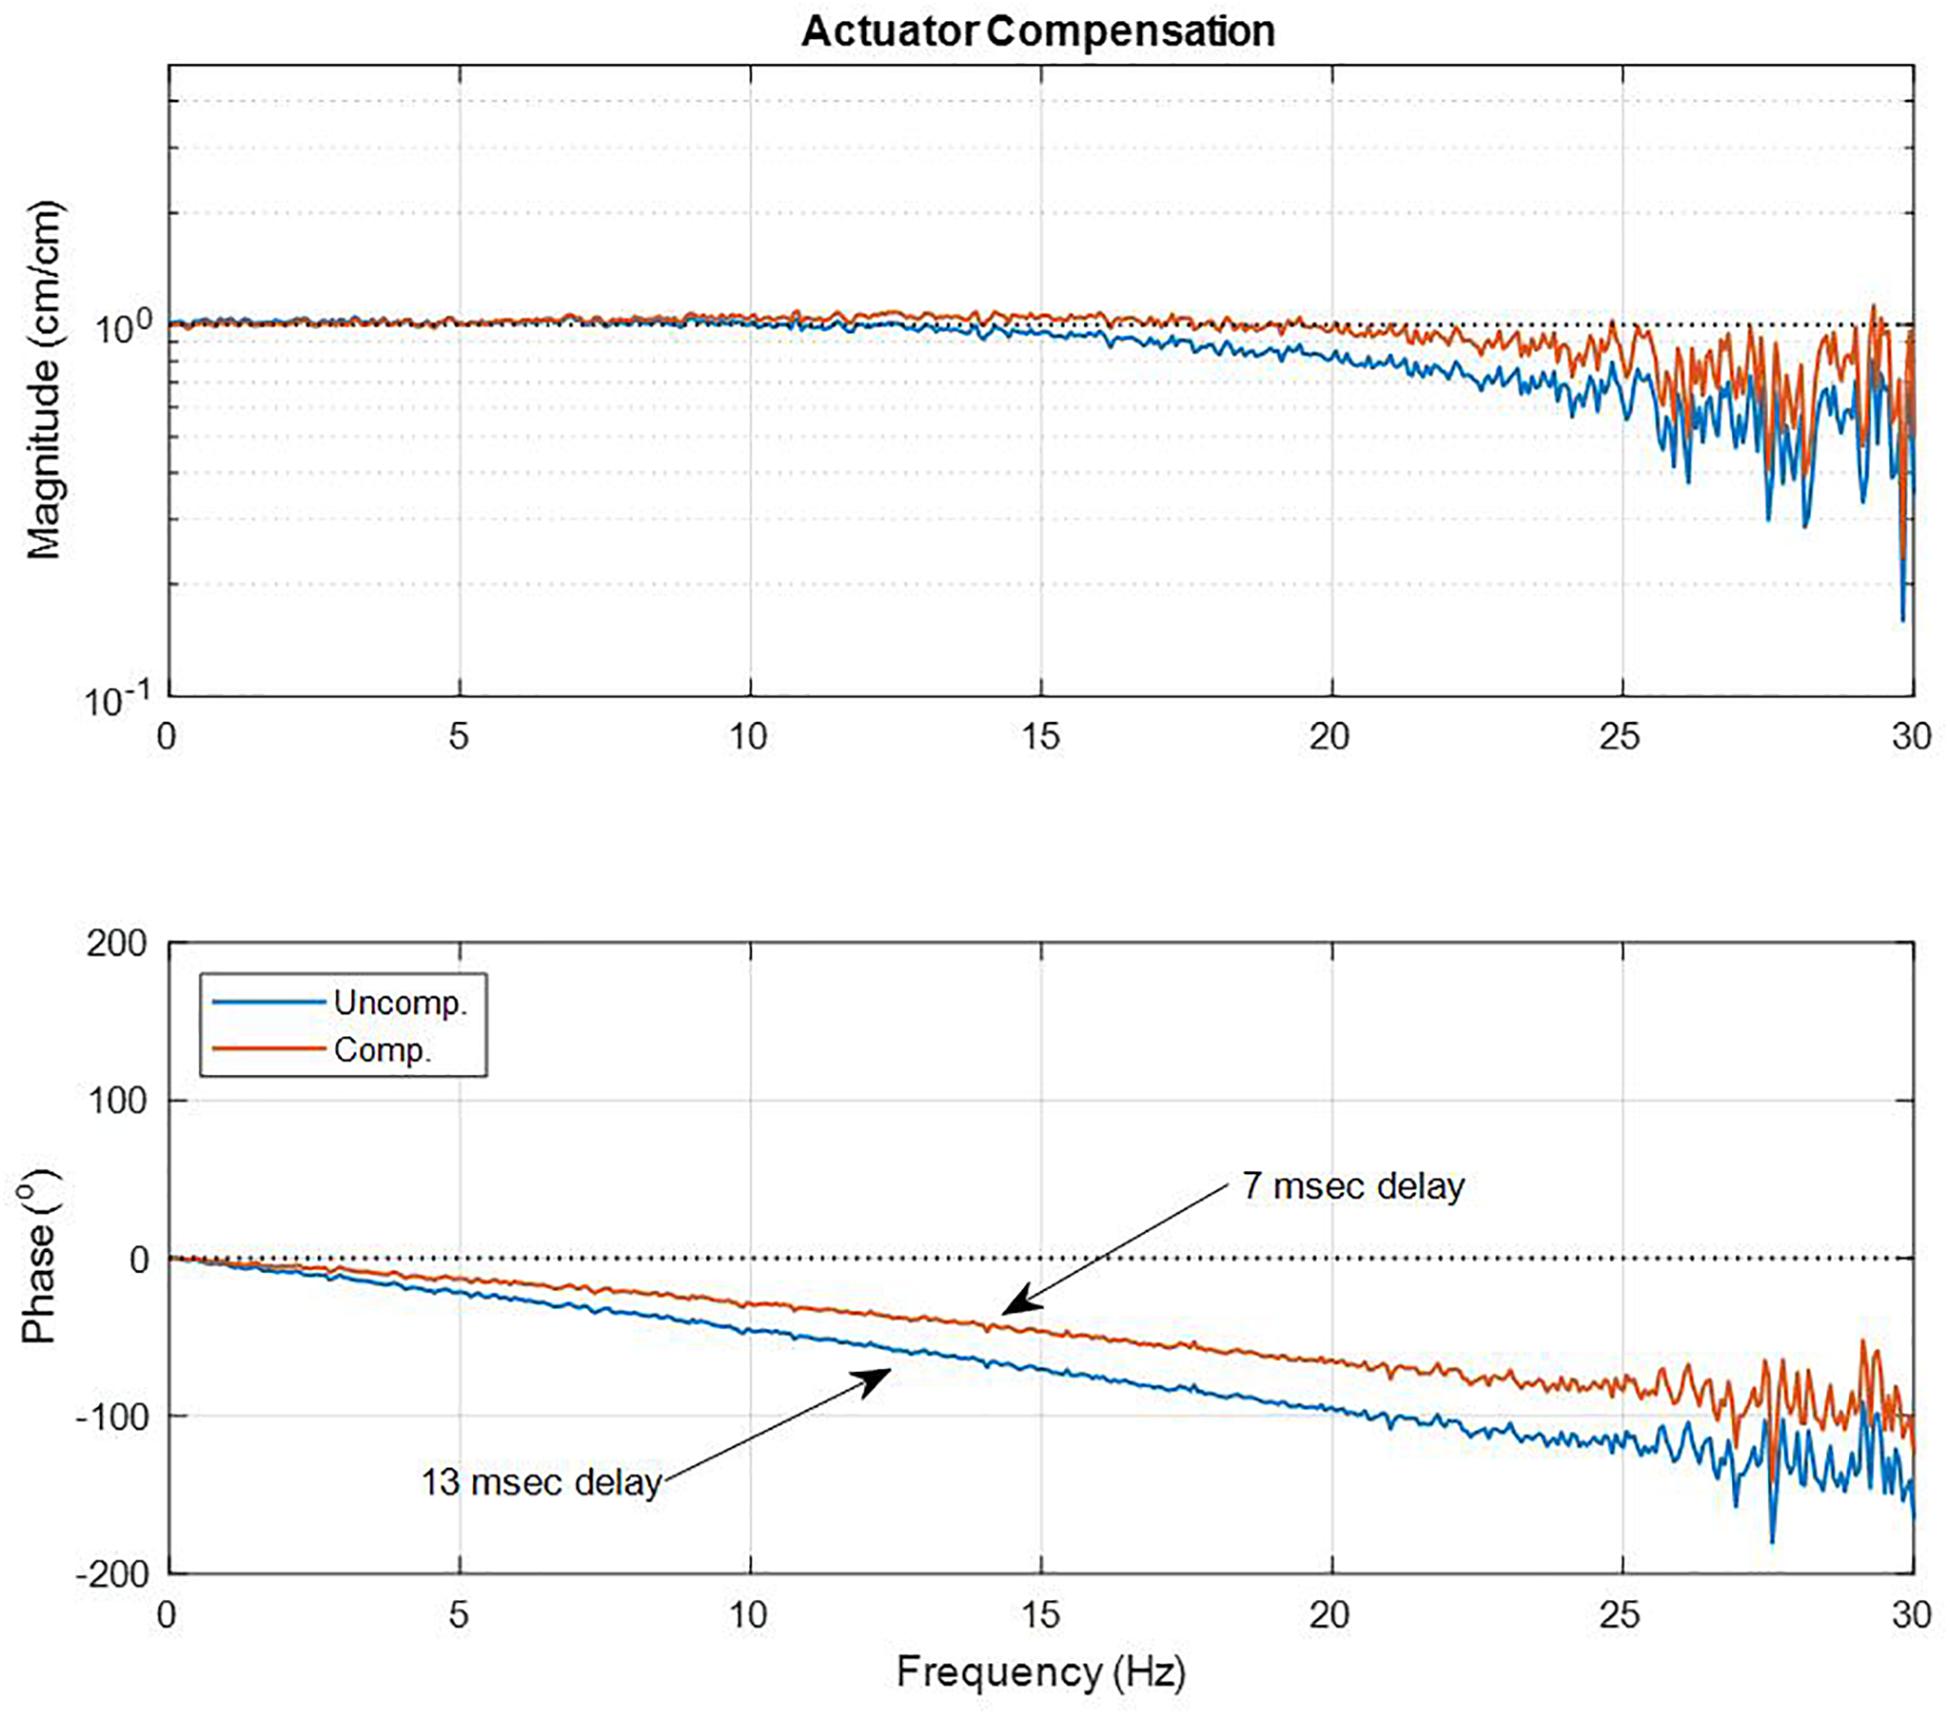
Figure 5. Comparison of uncompensated vs compensated actuator dynamics.
The experimentally obtained commanded-to-measured displacement transfer function of the actuator was obtained by sending a band-limited displacement commanded displacement signal to the actuator and the collecting the measured displacement from the analog output of the actuator. From these commanded and measured displacement signals, the transfer function of the actuator was calculated. This process of obtaining the transfer function was performed before and after applying a model-based compensator to determine the impact of compensation on the system.
Several compensation techniques exist ranging from prediction of commanded displacement via polynomial extrapolation (Horiuchi et al., 1996, 1999) to feed-forward model-based compensation (Carrion and Spencer, 2007). Feed-forward model-based compensation was used for this study. The compensation procedure involved characterizing the transfer function A(s) of the commanded to measured displacement of the actuator using Laplace-domain polynomial fractions. Development of a compensator for an RTHS test should be tailored to the system being analyzed, but the compensator must satisfy a number of qualities to avoid inaccuracies or instabilities within the RTHS test setup. To develop a compensator, a curve fit representation of the actuator dynamics A(s) must be obtained by fitting a Laplace-domain polynomial fraction to the experimentally obtained transfer function of commanded to measured displacement of the actuator. By taking the reciprocal of this fraction, the actuator compensator H(s) was obtained. Hydraulic actuators typically exhibit a transfer function from commanded to measured displacement that resembles a low-pass filter. However, the reciprocal of the polynomial fraction that represents a low-pass filter approaches an infinite magnitude at high frequencies and will introduce high frequency noise to the commanded actuator displacement signal and potentially destabilize the RTHS test. In order to ensure that the magnitude of the compensator is small enough at high frequencies, the curve fit of the actuator transfer function must include a sufficient number of zeros at higher frequencies such that the magnitude of the compensator does not tend toward infinity at higher frequencies. Once a compensator has been obtained for the system being analyzed, the commanded displacement signal is multiplied by the compensator prior to sending it to the actuator in order to partially alleviate the effects of the actuator dynamics. The actuator compensator H(s) listed in Eq. 20 was constructed to minimize the phase lag of the commanded to measured displacement of the actuator over the bandwidth of 0–3 Hz. The feedforward compensation was implemented using the dSPACE real-time controller as an outer control loop on the Parker Analog Controller.
A plot of the commanded to measured displacement transfer functions for the uncompensated and compensated actuator behavior has been provided in Figure 5; illustrating the improvement in both the magnitude and phase of the actuator transfer function. As a result of the compensation technique, the dynamics of the actuator were improved such that the apparent time delay was reduced from 13 to 7 ms over the bandwidth of 0–3 Hz where the majority of the structural dynamics exist.
The compensation process was performed on the actuator alone, while not engaged with the moat wall substructure. This decision was made as the actuator was meant to represent the interface between the base slab and the moat wall. During a majority of the structural response, the actuator was be engaged with the moat wall substructure, as was also the case just prior to and just after impact events. Therefore, tailoring the actuator compensation to the response bandwidth of the structure was deemed to be the best strategy. It should be noted that during impacts, the dynamics of the actuator were altered. However, within this work, the physical substructure was relatively flexible and not expected to have altered the actuator dynamics substantially. If larger scale RTHS tests were to be conducted, or if a stiffer physical substructure were used, the effects of dynamic coupling between the actuator and physical substructure should potentially be taken into consideration. This dynamic coupling between the actuator and physical substructure can lead to detrimental effects on actuator performance by a process known as control-structure interaction (Dyke et al., 1995).
In order to validate the experimental setup, the time history of the RTHS moat wall impact was collected and compared to force profiles observed during the Masroor and Mosqueda (2013) shake table tests. During the collection of the force profile time history, the restoring force of the moat wall impact was fed back into the system, such that the closed-loop system behaved like a base-isolated structure impacting the wall during an impact event. The time history and frequency content of the impact force obtained using RTHS testing can be seen in Figure 6. The force signal was the measured force signal from the piezoelectric sensor during the linear impact and was obtained at a data acquisition sampling rate of 12,288 Hz and is depicted here in the reduced scale of the actuator (laboratory scale). The force profile observed in Figure 6A was similar to the impact force profile observed by Masroor and Mosqueda in the case of impacts with a steel moat wall. The similarities between the shake table test and RTHS test force profiles included the shape of the impact force time histories which approximated a half-sine pulse of frequency equal to roughly 8 Hz. Both force profiles also contained higher frequency behavior on top of the half-sine pulse initially, but these higher frequency oscillations damped out rapidly. This similarity between the experimental and RTHS results indicated that the force feedback technique used in RTHS was capable of producing realistic conditions for observing moat wall impacts in base-isolated structures.
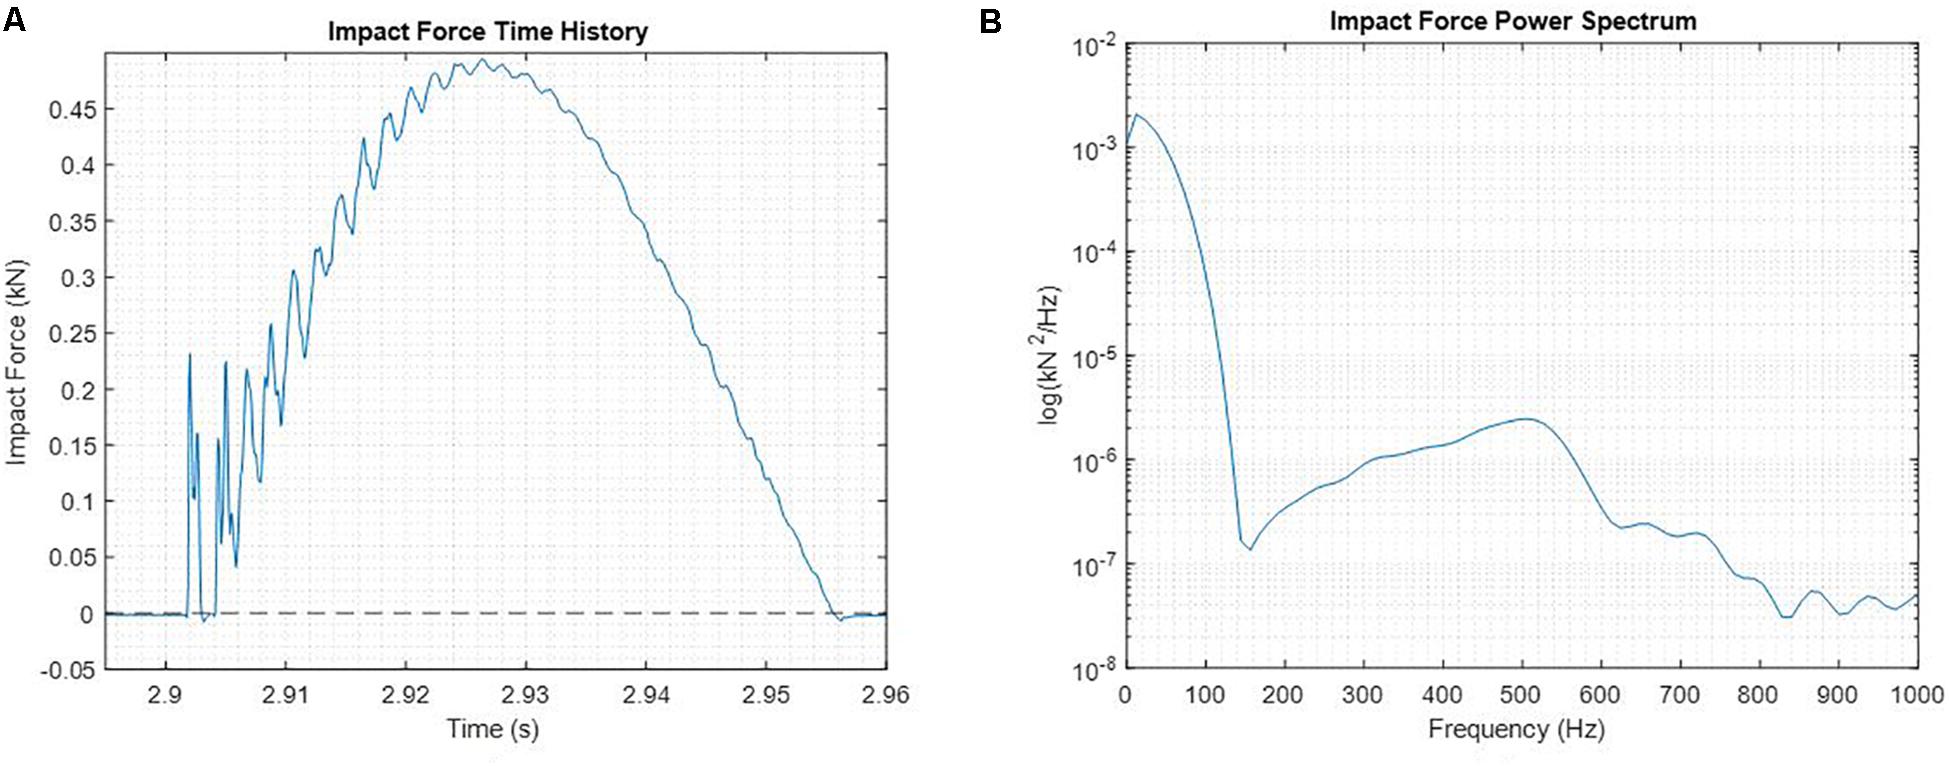
Figure 6. (A) Time history of impact behavior obtained during RTHS testing of a linear impact scenario and (B) the PSD of the impact event.
In order to ensure accurate capturing of the frequency content of a structural impact with the moat wall substructure must be considered. The PSD of the impact forces as obtained from the linear impact test conducted at 12,288 Hz can be seen in Figure 6B. The frequency content of moat impact forces was dependent on both the dynamics of the structure as well as the stiffness of the moat wall to resist deformation. Within this test, the impacts occurred along a single line of action or a single degree of freedom, with the physical substructure providing a uniaxial restoring force to be fed back to the numerical substructure. Both the physical substructure and the base-isolated structure representing the numerical substructure were flexible in the axis of the single degree of freedom and would not be expected to contribute to substantial high-frequency content within the impacts. From Figure 6B it can be seen that the impact behavior in the system analyzed was predominantly within the bandwidth of 0–50Hz; dropping to 0.97 kN2/Hz at roughly 46 Hz compared to 1.94 kN2/Hz at 0.2 Hz (a 50% reduction in power/Hz). This signified that a majority of the energy of the impacts was within the bandwidth of the hydraulic actuator. However, if the RTHS technique were to be applied to stiffer moat wall substructures, care should be taken to ensure that the actuator as sufficient bandwidth to capture the dynamics of the impact. In addition, analyses of the experimental setup should ensure that the actuator has sufficient power to avoid the effects of control-structure interaction as described by Dyke et al. (1995). Additionally, high-frequency, high-force actuation capabilities such as those at UC San Diego Blast Simulator (University of California San Diego, 2010) can potentially be leveraged to examine high-frequency, impulsive loading conditions like those of moat-wall impacts or blast loads.
In any experimental testing of system dynamics, it is critical to ensure that the mechanism used to drive the system has sufficient capacity to avoid the phenomenon known as Control-Structure Interaction (Dyke et al., 1995). For the results presented in this paper, the physical substructure was relatively flexible with respect to the force capacity of the actuator, with the maximum dynamic force observed within the actuator scale being equal to 1.903 kN as seen in later time histories of the nonlinear impact scenario. This force represented only 21.39% of the maximum force capacity of the actuator and it is therefore asserted that Control-Structure Interaction most likely did not affect the ability of the actuator to impose displacement constraints on the physical substructure during testing. Furthermore, as was observed within the time history results presented later in this study, the measured actuator displacement (xAct. Scaled) tracked very closely the commanded displacement (xb RTHS) for all tests conducted. As such, the efficacy of the compensation and the absence of significant Control-Structure interaction was verified. However, if the scale of the experiment were increased, or the stiffness of the moat wall increased, care should be taken to ensure that the actuator possess sufficient force and bandwidth capacity to impose boundary conditions on the physical substructure. This stipulation would extend to actuators imposing displacements in each DOF. Should a 6DOF shake table be used to examine normal, shear, and torsional components of impact forces, it must be ensured that the actuators driving the shake table have sufficient force capacity to impose boundary conditions as prescribed by the numerical substructure.
Real-Time Hybrid Simulation testing was utilized to analyze the effects of moat wall impacts on base isolated structures. Figures 7–9 present the time histories of the relative displacement and absolute acceleration of the base slab as well as the impact force acting on the isolation layer from linear impact scenarios. The time history results of the nonlinear scenario for the Northridge ground motion excitation have been presented in Figure 10. All of these time history results were collected at a data acquisition sampling rate of 2,048 Hz and are depicted here within the scale of the numerical substructure (the full structural scale). A zoomed-in view of the first impact event within the time history response has also been provided for each ground motion. Within these figures, the numerical signals were obtained from numerical simulations of the structural response to the ground motions using elastic impact models similar to those used by Liu et al. (2017, 2014). In the case of the nonlinear impact scenario, the RTHS test results are compared to the numerical results obtained using the bilinear approximation of the F-D behavior of the physical substructure. The RTHS signals within the time histories were obtained during the RTHS tests of the structural response to ground motions using the physical moat wall substructure. The nonlinear response of the structure could only be analyzed for one ground motion due to the limited availability of steel beams for testing. The Northridge ground motion was selected as there were noted instances where base-isolated structures impacted the moat wall (Nagarajaiah and Sun, 2001). Table 2 contains a summary of the signals plotted within the time history graphs from Figures 7–10.
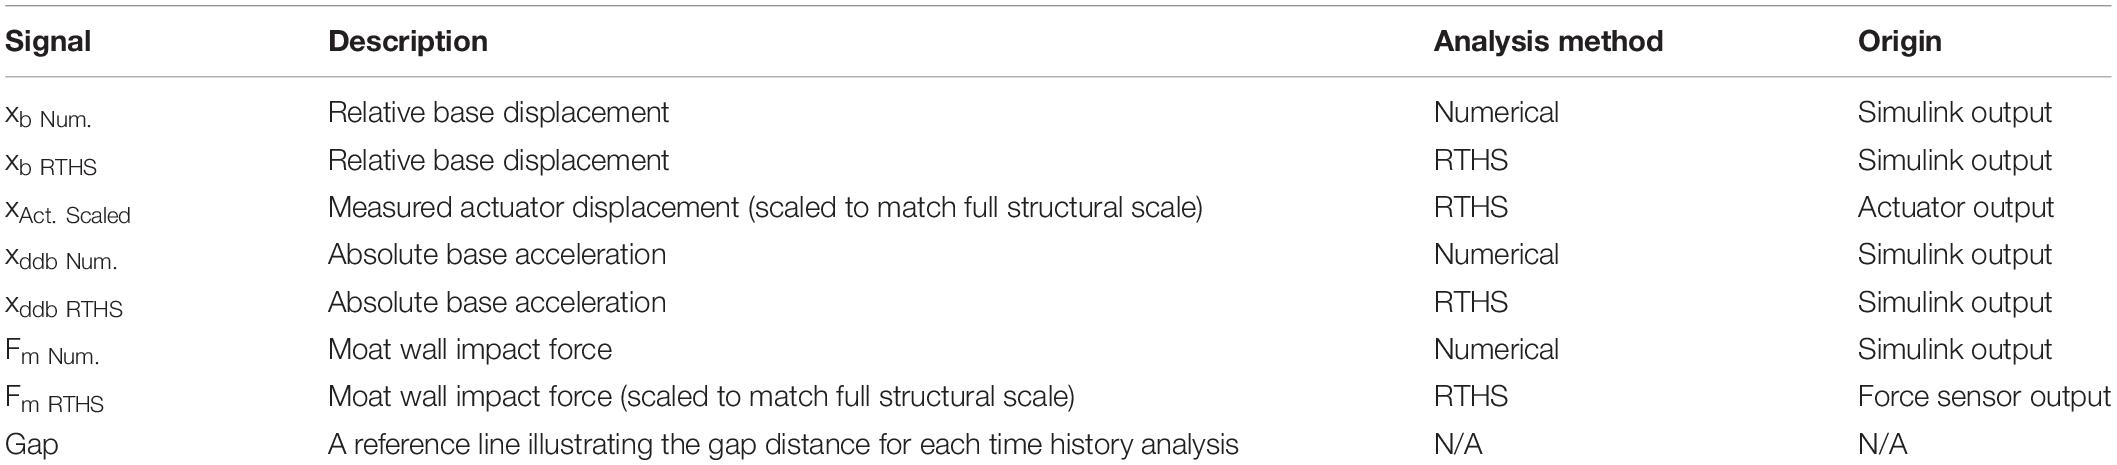
Table 2. Description of signals contained within Results section.
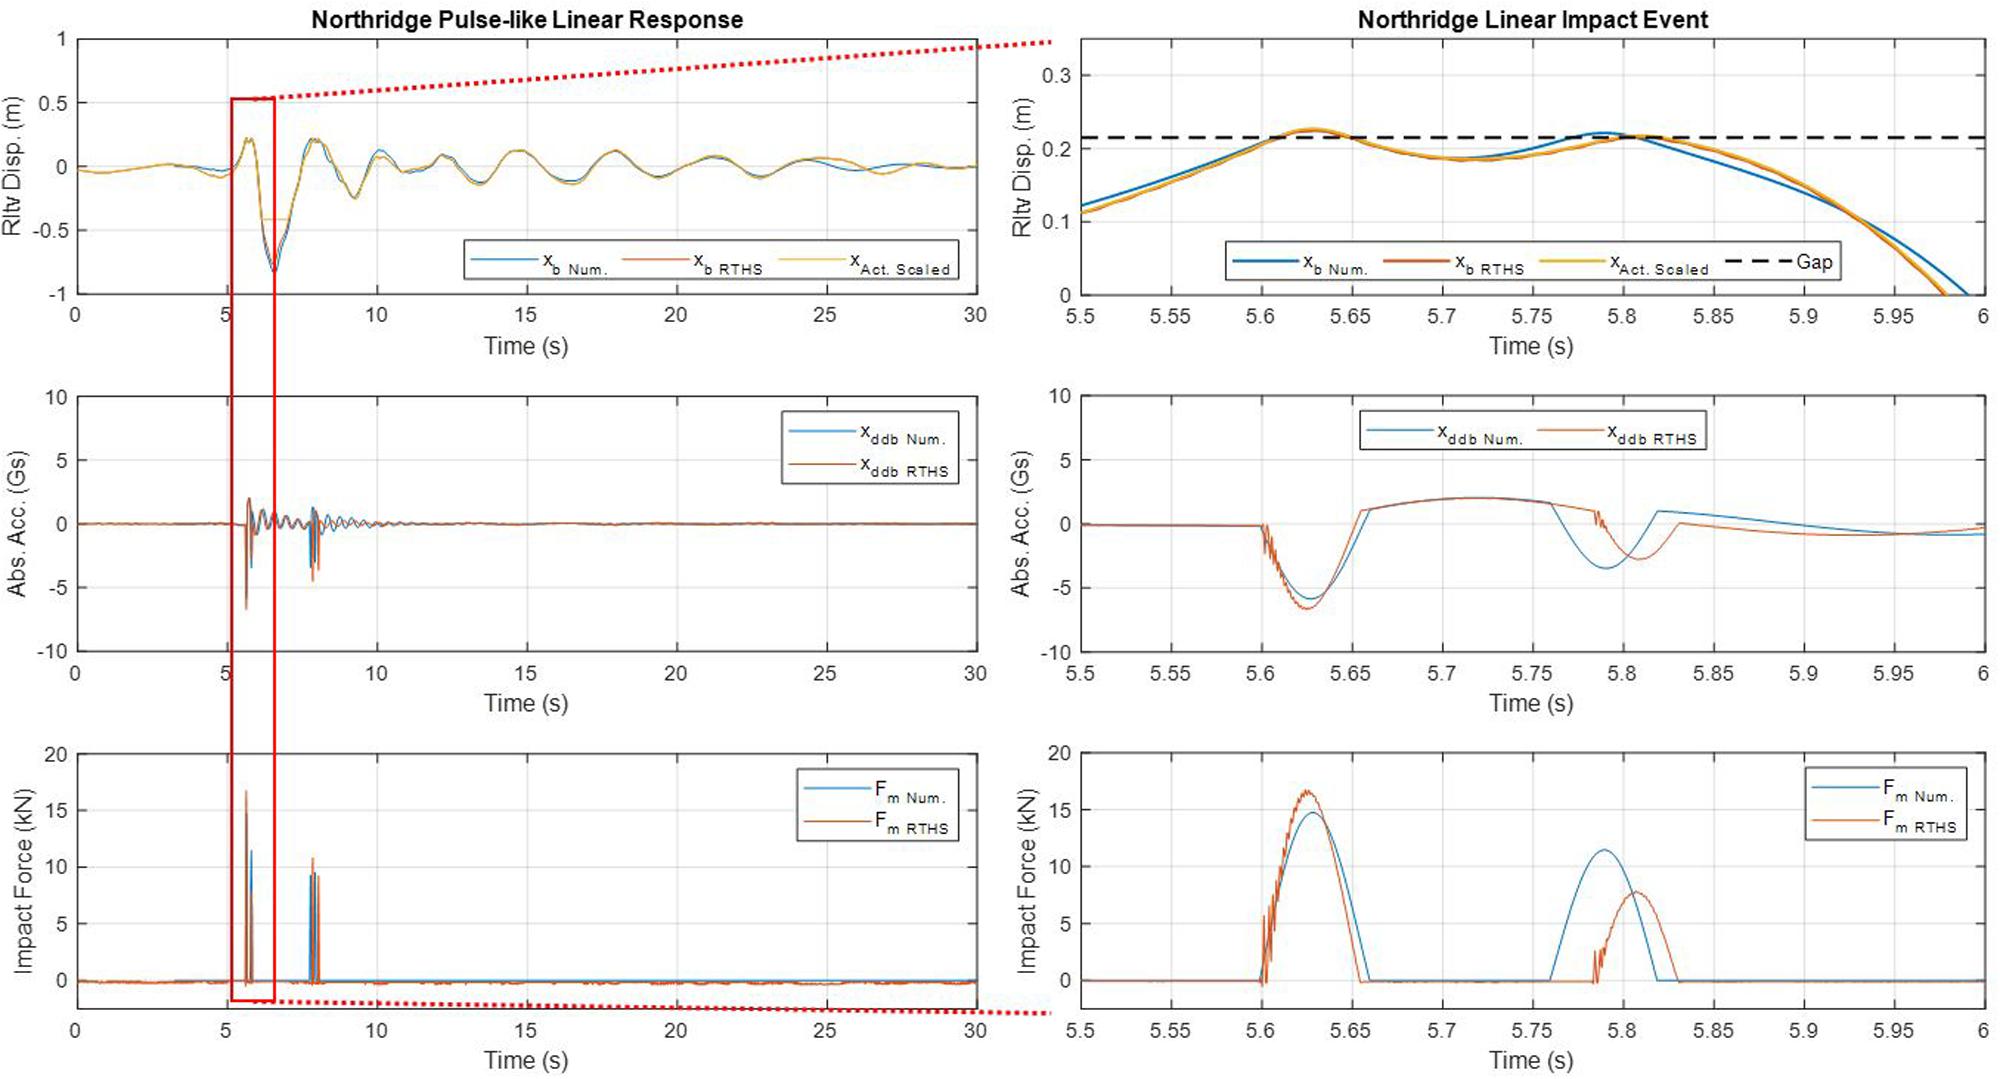
Figure 7. Time history of the response to the Northridge Pulse-like ground motion for the linear impact scenario.
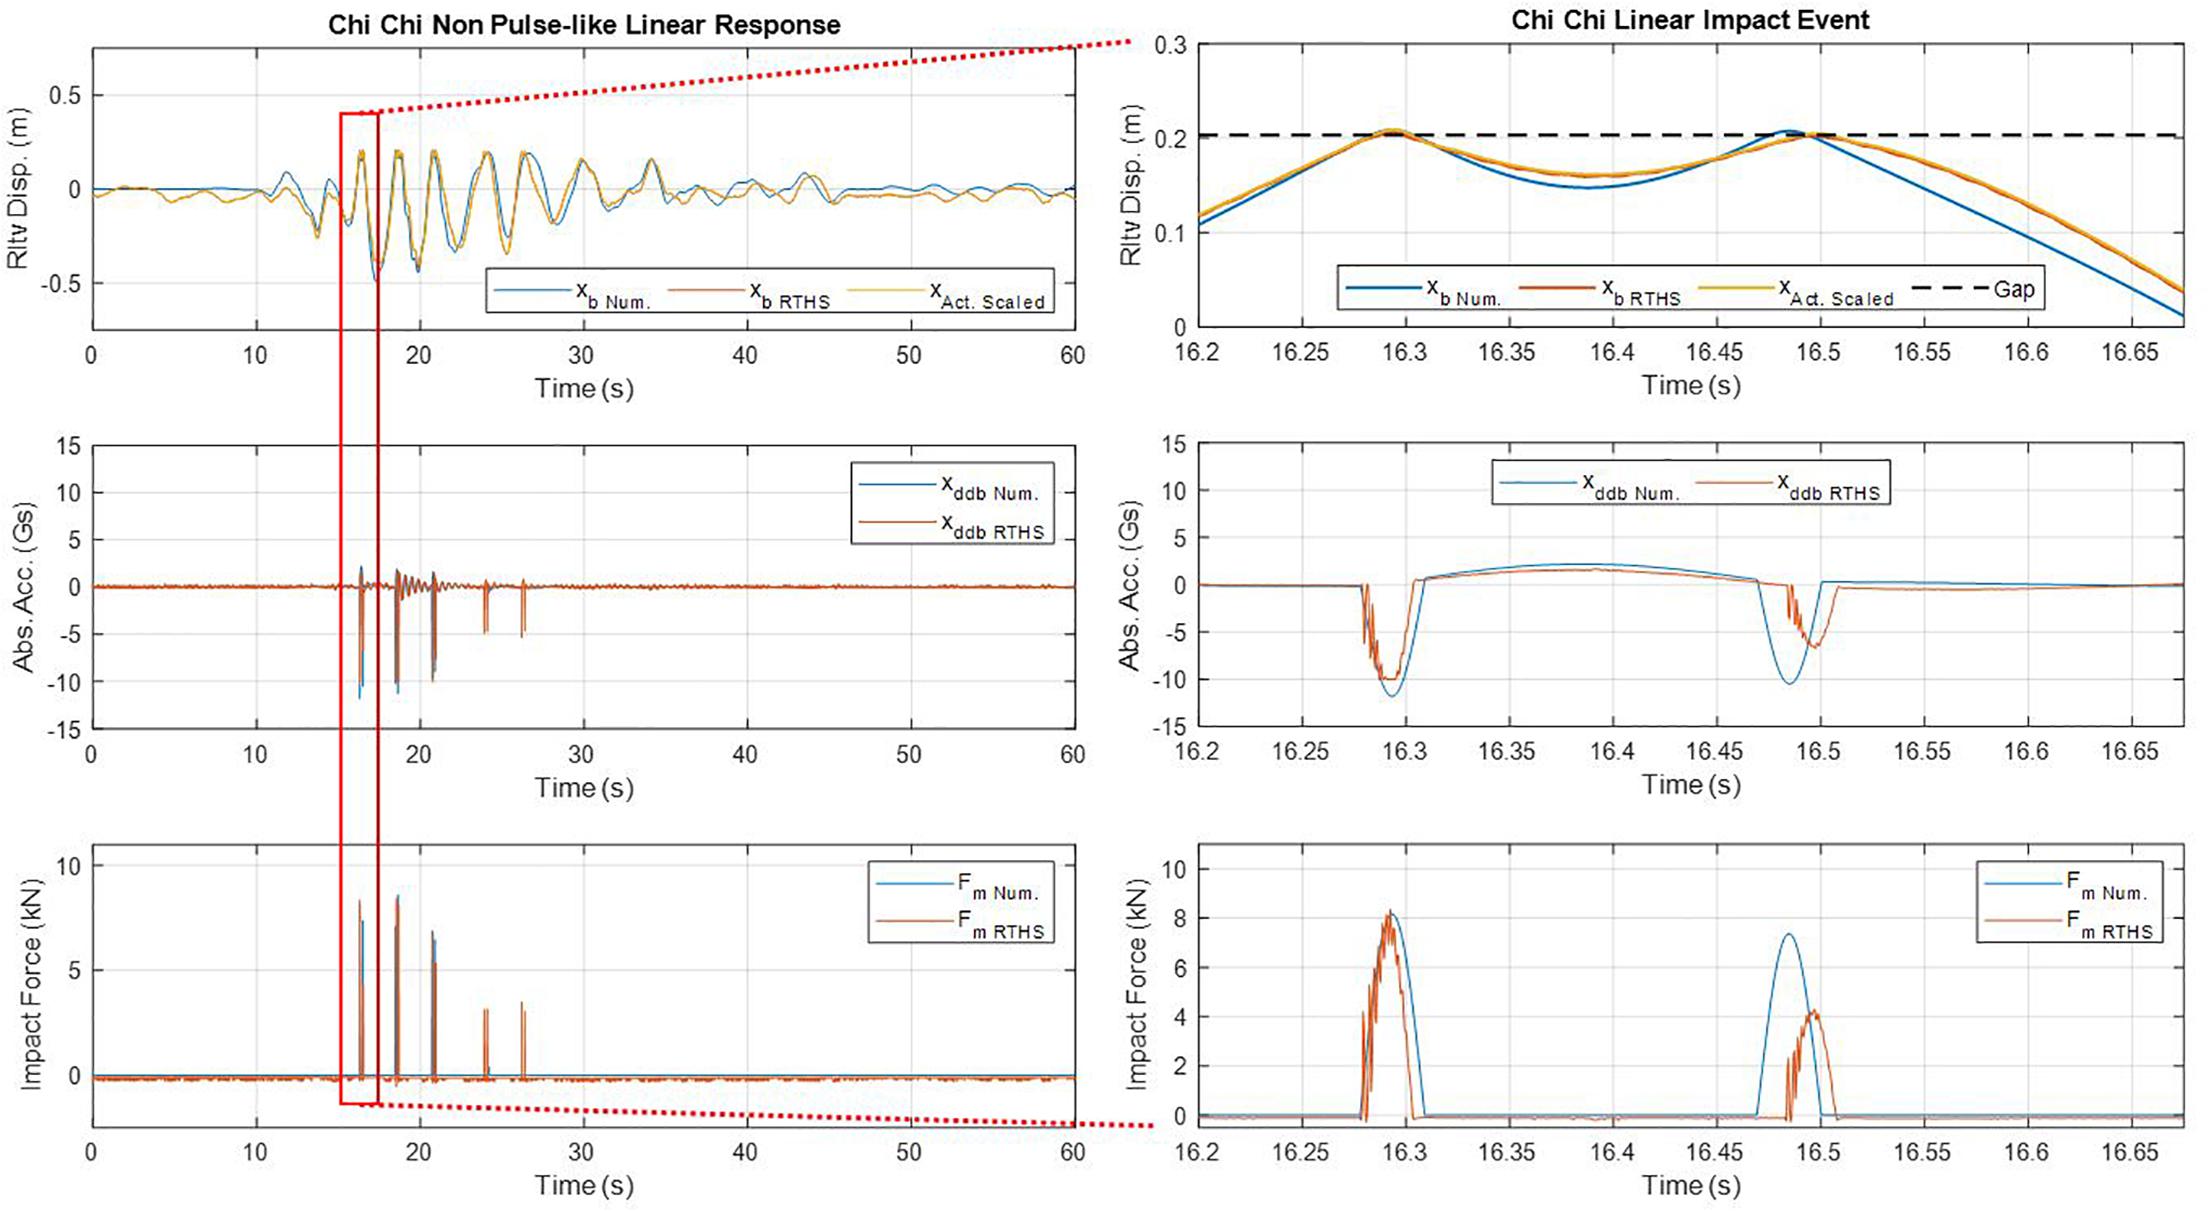
Figure 8. Time history of the response to the Chi Chi non-Pulse-like ground motion for the linear impact scenario.
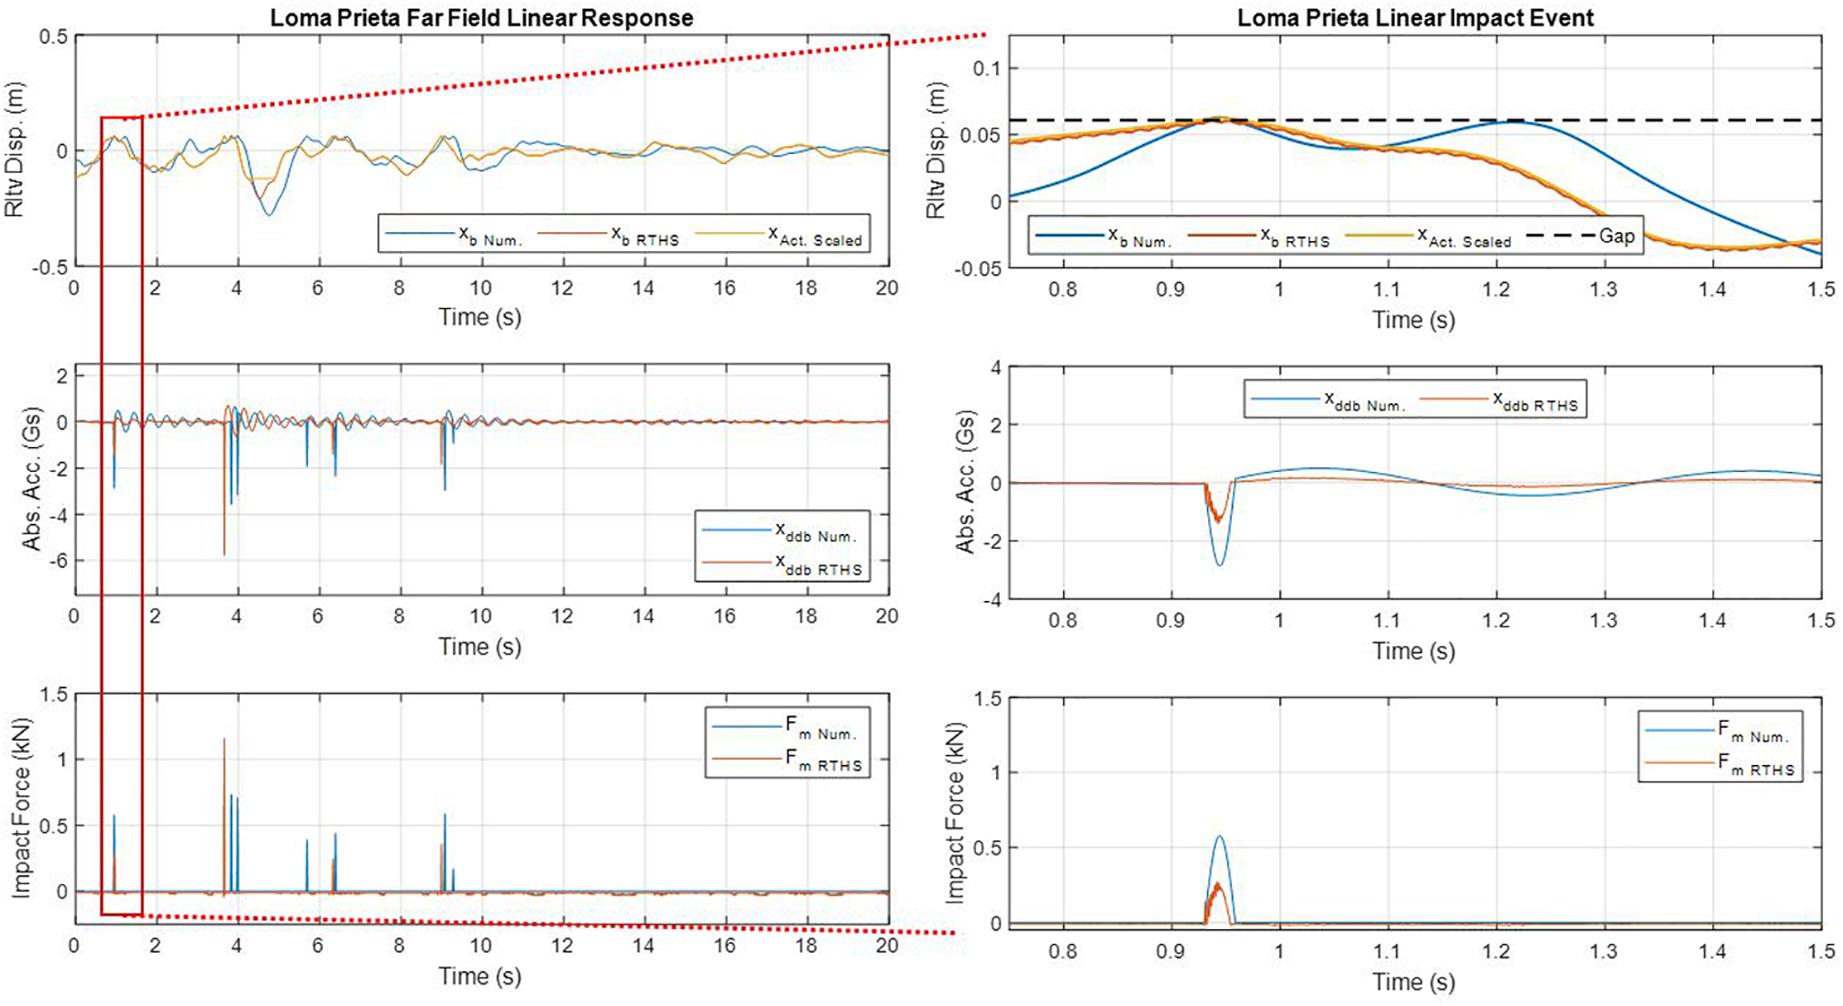
Figure 9. Time history of the response to the Loma Prieta Far Field ground motion for the linear impact scenario.
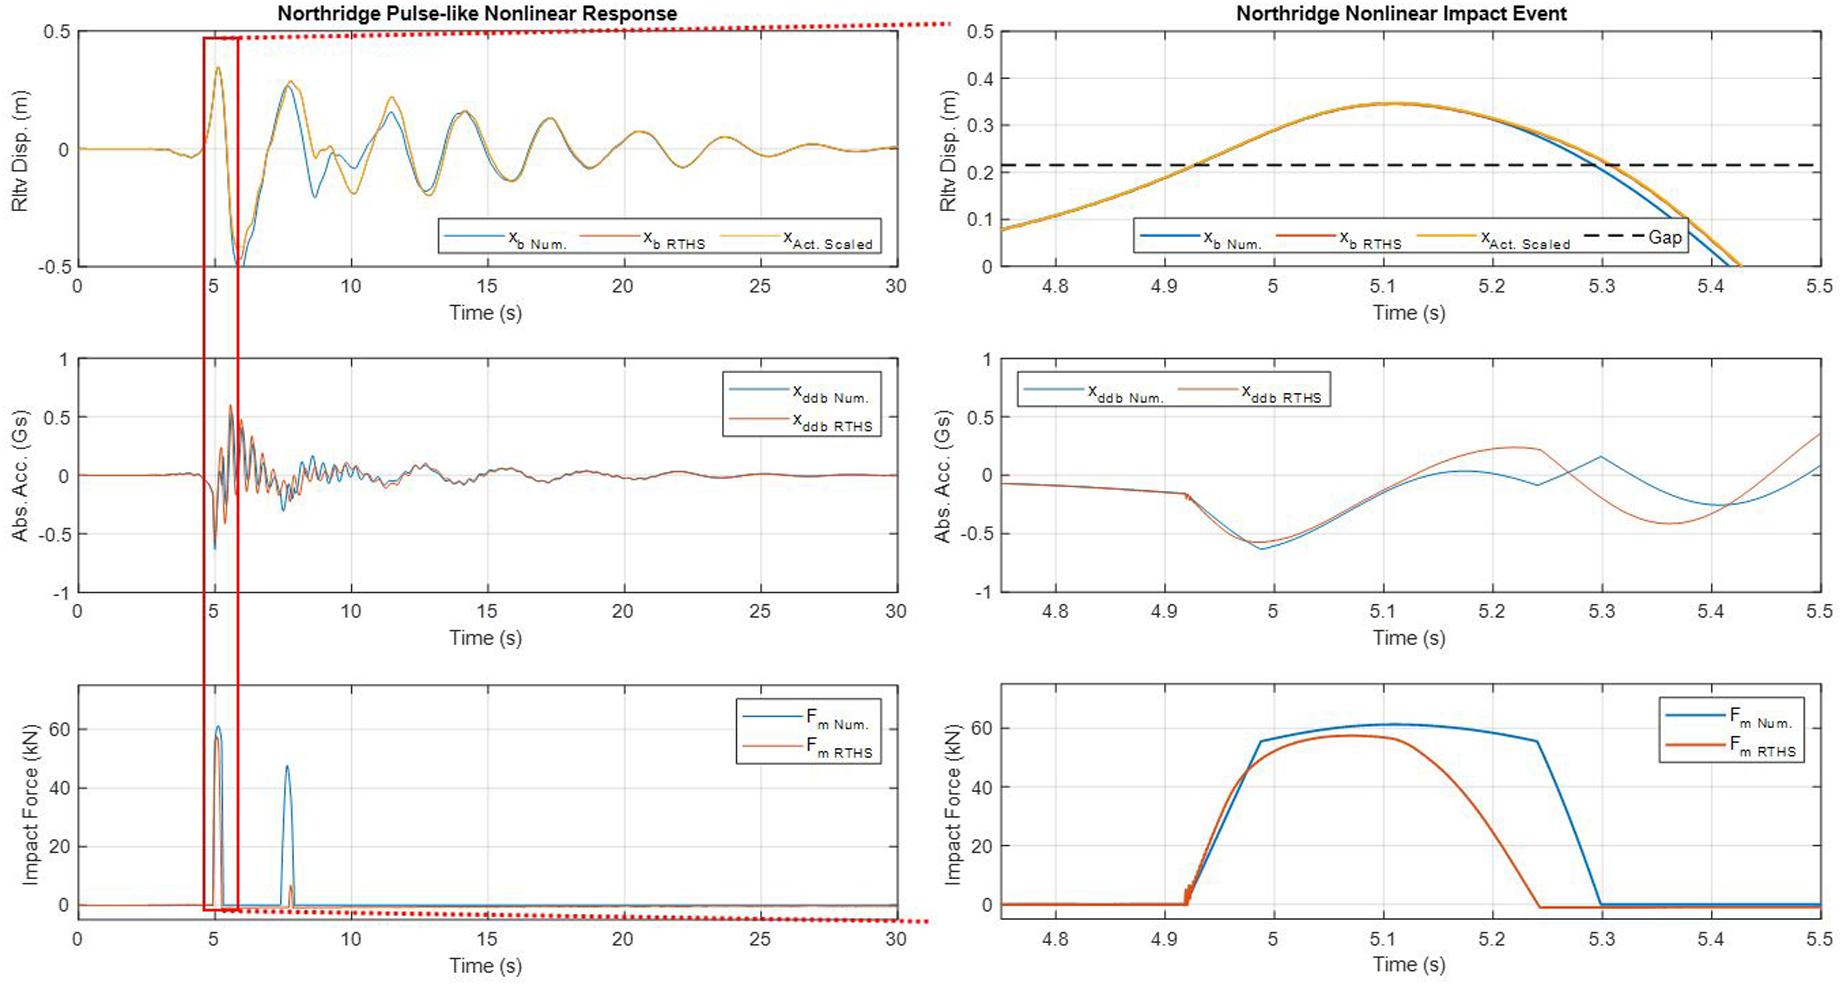
Figure 10. Time history of the response to the Northridge Pulse-like ground motion for the nonlinear impact scenario.
Within both the numerical and RTHS time history results depicted in Figures 7–9, there were several occasions where impact events were characterized by two rapid impacts. One example of this was in the first impact of the tests for both the RTHS test and numerical simulation of the linear scenario of the Northridge ground motion as seen in Figure 7. This phenomenon was due to settling or bouncing of the base slab at the time of impacting the moat wall. This was verified in Figure 11A. This figure depicts the impact force and base slab velocity within the full structural scale as obtained RTHS testing. The relative velocity of the base slab was obtained from the time derivative of the measured actuator displacement. It was believed that this settling behavior was due to the flexibility of the physical substructure coupled with the small mass and momentum of the base-isolated structure. While being driven into the moat wall, the resiliency of the moat wall causes the structure to exhibited a behavior similar to settling or “bouncing” off of the moat wall. Meanwhile, the same phenomenon was not observed for the nonlinear scenario of the Northridge ground motion (Figure 11B) as the base slab had more momentum and was able to deform the physical substructure more. Note that for Figure 11, a positive force sensed by the force sensor would induce base slab acceleration in the negative x direction as depicted in Figure 1. Additionally, the measured actuator displacement was seen to reach the stroke limit in the (−) direction after impacting the moat wall substructure during the linear scenario as opposed to the nonlinear scenario where the structure did not have as much acceleration demand during and after the impact event.
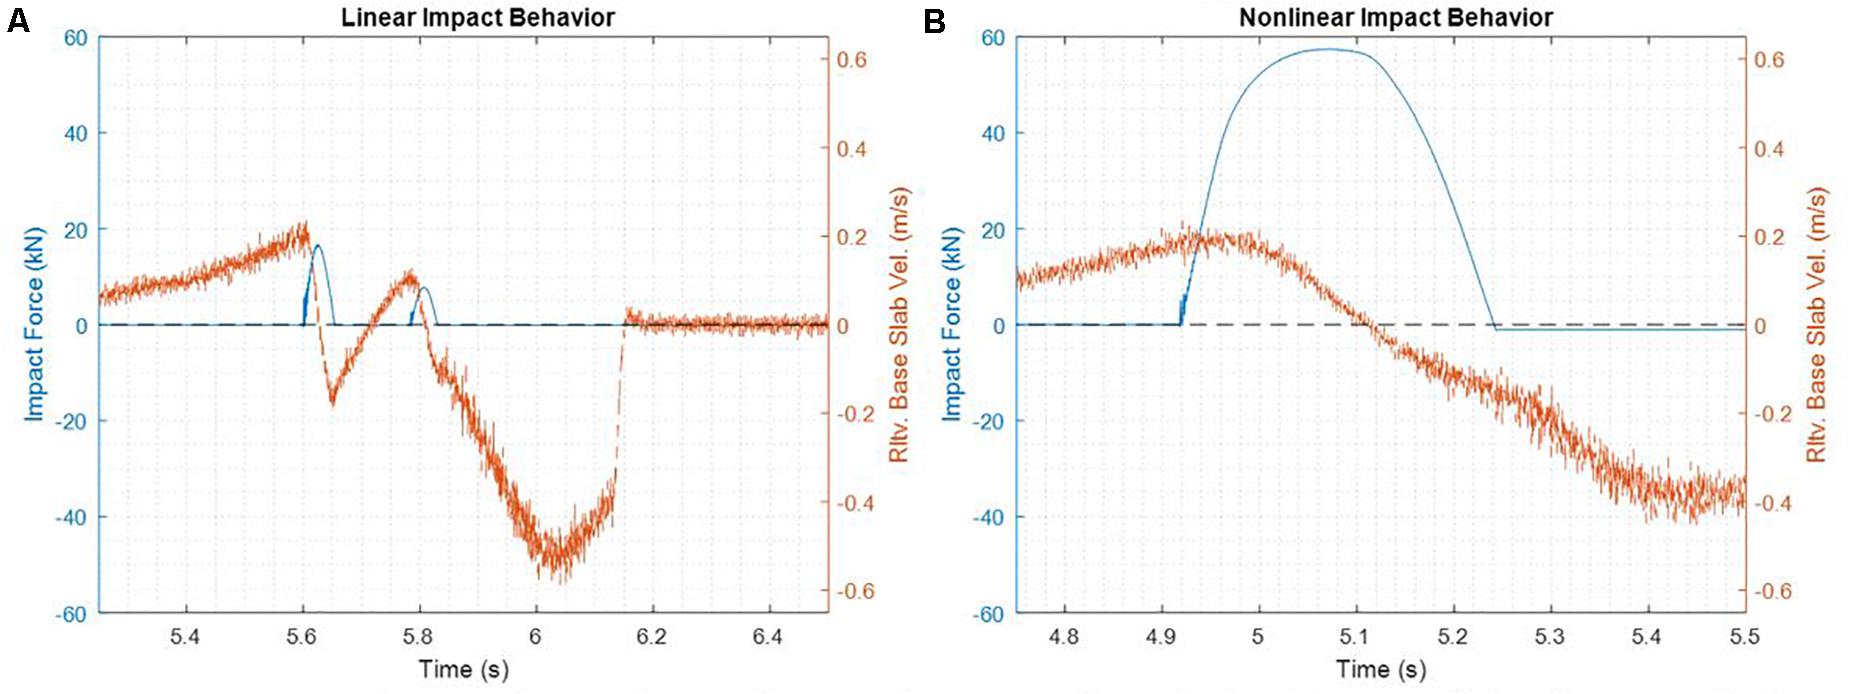
Figure 11. Time history of impact force and measured actuator velocity for the (A) linear and (B) nonlinear Northridge Impact Scenarios.
Some discrepancies were observed within the timing and number of impact events within the time histories. For example, there were two additional impact events observed in the RTHS test results of the structural response to the Chi Chi Non-Pulse-like ground motion (see Figure 8). It was believed that these differences between the response time histories were due to both differences in the moat wall F-D behavior of the numerical and RTHS simulations as well as the strength of the ground motion. As stated previously, the analytical simulations modeled the impact as a purely elastic even with the only damping resulting from the inherent damping of the structure itself. Meanwhile, RTHS impact events captured the energy dissipated by the friction of the bearings at the supports, contact friction between the base slab and moat wall, and energy converted to noise and vibrations within the beam. Unless the motion of the structure is dominated largely by its response due to the ground acceleration, it is plausible that differences in the impact behavior between the numerical simulations and RTHS tests could cause some discrepancies in the response time histories observed. Indeed, for large ground accelerations such as those at the beginning of the Northridge and Chi Chi events, there was marked agreement between the impact behavior and timing between the Numerical and RTHS results. As the ground motion decayed to smaller magnitudes, such as in the case of the end of the Chi Chi event as well as the majority of the Loma Prieta event, the applied forces from the ground acceleration are smaller in comparison to the forces due to impact events. This potentially led to discrepancies in the response time histories after impacts. This phenomenon should be studied in more detail. In order to do so, it is possible that a band-limited white noise acceleration could be used in place of the acceleration time history from the ground motion records. In this way, a stochastic impact analysis could be achieved using both analytical and RTHS testing techniques.
Quantitative results from the various time histories obtained through simulation and RTHS are summarized in Table 3. The results are presented in the full structural scale.
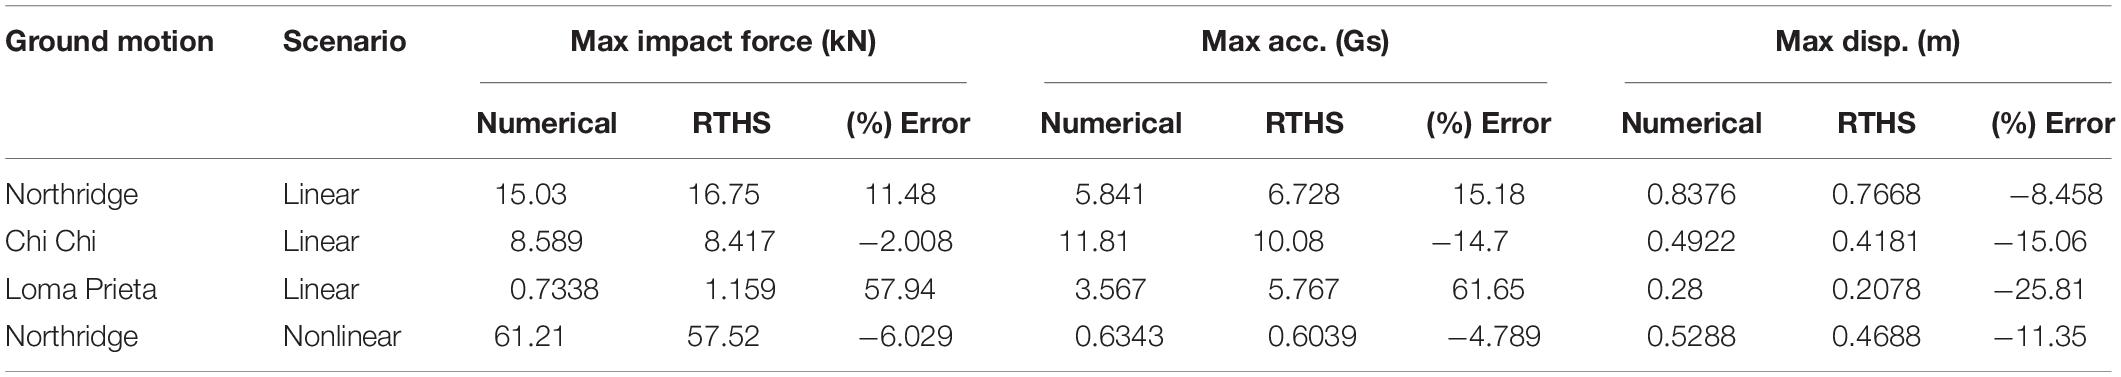
Table 3. Summary of structural response for time history analyses.
Within these results, several notable trends can be observed. For the three linear impact analyses, the maximum impact force observed during RTHS testing was, on average, 22.47% greater than the maximum forces observed in Numerical simulations. At the same time, the average acceleration as obtained by RTHS testing of the linear impact scenarios was 20.71% greater than the maximum accelerations as predicted by analytical simulations. These findings are consistent with expectations based on the fact that during RTHS testing, the behavior of the moat wall was stiffer for small deflections than the bilinear approximation of the force-deflection behavior used during numerical simulations. At the same time, the maximum displacement from linear impacts in RTHS testing was 16.44% smaller than that of the maximum displacements from the simulated linear impact scenario. This is also consistent with the fact that the bilinear approximation of the force-displacement behavior of the beam has a lower stiffness than the true force-displacement behavior of the beam for small deflections. Therefore, the simulation using this bilinear approximation would predict a larger displacement than would be observed when using the physical beam. Based on the linear impact scenario results, it appears that RTHS testing is capable of capturing the true force-displacement behavior associated with the physical moat wall analog. It is noted that there was some scattering of the results for the linear impact scenario. This may be due to the respective strength of the individual ground motions. For the Northridge ground motion, the response of the structure was characterized by two large impact events early into the ground motion record. Likewise, the Chi Chi event induced a response in the structure that caused the structure to impact the moat wall in three major impact events followed by two additional minor impact events. These two Near-field ground motions induced a large response in the structure and a comparison between the statistics from Numerical and RTHS results show that the responses are far more consistent than in the case of the Loma Prieta results. As stated previously, the Loma Prieta ground motion did not induce a large response on the structure, and as such, the statistics regarding the impact events are far more disparate. Again, this phenomenon should be studied in more detail by using a stochastic acceleration input to the structure for looking at a larger collection of impact statistics.
Another noteworthy comparison can be made between the results of linear and nonlinear tests in Table 3. The dissipation of energy due to the nonlinear impact events had the potential to substantially decrease the inertial demand on the structure substantially when compared to a linear impact scenario. By incorporating material nonlinearity into the impact scenario, the maximum acceleration observed within the isolation layer was reduced by 91.02% as obtained from RTHS test results. This result was very similar to the 89.99% reduction in maximum acceleration observed between numerical simulations of linear and nonlinear impacts. This illustrated the importance of designing the moat wall such that it will safely yield and help to dissipate the energy of the structural vibrations during ground motion events. The result also echoed findings by Wolf and Skrikerud (1979), as well as by Sarebanha et al. (2017) where material nonlinearities during pounding were shown to be an important factor in limiting the demand on structures undergoing pounding events. Overall, the results obtained from RTHS testing showed its ability to effectively capture the complex behavior and uncertainties associated with impacts between base isolated structures and moat walls.
A comparison of the force-deflection behavior for both analytical and experimental studies can be seen in Figure 12. The restoring forces and base displacements have been presented within the scale of the actuator displacement and physical substructure (reduced laboratory scale) such that they can be compared with the F-D behavior depicted in Figure 4. The similarity of the force-deflection behavior observed in Figures 4, 12B demonstrated the effectiveness of the RTHS technique in capturing the nonlinear force-deflection behavior of the physical substructure during impact events. In addition, there was a significant amount of energy dissipation during actual impact events that was not accounted for by using the linear impact model. The signals used to produce Figures 12A,C,E were the relative base slab displacement and impact force signal as obtained from numerical simulations of the Northridge ground motion for both linear and nonlinear impact scenarios. The relative velocity of the base slab was obtained by differentiating the relative displacement signal. The strain was calculated using Eqs 11 and 12 and the amount by which the base slab exceeded the gap distance. The strain rate was obtained as the time derivative of this strain signal. It is noted that within the numerical simulation, the nonlinear impacts were nonlinear in as much as they used the bilinear elastic approximation of the force-deflection behavior of the moat wall substructure, but the simulated impacts of nonlinear scenarios did not take into account the energy that will be dissipated due to yielding of the moat wall substructure. The signals used to produce Figures 12B,D,F were the measured actuator displacement signal and the restoring force signal collected from the piezoelectric force sensor. The measured velocity of the actuator was obtained by differentiating the measured actuator displacement. The strain of the beam during RTHS tests was calculated using Eqs 11 and 12 where δ was taken as the distance by which the measured actuator displacement exceeded the gap distance of 3.784 cm. The strain rate was obtained as the time derivative of this strain vector. Within Figure 12, the numerical simulation showed no rate-dependence of impact behavior, and RTHS tests of impacts showed little, if any dependence on strain rate during impacts. While Figures 12B,C illustrated that impact events induced different strain rates on the moat wall, there was no noticeable difference in the stiffness of the steel beam during the impact events (see Figures 12E,F). While this finding was to be expected within the numerical simulations, the finding could be justified for the RTHS tests when the relative flexibility of the physical substructure was considered as this would to lower strain rates being observed during testing (<0.4 cm/s in both the linear and nonlinear impact scenarios). These strain rates would not be expected to produce an appreciable change in stiffness within the steel beam (Knobloch et al., 2013; Brauer et al., 2019).
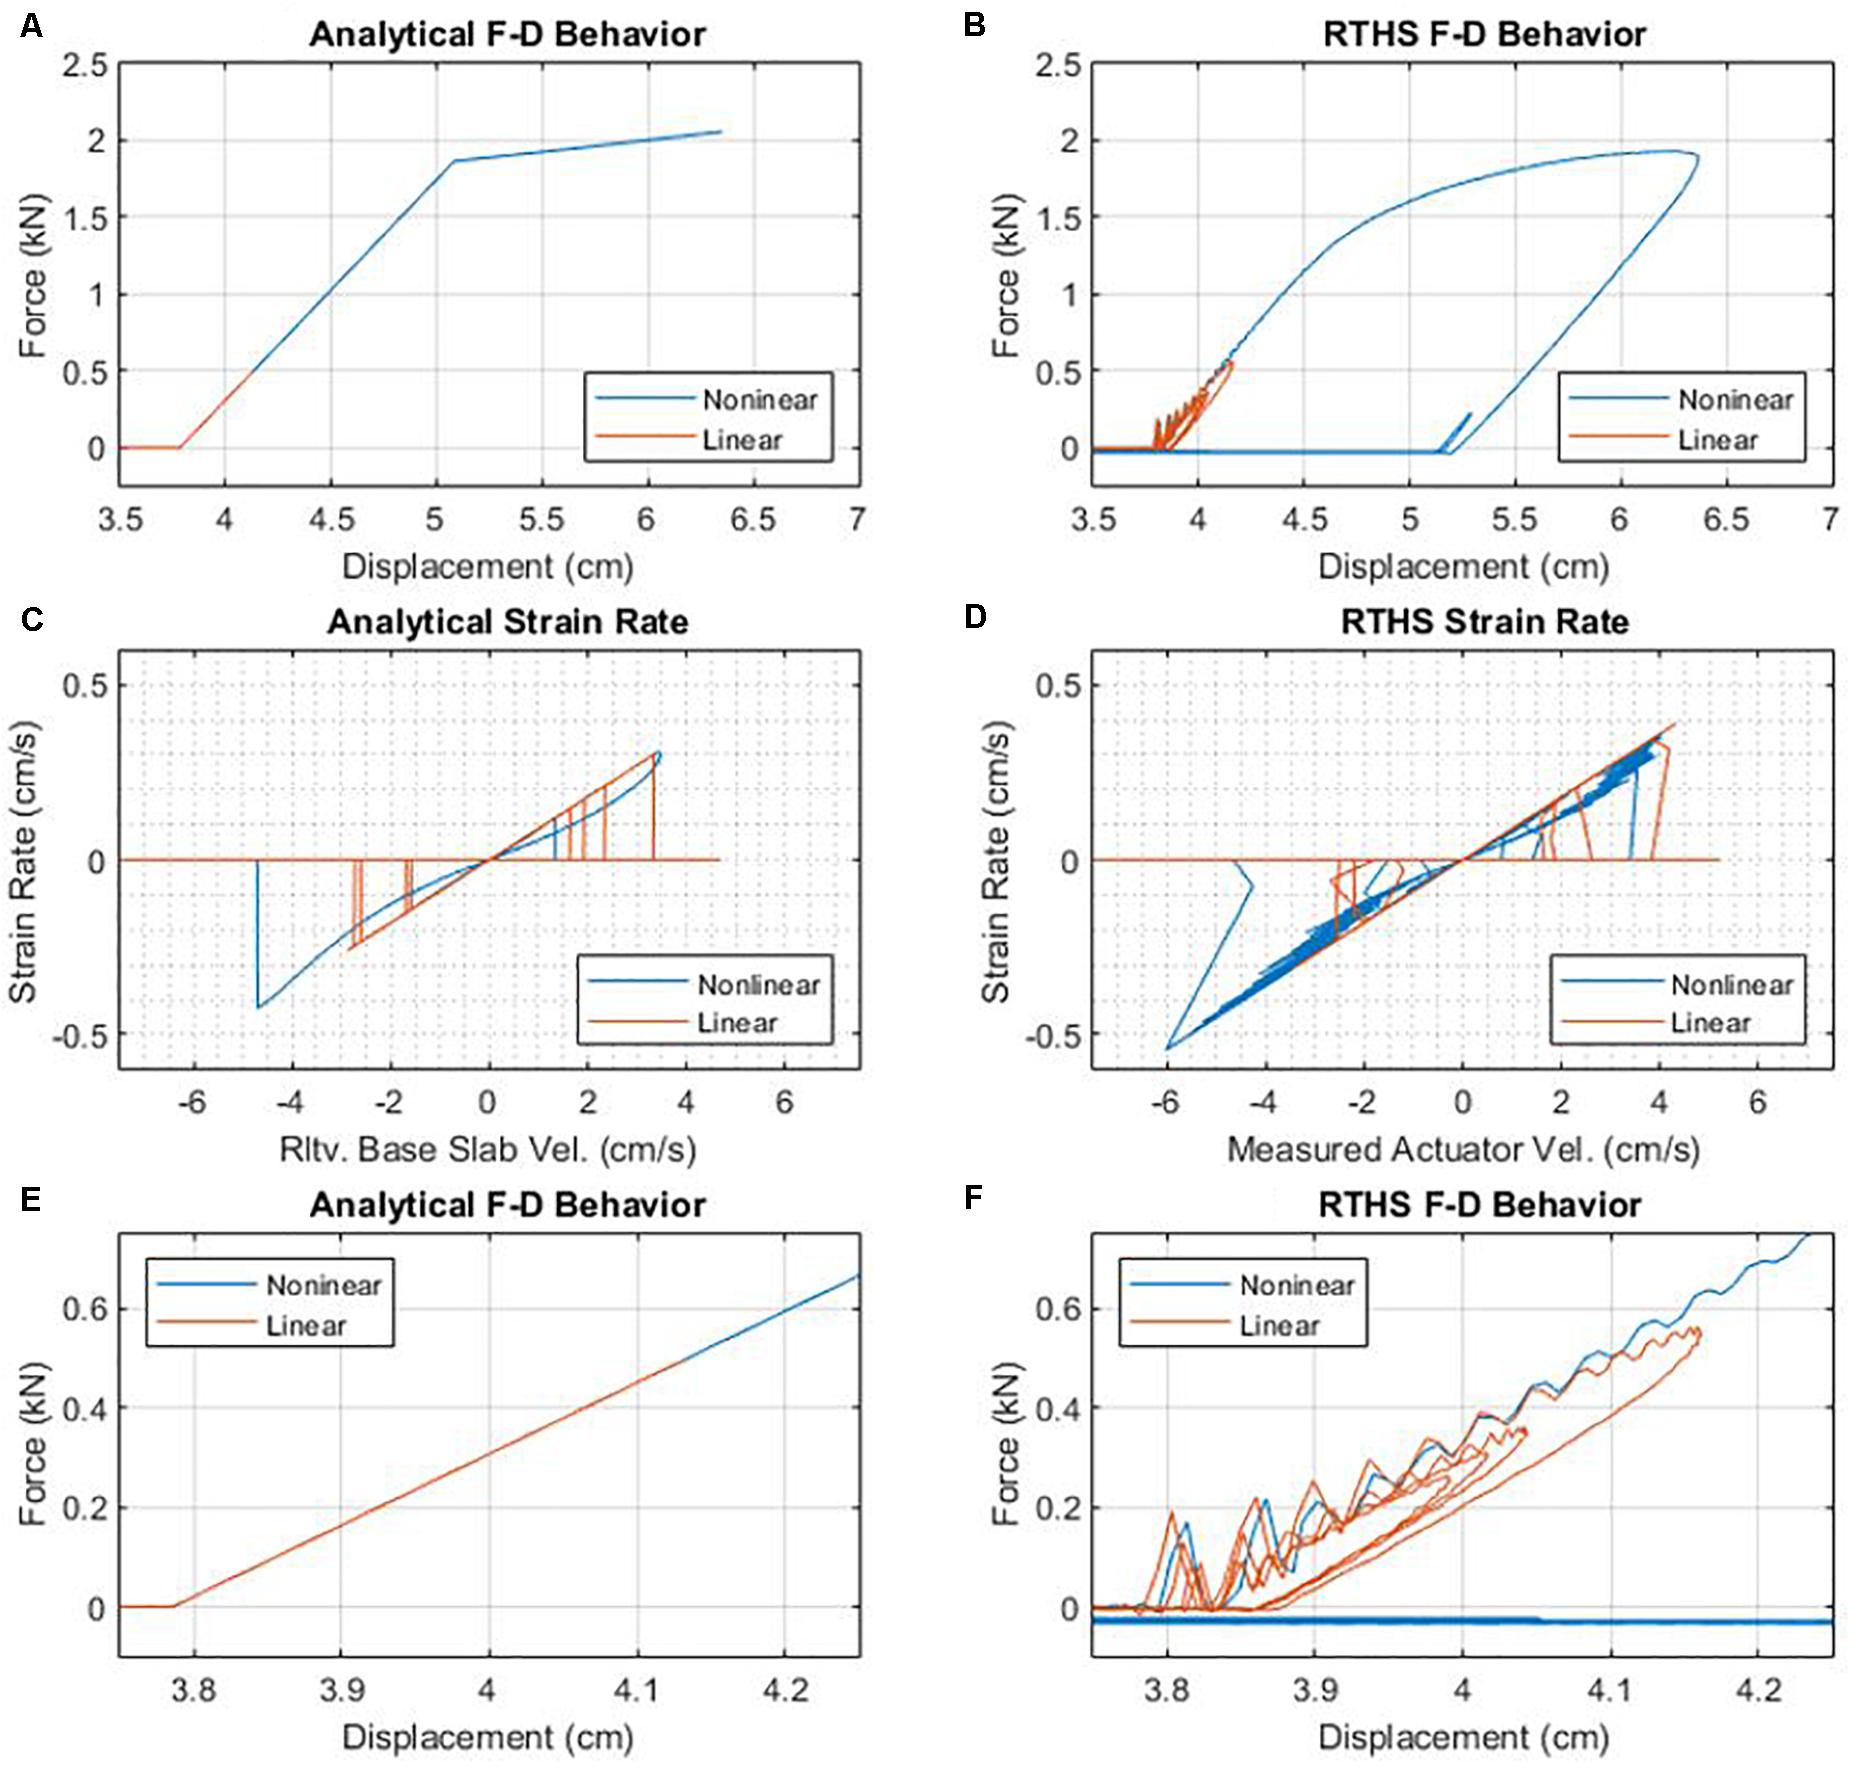
Figure 12. The force displacement behavior as observed during impact by (A) numerical simulation and (B) RTHS testing, the deformation strain-rate dependency obtained by (C) numerical simulation and (D) RTHS testing, and a zoomed-in view of the force-displacement behavior obtained by (E) numerical simulations and (F) RTHS testing.
Ultimately, the evolution of impact forces is a highly complex phenomenon affected by factors such as the contact surfaces and geometry, friction and other damping methods, material properties and nonlinearities, and rate-dependence of the impacting bodies. The importance of characterizing nonlinear deflection behavior during impacts is critical for predicting the true inertial demand on the system. The RTHS technique was capable of capturing material nonlinearities within the physical substructure without the use of computationally expensive impact models. The numerical model, while straight forward to implement and computationally inexpensive, was far from accurate when modeling the interaction between the isolation layer and the moat wall. Figure 12 presented the ability of the RTHS testing technique to capture the complexities and uncertainties of F-D behavior of the physical substructure during impact events without the need for computationally expensive impact modeling and calculations. The determination of impact forces was accomplished using empirically measured forces which were then fed back to the simulation. In this way, RTHS was shown to have the potential to produce more realistic impact force time histories.
Real-time hybrid simulation testing was used to analyze a base isolated system impacting a moat wall. The comparison of experimental and analytical results showed that the RTHS technique was able to capture the complexities of impact events between a base isolation layer and a steel foundation wall analog. Structural response predicted by RTHS testing was shown to accurately capture the effects of moat wall impacts based through comparisons of both predicted inertial demand as well as observed force-deflection behavior during impact events. When compared to simulations using a bilinear approximation of the moat wall, for the linear impact scenario, the RTHS testing technique predicted maximum displacements averaging 16.44% lower, while predicting increases in maximum accelerations and impact forces averaging 20.71 and 22.47% respectively. Both of these results are consistent with what would be expected based on comparisons of the experimental and numerical force-deflection analyses. Use of RTHS was shown to be a means of fully capturing the force-deflection behavior of the moat wall as well as the uncertainties associated with impact events while alleviating the need to use a computationally expensive model of impact behavior.
The results also illustrated the importance of designing for nonlinear behavior to occur within the moat wall during impact events. Results of RTHS testing showed that the maximum acceleration observed in the isolation layer was reduced by over 90% when the moat wall yielded during testing. Design of the foundation such that it yields safely during impact events could help to increase the safety of base-isolated structures during large earthquake events.
Future tests should expand on results presented here by using a larger experimental setup to mitigate the need for scaling of forces and displacements during testing. In addition, examination of moat wall impacts using 6DOF shake tables would enable the consideration of shear and moment contributions to impact event. Additional studies could use RTHS with band-limited white noise (stochastic) input accelerations to the numerical substructure as a different means of analyzing moat wall impact events. The testing of multiple varieties of moat wall designs such as those using reinforced concrete as well as those with soil backfills and other innovative materials and mechanisms would also help to better characterize nonlinear behavior of moat walls and structures during impact events and could ultimately provide insight for safer design practices. Other applications of the RTHS technique to impulsive, high-frequency loading conditions could investigate the effects of blast loads on structures using loading capabilities such as those available at UC San Diego.
The datasets generated for this study are available on request to the corresponding author.
MH conducted numerical simulation and experimental testing, performed the post-test data analysis, and wrote the manuscript. RC provided advice and guidance during the planning, testing, analysis, and writing phases as research advisor for the work. Both authors contributed to the article and approved the submitted version.
This work was supported by a graduate fellowship under US Department of Education GAANN award #P200A140212.
The authors declare that the research was conducted in the absence of any commercial or financial relationships that could be construed as a potential conflict of interest.
The authors would like to thank the Pacific Earthquake Engineering Research Center (PEER) for providing a database of ground motions that was used to obtain the ground motion time histories for this work.
Abbiati, G., Lanese, I., Cazzador, E., Bursi, O. S., and Pavese, A. (2019). A computational framework for fast-time hybrid simulation based on partitioned time integration and state-space modeling. Struct. Control Health Monit. 26:e2419. doi: 10.1002/stc.2419
American Society of Civil Engineers [ASCE] (2010). Minimum Design Loads for Buildings and Other Structures. Reston, VA: American Society of Civil Engineers.
Ariga, T., Kanno, Y., and Takewaki, I. (2006). Resonant behaviour of base-isolated high-rise buildings under long-period ground motions. Struct. Design Tall Special Build. 359, 1869–1891.
Asai, T., Chang, C., and Spencer, B. F. Jr. (2015). Real-time hybrid simulation of a smart base-isolated building. J. Eng. Mech. 141:04014128. doi: 10.1061/(asce)em.1943-7889.0000844
Bamer, F., Shi, J., and Markert, B. (2017). Efficient solution of the multiple seismic pounding problem using hierarchical substructure techniques. Comput. Mech. 62, 761–782. doi: 10.1007/s00466-017-1525-x
Beer, F., Johnson, R., and DeWolf, J. T. (2006). Mechanics of Materials, 4th Ed. New York, NY: McGraw-Hill.
Brauer, S. A., Whittington, W. R., Rhee, H., Allison, P. G., Dickel, D. E., Crane, C. K., et al. (2019). Stress-State, temperature, and strain rate dependence of vintage ASTM A7 steel. J. Eng. Mater. Technol. 141, 1–9.
Carrion, J. E., and Spencer, B. F. Jr. (2007). Model-based Strategies for Real-Time Hybrid Testing. Newmark Structural Engineering Laboratory Report Series No. 6 (Urbana, IL: University of Illinois at Urbana-Champaign).
Chen, P., Tsai, K., and Lin, P. (2014). Real-time hybrid testing of a smart base iso- lation system. Earthquake Eng. Struct. Dyn. 43, 139–158. doi: 10.1002/eqe.2341
Cole, G., Dhakal, R., Carr, A., and Bull, D. (2011). An Investigation of the effects of mass distribution on pounding structures. Earthquake Eng. Struct. Dyn. 40, 641–659. doi: 10.1002/eqe.1052
Connor, J. J. (2003). Introduction to Structural Motion Control. Upper Saddle River, NJ: Prentice Hall.
Delfosse, G. C. (1977). “The gapec system: a new highly effective aseismic system,” in Proceedings of the 6th World Conference on Earthquake Engineering, New Delhi, 1135–1140.
Dyke, S. J., Spencer, B. F. Jr., Quast, P., and Sain, M. K. (1995). Role of control-structure interaction in protective system design. ASCE J. Eng. Mech. 121, 322–338. doi: 10.1061/(asce)0733-9399(1995)121:2(322)
Federal Emergency Management Agency [FEMA] (2009). Quantification of Building Seismic Performance Factors. Redwood City: Applied Technology Council.
Furinghetti, M., Lanese, I., and Pavese, A. (2020). Experimental assessment of the seismic response of a base-isolated building through a hybrid simulation technique. Front. Built Environ. 6:33. doi: 10.3389/fbuil.2020.00033
Gordis, J. H. (1994), Structural synthesis in the frequency domain, a general formulation. Shock Vibr. 1, 461–471. doi: 10.1155/1994/947253
Hakuno, M., Shidawara, M., and Hara, T. (1969). Dynamic destructive test of a cantilever beam, controlled by an analog-computer (Japanese). Civil Eng. Rep. 171, 1–9. doi: 10.2208/jscej1969.1969.171_1
Hayashi, K., Fujita, K., Tsuji, M., and Takewaki, I. (2018). A simple response evaluation method for base-isolation building-connection hybrid structural system under long-period and long-duration ground motion. Front. Built Environ. 4:2. doi: 10.3389/fbuil.2018.00002
Horiuchi, T., and Nakagawa, M. (1996). “Development of a real-time hybrid experimental system with actuator delay compensation,” in 11th World Conference on Earthquake Engineering, 660.
Horiuchi, T., Inoue, M., Konno, T., and Namita, Y. (1999). Real-time hybrid experimental system with actuator delay compensation and its application to a piping system with energy absorber. Earthquake Eng. Struct. Dyn. 28, 1121–1141. doi: 10.1002/(sici)1096-9845(199910)28:10<1121::aid-eqe858>3.0.co;2-o
Hussain, S. (2018). Design Of A Seismic Isolation System With Supplemental Viscous Damping For A Near-Fault Essential Services Facility. Available online at: https://www.iitk.ac.in/nicee/wcee/article/14_S05-02-007.pdf (accessed May 9, 2019).
Iervolino, I., and Cornell, C. A. (2005). Record selection for nonlinear seismic analysis of structures. Earthquake Spectr. 21, 685–713. doi: 10.1193/1.1990199
Jain, S., and Thakkar, S. (2004). “Application of Base Isolation for Flexible Buildings,” in Proceedings of the 13th World Conference on Earthquake Engineering, Vancouver, BC.
Keivan, A., Zhang, R., Phillips, B., and Ikago, K. (2017). “Protection of inter-story isolated structures through rate-independent linear damping,” in Proceedings of the 3rd Huixian International Forum on Earthquake Engineering for Young Researchers (Urbana-Champaign: University of Illinois).
Kelly, J. M. (1981). “Aseismic base isolation: its history and prospects,” in Proceedings of the 1st World Congress on Joints and Bearings, ACI-SP-70, Niagara Falls, NY, 549–586.
Kelly, J. M. (1990). Base isolation: linear theory and design. Earthquake Spectra. 6, 223–244. doi: 10.1193/1.1585566
Kim, S. J., Christenson, R. E., Wojtkiewicz, S. F., and Johnson, E. A. (2011). Real-time hybrid simulation using the convolution integral method. Smart Mater. Struct. 20,
Knobloch, M., Pauli, J., and Fontana, M. (2013). Influence of the strain-rate on the mechanical properties of mild carbon steel at elevated temperatures. Materials Design 49, 553–565. doi: 10.1016/j.matdes.2013.01.021
Kumar, S., Itoh, Y., Saizuka, K., and Usami, T. (1997). Pseudodynamic Testing of Scaled Models. J. Struct. Eng. 123, 524–526. doi: 10.1061/(asce)0733-9445(1997)123:4(524)
Kun, Y., Li, L., and Hongping, Z. (2009). A modified Kelvin impact model for pounding simulation of base-isolated building with adjacent structures. Earthquake Eng. Eng. Vibr. 8, 433–446. doi: 10.1007/s11803-009-8045-4
Lin, P., Roschke, P., Loh, C., and Cheng, C. (2004). “Semi-active controlled base-isolation system with magnetorheological damper and pendulum system,” in Proceedings of the 13th World Conference on Earthquake Engineering, Vancouver.
Liu, Y., Liu, W. G., Wang, X., He, W. F., and Yang, Q. R. (2014). New equivalent linear impact model for simulation of seismic isolated structure pounding against moat wall. Shock Vibr. 2014:151237.
Liu, C., Yang, W., Yan, Z., Lu, Z., and Luo, N. (2017). Base pounding model and response analysis of base-isolated structures under earthquake excitation. Appl. Sci. 7:1238. doi: 10.3390/app7121238
Luco, N., and Bazzurro, P. (2007). Does amplitude scaling of ground motion records result in biased nonlinear structural drift responses. Earthquake Eng. Struct. Dyn. 36, 1813–1835. doi: 10.1002/eqe.695
Mahin, S. A., and Shing, P. B. (1985). Pseudodynamic method for seismic testing. J. Struct. Eng. 111, 1482–1503. doi: 10.1061/(asce)0733-9445(1985)111:7(1482)
Masroor, A., and Mosqueda, G. (2013). Impact model for simulation of base isolated buildings impacting flexible moat walls. Earthquake Eng. Struct. Dyn. 42, 357–376. doi: 10.1002/eqe.2210
Muthukumar, S., and DesRoches, R. (2006). A hertz contact model with non-linear damping for pounding simulation. Earthquake Eng. Struct. Dyn. 35, 811–826.
Nagarajaiah, S., and Sun, X. (2001). Base-Isolated FCC building: impact response in northridge earthquake. J. Struct. Eng. 127, 1063–1075. doi: 10.1061/(asce)0733-9445(2001)127:9(1063)
Nakashima, M., Kato, H., and Takaoka, E. (1992). Development of real-time pseudo dynamic testing. Earthquake Eng. Struct. Dyn. 21, 79–92. doi: 10.1002/eqe.4290210106
Oh, J., Jang, C., and Kim, J. H. (2016). Seismic behavior characteristic of high damping rubber bearing through shaking table test. J. Vibroeng. 18, 1591–1601. doi: 10.21595/jve.2016.15973
Pantelides, C. P., and Ma, X. (1996). “Nonlinear seismic pounding of inelastic structures,” in Proceedings of the Eleventh World Conference on Earthquake Engineering, Acapulco.
Polycarpou, P., Komodromos, P., and Polycarpou, A. (2013). A nonlinear impact model for simulating the use of rubber shock absorbers for mitigating the effects of structural pounding during earthquakes. Earthquake Eng. Struct. Dyn. 42, 81–100. doi: 10.1002/eqe.2194
Polycarpou, P., Papaloizou, L., and Komodromos, P. (2014). An efficient methodology for simulating earthquake-induced 3d pounding of buildings. Earthquake Eng. Struct. Dyn. 43, 985–1003. doi: 10.1002/eqe.2383
Providakis, C. P. (2008). Effect of LRB isolators and supplemental viscous dampers on seismic isolated buildings under near-fault excitations. Eng. Struct. 30:1187–1198. doi: 10.1016/j.engstruct.2007.07.020
Sarebanha, A., Mosqueda, G., Kim, M. K., and Kim, J.H. (2017). “Modeling of moat wall compliance during impact in seismically isolated nuclear power plants,” in Proceedings of the International Association for Structural Mechanics in Reactor Technology. SMiRT-24 (Buscan: BEXCO).
Shome, N., Cornell, C. A., Bazzurro, P., and Carballo, J. E. (1998). Earthquakes, records, and nonlinear MDOF responses. Earthquake Spectr. 14, 469–500. doi: 10.1193/1.1586011
Su, T. J., and Juang, J. N. (1994). Supplemental energy dissipation: state-of-the-art and state-of-the-practice. Eng. Struct. 24, 243–259. doi: 10.1016/s0141-0296(01)00092-x
Takanashi, K., and Nakashima, M. (1987). Japanese activities on on-line testing. J. Eng. Mech. 113, 1014–1032. doi: 10.1061/(asce)0733-9399(1987)113:7(1014)
Takewaki, I., Fujita, K., and Yoshitomi, S. (2013). Uncertainties in long-period ground motion and its impact on building structural design: Case study of the 2011 Tohoku (Japan) earthquake. Eng. Struct. 4, 119–134. doi: 10.1016/j.engstruct.2012.10.038
Thakkar, S. K., and Jain, S. K. (2004). “Optimal damping in isolation system,” in Proceedings of the 13th World Conference on Earthquake Engineering, Vancouver.
University of California San Diego (2010). Blast Simulator Specifications. HERI at UC San Diego. San Diego, CA: University of California San Diego
Warn, G. P., and Ryan, K. (2012). A review of seismic isolation for buildings: historical development and research needs. Buildings 2, 300–325. doi: 10.3390/buildings2030300
Weisstein, E. W. (2015). “Circular Segment.” From MathWorld–A Wolfram Web Resource. Available online at: https://mathworld.wolfram.com/CircularSegment.html (accessed June 12, 2020).
Wolf, J. P., and Skrikerud, P. E. (1979). Mutual Pounding of Adjacent Structures during Earthquakes. Nuclear Eng. Design 57, 253–275. doi: 10.1016/0029-5493(80)90106-5
Wood, R. L., and Hutchinson, T. C. (2012). Effects of ground motion scaling on nonlinear higher mode building response. Earthquakes Struct. 3, 869–887. doi: 10.12989/eas.2012.3.6.869
Keywords: real-time, hybrid, simulation, base-isolated, moat impact
Citation: Harris MJ and Christenson RE (2020) Real-Time Hybrid Simulation Analysis of Moat Impacts in a Base-Isolated Structure. Front. Built Environ. 6:120. doi: 10.3389/fbuil.2020.00120
Received: 14 March 2020; Accepted: 02 July 2020;
Published: 24 July 2020.
Edited by:
Vasilis K. Dertimanis, ETH Zürich, SwitzerlandReviewed by:
Manolis N. Chatzis, University of Oxford, United KingdomCopyright © 2020 Harris and Christenson. This is an open-access article distributed under the terms of the Creative Commons Attribution License (CC BY). The use, distribution or reproduction in other forums is permitted, provided the original author(s) and the copyright owner(s) are credited and that the original publication in this journal is cited, in accordance with accepted academic practice. No use, distribution or reproduction is permitted which does not comply with these terms.
*Correspondence: Michael J. Harris, TWljaGFlbC5oYXJyaXNAdWNvbm4uZWR1
Disclaimer: All claims expressed in this article are solely those of the authors and do not necessarily represent those of their affiliated organizations, or those of the publisher, the editors and the reviewers. Any product that may be evaluated in this article or claim that may be made by its manufacturer is not guaranteed or endorsed by the publisher.
Research integrity at Frontiers
Learn more about the work of our research integrity team to safeguard the quality of each article we publish.