 Karin Schakib-Ekbatan
 Sabine Lechner
 Marcel Schweiker
94% of researchers rate our articles as excellent or good
Learn more about the work of our research integrity team to safeguard the quality of each article we publish.
Find out more
ORIGINAL RESEARCH article
Front. Built Environ., 10 October 2019
Sec. Sustainable Design and Construction
Volume 5 - 2019 | https://doi.org/10.3389/fbuil.2019.00117
This article is part of the Research TopicEnvironmental Psychology and the Built EnvironmentView all 7 articles
Assessing building user needs and preferences is widespread and often questionnaire surveys are applied in order to assess environmental perception and satisfaction. A central question in this context is the quality of the questionnaires used, but little is known regarding their reliability. The present study addresses interdisciplinary aspects such as engineering and psychological sciences to answer the questions: Are the same item sets applicable in various settings (e.g., seasons)? Is there any difference in the reliability of item sets assessing user satisfaction in field vs. laboratory research? In the present study, reliability analyses of an item set regarding satisfaction with indoor climate including the ASHRAE thermal sensation scale (single-item) as well as the thermal preference question were conducted with respect to season, office type, age group, and sex. Field data were gathered via post occupancy evaluation from 46 office buildings in Germany. Additionally, comparable items from laboratory research were subjected to a reliability analysis. Results revealed predominantly good to excellent Cronbach's alpha values for the field studies. The values from the laboratory study were lower, although comparable (acceptable), partly due to the differences in variation in responses in field vs. laboratory settings. Results showed that questionnaires assessing user's satisfaction need to be set in relation with the given context for reliable interpretation. Further research could validate our results with larger samples for laboratory data. Interdisciplinary research is necessary in order to further develop methodological approaches in the field of user comfort research.
Post-occupancy evaluation (POE) is a valuable and often conducted process in order to get insights into occupants' subjective rating of their physical (e.g., thermal) as well as social (e.g., coordination with colleagues regarding change of thermal conditions) working conditions. Since the beginning of POE research done by pioneers such as Marans and Spreckelmeyer (1981), Brill et al. (2001), and Preiser et al. (1988) empirical reports show that for a well-grounded understanding of perceived quality of the working environment a series of influencing factors has to be considered such as temperature, air quality, lighting conditions, or noise. Marans and Spreckelmeyer (1981) and Preiser and Schramm (2005) developed a conceptual framework for building performance and integrated user feedback as an important basis for optimisations. Among the potential stressors at the workplace, complaints about thermal conditions at the workplace rank first when contacting the facility management, especially during summer (Martin et al., 2002). Due to the inter-individual and intra-individual differences, thermal comfort represents a particular challenge in room conditioning (including appropriate user control options). Wang et al. (2018) and Schweiker et al. (2018) summarized findings related to individual differences in thermal comfort regarding age and sex.
Despite the diversity of literature about influencing factors on user comfort, articles about reliability (the degree to which the results obtained by a measurement and procedure can be replicated) or validity (the degree to which the tool measures what it claims to measure) of applied questionnaires are scarce (see e.g., Pearson, 2009; Deme Belafi et al., 2018). The reliability of questionnaire scales is often assessed using Cronbach's alpha (α). It is a measure for the degree of relationship between several items of a scale or questionnaire (Cortina, 1993) (for further information see section Materials and Methods). Pearson (2009) stated that “there was a lack of consistency in measurement of comfort and researchers used a wide range of different scales and tools” (p. 301).
Deme Belafi et al. (2018) reviewed surveys of energy-related occupant behavior but all of the studies paid no or less attention to the issue of reliability or validity of survey questions. Humphreys (2005) analyzed data of 26 offices in Europe (the SCATs project) among others by e.g., correlation and regression analysis and stated that it is “impossible to develop an internationally valid index to rate office environments by means of a single number” (p. 317). Validity or reliability was not examined.
Guerin et al. (2013) made a valuable methodological contribution by analyzing reliability and validity for a post-occupancy evaluation questionnaire by factor analysis, internal consistency and multiple regression analysis based on data gathered in an office building in the US. Cronbach's alpha of different scales ranged from 0.75 to 0.86, indicating good internal consistency of their developed POE-questionnaire. Exploratory factor analysis (statistical method to uncover the underlying structure of a relatively large set of variables) revealed six factors: thermal conditions, acoustic conditions, indoor air quality, lighting/view conditions, personal controls, and furnishing conditions. Factor loadings ranged from 0.66 to 0.91 indicating good construct validity. In addition to the reliability of POE questionnaires, already in the 1980s, McIntyre (1982) raised the question of the comparability of field studies and laboratory research on thermal comfort. In Germany, a first comprehensive approach to reliability and validity of an instrument relating to occupant satisfaction at the workplace was given by Schakib-Ekbatan (2015). Based on data of 45 German office buildings a factor analysis of 63 items revealed six factors (room climate, lighting/view conditions, noise, spatial conditions, layout/cleanliness, furniture) explaining 55% of variance (Kaiser-Meyer-Olkin value of 0.93 showed a marvelous prerequisite for running a factor analysis). Reliability of the item subscales varied between “good,” e.g., 0.80 for room climate (temperature and air quality) and “excellent,” e.g., 0.91 for spatial conditions. Split-half testing revealed a Spearman Brown coefficient of 0.82. As a result of these analyses, a reliable and standardized survey instrument (INKA–German abbreviation for Instrument for User Surveys on Comfort at the Workplace) has been developed for the German Assessment System for Sustainable Building, a rating system for sustainable construction for federal office and administrative buildings (Federal Ministry for the Environment, Nature Conservation, Building and Nuclear Safety (BMUB), 2015).
With the objective to address some of the existing shortcomings, an interdisciplinary research group, consisting of an architect, a psychologist and a social scientist, applied a statistical method from psychology to the research field of user comfort to assess the quality of the questionnaires used. In the following, we apply the terminology commonly used in psychology to define scale and item. An “item” is defined as a basic element of a scale (e.g., to measure intelligence) or a single measurement of an e.g., personality trait (Asendorpf and Neyer, 2012). The content of an item can be a single question, statement, or opinion, which cause the respondent to react through an answer. The term scales has two meanings in the field of psychology: First, it is used for validated multi-item psychometric scales measuring constructs or phenomena such as intelligence or well-being, i.e., several items presented to the respondent, which are condensed into a single value for later analysis. Such definition has to be differentiated from the second meaning of the term “scale” as a rating scale gathering peoples responses to a single question or item. The rating scale can be of different scale levels, e.g., nominal or interval, specifying which statistical method to use. For describing our results presented in this article, we use the term “item set” because we did not intend to create a scale measuring user satisfaction, but analyzed a specific set of items.
The objective of this study was the analysis of a number of comparable items used in a field as well as in a laboratory study with respect to their reliability (Cronbach's alpha) regarding different settings (e.g., seasons, age groups…). Central questions in the present study were: are the same item sets applicable in various settings? Are there any differences in the reliability of the item sets assessing user satisfaction in field vs. laboratory research?
The focus of the present study is on thermal comfort and air quality as often complained stressors in the context of workplace. The findings contribute to the methodological issues regarding the assessment of thermal comfort as well as the adaption of analysis methods to the field of user comfort research.
The study protocol of the laboratory study was approved by the ethics committee of the Karlsruhe Institute of Technology (KIT) in March 2016. All subjects gave written informed consent in accordance with the Declaration of Helsinki.
Field data was collected from 46 office buildings (23 energy efficient, 23 conventional office buildings) in Germany between 2004 and 2018. Surveys were conducted twice: in winter (November–February) as well as during summer months (June–September).
All offices had daylight and natural ventilation, i.e., the windows could be opened by the users. The room temperature in winter could be regulated in all buildings by thermostats. Sun and glare protection varied greatly: the spectrum ranged from automated, manually overridable or purely manually operable systems to a lack of sun and glare protection.
On average, 54 persons were interviewed per building in winter. In 12 out of the 46 buildings, the number of respondents was >60. In summer, on average 48 persons were interviewed per building. In 7 out of 46 buildings, the number of respondents was >60. A total of 2,452 participants took part in the winter surveys and 2,050 participants in the summer months. A total of 4,502 data records were thus available. 54% were from female respondents, 46% from male participants. The proportion of female participants predominated with 53% in the winter months and 56% in the summer months. Most of the respondents (80.9%) worked in single and multi-person offices compared with group and open-plan offices (19.1%). Thirty percentage of the respondents were attributable to the age group 36–45 years, 29% to the age group 46 to 55 years, 23% of the participants aged 26 to 35 years, 11% were attributed to the age group over 55 years and 6.7% to the age group up to 25 years. A precise determination of how many identical persons participated in both surveys (winter and summer) was not possible due to restrictions, e.g., concerns of the works councils. Thus, a personal identification code on the questionnaire was dispensed in order to increase acceptance. Besides that, experiences from the first survey phase (2004–2006) using questionnaires with a code only allowed the identification of a small proportion of identical persons (19%, n = 312) for both survey times.
Occupants were asked to complete the questionnaire directly at the workplace. The return period of the questionnaire varied between 1 day and 3 weeks. In newly occupied buildings, a survey was carried out at the earliest 1 year after moving into the building, so that the users had sufficient time to get used to the building and to gain experience with the indoor environment in the winter and summer months. Complete surveys were carried out in each building, i.e., all employees was given the chance to participate in the survey. Different formats of questioning (paper pencil, online) were applied in the field studies due to the different technical options for online surveys in the buildings. Studies had shown that the data quality did not differ between different survey types (paper pencil vs. online) (Vogt, 1999).
The German survey instrument INKA (Schakib-Ekbatan, 2015) was applied. INKA was based on the Occupant Indoor Environment Quality Survey and Building Benchmarking, a POE instrument developed by the Center for the Built Environment (University of California, 2000). The main difference between INKA and CBE is the language: English vs. German. In addition, INKA has been expended by further items. Relevant for the work presented here is the addition of the 7-point thermal sensation ASHRAE-scale (single item) (American Society of Heating, Refrigeration and Air Conditioning Engineers (ASHRAE), 2004) (cold to hot) and a 5-point thermal preference scale (single item: prefer much cooler to prefer much warmer).
The LOBSTER–Laboratory for Occupant Behavior, Satisfaction, Thermal Comfort, and Environmental Research (http://lobster-fbta.de, Schweiker et al., 2014)–is a free-standing experimental building with two fully equipped offices with two workplaces each. The temperatures of room and surfaces can be controlled individually, so the LOBSTER is able to realize room temperatures from 15 to 35°C with homogenous distribution of the surface temperature of the walls. The measurement technique allows to capture physical parameters of the room as well as states of windows and doors (e.g., if windows are open, closed, or tilted).
Laboratory data was collected in the LOBSTER in the years 2016–2018 (Schweiker et al., forthcoming). Participant from two age groups (aged 18–32 years or aged 50–70 years) were randomly assigned to six thermal and visual conditions in every season (see Table 1).
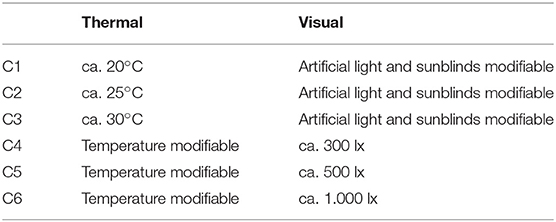
Table 1. Thermal and visual experimental conditions in the laboratory study.
One condition lasted half a day. The subjects had to change the room after lunch break to experience a different or the same condition. Altogether the subjects participated a maximum of 4 days per season (16 days a year, see Figure 1). The participants had to fill in several questionnaires after entering and before leaving the room regarding thermal and visual comfort, acoustic conditions, air quality, and psychological factors (e.g., control, personality). The items used for the present analysis were repeated up to 4 times per day (2 times per day in the same condition C1–C6).
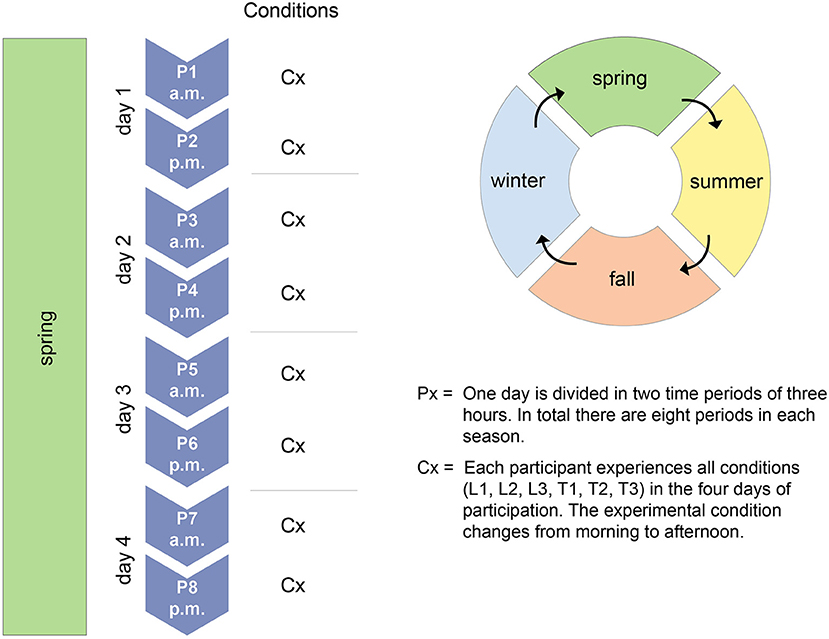
Figure 1. Study design for one subject.
In the LOBSTER study N = 988 measures from N = 61 subjects were obtained. N = 25 (40.98%) were 50–70 years old. N = 33 (54.10%) were male. The amount of measures/time points per subject ranged from N = 2 to N = 36. N = 7 (14.75%) participants completed all six conditions (plus two conditions doubled to enable a morning/afternoon comparison in later analysis) and participated for 4 days per season (16 days a year, N = 32 measures/time points). N = 44 (72.13%) subjects took part in every study condition but not in every season. Data from all N = 61 participants were analyzed.
Main differences result from the different foci of the studies: in the field survey the aim was to cover the whole range of workplace aspects. Therefore, the questionnaire included items relating to visual comfort, acoustic comfort, spatial conditions, layout/furniture, maintenance, overall satisfaction with the workplace and items relating to the characteristics of the office and the building (orientation, services etc.). The focus in the laboratory study was on thermal comfort and influencing factors like personality traits etc. leading to the application of a broader range of items related to thermal comfort such as the thermo-specific self-efficacy scale (Hawighorst et al., 2016) and the NEO-FFI scales Openness, Neuroticism and Extraversion (Borkenau and Ostendorf, 2008).
The analyses were carried out using SPSS (IBM SPSS Statistics, Version 25, IBM Corp. 2017). Reliability analyses were made by the reliability function of SPSS. Cronbach's alpha was used to analyse reliability in terms of internal consistency. Cronbach's alpha quantifies reliability on a certain time point under certain conditions. It is a measure for the degree of relationship between several items of a scale or questionnaire—also referred to as internal consistency—and should not be mistaken as homogeneity (unidimensionality) of a scale or questionnaire—which means that all items of a scale measure the same construct (Cortina, 1993). One instrument can produce different reliable measurements in different samples. In a very homogeneous sample, where there are hardly any true differences between individuals, the reliability may be smaller than in a heterogeneous sample with significant differences between individuals. Cronbach (1951) stated that when a test has good internal consistency than one can assume that every subject with the same score in a test or questionnaire marked the items in a similar manner. Cronbach's alpha is calculated according to
with N the number of items included, the variance of item i, and the variance of the overall scale or item set including all items.
Cronbach's alpha >0.70 suggests “a large portion of the variance in the test is attributable to general and group factors” (Cortina, 1993, p. 103). Items can be added to a sum score when Cronbach's alpha >0.80 (Brosius, 2018). Alpha values <0.50 are considered as inacceptable, >0.50 as poor, >0.60 as questionable, >0.70 as acceptable, >0.80 as good and >0.90 as excellent (George and Mallery, 2002).
The following items of the INKA questionnaire—used in the field study—and similar items used in the laboratory study were analyzed (see Table 2). It should be noted here that the questionnaires applied in field studies and in the laboratory study would be more comprehensive, but for the reported analyses we focused on items related to thermal comfort as well as to air quality.
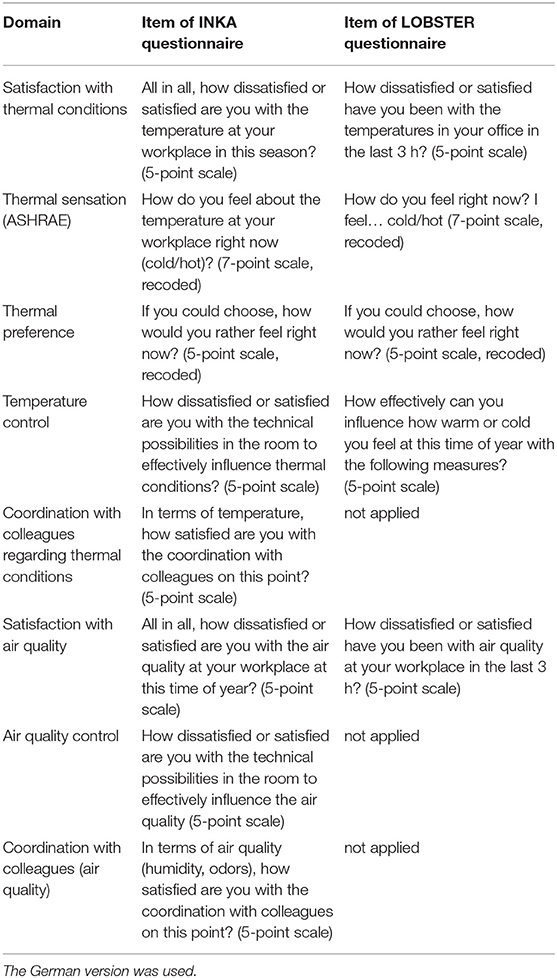
Table 2. Items of field (INKA) and laboratory (LOBSTER) questionnaires used in the present study.
The 7-point scale for thermal sensation (“How do you feel about the temperature at your workplace right now?”) and 5-point scale for thermal preference (“How would you rather feel right now?”) (see Table 3) were recoded, since the response significance was different (the middle code 0 is commonly considered as the most satisfactory rating) to the items capturing satisfaction (“How satisfied are you with…?”): e.g., “neutral” thermal sensation (= highest value 3) and “no change” in thermal preference (= highest value 3) correspond to “very satisfied” with temperature conditions (= highest value 5). Both scales retained their scale length but changed the numerical assignment of the codings. This procedure was chosen in order to keep the symmetry of the answer options. The differentiation of “warm” and “cold” codings was of less importance because we were interested in the comparability of the codings of thermal preference, thermal sensation and satisfaction for reliability analysis. We did not intend to make statements about the content relationships between the items, but about the reliability of the scale to which the items belong. All included items were z-standardized and hence being transformed into a standard normal distribution with mean value of 0 and standard deviation of 1. According to e.g., Bortz the variables are than comparable in terms of their metrics (Bortz, 2005, p. 539).
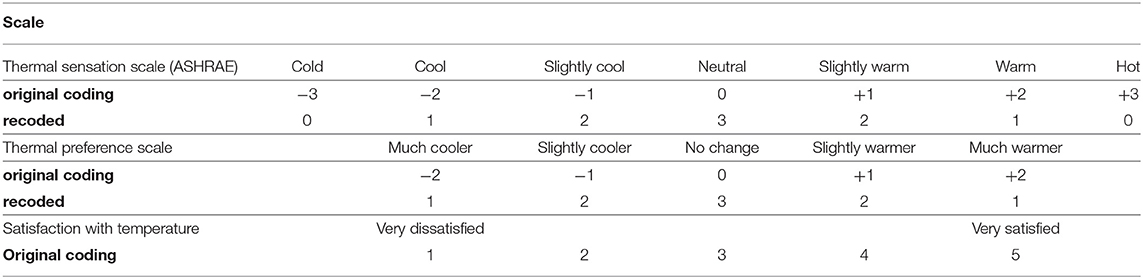
Table 3. Codings of thermal sensation, thermal preference, and satisfaction with temperature scales.
In the laboratory study items were repeated measures. Cronbach's alpha quantifies reliability on a certain time point under certain conditions. Therefore, in the present laboratory study, study conditions C1–C6 were defined as time points. The setting (e.g., age group) quantifies alpha “under certain conditions.” Reliability scores of N > 10 persons per time point and condition were reported. In the field study items were measured once per season.
Cronbach's alpha was calculated for the overall dataset and for subsets of the dataset relating to specific conditions: season (winter, summer), office type (single, two-person), sex (male, female) and age group (<32 years, >55 years). Figure 2 summarizes the employed methodology. Data for energy efficient vs. conventional buildings as well as for >2-person offices could only be computed for the field study because the laboratory data did not include such alternatives.
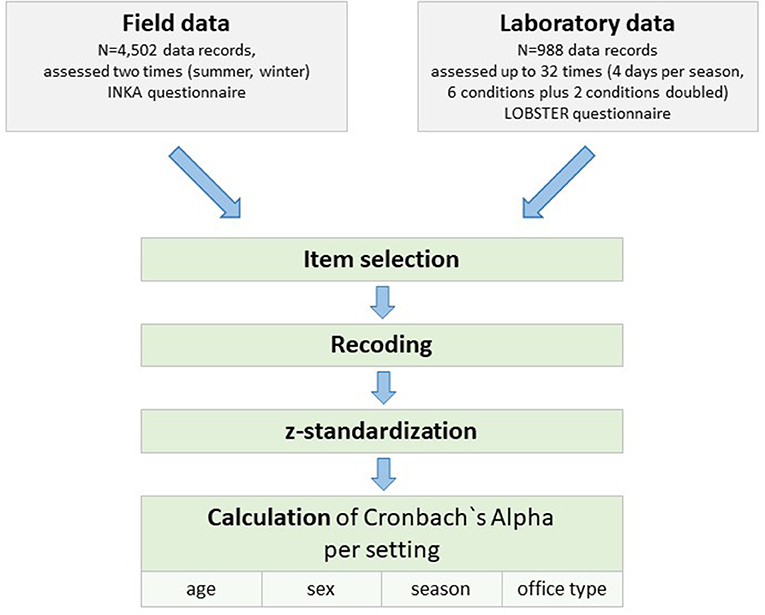
Figure 2. Steps of the methodology employed.
Looking at the values based on eight resp. six items from the field studies, reliability values from field studies vary between acceptable and excellent for the various conditions such as season, office type, gender and age (see Table 4). Values for summer are a bit lower than for winter, females had lower values than males. For the older age group slightly higher values occurred. For single offices, the value was slightly lower: overall reliability 0.83, winter 0.83 and summer 0.81. Number of persons per setting ranged from N = 69 to N = 991 due to different number of participants in the analyzed settings. Further analyses of the field data (not shown here) revealed comparable good Cronbach's alpha-values: for conventional buildings 0.83 (summer = 0.81, winter = 0.78), and for energy efficient buildings 0.84 (summer = 0.81, winter = 0.84). Also, for other office types good alpha values resulted (0.81 for offices with up to four persons, 0.86 for offices with five and more occupants). Looking at the analyses of the same item set (5 items) in the field as well as in the laboratory study it becomes clear that Cronbach's alpha values score almost always higher for the extended item set (eight resp. six items) applied only in the field study.
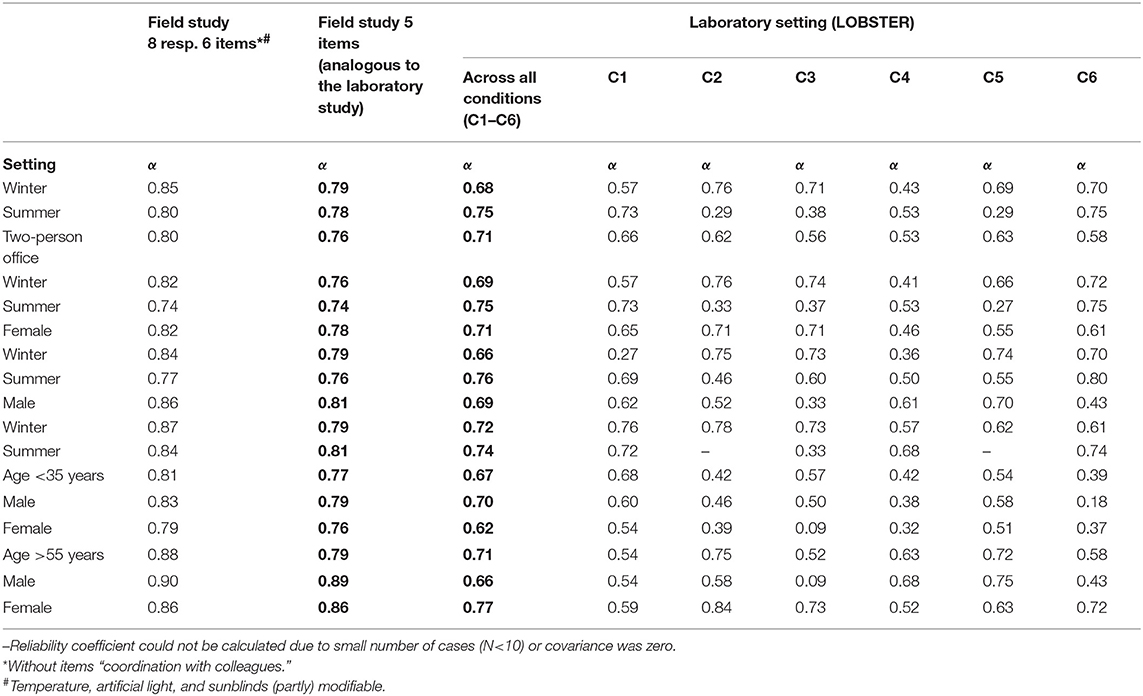
Table 4. Values of Cronbach's alpha for field vs. laboratory data in different settings (all items z-standardized).
Overall reliability (across all settings, seasons and conditions) of the laboratory data in the LOBSTER was 0.69, i.e., much lower compared to field data. Values of Cronbach's alpha for the subsets varied between 0.09 and 0.84. Number of measures ranged between N = 2 and N = 883 due to missing values. Only values for N ≥ 10 were reported. Therefore, seasonal differences in single offices could not be computed for every study condition due to small number of participants in each condition. Overall reliability for single office was 0.50 with 0.61 in winter and 0.75 in summer season. Across all study conditions Cronbach's alpha was higher for summer than winter. Regarding each study condition the values were inhomogeneous indicating that reliability was sometimes higher and sometimes lower in C4–C6 than in C1–C3-conditions. Males had slightly lower (overall) alpha values in the LOBSTER study than females, with reversed values in the field studies. Across all study conditions the younger age group had lower reliability scores than the older age group (α = 0.67 vs. 0.71). While in the age group >55 years males had lower reliability values than females, in the age group <32 years the pattern was reversed. In conditions where the temperature was adjustable by the participants (C4–C6), the reliability coefficients are in most settings lower than in conditions where artificial light and sun blinds were adjustable (C1–C3).
To our knowledge this is the first study to compare a reliability index (Cronbach's alpha) in field vs. laboratory research and in different settings (e.g., seasons, age groups…) regarding user satisfaction. Comparative values are therefore largely missing for the present results.
Another aspect is the different operationalization of variables in different studies, i.e., how the same construct, e.g., satisfaction, is transferred into a set of items. Therefore, the findings cannot be directly compared to the results of Guerin et al. (2013), because the derived factor thermal conditions was based on three items (satisfaction with temperature, humidity, and air velocity) while the present analysis is based on five items (resp. analyses based on the extended item set of six and eight items only applied in the field data). Nevertheless, the determined Cronbach's alpha values of >0.74 for the field data in the present study is comparable to the values retrieved by Guerin et al. (2013) who reached values above 0.75. Alpha values of the laboratory data are lower (>0.66) than reported by Guerin et al. and the values vary for the different conditions and settings.
The analysis of data from two different study types (field vs. laboratory) showed, that questionnaire scales need to be set in relation with the given context when appraising reliability. Overall reliability was comparable in the laboratory data when summarizing the individual study conditions (C1–C6) as one building type (= LOBSTER) for each setting. Some variation was found for sex and season. Across all study conditions Cronbach's alpha was higher for summer than winter indicating that variance of responses to questionnaire varies with seasonal influences. Males had slightly lower (overall) alpha values in the LOBSTER study than females, with reversed values in the field studies. Possibly the responses of males are less consistent than that of females in laboratory data. In conditions where participants were able to adjust the temperature themselves (C4–C6), the reliability coefficients are in most cases lower than in conditions where artificial light and sunblinds were adjustable by the participants (C1–C3). One reason might be that in homogeneous thermal conditions the variance of responses to items decreases and thus the value for Cronbach's alpha (or in other words: differences in the variance of indoor thermal conditions) led to different variances in item responses. Cronbach‘s alpha of the field studies can be interpreted as acceptable to good/excellent under different conditions indicating a robust set of items. Higher reliability values for the extended item set of 8 items (resp. six items) can be attributed to the fact that the reliability coefficient increases with the number of items. The questionnaire INKA captured more items for room climate (temperature and air quality) than used in the laboratory study, but with the same number of items as included in the laboratory study, the reliability scores for field data only slightly decreased. From an application point of view, the values for the field data indicate that measuring occupants' satisfaction should be based on comprehensive aspects of the assessed factor such as room climate, i.e., preferably a larger number of items. This is of course in contrast to the often stated goal of reducing the time involvement. Future studies would need to reveal an optimal balance between reliability and effort. The results presented here suggest that six to eight items are meaningful for reliable measures, while enabling respondents to answer within few minutes.
In general, analyses from the laboratory data revealed lower values in comparison to the field studies. One can think of different reasons for this observation. First, this finding could be partly reflecting the lower variance in the laboratory data due to a lower heterogeneity of the participants in comparison to the field sample. Second, it is possible that in the laboratory office the participants are more aware to room and environmental conditions than in the field offices resulting in less homogenous answers to the items and increasing variance in responses. At this point, it is meaningful to carefully review the equation used to calculate Cronbach's alpha (see Equation 1 above). Because the number of items is the same for the analysis of the LOBSTER data, the remaining terms influencing the value of Cronbach's alpha are the variance of each item, , and the overall variance, . In case the individual variance of one or more items decreases, the value of Cronbach's alpha increases, while a decrease in the overall variance leads to an increased value of Cronbach's alpha. The variance is dependent on the number of responses through:
with n the number of responses, xi the individual value and xi the mean value of an item.
Therefore, the variance of individual items and the overall variance both decrease with larger sample size under the condition that the differences between individual values and the mean value remain the same.
Looking at the results obtained above, the question arises whether a reliability measure such as Cronbach's alpha is a valid measure for questionnaires applied in the area of thermal comfort studies and which aspects need to be considered. In the laboratory studies, values of Cronbach's alpha are generally lower in conditions C4–C6, i.e., when participants were able to adjust conditions themselves. In such conditions, a general higher satisfaction with thermal conditions can be expected due to the increased level of control (Brager et al., 2004; Schweiker et al., 2012; Schweiker and Wagner, 2016). This higher level of satisfaction and control likely reduced the variance of four of the six items included in the scale for the laboratory study, namely influence in temperature (generally higher), thermal sensation (generally more to neutral), thermal preference (more toward no change) and overall satisfaction with temperature (generally higher). Consequently, Cronbach's alpha is lower for these conditions. The question arising now is what it means that the reliability of the scale is lower for such conditions. In the field of psychology, reliability is a measure of quality of a scale; but does the scale has a lower quality now, only because conditions are in general more favorable for participants?
This is a crucial point to consider when looking at the reliability of newly developed scales. The decision based on a limited set of variance in conditions could largely reduce Cronbach's alpha leading to a rejection of a scale as poor performing. However, the reason for the low value of Cronbach's alpha could be attributed to the limited variance the questionnaire was tested (see also Practical implications below), while in fact when applying the same questions in a variety of contexts this would lead to a high quality. At the same time, researchers should be aware, that it might be necessary to add additional items in laboratory studies in order to be able to differentiate between conditions not differing much in their main properties.
In the LOBSTER data repeated measures are included limiting the variation of answers per questionnaire item. The calculation of Cronbach's alpha is based on the number of items and the covariance between the items. Limited number of persons and items means limited covariance between the items resulting in decreased Cronbach's alpha values. It can be assumed that the participants in the (unfamiliar and short-duration) laboratory settings were more aware e.g., of the environmental conditions about which they were interviewed in contrast to the participants in the field study who based their assessment on familiar environments and more experienced copings strategies such as handling temperature or light controls. Low variance in the items regarding air quality in the thermal or lighting study conditions (C1–C6) in the laboratory data could have had an influence on the value of Cronbach's Alpha as well.
The present study contributes to methodological issues regarding the assessment of thermal comfort. As described above, in the course of the present analyses, the question arose as to whether this method of analysis, widespread in psychology, could be used to test items in the context of user comfort research and what problems might occur.
The results suggest that methods commonly used in psychology like Cronbach's alpha cannot be translated one-to-one into the context of user comfort research. In contrast to psychology where questionnaires are often applied once, researchers in the field of comfort research must take into account the different properties of a building or office if they want to get reliable statements about e.g., satisfaction with the room conditions. In the construction sector, the variance depends on the building or office properties while in psychology items are asked that way, that a sufficient variance in the items is ensured.
Another aspect worth mentioning is, that although wording of items was somewhat different in field vs. laboratory survey, e.g., “How do you feel about the temperature at your workplace right now?” (INKA) vs. “I am … cold/hot” (LOBSTER), values of Cronbach's alpha were comparably high. This suggests, that there is a lower influence of the exact wording, while of course it is still recommended to use existing questions from previous research or standards, such as ISO 10551 (1995). Recoding the ASHRAE thermal sensation scale and the thermal preference scale allowed to integrate them in the item set and thus enriching the assessment of occupants' thermal satisfaction. The way we recoded the 7-point-scale by coding neutral (0) as the highest expression for satisfaction (3) is debatable referring to Humphreys and Hancock (2007) survey results as well as recent studies (Schweiker et al., 2017; Fuchs et al., 2018), pointing out that the desired sensation of people often varies between slightly warm, warm and slightly cool. This indicates that neutral might not be the optimum. For the purpose of comparing items, we decided for a symmetric recoding. Thus, our approach can be seen as a first attempt to include the often applied ASHRAE scale (single item) and thermal preference item into reliability analyses. Based on the presented analysis, the item set used here can be considered as a first suggestion of items used to assess user satisfaction in terms of thermal conditions and air quality. The present item set showed high reliability though the studies were not coordinated in advance and had different backgrounds. Still, we wanted to take the chance of the existing datasets to enlarge the discussion regarding reliability. It was not the aim to establish a scale that is comprehensive or complete for the field of thermal comfort. There is likely another combination leading to even higher reliability values when including other aspects such as influence on air quality.
Further research could validate our results with bigger samples for laboratory data or by using questionnaires coordinated for field and laboratory studies. Interdisciplinary research is desirable to adapt psychological methods like Cronbach's alpha in the context of user comfort research. Cronbach's alpha is a method based on classical test theory (CTT) which itself has been the basis for measurement theory and the development of psychometrically scales for over 80 years (Kline, 2005). Some critics, e.g., that CTT does not consider sample dependencies, led to the development of item response theory (IRT). IRT is—like CTT—a theoretical basis for measurement but tries to solve practical measurement problems occurring in practical research, e.g., in the course of the development of adaptive testing (Embretson and Reise, 2000). One could complement the present data analysis when conducting item analysis based on IRT to consider sample dependencies, e.g., in the context of repeated measures. An interdisciplinary qualitative research approach could answer the question whether the formulation of a question has an influence on the reliability of an item or scale.
The datasets for this manuscript are not publicly available because of reasons of data protection. Requests to access the datasets should be directed to MS,bWFyY2VsLnNjaHdlaWtlckBraXQuZWR1.
The study protocol of the laboratory study was approved by the ethics committee of the Karlsruhe Institute of Technology (KIT) in March 2016. All subjects gave written informed consent in accordance with the Declaration of Helsinki.
KS-E modified the questionnaire applied in the field studies, conducted the field surveys and analyzed the data. MS conceptualized and designed the experiment. SL analyzed the laboratory data. KS-E, MS, and research assistants acquired the data. SL and KS-E drafted the article, MS critically revised the article. All authors discussed and were involved in the interpretation of the results, and approved the final version of this article.
This study was conducted within the WIN-project “Thermal comfort and pain” funded by the Heidelberg Academy of Sciences and Humanities. The analysis benefitted from discussion within IEA EBC Annex 69–Strategy and Practice of Adaptive Thermal Comfort in Low Energy Buildings. The field studies were supported by the Federal Ministry for Economic Affairs and Energy (0327431F), and the Federal Institute for Research on Building, Urban Affairs and Spatial Development (NuBeFra Az SF−10.08.18.7-10.8, Z6–10.08.18.7-08.8). The laboratory study was funded by the Federal Ministry of Economics and Energy (BMWi, 03ET1289B).
The authors declare that the research was conducted in the absence of any commercial or financial relationships that could be construed as a potential conflict of interest.
We would like to express our thanks to Elke Gossauer and other research assistants for supporting data collection.
American Society of Heating Refrigeration and Air Conditioning Engineers (ASHRAE). (2004). Thermal Environmental Conditions for Human Occupancy (ASHRAE Standard 55-2004). Atlanta, GA: ASHRAE.
Asendorpf, J. B., and Neyer, F. J. (2012). Psychologie der Persönlichkeit. Heidelberg: Springer. doi: 10.1007/978-3-642-40369-9
Borkenau, P., and Ostendorf, F. (2008). NEO-Fünf-Faktoren-Inventar nach Costa und Mc Crae. Göttingen: Hogrefe.
Brager, G. S., Paliaga, G., and de Dear, R. (2004). Operable windows, personal control, and occupant comfort (RP-1161). ASHRAE Trans. 110, 17–35. Retrieved from: https://escholarship.org/uc/item/4x57v1pf
Brill, M., and Weidemann, S. B. A. (2001). Disproving Myths About Workplace Design. Jasper: Kimball International.
Cortina, J. M. (1993). What is coefficient alpha? An examination of theory and applications. J. Appl. Psychol. 78, 98–104. doi: 10.1037/0021-9010.78.1.98
Cronbach, L. J. (1951). Coefficient alpha and the internal structure of tests. Psychometrika. 16, 297–334. doi: 10.1007/BF02310555
Deme Belafi, Z., Hong, T., and Reith, A. (2018). A critical review on questionnaire surveys in the field of energy-related occupant behaviour. Energy Efficiency 11:2157. doi: 10.1007/s12053-018-9711-z
Embretson, S. E., and Reise, S. P. (2000). Item Response Theory for Psychologists. New Jersey: Lawrence Erlbaum Associates.
Federal Ministry for the Environment Nature Conservation, Building Nuclear Safety (BMUB). (2015). Guideline for Sustainable Building - Future-Proof Design, Construction and Operation of Buildings. Berlin: Self-publishing. Retrieved from: https://www.nachhaltigesbauen.de/sustainable-building-english-speaking-information/guideline-for-sustainable-building.html
Fuchs, X., Becker, S., Schakib-Ekbatan, K., and Schweiker, M. (2018). Subgroups holding different conceptions of scales rate room temperatures differently. Build Environ. 128, 236–247. doi: 10.1016/j.buildenv.2017.11.034
George, D., and Mallery, P. (2002). SPSS for Windows Step by Step: A Simple Guide and Reference, 4th Edn. Boston: Allyn & Bacon.
Guerin, D. A., Kim, H. Y., Brigham, J. K., Choi, S., and Scott, A. (2013). Validity and reliability testing of a post-occupancy evaluation questionnaire on indoor environmental quality and occupants' satisfaction. Int. J. Sustain. Design 2, 128–148. doi: 10.1504/IJSDES.2013.057122
Hawighorst, M., Schweiker, M., and Wagner, A. (2016). Thermo-specific self-efficacy (specSE) in relation to perceived comfort and control. Buil. Environ. 102, 193–206. doi: 10.1016/j.buildenv.2016.03.014
Humphreys, M. A. (2005). Quantifying occupant comfort: are combined indices of the indoor environment practicable? Building Res. Inf. 33, 317–325. doi: 10.1080/09613210500161950
Humphreys, M. A., and Hancock, M. (2007). Do people like to feel “neutral”? Exploring the variation of the desired thermal sensation on the ASHRAE scale. Energy Build. 39, 867–874. doi: 10.1016/j.enbuild.2007.02.014
ISO 10551 (1995). Ergonomics of the Thermal Environment–Assessment of the Influence of the Thermal Environment Using Subjective Judgement Scales. Geneva: International Organization for Standardization.
Kline, T. J. B. (2005). Psychological Testing - A Practical Approach to Design and Evaluation. London: SAGE Publications.
Marans, R. W., and Spreckelmeyer, K. F. (1981). Evaluating Built Environments: A Behavioral Approach. Michigan: University of Michigan.
Martin, R. A., Federspiel, C. C., and Auslander, D. M. (2002). Responding to thermal sensation complaints in buildings. ASHRAE Trans. 108, 407–412.
McIntyre, D. A. (1982). Chamber studies-reductio ad absurdum? Energy Build. 5, 89–96. doi: 10.1016/0378-7788(82)90003-2
Pearson, E. J. M. (2009). Comfort and its measurement–a literature review. Disabil. Rehabil. Assistive Technol. 4, 301–310. doi: 10.1080/17483100902980950
Preiser, W. F. E., Rabinowitz, H. Z., and White, E. T. (1988). Post Occupancy Evaluation. New York, NY: Van Nostrand.
Preiser, W. F. E., and Schramm, U. (2005). “A conceptual framework for building performance evaluation,” in Assessing Building Performance, eds W. F. Preiser, and J. C. Vischer (Oxford: Elsevier, 15–26.
Schakib-Ekbatan, K. (2015). Bürogebäude auf dem Prüfstand: Zur Zufriedenheit mit Raumklima und Raum am Arbeitsplatz unter Einbindung der NutzerInnenperspektive in die Nachhaltigkeitsbewertung (Dissertation) Otto von Guericke University, Magdeburg, Germany. doi: 10.25673/4331
Schweiker, M., Barsche, S., Hawighorst, M., and Bischof, W. (2014). “Presenting LOBSTER, an innovative climate chamber, and the analysis of the effect of a ceiling fan on the thermal sensation and performance under summer conditions in an office-like setting,” in Proceedings of 8th Windsor Conference: Counting the Cost of Comfort in a Changing World (Windsor), 10–13.
Schweiker, M., Brasche, S., Bischof, W., Hawighorst, M., Voss, K., and Wagner, A. (2012). Development and validation of a methodology to challenge the adaptive comfort model. Building Environ. 49, 336–347. doi: 10.1016/j.buildenv.2011.08.002
Schweiker, M., Fuchs, X., Becker, S., Shukuya, M., Dovjak, M., Hawighorst, M., et al. (2017). Challenging the assumptions for thermal sensation scales. Build. Res. Inf. 45, 572–589. doi: 10.1080/09613218.2016.1183185
Schweiker, M., Huebner, G. M., Kingma, B. R. M., Kramer, R., and Pallubinsky, H. (2018). Drivers of diversity in human thermal perception – a review for holistic comfort models. Temperature 5, 308–342. doi: 10.1080/23328940.2018.1534490
Schweiker, M., and Wagner, A. (2016). The effect of occupancy on perceived control, neutral temperature, and behavioral patterns. Energy Build. 117, 246–259. doi: 10.1016/j.enbuild.2015.10.051
University of California C. for the B. E. (2000). Occupant Indoor Environment Quality Survey and Building Benchmarking. Retrieved from: https://cbe.berkeley.edu/resources/occupant-survey/ (accessed September 9, 2019).
Vogt, K. (1999). “Verzerrungen in elektronischen Befragungen?” in Online Research, eds B. Batinic, A. Werner, L. Gräf, and W. Bandilla (Göttingen: Hogrefe Verlag, 127–143.
Keywords: field study, laboratory study, questionnaire, reliability, indoor climate, user satisfaction, POE
Citation: Schakib-Ekbatan K, Lechner S and Schweiker M (2019) Reliability of an Item Set Assessing Indoor Climate in Offices—Results From Field Studies and Laboratory Research. Front. Built Environ. 5:117. doi: 10.3389/fbuil.2019.00117
Received: 09 August 2019; Accepted: 24 September 2019;
Published: 10 October 2019.
Edited by:
Lindsay Joyce McCunn, Vancouver Island University, CanadaReviewed by:
Basak Gucyeter, Eskişehir Osmangazi University, TurkeyCopyright © 2019 Schakib-Ekbatan, Lechner and Schweiker. This is an open-access article distributed under the terms of the Creative Commons Attribution License (CC BY). The use, distribution or reproduction in other forums is permitted, provided the original author(s) and the copyright owner(s) are credited and that the original publication in this journal is cited, in accordance with accepted academic practice. No use, distribution or reproduction is permitted which does not comply with these terms.
*Correspondence: Karin Schakib-Ekbatan, a2FyaW4uc2NoYWtpYkBnb29nbGVtYWlsLmNvbQ==; Marcel Schweiker, bWFyY2VsLnNjaHdlaWtlckBraXQuZWR1
Disclaimer: All claims expressed in this article are solely those of the authors and do not necessarily represent those of their affiliated organizations, or those of the publisher, the editors and the reviewers. Any product that may be evaluated in this article or claim that may be made by its manufacturer is not guaranteed or endorsed by the publisher.
Research integrity at Frontiers
Learn more about the work of our research integrity team to safeguard the quality of each article we publish.