- 1Lawrence Berkeley National Laboratory, Berkeley, CA, United States
- 2Department of Civil and Environmental Engineering, University of California, Berkeley, Berkeley, CA, United States
Collecting energy use data is becoming common practice in the buildings sector. Current applications include understanding regional energy flows in the building stock, and tracking energy performance of individual buildings. Beyond these, research and commercial applications of building energy data are as yet unexplored. Research is needed to provide insight into the data being collected, to identify appropriate applications of these data, and opportunities to improve data collection efforts. To that end, we present an exploratory analysis of the existing public large-scale building energy datasets, focusing on the two largest datasets: the Commercial Building Energy Consumption Survey and the Building Performance Database. We provide backgound information on both datasets, present an overview of the detail and sparsity of information in each, and report on the relationships we observe between data fields included in the two datasets, and compare our findings with results from the literature. We discuss how these results could be applied to support energy efficiency investments, and opportunities to improve data collection efforts to ensure that the data collected are adequate to provide insight into building energy consumption and support novel applications of building energy data.
1. Introduction
In recent years, empirical data and data-driven decision support tools have been transformational in numerous industries including marketing (Bryand et al., 2008), crime-fighting (U.S. Departments of Transportation and Justice, 2009), and political campaigning (Issenberg, 2012). The success of these tools in other industries has led to speculation about the role big data can play in buildings, for example to scale up investments in energy efficiency.
Numerous studies (e.g., Pacala and Socolow, 2004; McKinsey & Co., 2009; Williams et al., 2011) suggest that relatively modest investments in energy efficiency at scale can yield large energy and economic savings for the buildings sector. These studies rely on engineering-based models to predict energy savings. Uncertainty in these predictions combined with high retrofit costs are thought to present a major barrier to eliciting the scale of investment needed to unlock deep energy savings in the building stock (Mills et al., 2004).
Unlike engineering-based models, data-driven algorithms can quantify uncertainty in energy use and energy savings predictions, with or without detailed information about building characteristics. By quantifying uncertainty, these algorithms can help stakeholders to identify low-risk and/or high-savings building retrofits. However, data-driven algorithms are thought to be limited by the quantity, quality, and scope of the supporting data.
A recent increase in building data collection has led to parallel efforts to aggregate (Mathew et al., 2015) and summarize (Kontokosta, 2012a; Hsu, 2014a,b) the available data, and to develop data-driven algorithms for modeling building energy consumption (Kontokosta, 2012b; Hsu, 2014a, 2015; Walter et al., 2014). Mathew et al. (2015) and Brown et al. (2014) identify the Building Performance Database (BPD) (U.S. Department of Energy, 2015a) as a candidate for supporting data-driven algorithms to inform investments in energy efficiency. Another candidate is the Commercial Buildings Energy Consumption Survey (CBECS) (U.S. Energy Information Administration, 2003).
The current work presents an exploratory analysis summarizing the building data available in the BPD and in CBECS, which are among the largest and most detailed sources of data about building energy consumption in the United States. This analysis presents just one of many possible studies these data could support, and is the first of several publications that rely these data. With this work, we aim to understand: (1) what information are available, (2) what are the limitations of these datasets, (3) what insights do these datasets provide into similarities/differences in energy use patterns among buildings, (4) are these insights consistent across the two datasets and with results in the literature, and (5) what additional data (if any) are needed to support the potential big-data applications discussed above. The key contributions of this work are to determine whether we can leverage the empirical building data available today confirm confirm or refute conventional knowledge about building energy use and identify/quantify energy efficiency opportunities, or whether more detailed data are needed to support these applications.
The current paper is structured as follows: section 2 reports on the emphasis and content of the two datasets. Section 3 outlines our analysis approach. Section 4 highlights the range and distribution of reported values for various data fields in different subsets of each database, and identifies relationships between these variables. Section 5 provides an interpretation of the results in section 4, and discusses the implications of these results on current and future applications of the data.
2. Data
2.1. Building Performance Database (BPD)
When we performed this analysis (March 2015), the BPD contained 45,000 commercial and 650,000 residential building records. To our knowledge, the BPD contains more buildings than any other public building dataset. BPD data are collected by independent agencies and volunteered for inclusion in the database. To date, more than 50 contributors have provided data (U.S. Department of Energy, 2015b). Contributors include researchers, building owners, local governments, electric utilities, and federal agencies. CBECS is among the BPD's source datasets.
Unlike CBECS, representativeness is not considered in compiling data for the BPD. Because BPD relies on volunteered data, the dataset has an inherent bias toward buildings with benchmarked energy use. In practice, policy and market influences make benchmarking more common among certain subsets of the building stock than among others. Furthermore, individual contributors typically provide data for portfolios of buildings they own, manage or track for other reasons. More often than not, these portfolios share some attribute such as: geographic proximity, common ownership, or participation in an energy efficiency or building certification program. For example, because energy regulation typically happens at the local or state (rather than federal) level, certain regions are very well represented in the BPD, while others may be unrepresented altogether.
The BPD contains only the information provided by data contributors. Thus the level of detail in the dataset is constrained by the interests and expertise of the organizations/individuals that collect and/or volunteer the data. Table 1 lists reporting frequencies for the 24 most populated data fields in BPD; CBECS reporting frequencies for the same fields are also provided. The most commonly reported data fields (e.g., gross floor area) constitute the minimum requirements for inclusion in the database, as detailed in Custodio et al. (2014). The completeness and quality of other data fields is varies among data contributors. However, the BPD reports only measured (not predicted) values. Refer to Mathew et al. (2015) for further detail about BPD contents, data sources, and procedures for aggregation and quality control.
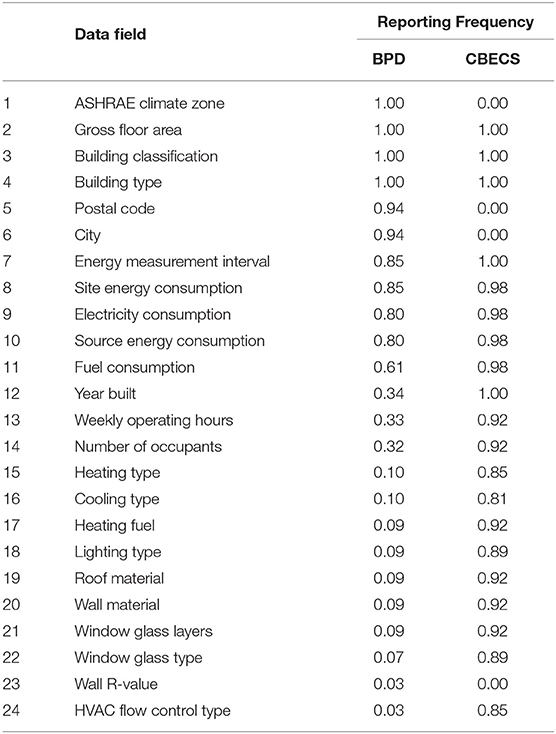
Table 1. Reporting frequencies in BPD and CBECS for the 24 most frequently reported data fields in the Buildings Performance Database.
2.2. Commercial Buildings Energy Consumption Survey (CBECS)
To our knowledge, CBECS is the most detailed public repository of commercial building energy and characteristics data available today. Because CBECS is collected through an in-person survey that covers all reported data fields, reporting frequencies are high for all surveyed data fields.
Through CBECS, the Energy Information Administration (EIA) aims to provide a representative snapshot of the U.S. building stock. The present analysis uses the 2003 survey data. Buildings in CBECS are sampled so as to capture a diverse cross-section of the building stock, and weighted based on the number of similar buildings in the larger building stock.
Because BPD is not representative of the larger building stock, the current analysis aims to understand relationships between variables in the two datasets. We do not intend to make inferences about relationships in the underlying building stock. Thus our analysis reports on the un-weighted values provided in CBECS building records and does not take into account the number of buildings each record represents in the larger building stock.
3. Methods
3.1. Exploratory Data Analysis
The current work aims to identify relationships between energy use and building characteristics using exploratory analysis (Behrens, 1997). We report on the range, distribution, Pearson correlation coefficient, and the slope of a least squares regression line fitted to the data. From these results, we identify similarities/differences in energy use among peer groups of buildings in the two datasets, and relationships between numeric data fields.
We select fields for analysis from each database based on data availability. Although CBECS contains many more data fields than we report on, the scope of the current work is limited to fields that are well populated in both datasets. We evaluate trends between energy use and each of five data fields: (1) gross floor area, (2) year built, (3) average weekly operating hours, (4) HDD, and (5) CDD.
3.2. Units of Measurement
We report energy use in terms of site (or delivered) energy consumption. Site energy consumption includes all electricity and other fuels (e.g., natural gas, fuel oil) used in a building (e.g., for heating and/or cooking). We follow the convention of reporting site energy consumption in SI units (MJ) to aggregate fuels streams characteristically reported in different units of measure, for example in kWh or by volume. Energy use is also commonly reported in terms of source (or primary) energy consumption. Source energy consumption is typically used to understand regional energy flows, while site energy consumption is used to understand energy flows and expenditures within a building. The two values can differ substantially due to losses during heat conversion and electricity transmission. Because the focus of this work is to report similarities/differences between individual buildings, rather than on drawing inferences about the larger building stock, we report building energy consumption in terms of annual site energy use (MJ) and annual site energy use intensity (MJ/m2).
3.3. Peer Group Analysis
Differences in energy use among buildings are related not only to physical and operational characteristics, but also to differences in energy useage patterns in various building types and climates. To highlight correlations in the data, we control for extraneous differences among buildings in two ways: (1) normalizing by observed correlates, and (2) filtering the database to compare buildings only with their peers with respect to building type or climate.
By comparing buildings with their peers, we aim to control for unreported or extraneous characteristics/consumption patterns common to certain subsets of the building stock. For example, defining regional peer groups controls for regional differences in building codes and heating/cooling requirements related to climate.
We identify trends in peer groups defined first by building type, then by building location. The building types we examine include: education, office, and retail. Combined, these account for 75% of commercial buildings in the BPD, and 45% of buildings in CBECS. The locations we examine include: San Francisco and New York City. Although the two cities make up only a small fraction of buildings in BPD, they are illustrative examples of disparate climates.
CBECS building records report locations by census division, but provide no more granular location information. Therefore, we compare local BPD peer groups with CBECS peer groups defined by the census divisions that contain each local peer group. Although the local and regional building stocks differ, we expect differences in climate to be evident both locally (in BPD) and regionally (in CBECS).
3.4. Heating and Cooling Degree Days Calculation
Each building record in CBECS includes annual heating and cooling degree days (HDD and CDD) for the survey year, in this case 2003. Although HDD and CDD are not reported in the BPD, they can be computed using building location (postal code) and the energy measurement interval, given by start and end time stamps for energy use readings. We compute HDD and CDD by linking BPD data with orthogonal temperature data obtained from NOAA's Integrated Surface Database (ISD) (U.S. National Oceanic and Atmospheric Administration, 2014). We use reported building locations to identify the nearest weather station, and hourly temperature data for that weather station to compute HDD and CDD. We use base 65°F (18.3°C), as detailed in ASHRAE (2004). Only about 5% of building records in BPD report insufficient data to compute HDD and CDD using this approach.
4. Results
In the following sections, we identify and compare relationships between data fields for various peer groups of buildings in BPD and in CBECS.
4.1. Peer Groups by Building Type
Figure 1 shows a strong correlation between whole-building (site) energy use and gross floor area. Pearson correlation coefficients range from ρ = 0.83 to ρ = 0.96 among peer groups. Regression line slopes range from m = 0.77 to m = 1.12; the narrow range suggests that energy use scales similarly with respect to floor area for all three building types and in both datasets. Box-and-whisker plots illustrate the range and distribution of reported values along each axis.
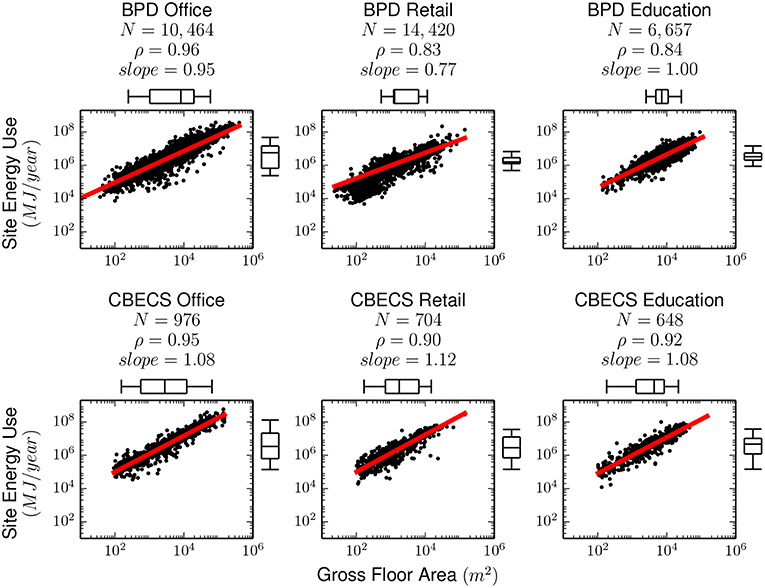
Figure 1. Scatterplot showing annual whole-building site energy use (MJ) (vertial axis) verses gross floor area (m2) (horizontal axis) for office, education and retail buildings in the Building Performance Database (BPD) and in CBECS. Red lines denote the least squares fit. The number of observations (N), Pearson correlation coefficient (ρ) and linear regression coefficient (slope) for each plot is provided. Box-and-whisker plots along the vertical and horizontal axes indicate the range of reported values along each axis; whiskers denote the 5th and 95th percentiles.
BPD peer groups in Figure 1 contain between 10 and 20 times more buildings than the corresponding peer groups in CBECS. As we examine other data fields with lower reporting frequencies, BPD peer group size declines by an order of magnitude due to data sparsity. Although CBECS peer group sizes do not change, BPD peer groups consistently outnumber their counterparts in CBECS.
The median energy use is similar across building types and datasets. The similarity is surprising, as some education buildings are only operational during the school year. The range and distribution of floor areas and energy use are also similar across building types and in both datasets. Retail and education buildings in BPD do report a narrower distribution of energy use than their counterparts in CBECS.
To control for the effect of floor area on site energy use, we examine subsequent trends in terms of annual energy use intensity (EUI) with units MJ/m2. Figure 2 reveals no correlation between EUI and floor area, with correlation coefficients ranging from ρ = −0.41 to ρ = 0.24. The range and distribution of values along the EUI axis are the same across all six peer groups.
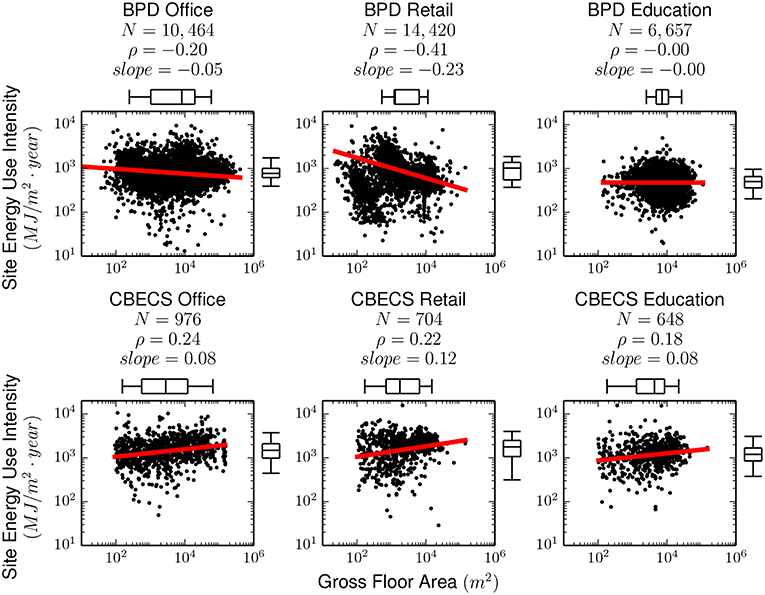
Figure 2. Annual energy use normalized by gross floor area (MJ/m2) verses gross floor area (m2) for office, education and retail buildings in the Building Performance Database (BPD) and in CBECS. All figure elements are shared with Figure 1.
Table 2 reports summary statistics by peer group for the most frequently reported data fields. We also list correlation and linear regression coefficients relating each data field to site EUI. We observe no strong correlations between site EUI and any other variables in the database.
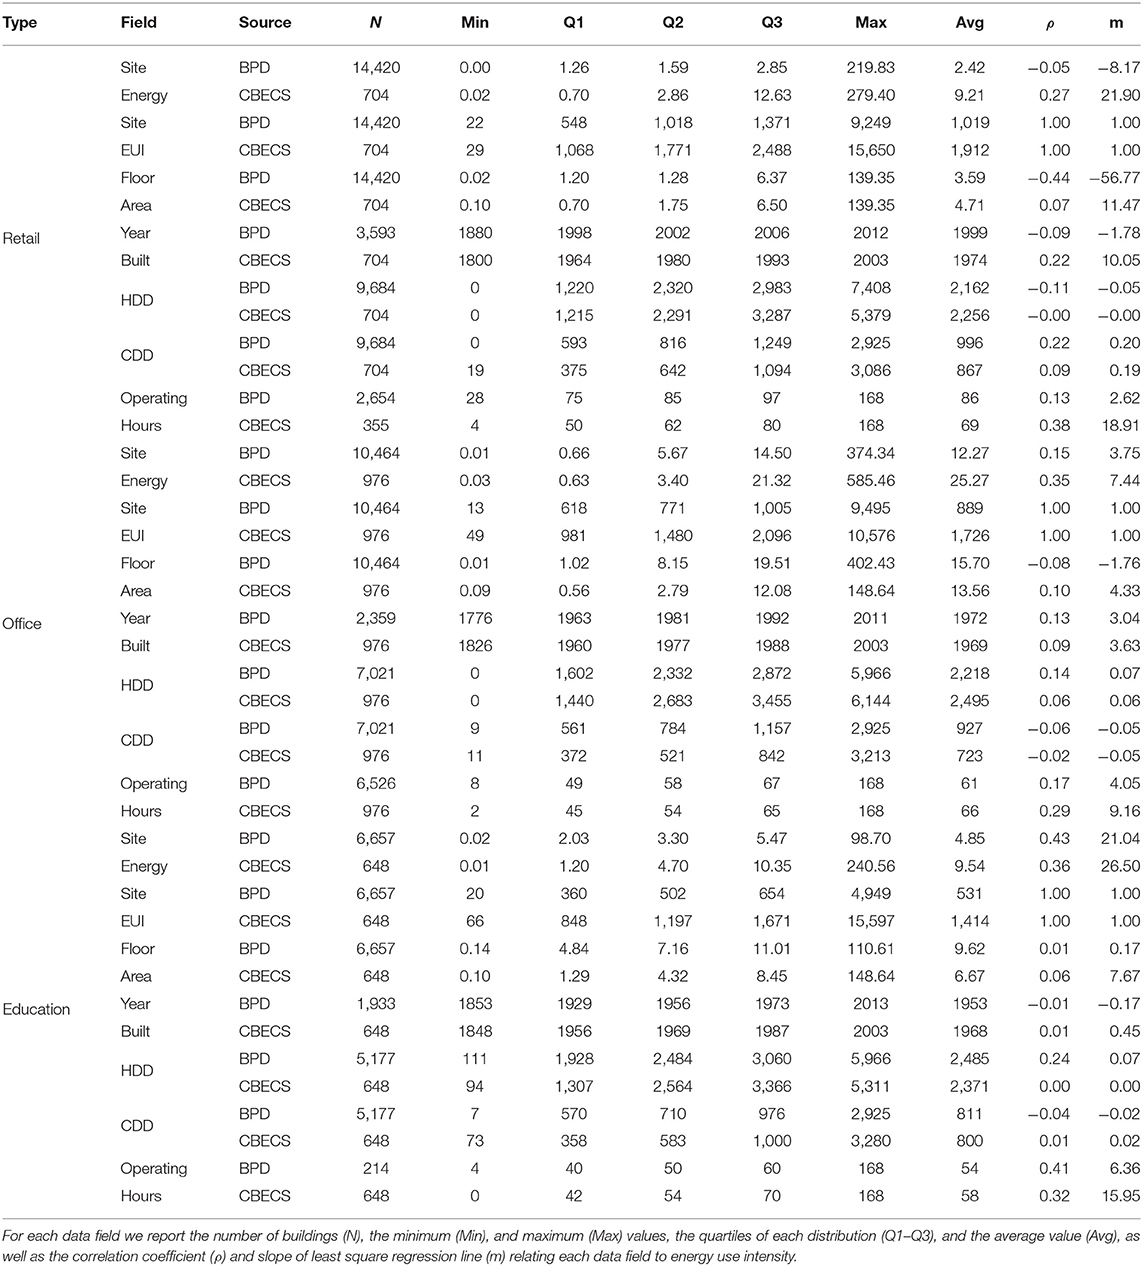
Table 2. Table showing range and distribution of reported values in BPD and CBECS for office, education and retail buildings.
4.2. Peer Groups by Building Location
Table 3 lists summary statistics for data fields by location. Again, we observe no strong correlations between site EUI and any other variables in either location. Given the differences in climate between San Francisco and New York, we expect that heating and cooling loads will be higher in New York than in San Francisco, and that these differences will be evident in site EUI. Although the distribution of site EUI for buildings in New York is shifted slightly to the right of the distribution for buildings in San Francisco, the difference is minimal, and the range of values is roughly the same in the two regions. These observations pertain to both BPD and CBECS peer groups.
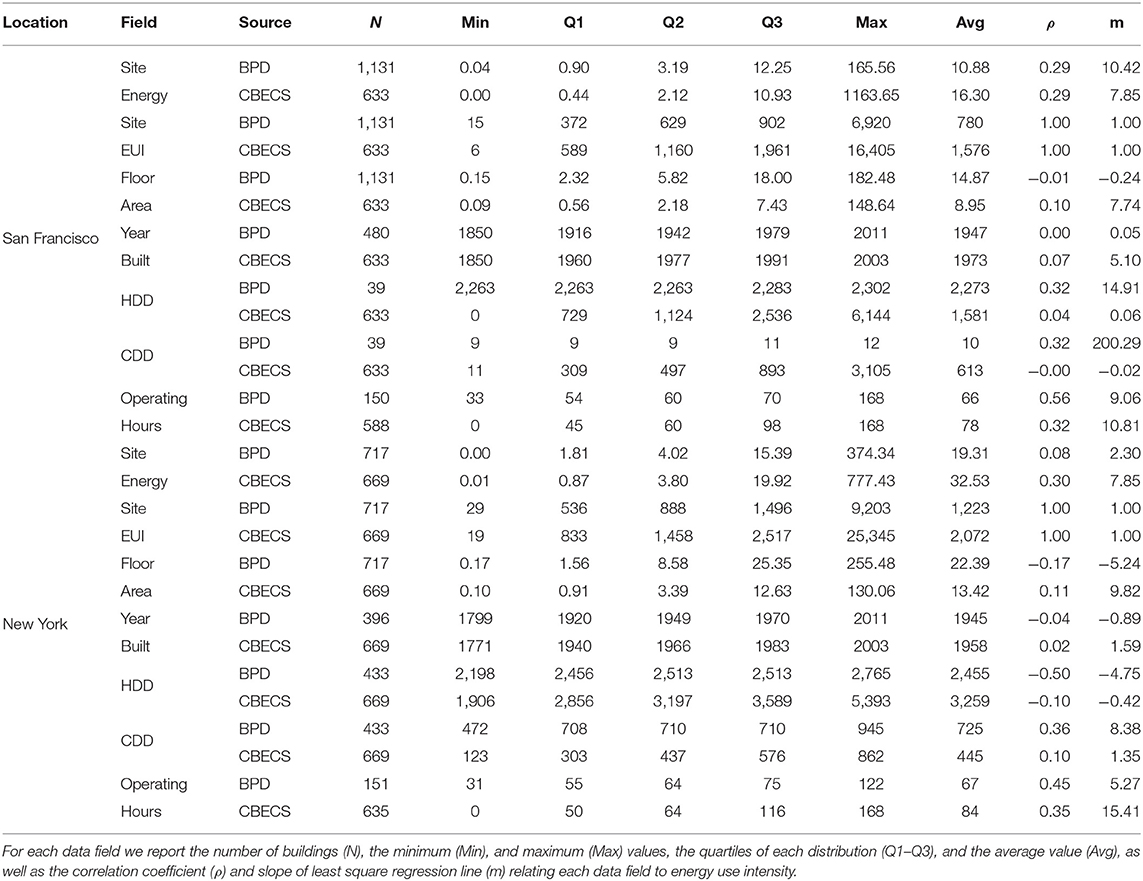
Table 3. Table showing range and distribution of reported values in BPD and CBECS for office, education and retail buildings.
We further investigate these differences in EUI by examining the cumulative distribution of EUI for various fuel types in each local peer group, as shown in Figure 3. Surprisingly, comparing buildings in San Francisco and New York, neither peer group is clearly more energy intensive than the other. Similarly, electricity use intensities among the two peer peer groups in CBECS are identically distributed. We do find that buildings in the regions with more extreme winters (New York and the Middle Atlantic) use slightly more fuel than buildings in the regions with milder climates (San Francisco and the Pacific). However, the observed differences in EUI are surprisingly small considering the vast differences in climate.
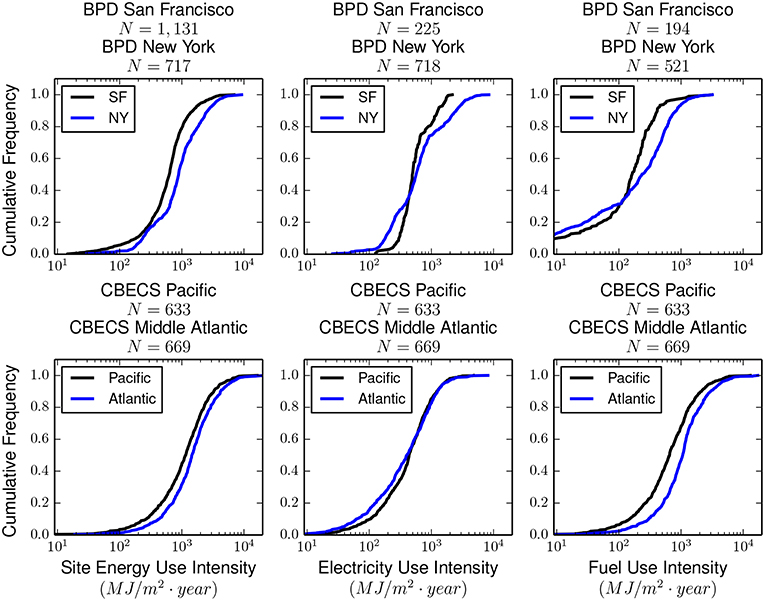
Figure 3. Cumulative distribution of annual whole-building, electricity, and fuel energy consumption normalized by gross floor area (MJ/m2) for commercial buildings in San Francisco and New York in the Building Performance Database (BPD), and commercial buildings in the Pacific and Middle Atlantic census divisions in CBECS.
5. Discussion
5.1. Distributions of Values
Comparing the range and distribution of values in each data field listed in Tables 2, 3, we observe only slight differences among buildings in the two datasets and among peer groups, including all three building types and both locations. We find that BPD peer groups are consistently more narrowly distributed than their counterparts in CBECS. Two factors contribute to the narrow distribution of values in BPD relative to CBECS. First, the range of values reported in CBECS is likely wide because CBECS captures a diverse cross section of the building stock (Hsu, 2015); the distributions of values in the building stock and in the weighted CBECS dataset are likely narrower than what we observe in the unweighted dataset. Second, BPD may represent only a narrow cross section of the building stock due to self-selection of buildings represented in the dataset.
5.2. Energy Use Correlates
The only clear correlation we observe is between floor area and whole-building energy use (Figure 1) with correlation coefficients (ρ) ranging from 0.83 to 0.96. The strong correlation is not surprising, and confirms conventional knowlege that energy use scales with floor area. Floor area is a key input in physics-based building models (Kavgic et al., 2010; Deru et al., 2011; U.S. Department of Energy, 2014).
Both Hsu (2014a) and Kahn et al. (2014) report a negative correlation between EUI and floor area in local subsets of the commercial building stock. We observe a weak negative correlation (rho = −0.43) among BPD buildings in New York, which is consistent with results in Hsu (2014a) for a comparable peer group of buildings in New York. However, we observe no such correlation in any other peer group.
Kontokosta (2012b) reports a positive correlation between EUI and operating hours among buildings in New York City; we also observe a weak correlation among BPD buildings in New York City and in San Francisco (see Table 3). Despite evidence of a weak correlation in select peer groups, fitted regression lines relating operating hours to EUI have approximately zero slope for nearly all peer groups. In other words, we observe no change in EUI with respect to different operating hours.
The lack of a relationship linking EUI to operating hours is surprising, and seems to suggest that buildings use as much energy while unoccupied as they do while occupied. Unoccupied buildings can often improve energy performance by scheduling reductions in loads designed to support occupant needs, such as HVAC and lighting. Thus the lack of a relationship between EUI and operating hours may point to an opportunity to reduce comsumption while buildings are unoccupied.
Results from the literature reporting on correlations between EUI and year built are mixed. Kontokosta (2012b) and Kahn et al. (2014) observe a positive correlation between EUI and year built, while Kolter and Ferreira (2011) observes no correlation. Our own results show no correlation in any peer group. That we observe no correlation does not necessarily prove a relationship does not exist, but rather that year built has less pronounced impacts on EUI than other differences between buildings.
Walter et al. (2014) observe a relationship between temperature and energy use in individual buildings at high tempeartures (or high CDD). Our own results show no similar correlation between EUI and either HDD or CDD. The lack of a correlation seems to suggest that buildings in moderate climates use as much energy as buildings in extreme climates. This result is surprising, as weather-sensitive loads (i.e., heating and cooling) often constitute a large portion of whole-building energy use. If confirmed, this result could reveal an opportunity to improve energy performance among buildings in moderate climates. However, the lack of a correlation may also suggest that differences in weather have less pronounced impact on EUI than other differences between buildings; controlling for those differences could reveal correlations not evidenced in Tables 2, 3.
To further explore the relationship between energy and climate, we compare whole-building, electricity, and fuel intensity between buildings in an extreme climate (New York City) and a moderate climate (San Francisco), shown in Figure 3. Based on climate normals, New York typically experiences twice as many HDDs and 20 times as many CDDs annually than San Francisco (U.S. National Oceanic and Atmospheric Administration, 2013). However, for the years on record in BPD, buildings in New York and San Francisco experience on average about the same HDDs (4,400 and 4,100, respectively), and buildings in New York only experienced about 10 times as many CDDs than buildings in San Francisco (on average 1,300 and 18, respectively). The observed similarities in HDD are due to a particularly mild winter in New York in 2011-12 (U.S. National Oceanic and Atmospheric Administration, 2015), which coincides with the energy measurement interval for most BPD buildings in New York. Thus the similarities in energy use between buildings in New York and San Francisco, as shown in Figure 3, are likely attributable to atypical weather in New York.
Because most of the buildings included in this analysis (for both BPD and CBECS) report only 1 year of energy use data, the current datasets do not necessarily capture typical regional and seasonal trends in energy use. Both datasets could benefit by incorporating multiple years of energy use data to reduce the impact of atypical weather on regional trends in energy use. Further, collecting monthly or daily interval energy use data may provide further insight into seasonal energy use patterns in heating/cooling loads.
6. Conclusion
Current empirical building data reveals limited insight into the factors that drive energy use in buildings. Our results show that, with the exception of floor area, the building characteristics collected today are largely uncorrelated with energy consumption. However, we exercise caution in drawing conclusions based on these results due to the limited size and depth of the current datasets. Although we control for building type, building size, and location, controlling for other characteristics or for different combinations of characteristics may reveal trends that are not evidenced in the current analysis. A large, detailed, and high-quality dataset with information about building energy use and characteristics is needed to support a more detailed analysis. Unfortunately, accuracy and detail are key limitations of the self-reported data that constitutes much of the BPD, while size is costly to achieve when administering a detailed survey such as CBECS. As a result of these limitations, no such dataset currently exists.
Key limitations of the current datasets include: low resolution of energy use data, sparse detail in BPD records, and the small number of buildings in CBECS. Addressing these limitations in future data collection efforts may increase the range of applications these datasets can support. The data may be used to identify specific opportunities to improve energy performance; for example, the lack of correlation between energy use and operating hours could suggest that buildings can improve performance by reducing consumption during unoccupied hours. These results could also be used to target outreach efforts to specific subsets of the building stock likely to see the highest every savings, such as buildings with relatively low operating hours.
Although more data can support more detailed analysis, the current datasets are capable of supporting broad analysis of buildings, for example to: (1) examine trends in energy use, (2) identify low-performing subsets of the building stock, or (3) evaluate the performance of buildings relative to their peers. Additional research is needed to determine whether the datasets are capable of supporting applications examining energy use drivers to: (1) identify inefficiencies in the building stock, (2) predict energy savings due to building retrofits, or (3) confirm or refute our current understanding of building physics.
The correlations and distributions of values we observe in BPD are largely corroborated in CBECS, and vise versa. Thus despite concerns we and others raise with data quality in self-reported datasets, we did not find that data quality changed broad conclusions drawn from the data. We caution that newer, more detailed, or higher quality data may be warranted to support certain applications of the data.
Finally, we find the magnitude and slope of trends to be nearly identical across all peer groups and datasets. These similarities suggest that certain trends in energy use are shared among diverse subsets of the building stock. That the same trends are present in both a representative and a clustered dataset further supports the conclusion that energy use correlates are shared between buildings of different types and and buildings in diverse climates.
Data Availability
The datasets analyzed for this study can be found in the Buildings Performance Database http://bpd.lbl.gov and Commercial Buildings Energy Consumption Survey https://www.eia.gov/consumption/commercial/data/2012/.
Author Contributions
MS defined the scope and direction of the work, and helped to prepare the manuscript for publication. LD did the analysis and drafted the manuscript.
Funding
This work was supported by the Assistant Secretary for Energy Efficiency and Renewable Energy of the U.S. Department of Energy under Contract No. DE-AC02-05CH11231.
Conflict of Interest Statement
The authors declare that the research was conducted in the absence of any commercial or financial relationships that could be construed as a potential conflict of interest.
Acknowledgments
The authors gratefully acknowledge Paul Mathew, Richard Brown, Travis Walter, Claudine Custodio, Andrea Mercado, and Michael Berger of Lawrence Berkeley National Laboratory for their support on this project.
Abbreviations
BPD, Buildings Performance Database; CBECS, Commercial Buildings Energy Consumption Survey; CDD, Cooling Degree Days; DOE, Department of Energy; EIA, Energy Information Administration; EUI, Energy Use Intensity; GIS, Geographic Information System; HDD, Heating Degree Days; ISD, Integrated Surface Database; NOAA, National Oceanic and Atmospheric Administration; RECS, Residential Energy Consumption Survey; kBTU, Thousand British Thermal Units; MJ, Megajoules (million joules); m2, Square meters.
References
ASHRAE (2004). ANSI/ASHRAE/IESNA STANDARD 90.1-2004. Technical report, American Society of Heating Refrigerating and Air-Conditioning Engineers, Inc.
Behrens, J. T. (1997). Principles and procedures of exploratory data analysis. Psychol. Methods 2, 131–160. doi: 10.1037/1082-989X.2.2.131
Brown, R. E., Walter, T., Dunn, L. N., Custodio, C. Y., Mathew, P. A., Cheifetz, D. M., et al. (2014). “Getting real with energy data: using the buildings performance database to support data-driven analysis and decision-making,” in 2014 ACEEE Summer Study on Energy Efficiency (Pacific Grove, CA).
Bryand, R. E., Katz, R. H., and Lazowska, E. D. (2008). Big-Data Computing: Creating Revolutionary Breakthroughs in Commerce, Science, and Society. Technical report, Computational Research Association.
Custodio, C. Y., Walter, T., Dunn, L. N., Mercado, A., Brown, R. E., and Mathew, P. A. (2014). Data Preparation Process for the Buildings Performance Database. Technical Report LBNL-6724E, Lawrence Berkeley National Laboratory.
Deru, M., Field, K., Studer, D., Benne, K., Griffith, B., Torcellini, P., et al. (2011). U.S. Department of Energy Commercial Reference Building Models of the National Building Stock. Technical Report NREL/TP-5500-46861, National Renewable Energy Laboratory.
Hsu, D. (2014a). How much information disclosure of building energy performance is necessary? Energy Policy 64, 263–272. doi: 10.1016/j.enpol.2013.08.094
Hsu, D. (2014b). Improving energy benchmarking with self-reported data. Build. Res. Informat. 42, 641–656. doi: 10.1080/09613218.2014.887612
Hsu, D. (2015). Identifying key variables and interactions in statistical models of building energy consumption using regularization. Energy. 83, 144–155. doi: 10.1016/j.energy.2015.02.008
Issenberg, S. (2012). The Victory Lab: The Secret Science of Winning Campaigns. New York, NY: Crown Publishing Group.
Kahn, M. E., Kok, N., and Quigley, J. M. (2014). Carbon emissions from the commercial building sector: the role of climate, quality, and incentives. J. Publ. Econ. 113, 1–12. doi: 10.1016/j.jpubeco.2014.03.003
Kavgic, M., Mavrogianni, A., Mumovic, D., Summerfield, A., Stevanovic, Z., and Djurovic-Petrovic, M. (2010). A review of bottom-up building stock models for energy consumption in the residential sector. Build. Environ. 45, 1683–1697. doi: 10.1016/j.buildenv.2010.01.021
Kolter, J., and Ferreira, J. (2011). “A large-scale study of predicting and contextuaizing building energy use,” in Proceedings of the Twenty-Fifth AAAI Conference on Artificial Intelligence (San Francisco, CA).
Kontokosta, C. E. (2012a). Local Law 84 Energy Benchmarking Data. Technical report, New York City Mayor's Office of Long-Term Planning and Sustainability.
Kontokosta, C. E. (2012b). “Predicting building energy efficiency using New York City benchmarking data,” in 2012 ACEEE Summer Study on Energy Efficiency in Buildings (Pacific Grove, CA).
Mathew, P. A., Dunn, L. N., Sohn, M. D., Mercado, A., Custodio, C., and Walter, T. (2015). Big-data for building energy performance: lessons from assembling a very large national database of building energy use. Appl. Energy 140, 85–93. doi: 10.1016/j.apenergy.2014.11.042
McKinsey & Co. (2009). Pathways to a low-carbon economy: version 2 of the global greenhouse gas abatement cost curve. Available online at: https://www.mckinsey.com/~/media/mckinsey/dotcom/client_service/Sustainability/cost%20curve%20PDFs/Pathways_lowcarbon_economy_Version2.ashx
Mills, E., Friedman, H., Powell, T., Bourassa, N., Claridge, D., Haasl, T., et al. (2004). The Cost-Effectiveness of Commercial-Buildings Commissioning: A Meta-Analysis of Energy and Non-energy Impacts in Existing Buildings and New Construction in the United States. Technical report, Lawrence Berkeley National Laboratory. LBNL-56637.
Pacala, S., and Socolow, R. (2004). Stabilization wedges: solving the climate problem for the next 50 years with current technologies. Science 305, 968–972. doi: 10.1126/science.1100103
U.S. Departments of Transportation and Justice (2009). Data-Driven Approaches to Crime and Traffic Safety (DDACTS): Operational Guidelines. Technical report.
U.S. Energy Information Administration (2003). Commercial Buildings Energy Consumption Survey (CBECS). (accessed November 14, 2014).
U.S. National Oceanic and Atmospheric Administration (2013). NOAA's 1981-2010 U.S. Climate Normals. (accessed March 16, 2015).
U.S. National Oceanic and Atmospheric Administration (2014). Integrated Surface Database. (accessed (January 6, 2015).
U.S. National Oceanic and Atmospheric Administration (2015). Heating/Cooling Degree Day Monthly Summary: Climate Prediction Center. (accessed May 12, 2015).
Walter, T., Price, P. N., and Sohn, M. D. (2014). Uncertainty estimation improves energy measurement and verification procedures. Appl. Energy 130, 230–236. doi: 10.1016/j.apenergy.2014.05.030
Keywords: building performance database, commercial buildings energy consumption survey, building energy data, building energy benchmarking, exploratory data analysis
Citation: Sohn MD and Dunn LN (2019) Exploratory Analysis of Energy Use Across Building Types and Geographic Regions in the United States. Front. Built Environ. 5:105. doi: 10.3389/fbuil.2019.00105
Received: 13 April 2019; Accepted: 26 August 2019;
Published: 12 September 2019.
Edited by:
Nahid Mohajeri, University of Oxford, United KingdomReviewed by:
Graziano Salvalai, Politecnico di Milano, ItalyHui Yan, South China University of Technology, China
Copyright © 2019 Sohn and Dunn. This is an open-access article distributed under the terms of the Creative Commons Attribution License (CC BY). The use, distribution or reproduction in other forums is permitted, provided the original author(s) and the copyright owner(s) are credited and that the original publication in this journal is cited, in accordance with accepted academic practice. No use, distribution or reproduction is permitted which does not comply with these terms.
*Correspondence: Michael D. Sohn, bWRzb2huJiN4MDAwNDA7bGJsLmdvdg==
 Michael D. Sohn1*
 Laurel N. Dunn