 Eli S. Hernandez
 John J. Myers
94% of researchers rate our articles as excellent or good
Learn more about the work of our research integrity team to safeguard the quality of each article we publish.
Find out more
ORIGINAL RESEARCH article
Front. Built Environ., 25 July 2019
Sec. Bridge Engineering
Volume 5 - 2019 | https://doi.org/10.3389/fbuil.2019.00096
This article is part of the Research TopicDiagnostic and Proof Load Tests on BridgesView all 16 articles
Bridge A7957 is the first Missouri Department of Transportation (MoDOT) large-scale project using self-consolidating concrete (SCC) and high-strength self-consolidating concrete (HS-SCC). The objective of this research was to monitor the initial in-service behavior of the precast-prestressed concrete primary elements of Bridge A7957 and to obtain the load distribution of the bridge using field and finite element models (FEM) data. An initial series of diagnostic load tests was conducted on the bridge superstructure. Embedded sensors recorded strain variations at different section of the instrumented girders for different load configurations. An automated total station (ATS) collected the vertical deflection of the girders at several locations during the application of different test loads. The load distribution for moment was obtained experimentally (using deflection and strain data), FEMs, and using the AASHTO LRFD Bridge Design Specifications. The distribution factors for moment estimated with the AASHTO LRFD equations resulted in larger values compared to field test and FEM results. No difference was observed between the response of the SCC and conventional concrete members during the first series of field load tests.
During the last two decades, self-consolidating concrete (SCC) and high-strength self-consolidating consolidating concrete (HS-SCC) have been successfully implemented in infrastructure projects due to its effective characteristics (Ouchi et al., 2003; McSaveney et al., 2011; Keske et al., 2014; Hernandez and Myers, 2015b). The flowable feature of SCC comes with a better consolidation and placement that result in fewer voids and honeycombing structures. The more condensed microstructure increases the durability properties of concrete, leading to a longer service life of the structure. This, combined with reductions in labor and equipment costs and decreased maintenance costs, lessens the overall initial investment of the project. In addition, HS-SCC brings an enhanced flexural performance to conventional SCC because of its greater compressive strength. This stronger flexural characteristic brings the possibility to reduce the number of main carrying members and interior supports of bridge structures. Despite the benefits that come with using SCC and HS-SCC, there are some concerns related to its structural and service behavior due to its constituent materials and proportions. The effect of the larger paste content and the smaller coarse aggregate size utilized in the mixture is of particular interest (Myers et al., 2012). Therefore, it is essential to monitor the in-service response of full-scale highway infrastructure utilizing self-consolidating and high-strength self-consolidating precast-prestressed concrete members.
An alternative for effectively evaluating the in-service performance of a bridge structure and its live load-carrying capacity is provided by field load tests. In general, the AASHTO Manual for Bridge Evaluation (MBE) defines two different test options: proof load tests and diagnostic load tests (American Association of State Highway Transportation Officials, 2015). Proof load tests are employed to obtain the maximum safe live load a bridge can withstand without undergoing inelastic deformations, while diagnostic load tests are used to better understand the in-service behavior of a bridge. Diagnostic tests are used to validate design assumptions and to verify the performance of a structure. Most of the times, a bridge load rating is improved after a diagnostic load test because this type of tests implicitly consider in situ parameters that are beneficial to the response of a bridge superstructure (Cai and Shahawy, 2003). The aim of this research was to obtain the bridge's experimental and FEM lateral load distribution for moment. A diagnostic test plan was proposed and conducted on Bridge A7957 to accomplish this goal.
Load rating consists of estimating the live load carrying capacity a bridge structure can withstand without suffering damage or undergoing collapse. One of the parameters used to obtain the rating factor of a bridge structure is the lateral load distribution. The AASHTO LRFD Bridge Design Specifications (American Association of State Highway Transportation Officials, 2017) presented a methodology for estimating the lateral load distribution factors that quantify the percentage of the live load applied to a bridge that is carried by a primary supporting member. This approach permits to simplify a three-dimensional (3D) structural analysis into a one-dimensional (1D) problem that is easier for design engineers to handle (Barker and Pucket, 2013). Live load effects, such as bending moments and shear forces, are multiplied by these factors to obtain a design effect that is applied to the 1D member instead of the whole 3D system. It is worth noting that the AASHTO LRFD does not present an approach that evaluates how live loads are distributed among the girders for in-service assessments of bridge structures. Instead, the AASHTO approach proposes a methodology that can be applied to bridges with a wide range of span lengths, girder spacings and stiffness to conservatively estimate distribution factors for bridge design (Harris et al., 2010).
The current AASHTO LRFD Bridge Design Specifications do not differentiate the design process for primary and secondary bridge structures. However, the Manual for Bridge Evaluation clearly defines two levels of bridge performance that are independent of the bridge importance. The first performance level is the inventory level that is compared to the capacity of new structures. The second level of performance is the operating level that is used to evaluate existing bridges that were designed for lighter loads than the ones adopted by the current AASHTO LRFD or for bridges that possess a reduced structural capacity due to deterioration. This level generally describes the maximum permissible live load that the structure may carry (Zhao and Tonias, 2012). The inventory and operating performance levels are differentiated by the load and resistance factors employed to obtain the live load effect at the respective level. Gheitasi and Harris (2015) evaluated the inelastic distribution behavior of two steel bridges subjected to varying loads and support conditions. Results emphasized the conservativeness of the girder distribution factors for moment as proposed by the AASHTO LRFD approach (both operational and inventory levels) since the applied load corresponding to the critical stage (ultimate capacity) was much larger than the service load. This study focused on using field data to obtain the in situ flexural lateral distribution factors of the bridge assuming the global response of the superstructure remains within the elastic range.
In the following sections, the instrumentation, field test program and a comparison between the PC/PS conventional concrete (CC) and SCC members' initial in-service response is presented. In addition, comparisons between the flexural load distribution factors obtained from field measurements, FEM, and the AASHTO LRFD approach are presented to estimate the differences that arise when these three alternative approaches are employed to assess the in-service response of a prestressed concrete bridge.
Bridge A7957, located along Highway 50 in Osage County, Missouri, is a three-span, continuous, PC/PS concrete bridge with a skew angle of 30 degrees (Figure 1). Each span employs PC/PS concrete Nebraska University (NU) 53 girders fabricated with different concrete mixtures. Girders in the first span are 30.48 m long and made of conventional concrete (MoDOT Class A mixture) with a target strength of 55.2 MPa. The girders of the second span measure 36.58 m and were fabricated with an HS-SCC mixture of 68.9 MPa. Girders in the third span are 30.48 m long and employ SCC with a nominal compressive strength of 55.2 MPa (Hernandez et al., 2014b; Hernandez and Myers, 2016c).
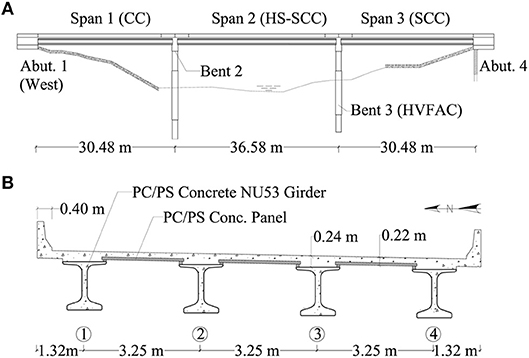
Figure 1. Bridge A7957: (A) elevation; (B) cross-section.
PC/PS concrete panels, with a target compressive strength of 55.2 MPa, span between the girders' top flange underneath the cast-in-place (CIP) reinforced concrete (RC) slab deck in the transverse direction (Figure 1B). The CIP deck was cast with a 25% fly ash replacement of a portland cement mixture with design strength of 27.6 MPa. The bridge superstructure is supported by two abutments and two intermediate bents (Figure 1A). The second intermediate bent and abutments were cast with a concrete mixture that had a 20% fly ash replacement of portland cement and a nominal compressive strength of 20.7 MPa. The third intermediate bent was built using high-volume fly ash concrete (HVFAC) with a 50% fly ash replacement of portland cement and a specified compressive strength of 20.7 MPa. The direction of traffic is along the west-east alienation as shown in Figures 1, 2, 5.
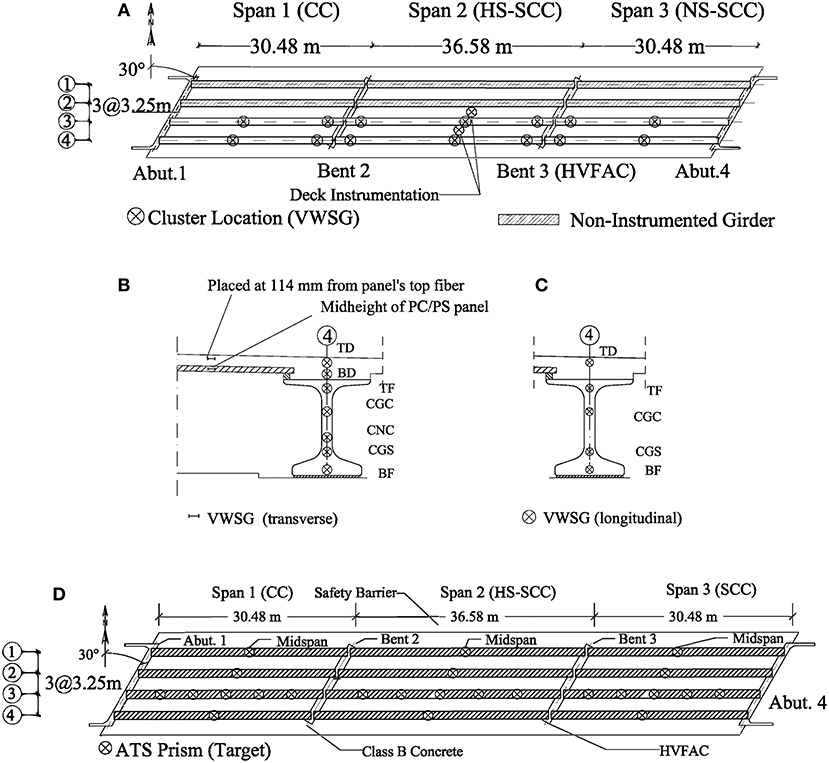
Figure 2. Bridge instrumentation details. (A) VWSG installation layout; (B) midspan cluster location; (C) near-end cluster location; (D) prism layout.
The structural elements of Bridge A7957 were instrumented during its preconstruction stage. The instrumented elements included: two PC/PS girders per span and two PC/PS panels (Figure 2A). The instrumented panels were placed between girder lines 2 and 3 and between girder lines 3 and 4 at midspan of the second span (Figure 2B). The type of sensors chosen to be employed and details about their installation are described in the following subsections.
A total of 86 vibrating wire strain gauges (VWSG) with built-in thermistors (type EM-5) were used to monitor temperature changes and stress variations from fabrication through service life (Hernandez et al., 2014a; Hernandez and Myers, 2015b).
A total of 62 VWSGs were installed in all spans within the PC/PS girders of lines 3 and 4 before casting. The PC/PS girders' cluster locations at which VWSGs were installed are illustrated in Figure 2. Within girders of spans 1 and 3, the instrumentation clusters were located at two critical sections: the first at the midspan and the second approximately 0.61 m from the support centerline of bents 2 and 3. The clusters in span 2 were arranged at three different cross-sections: one at the midspan and the other sections approximately 0.61 m from each support centerline. Details on the VWSGs installed at the girders' near-support and midspan sections before the concrete was cast are illustrated in Figures 2A,C. The following notation (Hernandez et al., 2014a,b) was used to define the location of the VWSGs within the PC/PS girders:
• TD: 150 mm above the bottom layer of the deck
• BD: 50 mm above the bottom layer of the deck (midspan only)
• TF: 50 mm below the top layer of the girder
• CGC: center of gravity of the composite section
• CNC: center of gravity of the non-composite section (midspan only)
• CGS: center of gravity of prestressed strands
• BF: 50 mm above the bottom layer of the girder.
VWSGs were installed within the CIP RC deck (Figure 2C) in the longitudinal direction (sensors TD and BD). A VWSG was transversely deployed at the mid-height of two selected PC/PS panels (Figure 2B). Finally, two VWSGs were in the transverse direction of the bridge, between girder lines 2 and 3 and girder lines 3 and 4. These two sensors were placed directly above the panels' sensors, separated 114 mm from the panels' top fiber (Figure 2A).
An automated total station (ATS), Leica TCA2003 with an accuracy of 1 mm + 1 ppm (distance measurements) and 0.5 arc-seconds (angular measurements), was employed to record the girders' vertical deflection during the live load tests. Twenty-four locations were selected to monitor the superstructure vertical deflection response. During the field test, the ATS continuously read the bar codes on the horizontal and vertical planes by projecting a laser ray to the targets (prisms) mounted on the structure (Hernandez and Myers, 2018a). The accuracy of the ATS has been reported to be ±0.1 mm in vertical deflection measurements (Merkle and Myers, 2004). Fifteen ATS prisms were deployed along the third girder at sections located at 1/6, 1/3, 1/2, 2/3, and 5/6 of the span length. In addition, three prisms were placed at the midspan section of the girders of each span (Figure 2D).
A monitoring test program, consisting of loading the superstructure during a series of field load tests, was developed to oversee the service response of Bridge A7957. The first series of diagnostic load tests was performed in April and August of 2014. MoDOT dump trucks loaded the bridge superstructure during the tests (Hernandez and Myers, 2016a). A total of thirteen test configurations are reported herein. Six dump trucks were employed during the first part of the first series of load tests (April 2014), and three trucks were used in the second part of the tests (August 2014). The trucks were fully loaded with gravel and sand before the tests were started. Figure 3 illustrates the different transverse load configurations and the average dimensions of the trucks employed during the test.
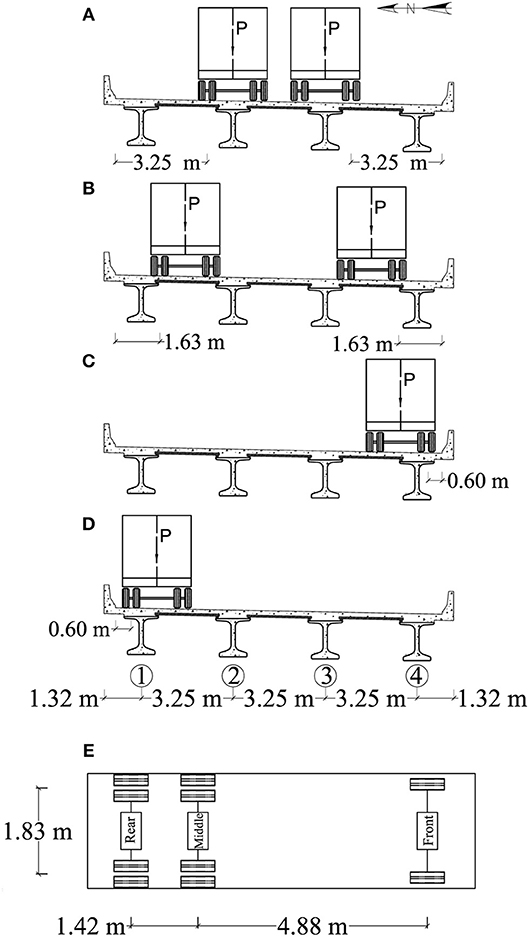
Figure 3. Distance from the trucks to the safety barrier and average truck dimensions. (A) Stops 1–6; (B) stops 7–9; (C) stops 10–12; (D) stop 13; (E) average truck dimensions.
Table 1 lists the weight of the axles of the truck (Figure 3D) as reported by MoDOT personnel at the beginning of the tests. The weight of the trucks was obtained weighing the front axle alone and the middle and rear axles set at once. For this reason, the weight of the rear and middle axles of a truck was considered as equally distributed between these two axles.
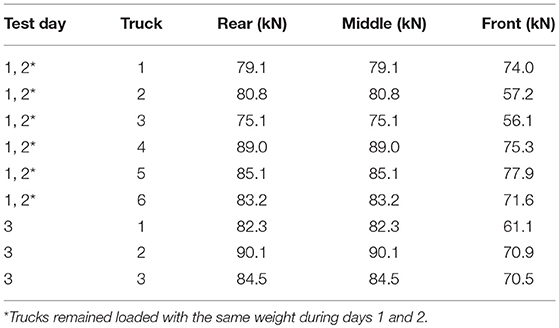
Table 1. Weight of trucks.
Figures 3, 4 show the load configurations (stops) used to obtain the maximum response of the bridge when a one or two lanes were loaded. The dimensions shown in Figure 4 represent the distance measured from the center line of a support (end abutment or pier cap) to a reference line used to locate the exterior wheels (close to safety barrier) of the front axle of trucks 1 and 4 during a test. For the first six load stops, the center of the exterior wheels of each truck was placed 3.25 m from the interior edge of the safety barrier, as shown in Figure 3A. In the case of load stops 1–3, two lanes of trucks were driven from east to west and were used to load the central region of spans 3, 2, and 1, respectively, as illustrated in Figures 4A,C.
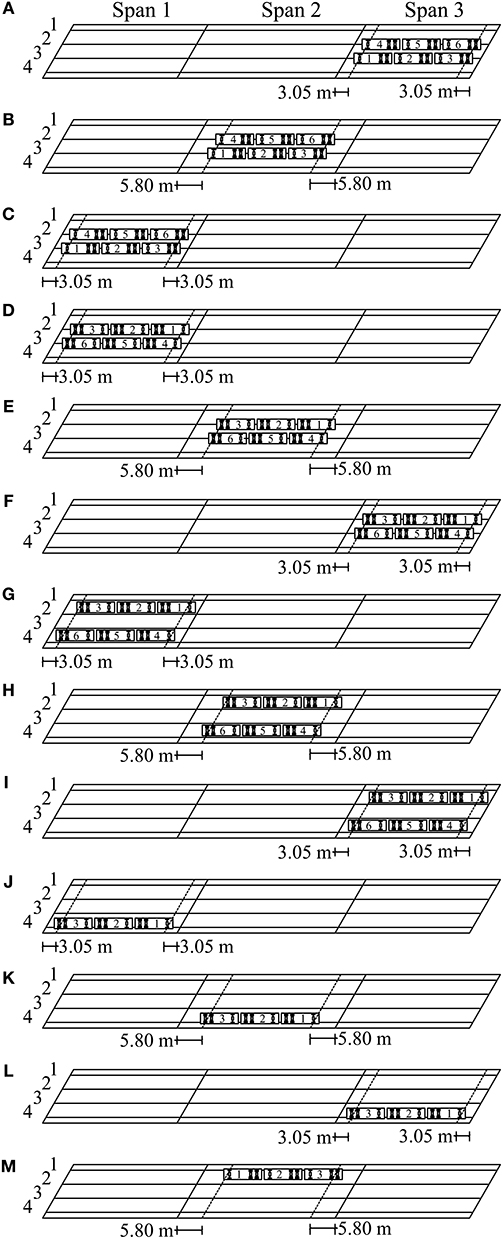
Figure 4. Static load test configurations. (A) Stop 1; (B) stop 2; (C) stop 3; (D) stop 4; (E) stop 5; (F) stop 6; (G) stop 7; (H) stop 8; (I) stop 9; (J) stop 10; (K) stop 11; (L) stop 12; (M) stop 13.
For load stops 4–6, the trucks were driven from west to east and placed at the center of spans 1, 2, and 3, respectively (Figures 4D,F). For load stops 7–9 (Figures 4G,I), the trucks were driven from west to east, and their exterior axles were located 1.63 m from the edge of the safety barrier (Figure 3B). It is important to notice that load stops 1–9 represented two-lane loads acting on the superstructure of Bridge A7957. For load stops 10–12 (Figures 4J,L), one lane of trucks was moved from west to east, and the trucks were parked on the south side of the bridge, 0.60 m from the edge of the safety barrier (Figure 3C). In the case of load stop 13 (Figure 4M), the lane of trucks was driven from east to west, and was placed on the north side of the bridge, 0.60 m from the edge of the safety barrier (Figure 3D).
Table 2 reports the longitudinal strain of the bottom flange obtained from experimental data recorded at midspan sections. These values correspond to the two-lane and one-lane load configurations described in the previous section. Larger strains were collected at midspan of the exterior and interior girders close to the area on which loads were applied. The measured strain values, obtained from two-lane load stop configurations acting on spans 1 and 3 (i.e., stop 1 vs. stop 3, stop 4 vs. stop 6, and stop 7 vs. stop 9), were compared. The maximum difference corresponded to a value close to 2%. No significant difference was observed in the in-service exterior and the behavior of the interior girders of spans 1 and 3.
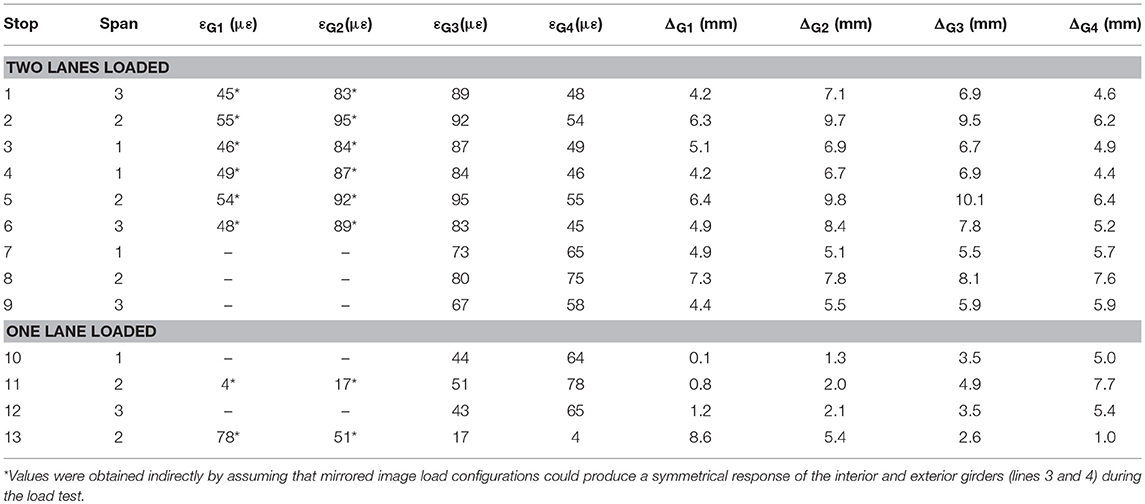
Table 2. Experimental strains and vertical deflections.
For load stops 7 and 9 (two-lane load cases), the difference in the reported strain values for the interior and exterior girders was close to 10 percent. This difference can be attributed to two possible causes. First, the axles of the truck that loaded the superstructure during these stops might have been placed at locations that did not correspond to the originally planned stop configurations (central region of the spans) shown in Figures 4G,I. Second, for the test stops 7–9, the vertical deflection was recorded only at the center line of the girders (midspan locations) due to time restrictions. The necessary time to record the bridge response during tests 7–9 was half the time employed to record the response of the bridge during stops 1–6 (12 vs. 24 min.). This reduction of the duration of the tests might have not allowed the bridge to undergo the total expected flexural response. Both possible sources of poor correlation need to be investigated in future series of load tests. However, the data collected for the two-lane load configurations in spans 1 (CC girders) and span 3 (SCC girders) were close. These results suggest that the flexural response of these spans was independent of the materials employed to fabricate the PC/PS girders.
Table 2 lists the vertical deflections obtained at midspan for the load stops described in the previous section. These deflection values were truncated to the accuracy of the ATS (Hernandez and Myers, 2015a, 2018b). As in the case of the experimental strains, larger deflections were recorded for the girders located close to the region of application of the test loads. Comparable values, corresponding to stops 1 and 3, stops 4 and 6, and stops 7 and 9 (two lanes loaded) were also obtained in spans 1 and 3. For the cases of one-lane loaded (stops 10 and 12), a larger difference ratio (approximately 18% in the case of girder 1) was observed when girders 1 and 2 of spans 1 and 3 were compared (see Table 2). This difference can be attributed to the accuracy of the ATS that is close to the measured deflection values. In future load tests, the magnitude of the loads must be planned so that the bridge undergoes vertical deflections larger than the ATS accuracy to minimize the error committed during data collection. It is noted that the behavior of the girders in spans 1 and 3 was within the same order of magnitude. This indicates that the behavior of the span was independent of the type of material employed to fabricate the PC/PS concrete girders.
The commercial finite element analysis (FEA) software ABAQUS (Simulia, 2012) was used to develop 3D, linear, finite-element models (FEMs) of the bridge superstructure for each of the load stop configurations presented in Figures 3, 4. The geometry of the bridge was created from construction documents and was modeled with 20-node solid elements (Figure 5). The bridge was modeled considering (1) the primary members (CIP RC deck shown in Figure 5A and PC/PS concrete girders shown in Figure 5B); (2) the secondary members (RC safety barriers and diaphragms shown in Figure 5B). The material of each bridge component was assumed to be linear elastic for the level of load applied during the tests. The modulus of elasticity (MOE) of the different parts was obtained by averaging the results of MOE tests conducted on three companion specimens the same day of the load test. The companion specimens were cast during the fabrication of the PC/PS concrete girders and the construction of the bridge components (CIP RC deck, diaphragms and safety barriers). Table 3 lists the MOE values of the different bridge components used to create the finite element simulations as reported by Hernandez and Myers (2015b, 2016b). Two different sets of MOE values were used as input of the FEMs, depending whether the load stop was conducted on day 1 (April 2014) or day 2 (August 2014). Experimental deflection values reported by Hernandez and Myers (2016a) were utilized to calibrate and reproduce a finite element model that could predict the response of the bridge with a reasonable level of accuracy. The calibrated FEM may be used to perform “virtual load tests” and predict the response of the bridge subjected to different load configurations (Hernandez and Myers, 2018a).
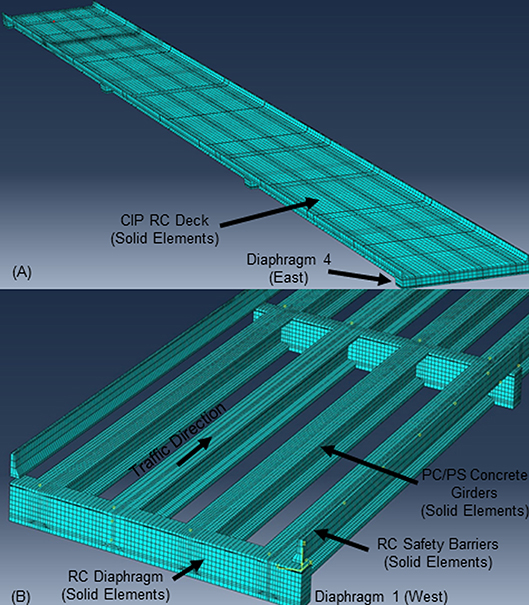
Figure 5. Finite element model of Bridge A7957. (A) Entire model; (B) Detail of girders and secondary elements (Safety barriers and diaphragm).
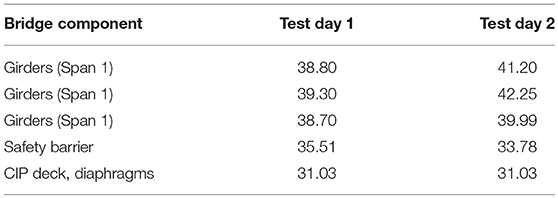
Table 3. Modulus of elasticity of bridge components (GPa).
The position of the trucks over the slab deck and the distances between the axles of the trucks were simulated as recorded for each load configuration. Concentrated forces were applied at the location of the wheels of the trucks to simulate the weight of the axles reported by MoDOT personnel (Table 1). Table 4 reports the longitudinal strains measured at the bottom of the girders (midspan sections) obtained from the FEM simulations. In general, the finite element models predicted the response of the bridge for the different load configurations with a reasonable level of accuracy. The largest difference between the experimental and FEM strains was close to 15% for all the interior and exterior girders during most of the load stops. The exception was observed for the strain value of the exterior girders recorded during stops 11 and 13 that showed a 50% difference. This extreme difference may be attributed to the proximity of the measured strain value to the accuracy of the VWSG sensor.
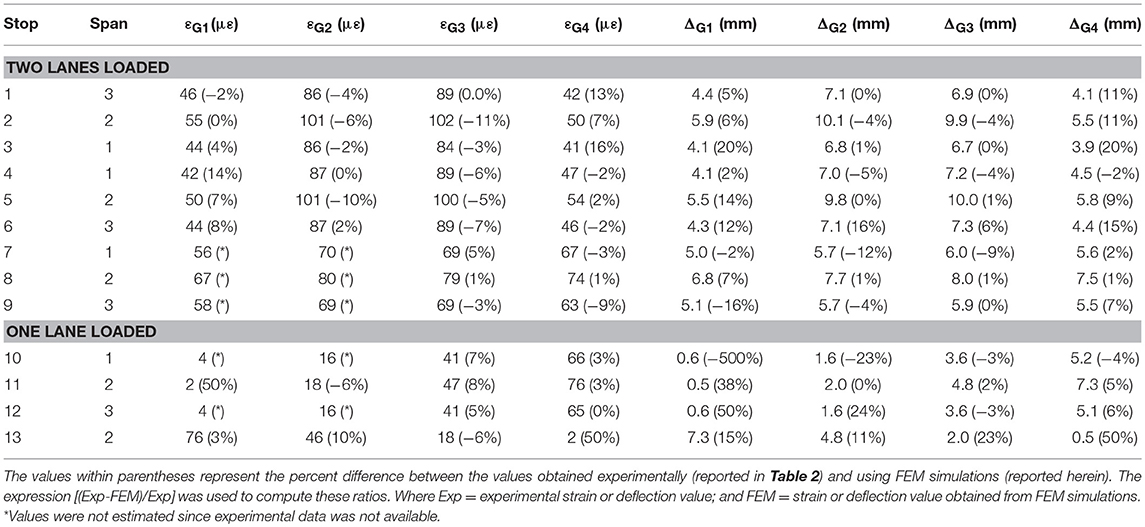
Table 4. FEM strains and vertical deflections.
Table 4 also presents the vertical deflections obtained from FEM simulating the load stops described in the previous section. Larger deflections were observed for the girders located near the truck loads. Comparable values, corresponding to stops 1 and 3, stops 4 and 6, and stops 7 and 9 (two lanes loaded) were obtained in spans 1 and 3. For one-lane loaded cases (stops 10–13), larger difference ratios were observed when the experimental and FEM results were compared. A 500% difference was obtained in the case of stop 10, and a 50% difference in the case of the exterior girders for stops 12 and 13. These differences, as mentioned before, can be attributed to the accuracy of the ATS that is close to the measured deflection values. In general, the response of the girders in spans 1 and 3 was within the same order of magnitude indicating that the response of the spans during the first series of load tests was independent of the type of material used to fabricate the PC/PS concrete girders (CC and SCC) of spans 1 and 3.
Lateral distribution factors obtained from field measurements and FEM simulations are defined herein as load distribution factors (LDF). In addition, lateral distribution factors obtained using the AASHTO LRFD approach (American Association of State Highway Transportation Officials, 2017) are referred to as girder distribution factors (GDF) following the nomenclature used by Cai and Shahawy (2003). The LDFs for the exterior and interior girders were computed using strain and deflection values obtained experimentally or using FEM.
The LDFs were estimated using longitudinal strain values in the following manner:
where LDFεi = lateral distribution factor for moment of the ith girder obtained with longitudinal strains; εi = bottom flange longitudinal strain of the ith girder at midspan obtained experimentally or using FEM; n = number of lanes loaded; and k = number of girders). Similarly, the LDFs were estimated using vertical deflection values as follows:
where LDFδi = lateral distribution factor for moment of the ith girder estimated with vertical deflections; and δi = deflection of the ith girder at midspan obtained experimentally or using FEM.
The bottom-flange strains of PC/PS girders 1 and 2 were required to compute the LDF. As mentioned above, VWSGs were installed at cluster locations along girder lines 3 and 4 (Figures 2, 3), which allowed direct recording of the strains of girders 3 and 4 for each load stop configuration. The strain values of girders 1 and 2 were indirectly obtained by using the symmetry of the bridge and assuming that mirrored image load configurations could produce a symmetrical response of the interior and exterior girders (lines 3 and 4) during the load test. For two-lane load cases, stops 3 and 4 (span 1), stops 2 and 5 (span 2), and stops 1 and 6 (span 3) were considered as symmetrical (Figure 4). Stops 11 and 13 (span 2) were also considered symmetrical load stops for the case of one lane loaded (Figure 4). For instance, during stop 2, the strains of girders 3 and 4 were directly measured from the installed sensors (Table 4, columns 5–6). The strains for girders 1 and 2, as reported for stop 2 (Table 4, columns 3–4), were interpreted from the measurements recorded during stop 5 (collected by sensors installed within girders 3 and 4). The same approach was employed to obtain the strains for girders 1 and 2 for the rest of the load stop configurations. The strain values for girders 1 and 2 were not obtained for those load stops without a mirrored load stop image, as was the case of stops 7–10 and 12. Table 5 presents the LDF values computed using the experimental strain values reported in Table 2 (columns 3–6). The distribution factor of an interior or exterior girder is defined as the maximum value estimated using the experimental or AASHTO LRFD approach. For the stop configurations used to load the bridge during this first series of load tests, no difference was observed when the LDF of the interior girders 1 and 4 was compared (0.52 vs. 0.52). In the case of the interior girders 2 and 3, the maximum LDF values were 0.654 vs. 0.672, respectively. This difference represents a 1.8% of the absolute live load applied to bridge structure that is distributed to an interior girder. Comparison of the LDF values for the exterior and interior girder of spans 1 and 3 were performed for stops 1 and 3, and 4 and 6 (two-lane load cases). These comparisons are reported in terms of the live load applied to the bridge that was carried by a girder. The maximum difference (1.8%) was noted for the interior girders during stops 1 and 3. This discrepancy might be related to the precision of the sensors and differences in the point of applications of the test load within the central regions of spans 1 and 3.
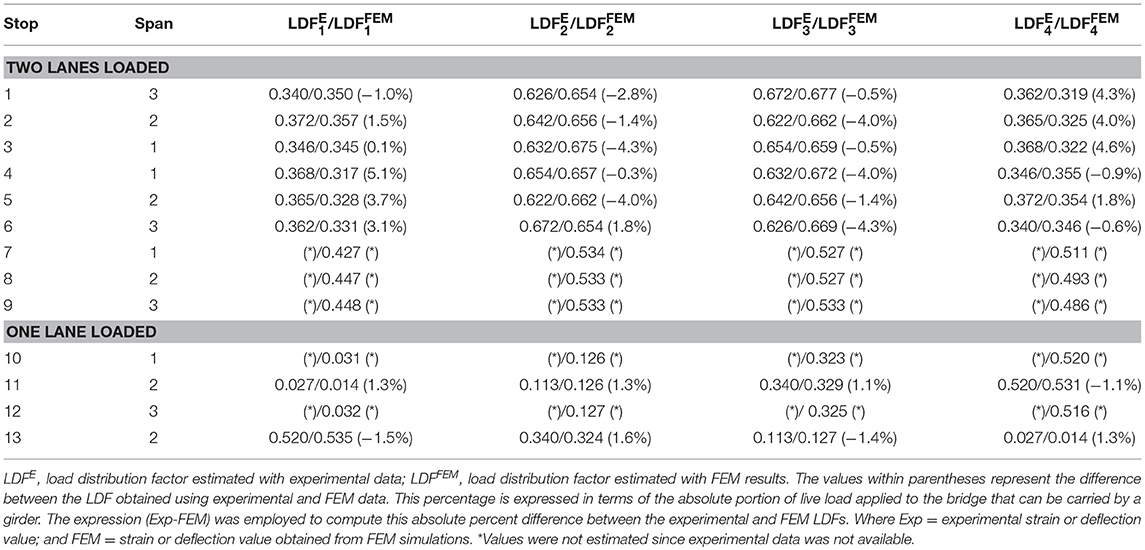
Table 5. Experimental and FEM LDFs (estimated with longitudinal strain values).
Table 6 lists the LDF values estimated with the experimental deflections reported in Table 2 (columns 7–10). The LDF values reported in Table 6 are comparable to the experimental LDF values listed in Table 5 suggesting that both variables can be used to estimate the load distribution for moment using field data. Comparisons of the LDF values for the exterior and interior girders of spans 1 and 3 were performed for stops 1 and 3, 4 and 6, and 7 and 8 (two-lane load cases) in terms of the live load applied to the bridge that was carried by a girder. The maximum difference (6%) was observed for exterior girder 1 during stops 1 and 3. For the interior girders this difference was below 4%. The discrepancy obtained in LDF values was lesser that the one observed in the case of the LDF values estimated with deflection measurements.
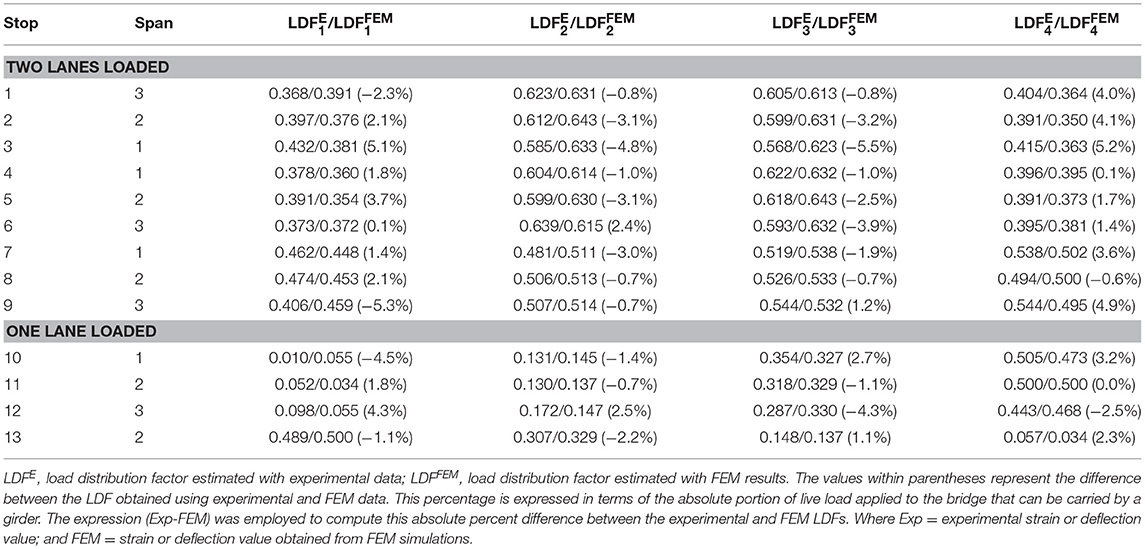
Table 6. Experimental and FEM LDFs (estimated with deflection values).
Table 5 presents the LDF values estimated with the FEM longitudinal strains reported in Table 4 (columns 3–6). The FEM LDF values are compared to LDFs obtained with experimental strain values. The values within parentheses represent the difference between the experimental and FEM LDF values. This percentages are expressed in terms of the absolute portion of live load applied to the bridge that is carried by a girder.
The LDF values, reported in Table 6, were determined using the FEM values of the vertical deflections presented in Table 4 (columns 7–10). These locations were selected as they correspond to maximum deflection and/or positive or negative stress. FEM and experimental LDF values estimated using vertical deflections are reported and compared in this table. The difference is presented within parentheses. As shown in the previous section (FEM Longitudinal Strains), the percentages are expressed in terms of the absolute portion of live load applied to the bridge that is carried by a girder. As in the case of the LDFs estimated with experimental and numerical strain values, it was noted that the experimental and numerical LDFs determined with deflection results were comparable and within the same order of magnitude suggesting that the accuracy of the FEM simulations is acceptable. The FEM models were calibrated using the field data as reported by Hernandez and Myers (2018a). These models may be used to predict the response of the bridge in future load tests if the superstructure is subjected to load configurations different to the ones used during this first series of load tests. In such as a case, if the experimental deflections are larger than the FEM values, it may be an indicator of the incursion of the bridge response within the inelastic range.
The AASHTO LRFD methodology (American Association of State Highway Transportation Officials, 2017) was used to compute the interior and exterior girder distribution factors (GDFs) for single and multiple loaded lanes. The GDF for an interior girder with two or more (multiple) design lanes loaded was estimated using the following equation (SI units):
where S = girder spacing (mm); L = span length (mm); ts = deck thickness; Kg = stiffness parameter (mm4); Kg = n(Ig+eAg); eg = girder eccentricity (vertical distance from the centroid of the girder to the centroid of the slab); n = modular ratio (Egirder/Eslab); E = modulus of elasticity of the concrete computed as 57,000(f'c)0.5; f'c = nominal compressive strength of concrete; Ig = moment of inertia of the girder (mm4); and Ag = area of the cross section of the girder (mm2). The GDF of an interior girder with a single lane loaded was computed using the following expression (SI units):
The GDF of exterior girders for two or more design lanes loaded was computed with the following expressions (SI units):
where de = horizontal distance from centroid of the exterior girder to the inside edge of the barrier or curb (mm). The multiple presence is implicitly considered in the AASHTO LRFD lateral distribution equations following the methodology proposed by Zokaie (2000).
The simple static distribution approach, also known as the lever rule, was employed to estimate the exterior GDF for a single lane loaded. The multiple presence must be considered explicitly when the lever rule method is employed. The following expression was written assuming a hinge develops at an interior support (girder 2 or 3) and by summing moments caused by the acting forces (resultant force P in Figures 3C,D) and the exterior girder reaction about the interior girder. Thus:
where mp = multiple presence factor (equal to 1.2 for a single lane loaded); dR = horizontal distance from the inside edge of the barrier or curb to the point of application of the force P (resultant force of a truck applied at center of the axle as shown in Figure 3D). A skew factor was estimated with the following expressions to modify the AASHTO GDF values.
where SF = skew correction factor (if 30° ≤ θ ≤ 60°); and θ = skew angle. Table 7 summarizes the parameters of the bridge employed to determine the GDF of the exterior and interior girders.
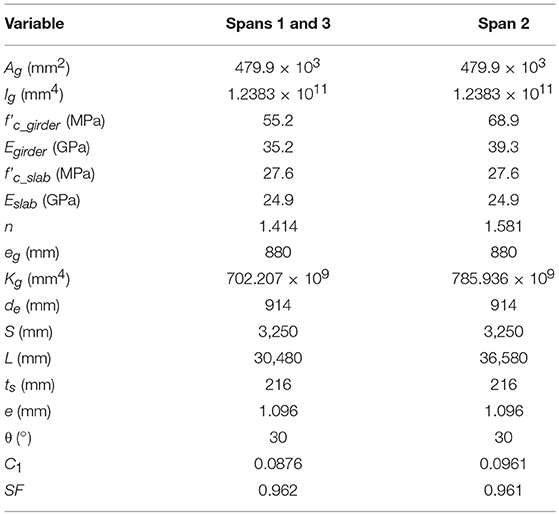
Table 7. Bridge design parameters.
Table 8 lists the GDF values estimated according to AASHTO LRFD approach. The GDF values listed on columns 3 and 5 were corrected using the skew correction factors presented above. The corrected factors are listed in columns 4 and 6.
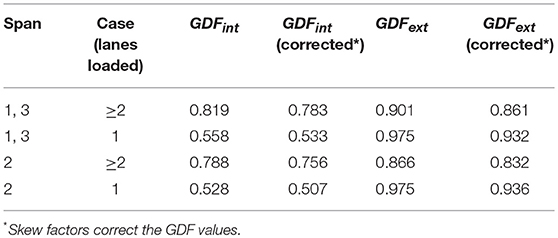
Table 8. AASHTO LRFD GDFs.
The interior and exterior girder distribution factors for moment are designated as the maximum values of the distribution factor obtained (using field data or the AASHTO LRFD equations) when a single-lane or multiple-lane load cases are evaluated. Several critical load configurations were evaluated to determine the maximum effect acting within the primary carrying members of the bridge. In the case of Bridge A7957, the experimental distribution factor obtained for spans 1 and 3 (Tables 5, 6) were comparable showing that this parameter is independent of the type of material employed to fabricate the prestressed concrete girders. The interior load distribution, LDFint, calculated from experimental data and FEM results, corresponded to 0.672 and 0.677, respectively. Furthermore, the exterior load distribution factor, LDFext, estimated from test and FEM data was 0.520 and 0.535, respectively. The maximum difference observed was close to 4%, suggesting that the calibrated FEM can reproduce the behavior of the bridge with an acceptable level of accuracy for the level of load applied during the load tests. The calibrated FEM can be used to study the response of the bridge for load configurations different to those conducted during the field load test.
The computed AASHTO LRFD interior and exterior girder distribution factors, GDFint and GDFext, were 0.783 and 0.936, respectively. These values represent approximately 17% and 80% difference for the interior and exterior girder lateral load distribution factors obtained experimentally and using FEM data. In the case of Bridge A7957 and the load configurations used during the first series of diagnostic load tests, these results imply that the AASHTO LRFD GDF values are more conservative than the LDF values obtained from experimental data and FEM simulations.
It should be noted that the AASHTO LRFD methodology is suitable for bridge design. Diagnostic load tests have demonstrated to be more appropriate to assess the load distribution response of existing bridges. Consequently, it is recommended to use more refined methods to estimate the load distribution during the load rating evaluation of existing bridges.
A first series of diagnostic load tests was conducted to evaluate the initial in-service response and moment load distribution of Bridge A7957. The structural behavior of the main carrying members fabricated with SCC and conventional concrete was compared using the longitudinal strain and vertical deflection values obtained at midspan locations. The results demonstrated that the structural performance of the spans 1 and 3 was independent of the material employed in the fabrication of the prestressed concrete girders (CC and SCC, respectively) and should not hinder the implementation of SCC in future infrastructure projects. Finite element models of the bridge were developed to predict the behavior of the bridge for the different load configurations. The FEM could predict the response of the bridge with an acceptable level of accuracy (about 15% difference for measured strains and deflections). These calibrated models may be used to predict the response of the bridge in future live load tests. LDFs were estimated from field measurements, FEM simulations, and GDFs were obtained using the AASHTO LRFD approach. The AASHTO LRFD distribution factors resulted to be ~17 and 80% larger than their counterpart experimental values. The difference may be attributed to several causes. The AASHTO LRFD equations are presented to be applied to different types of bridges with a wide range of span lengths, girders spacing, and stiffness. Experimental distribution factors implicitly consider field conditions such as unintended support restraints and contribution of secondary members that improve the service response of the bridge. In addition, experimental distribution factors consider the actual bridge condition. Consequently, experimental distribution factors are more suitable for conducting a load rating evaluation of an existing bridge. The presence of damage, aging or both in the main carrying members may influence the load distribution response since the main supporting members that exhibit less loss of stiffness are expected to carry larger loads than those members showing larger signals of distress. These two possible scenarios were outside the scope of this study.
JM conceived the project. EH implemented the instrumentation, conducted the tests, developed FEA models, collected the data, analyzed the results, and wrote the manuscript. Both authors read and approved the final manuscript.
This work was funded by the Missouri Department of Transportation (MoDOT) under the project TRyy1236, the National University Transportation Center (NUTC) at the Missouri University of Science and Technology under the project 00040350, and the US Department of Transportation under contract DTRT06-G-0014.
The authors declare that the research was conducted in the absence of any commercial or financial relationships that could be construed as a potential conflict of interest.
The authors gratefully acknowledge the financial support provided by the Missouri Department of Transportation (MoDOT), the National University Transportation Center (NUTC) at the Missouri University of Science and Technology (Missouri S&T), and the U.S. Department of Transportation. A special thank you is addressed to the Civil, Architectural, and Environmental Engineering Department and the Center for Infrastructure Studies at Missouri S&T for the support received during the realization of this study. The authors would also like to thank RILEM Publications SARL, copyright owner of the original publication Monitoring the Initial Structural Performance of a Prestressed Concrete Bridge published in PRO100—Proceedings of the 8th International RILEM Symposium on Self-Consolidating Concrete—SCC 2016. RILEM Publications SARL 2016, ISBN:978-2-35158-156-8. P. 401–411, for the permission granted to reuse part of this manuscript.
American Association of State Highway and Transportation Officials (2015). Manual for Bridge Evaluation (2nd Edition) with 2011, 2013, 2014 and 2015 Interim Revisions. Washington, DC.
American Association of State Highway and Transportation Officials (2017). Bridge Design Specifications (8th Edition). Washington, DC.
Barker, R. M., and Pucket, J. A. (2013). Design of Highway Bridges: An LRFD Approach. Hoboken, NJ: John Wiley & Sons.
Cai, C. S., and Shahawy, M. (2003). Understanding capacity rating of bridges from load tests. Pract. Period. Struct. Des. Constr. 2003, 209–216. doi: 10.1061/(ASCE)1084-0680(2003)8:4(209)
Gheitasi, A., and Harris, D. K. (2015). Overload flexural distribution behavior of composite steel girder bridges. J. Bridge Eng. 20:671. doi: 10.1061/(ASCE)BE.1943-5592.0000671
Harris, D. K., Cousins, T., Sotelino, E. D., and Murray, T. M. (2010). Flexural lateral load distribution characteristics of sandwich plate system bridges: parametric investigation. J. Bridge Eng. 15, 684–694. doi: 10.1061/(Asce)Be.1943-5592.0000105
Hernandez, E. S., Griffin, A., and Myers, J. J. (2014a). “Balancing extended service life and sustainable concrete material usage in Missouri Bridge A7957,” in Structural Faults and Repair: European Bridge Conference (London: SF&R).
Hernandez, E. S., Griffin, A., and Myers, J. J. (2014b). “Construction and monitoring of sustainable concret bridge A7957 in Missouri, USA,” in 23rd Australasian Conference on the Mechanics of Structures and Materials (Byron Bay, NSW).
Hernandez, E. S., and Myers, J. J. (2015a). “In-situ field test and service response of Missouri Bridge A7957,” in 16th European Bridge Conference (EBC16) (Edinburgh).
Hernandez, E. S., and Myers, J. J. (2015b). Use of self-consolidating concrete and high volume fly ash concrete in Missouri Bridge A7957. Sustainable performance of concrete bridges and elements subjected to aggressive environments: monitoring, evaluation and rehabilitation. ACI 304, 85–100.
Hernandez, E. S., and Myers, J. J. (2016a). “Field load test and girder distribution factors of Missouri Bridge A7957,” in 2016 PCI Convention and National Bridge Conference (Nashville, TN).
Hernandez, E. S., and Myers, J. J. (2016b). “Initial in-service response and lateral load distribution of a prestressed self-consolidating concrete bridge using field load tests,” in The Fifth International Symposium on Life-Cycle Civil Engineering (IALCCE 2016), eds J. Bakker, D. M. Frangopol, and K. Van Breugel (Delf: CRC Press), 1072–1079.
Hernandez, E. S., and Myers, J. J. (2016c). “Monitoring the initial structural performance of a prestressed self-consolidating concrete bridge,” in PRO100 - Proceedings of the 8th International RILEM Symposium on Self-Compacting Concrete - SCC 2016, ed K. H. Khayat (Washington, DC: RILEM Publications SARL 2016, 401–411.
Hernandez, E. S., and Myers, J. J. (2018a). Diagnostic test for load rating of a prestressed SCC bridge. Spec. Publ. 323, 11.11–11.16.
Hernandez, E. S., and Myers, J. J. (2018b). “Strength evaluation of prestressed concrete bridges by dynamic load testing,” in Ninth International Conference on Bridge Maintenance, Safety and Management (IABMAS 2018) (Melbourne, VIC: CRC Press).
Keske, S. D., Miller, D. E., Barnes, R. W., and Schindler, A. K. (2014). Live-load response of in-service bridge constructed with precast, prestressed self-consolidating concrete girders. PCI J. 59, 63–76. doi: 10.15554/pcij.09012014.63.76
McSaveney, L., Papworth, F., and Khrapko, M. (2011). Self compacting concrete for superior marine durability and sustainability. Concr. Aust. 37, 59–64. Available online at: http://downloads.realviewtechnologies.com/Concrete%20Institute%20Of%20Australia/Concrete%20In%20Australia/June%202011.pdf
Merkle, W. J., and Myers, J. J. (2004). “Use of the total station for load testing of retrofitted bridges with limited access,” in Smart Structures and Materials 2004 - Sensors and Smart Structures Technologies for Civil, Mechanical, and Aerospace Systems, ed. S. C. Liu (San Diego, CA: Proceedings of SPIE – The International Society for Optical Engineering, 687–694. doi: 10.1117/12.539992
Myers, J. J., Volz, J., Sells, E., Porterfield, K., Looney, T., Tucker, B., et al. (2012). Self-Consolidating Concrete (SCC) for Infrastructure Elements. Rolla, MO: Missouri University of Science and Technology.
Ouchi, M., Sada-aki, N., Thomas, O., Hallberg, S. E., and Myint, L. (2003). Applications of Self-Compacting Concrete in Japan, Europe and the United States. ISHPC [Online]. Available online at: http://www.fhwa.dot.gov/bridge/scc.pdf (accessed April 15, 2016).
Simulia (2012). Abaqus Analysis User's Manual. Version 6.12 ed. Providence, RI: Dassault Systèmes Simulia Corp.
Zhao, J. J., and Tonias, D. E. (2012). Bridge Engineering: Design, Rehabilitation, and Maintenance of Modern Highway Bridges. McGraw-Hill.
Keywords: girder distribution factors, lateral load distribution, load distribution factors, diagnostic load test, SCC prestressed concrete girders
Citation: Hernandez ES and Myers JJ (2019) Load Distribution of a Prestressed Self-Consolidating Concrete Bridge. Front. Built Environ. 5:96. doi: 10.3389/fbuil.2019.00096
Received: 22 November 2018; Accepted: 10 July 2019;
Published: 25 July 2019.
Edited by:
Eva Lantsoght, Universidad San Francisco de Quito, EcuadorReviewed by:
David De Leon, Universidad Autónoma del Estado de México, MexicoCopyright © 2019 Hernandez and Myers. This is an open-access article distributed under the terms of the Creative Commons Attribution License (CC BY). The use, distribution or reproduction in other forums is permitted, provided the original author(s) and the copyright owner(s) are credited and that the original publication in this journal is cited, in accordance with accepted academic practice. No use, distribution or reproduction is permitted which does not comply with these terms.
*Correspondence: John J. Myers, am15ZXJzQG1zdC5lZHU=
Disclaimer: All claims expressed in this article are solely those of the authors and do not necessarily represent those of their affiliated organizations, or those of the publisher, the editors and the reviewers. Any product that may be evaluated in this article or claim that may be made by its manufacturer is not guaranteed or endorsed by the publisher.
Research integrity at Frontiers
Learn more about the work of our research integrity team to safeguard the quality of each article we publish.