 Gordana Pavić
 Borko Bulajić
 Marijana Hadzima-Nyarko
- 1Faculty of Civil Engineering and Architecture Osijek, Josip Juraj Strossmayer University of Osijek, Osijek, Croatia
- 2Faculty of Technical Sciences, University of Novi Sad, Novi Sad, Serbia
Estimating of buildings vulnerability is based on a well-organized and detailed database of buildings and their characteristics. Creation of the buildings database of the city Osijek is in progress. This database contains, for each building, information regarding its location, geometric and structural characteristics, materials which were used for structural elements, and other relevant data. This paper presents numerical and statistic values of some characteristics of the buildings from the database. Different methods can be applied for the prediction of damage probability in the field of earthquake risk assessment. With the empirical Macroseismic method and the analytical Capacity Spectrum Method, the vulnerability of the few blocks of buildings, typical for the city Osijek, is estimated. For unreinforced masonry structures with flexible floors, the probability of reaching a certain degree of damage is estimated by the two selected methods, and the obtained results are compared.
Introduction
Croatia is located in the area of high seismicity, as confirmed by the earlier catastrophic earthquakes in Zagreb (1880) and in Dubrovnik (1667). Only buildings constructed in the last 10 years have been designed according to HRN EN 1998-1:2011 (Eurocode 8), but most, low and medium high buildings built in the last century, made of stone or brick elements, have not been constructed in accordance with earthquake-resistant design concepts. The seismic resistance of these buildings must be evaluated and the level of risk defined in order to avoid adverse effects in the case of a catastrophic earthquake.
Most of the current approaches for assessing potential losses for a wide group of exposed elements rely on the availability of relevant fragility curves. Over the past decades, the area of the earthquake risk assessment has achieved great development. In addition to being one of the major factors in earthquake risk analysis, the concept of earthquake vulnerability is also used as one of the major factors in the development of earthquake scenarios, as a basis for setting up a strategy to reduce earthquake risk for a group of buildings or other elements at risk and as a basis for development scale of earthquake intensity, such as EMS-98, which explicitly and repeatedly refers to earthquake vulnerability (Sandi et al., 2007). Different methods can be implemented to develop damage probability functions/fragility curves in the field of earthquake risk assessment. Generally, they are categorized into three generic groups: empirical, based on observation of actual damage and post-earthquake surveys; analytical, obtained from the results of static or dynamic analyses of structural models; hybrid, which can combine any of the methods mentioned above to overcome the lack of: observed parameters, structural models, and of subjectivity of an expert opinion.
Empirical methods include: damage probability matrices (DPM), macroseismic method, vulnerability index method (VIM), fragility curves, visual-based methods. The analytical methods include: derived fragility curves and DPM, collapse mechanism based method, capacity spectrum based method (CSM), and a displacement based method.
Analytical methods are formed on the basis of the statistical classifications of damage distribution that are simulated by a series of calculations of damage states in numerical models due to the increase of the earthquake intensity. The method may be relatively restrictive in terms of high computer loads and complexity. In order to implement more detailed analyzes, such as taking into account geometrical, material and other uncertainties, numerical models are simplified and thus reduce the oversized and long-lasting computer operations. It is of extreme importance to consider each detail of the structure and the difference between the structural and non-structural elements in order to allow a more realistic modeling of the real structure, because a large number of parameters affect the final result. It is also possible to classify numerical models into the models that use a nonlinear static calculation and models that use a nonlinear dynamic calculation (SYNER-G, 2011).
Empirical methods are based on actual data, taking into account various effects such as soil and structure interaction, topographical and lithographic impacts of construction site and variability of structural capacity of group of buildings. However, this can also be a disadvantage because empirically derived fragility curves are specific depending of: the area, particular condition of the construction site, earthquake parameters (intensity, depth, etc.) and bearing capacity of the building. The available data are often based on low earthquake intensity, which results in a fragility curve that may be unreliable for earthquake events with a higher magnitude.
Empirical and analytical methods were applied in the area of Osijek. In order to be able to apply any of the methods, the fourth component of risk exposure should be taken into account because without this component, even if there is a high earthquake hazard in some area, if the area is uninhabited, the earthquake risk is small.
Study Area
The city of Osijek occupies an area of ~171 km2, and according to the population census from 2011 it has 108,048 inhabitants. The geographic position of the city center has the following coordinates: the north latitude 45° and 32′, and the east longitude of 18° and 44′. The area on which the town is located is lowland, shaped by the river Drava and its tributaries. The geomorphologic form, the lowland relief of the city, is the river terrace. Osijek mostly extends along the right bank of the River Drava, at an altitude of 90 m. The city is made up of 7 districts: Tvrda (old town, built mostly in the eighteenth century), Upper Town, Lower Town, New Town (including Sjenjak), Industrial Quarter, Retfala and South II.
According to the geological-lithological map of the Osijek-Baranja County, old rock blocks at higher depths are covered by young sediments, particularly from Pleistocene. During the freezing and defrosting process, the surface soil was worn, creating small Aeolian deposits (sediments) and powder dusts, which form the dominate soil type in the area of urbanization. In the hydrogeological sense, the area of the city lies on the alluvial terraces of the Drava and Danube, with a thickness generally over 150 m, covered with a dusty and clay layer, 10–50 m thick, in which the dominant layers are formed of medium to fine grained sand and layers of clay and powder.
The earthquake and tectonic activity in the area of the city is not significant. According to the map of earthquake hazards for Croatia, according to the National Annex EN 1998-1 (HRN EN 1998-1: 2011/NA), the horizontal peak accelerations of the ground type A (rock) for the city of Osijek is 0.11 g for the 475 year return period. The closest zones of intensified earthquake activity are located north of the city, ~30 km toward Beli Manastir in the Bansko brdo area and ~70 km southwest of the city in the area of Dilj gora where there were earthquakes of VIII degrees intensity in the epicentral area (according to MCS scale) or with magnitude of 5.0–5.7.
In the case of earthquakes of this size and with the relatively poor soil conditions present, the impact of earthquake forces on the soil and structures can be considerable and should be taken into account in urban planning, design of new and reinforcement and renovation of the existing buildings.
Database of Buildings for the City of Osijek
Creating a database of buildings is an initial step in assessing the vulnerability of all types of buildings potentially exposed to earthquakes. Based on such a database, it is possible to analyze buildings, their elements as well as people who, as users of these buildings, are potentially exposed to injury and death in them, during an earthquake. The database may only include buildings and elements whose position is accurate or at least approximate. The process of preparing a database requires assignment of certain characteristics. Due to the common problem of inaccessibility or absence of official data and statistics for assigning relevant characteristics and parameters, approximate procedures are used. The production of a high-quality building database for a specific area of research implies primarily the availability of complete and detailed information on the geographic position of the buildings, their total surface area and their structural characteristics. The entire process of making a database requires the cooperation of numerous participants from different fields of science and practice. Namely, it is necessary to collect a variety of data, starting from geographic, cadastral or data from municipal archives. In order to collect all the necessary data on the structure and characteristics of bearing system of the building, it is also necessary to go out and do a field work of visual data collection or the measurements that are needed for a particular analysis and calculation.
Building database provides also an economic estimate for each element with the aim of quantifying damage in monetary units (Barbat et al., 1996).
The aim of the Osijek city building database is to estimate the city's earthquake vulnerability on the basis of the vulnerability types of buildings in the city, which are defined through direct field examinations and by studying existing plans and documentation.
Classification of Structural Systems
For the building database of the city of Osijek, the structural systems of the existing Osijek city buildings are classified, according to Giovinazzi (2005), as follows:
M5 - unreinforced masonry structures with flexible floors (old bricks)
M6 - unreinforced masonry structures with rigid floors
M7 - masonry structures with horizontal and vertical ties (confined masonry)
RC1 - reinforced concrete frames
RC4 - shear walls (without E.R.D.)
This classification was adopted taking into account the years when buildings were built and the basic structural and performance requirements in building regulations at the time.
According to the data from the database of buildings of the city Osijek, in which up to now 1,075 buildings have been processed, the number and percentage of certain structural system classes are presented in Figure 1.
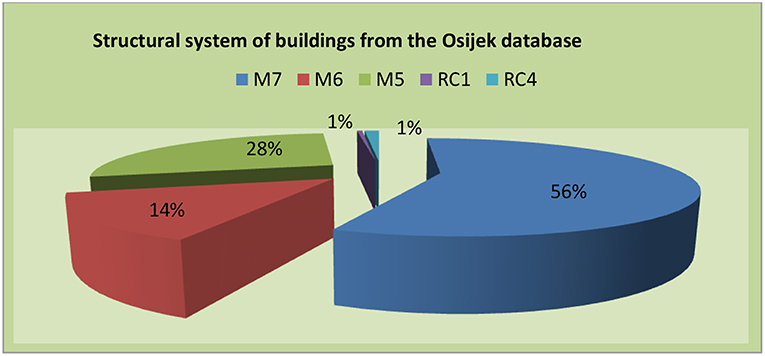
Figure 1. The proportion of structural systems in the so far built Osijek city building database.
From the presented data, it can be seen that 99 % of the buildings so far included in Osijek's building database, are masonry structures. Given the complex and extremely non-linear behavior of masonry structures during earthquakes, and such a significant percentage of masonry structures in the city, the creation and existence of this database is more than necessary and justified despite the relatively small number of recorded earthquakes and low tectonic activity in the vicinity of the city of Osijek. It represents the basis for reliable assessment of the earthquake vulnerability for all types of buildings in the city, and hence for the reliable assessment of seismic risk.
Moreover, a series of recent seismic microzonation studies in the north-western Balkans (Lee et al., 2015, 2017a,b,c; Bulajić et al., 2018) and a recent study of strong earthquake ground motion in the same region (Bulajić et al., 2013) showed that deep geological sediments strongly affect the severity of both longer period waves, even in the case of distant earthquakes (Lee et al., 2016a,b). This is especially important for regions like the area of the city of Osijek and its vicinity where deep sediments, which are dominantly present, can experience significant shaking from more distant earthquakes.
Data Collection Form
The initial step in the process of creating a building database involves selection of relevant parameters of interest to the database. Bearing in mind the Global Earthquake Model (GEM) recommendations on building types (Brzev et al., 2013), a site-building data collection form was developed by considering the data that will best describe the structure and other building characteristics required for further research.
The created building data collection form contains the following:
- building location information: address, cadastral number
- the position of the building in relation to the particular city block
- general information: the purpose of the building, the year of construction and/or reconstruction (if any) and the number of persons living in the household
- information on the geometric characteristics of the building: floor plan dimensions, net and gross floor planes, floor plan blueprints, floor level, floor space and total height
- regularity in floor plan and height
- information on the main structural system of the building
- information on building materials used
- information on the roof structure and cover.
Buildings by Year of Construction
Building age is a parameter that can be used to define the design rules used and the type of bearing structure, which are factors that accurately determine the potential damage to buildings (Salgado-Gálvez et al., 2015). Accordingly, given the availability of the required data for risk analysis, the division of buildings was used with respect to the construction year in six groups.
For every municipality and city in Croatia, data regarding the age of dwellings are available. Based on the housing and population census (Croatian Bureau of Statistics, 2011), the age distribution of the dwellings for Croatia was determined and shown in Table 1.
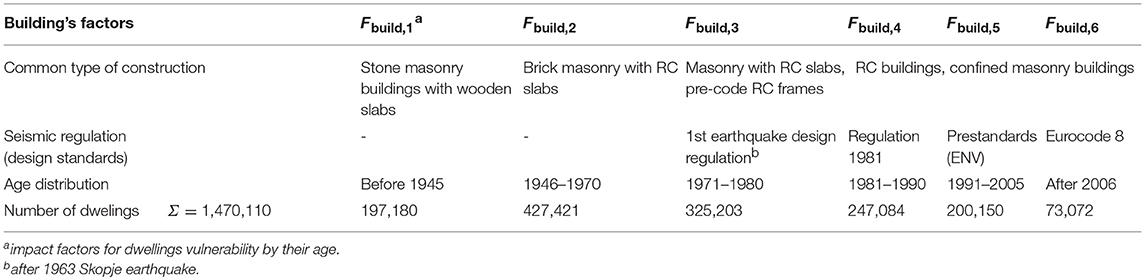
Table 1. Classification of buildings by construction age, with appurtenant type of construction and seismic regulations for Croatia (Kalman Šipoš and Hadzima-Nyarko, 2018).
By analyzing the collected data on the year of construction of buildings in the database, the following results were obtained: there are 176 buildings built before the 1940's or 16% of the total number of buildings in this database, there are 339 buildings built in the period between 1940 and 1970 or 32%, 359 buildings in the period from 1970 to 1978 or 33%, 201 buildings built between 1987 and 2006, or 19% of the buildings in current database. This is presented in the Figure 2.
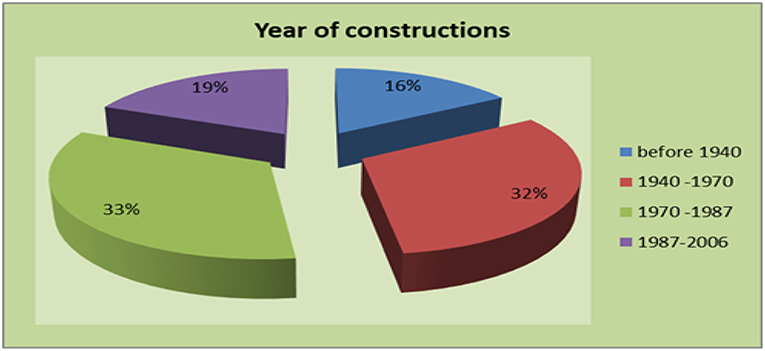
Figure 2. Year of construction for buildings in Osijek database.
The Regularity of the Ground Floor of the Buildings in Database
To calculate the resistance of the structure to the earthquake, it is necessary to know the regularity or irregularity of the structures in the layout and along the height.
According to the EC8 (EN 1998-1:2004, 2004), the structure of a building must be approximately symmetrical in plan with respect to the two orthogonal axes to ensure sufficient lateral stiffness and proper distribution of the masses. The building must have a compact configuration plan and re-entrant corners or edge recesses, if exist, cannot exceed 5% of the floor area.
The plans of the buildings covered by the database are mostly rectangular (with respect to the regularity of the ground plan): 75% of buildings have the regular floor plan and 25% have the irregular floor plan, as shown in Figure 3.
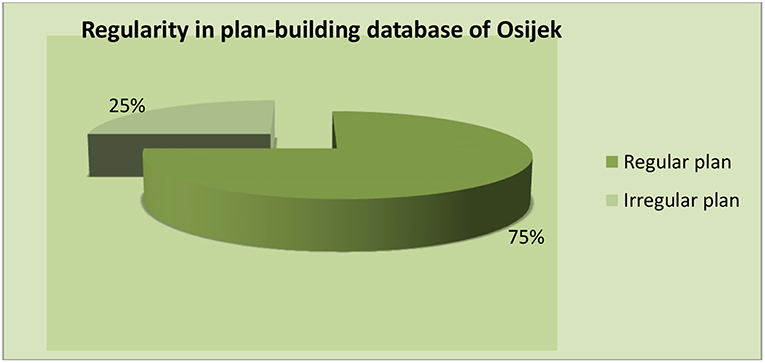
Figure 3. Regularity in plan for buildings from Osijek database.
Average Values of Building's Height
One of the most important parameters for the general and structural characteristics of each building when it comes to calculating the dynamics of structure is the height (the elastic period of the building depends on its height). In addition to determining the probability of earthquake hazard, the height is particularly important in assessing building damage before and after the earthquake (Trifunac et al., 2010). For each building being mentioned in the database, total height measurements were carried out from ground to roof structure to obtain the total height of the building, and by calculating and / or measuring (where possible), the average height is obtained. Data on the number of floors of the building are obtained by visualization and counting in the field.
According to the data collected, the average gross area, for buildings listed up to now is 769 m2 and the average floor area is 226 m2. The total height of the buildings is in the range of 4.48–37.3 m and the average height is 8.46 m. The tallest building of 37.3 m is the one-eighteenth-century building located at 48–50, Vijenac Ivana Meštrovića Street. The floor height ranges from 2.2 to 4.95 m and the average floor height is 2.86 m. The average values of the individual geometric properties of the buildings, for the up-to-date list of buildings in the database are shown in Figure 4.
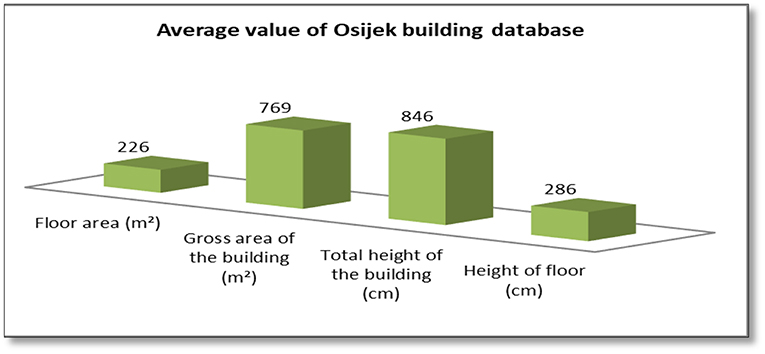
Figure 4. Average values of Osijek building database.
Floor System of Osijek Buildings
Floor system has a significant role in the action of seismic forces because they must prevent the separation of walls and ensure that during the earthquake the building behaves as a complete spatial structure with mutually well-connected elements. For a good earthquake force transmission, the floor system should be rigid in its plane. The transfer of earthquake forces is considerably more difficult for soft floors (wooden floors), because due to the deterioration and / or poor performance, the wooden floor systems often cannot be considered as absolutely rigid in their plane. For the presented database and later calculations, floors systems were classified as either rigid or wooden floors systems.
Figure 5 shows the total volume and statistics of rigid and wooden floors for buildings in the database of Osijek. For the up-to-now processed buildings in the database, 765 of them have rigid floor structures, which makes 72% of all processed buildings, while the soft (wooden) structures have 296 masonry buildings or 28% of all masonry building included in the database.

Figure 5. Floor systems of Osijek's buildings.
Building Material of the Walls
The parameter, which has a strong influence on the behavior of the elements and the entire construction during earthquakes, is the construction material or the type of building material from which the building was made. Buildings that are completely identical in terms of floor planes, floor counts, structural design, etc., but made of different types of materials, will have significantly different behavior even for the same intensity of earthquake ground shaking. For database purposes, these data are collected on site, from project documentation, based on knowledge of the building users or by evaluation based on knowledge of building age and researcher's experience.
The walls of the base building are made of brick and concrete. Using a brick block is the most common: 922 buildings, or 86%, were built by brick blocks. The ordinary (most commonly used) brick was used in 128 buildings, which is 12% of the total number of buildings. Concrete walls were made in 15 buildings or 1%, and concrete blocks in 5 buildings or 0.5% of the total number of buildings. In the database there were also 5 masonry buildings which were constructed of raw brick (in Tvrđa and Upper Town), and that is 0.5% of all buildings (Figure 6).
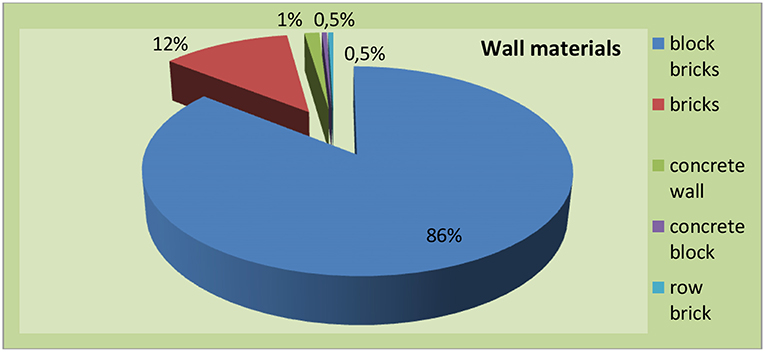
Figure 6. Wall materials of buildings in the database.
The parts of the city for the so-far processed database are Tvrđa, larger parts of the Upper Town, New Town (most Sjenjak), some parts of the Industrial District, Retfala and South II, and at least the database currently covers the Lower Town area. In Figure 9, red painted sections of the city show locations of the buildings that were placed in the database.
Macroseismic Method
The macroseismic method was originally developed by Giovinazzi and Lagomarsino (2004) from the definitions which are given in the (European Macroseismic Scale(EMS), 1998) using classical theory of probability and the theory of a fuzzy set. The method is based on a perceived vulnerability model, which allows damage estimation after an earthquake, and on application of EMS-98 scale. In this way, the macroseismic intensity (I) is connected with mean damage grade (μD).
According to the macroseismic method, the estimation of earthquake vulnerability is expressed as a mean damage grade μD. The mean damage grade μD is defined as Lagomarsino and Giovinazzi (2006):
where I is the earthquake hazard defined in terms of macroseismic intensity, VI is the vulnerability index, and Q is the ductility index that describes the ductility of a given structural type. The recommended value for Q in the amount of 2.3, as given by Giovinazzi and Lagomarsino (2004), was also adopted in this paper.
The model defines the vulnerability index V, which is for 6 types of buildings according to EMS-98 ranges between 0 and 1, and the ductility index Q. The ductility index determines the rate of increase in vulnerability with an increase in intensity or the slope of the vulnerability function, and the vulnerability index determines the position of the curve. The increase in index V for 0.16, means a single degree increase in the intensity of the earthquake.
In this method, the value of the vulnerability index can change depending on the structural systems and the quality of the structure, by introducing behavior modifiers and regional vulnerability factors based on expert judgment.
According to the EMS-98 scale, the earthquake behavior also depends on other factors, and therefore an equation for vulnerability index (Giovinazzi, 2005) is proposed:
where:
V0–the most probable value of the vulnerability index of certain type of building
ΔVR–regional vulnerability factor
ΔVm–behavior modifier.
According to Milutinovic and Trendafiloski (2003), the value of the typology index of vulnerability, or the most probable value of the vulnerability index of certain type of building, V0, depends on the basic structural system resistant to horizontal earthquake action. The values of the typological index of vulnerability, the boundary (V−, V+) of the possible range (χ = 1) and the upper and lower bounds of possible values (Vmin, Vmax) are given for masonry, reinforced concrete, steel and wooden buildings.
Building modifier ΔVm is the sum of the behavior modifiers Vm for certain building characteristics (e.g., condition of the building, regularity in plan and height regularity, building position, ground morphology, etc.). Since there were no available data of buildings vulnerability caused by earthquakes in Croatia, behavior modifiers are proposed based on the values suggested in previous works and on judgments based on available project documentation of the buildings considered (Hadzima-Nyarko et al., 2018).
A regional type factor ΔVR takes into account the characteristics of buildings belonging to a particular typology at the regional level. Greater or lower vulnerability can be established on the basis of traditional construction techniques in the observed area (Hadzima-Nyarko et al., 2018). Thus, for example, the calculated values according to Feriche et al. (2008), based on the analysis of damage to buildings after the earthquake in Lorca 2011, range between 0.08 and 0.16 (ΔVR = 0.08–0.16).
Results of Applied Macroseismic Method
Most buildings listed so far in the buildings database of the city of Osijek are masonry buildings. Therefore, the estimation of the earthquake vulnerability is carried out by the Macroseismic method on the masonry buildings. Three typical blocks of masonry buildings are selected in the Upper City district.
The Upper City was built at the end of the Seventeenth and early eighteenth centuries and since the middle of the nineteenth century. The buildings were built on the basis of experience, satisfying construction static, and they were constructed as full brick masonry structures. The thickness of the walls is 30, 45, 60 cm, for masonry in the old brick format (29/14/6.5–7.5 cm), and 25, 38, or 50 cm for masonry with new brick format (25/12/6.5 cm).
From the data collected for the selected three blocks of buildings, the following observations can be deduced:
- 3.6% of buildings are masonry structures with r.c. floors (M6), 7.1% are reinforced concrete frame systems (without E.R.D) (RC1), and the rest of 89.3% are unreinforced masonry structures (M5)
- 35.7% of the building are for public use; 14.3% for residential use; 32.1% for residential business use and 17.9% for business use
- 89.0% of the building was built between 1900 and 1940; 4.0% of buildings were built in the period from 1940 to 1960, and 7.0%by the end of the Twentieth century
- flexible floors, such as floor of wooden beams, have as much as 89.0% of buildings, while rigid floor have 11.0% of buildings
- the number of detached buildings is equal to the number of buildings in the series (39.0%), the dual buildings amount to 14.0% of the total number of buildings, while 9.0% of the buildings are on the corner (end of the series)
- 89.3% of buildings have a regular plan and 10.7% are irregular
- according to the number of floors, most of the buildings have basement, ground floor and one floor (71.4%, basement written as P0 + P + 1), while numbers of buildings with basement, two, three and four floors are equal (each group with 3.6% of buildings)
- ground floor and one-story buildings are represented in the same number or in percentage 7.1%
- total building height varies from 3.5 to 30.0 m
- the most common building height is 9.75 m (71.3%) followed by a height of 7 m (10.7%)
- the total height of the buildings in the amounts of 3.5, 9.0, 14.4, 16.4, and 30.0 m is represented in the same percentage (3.6%).
The Geographic Information System (GIS) is a system that manages spatial data and the associated characteristics. QGIS (“Quantum GIS”) is a computer application that allows users to create maps with multiple layers. Additional suitability for users is the fact that the code is open. Applying apps greatly facilitates the management, editing, visualization and analysis of the data collected. Using QGIS, some of the analyzed characteristics of buildings are shown in Figures 7A–D.
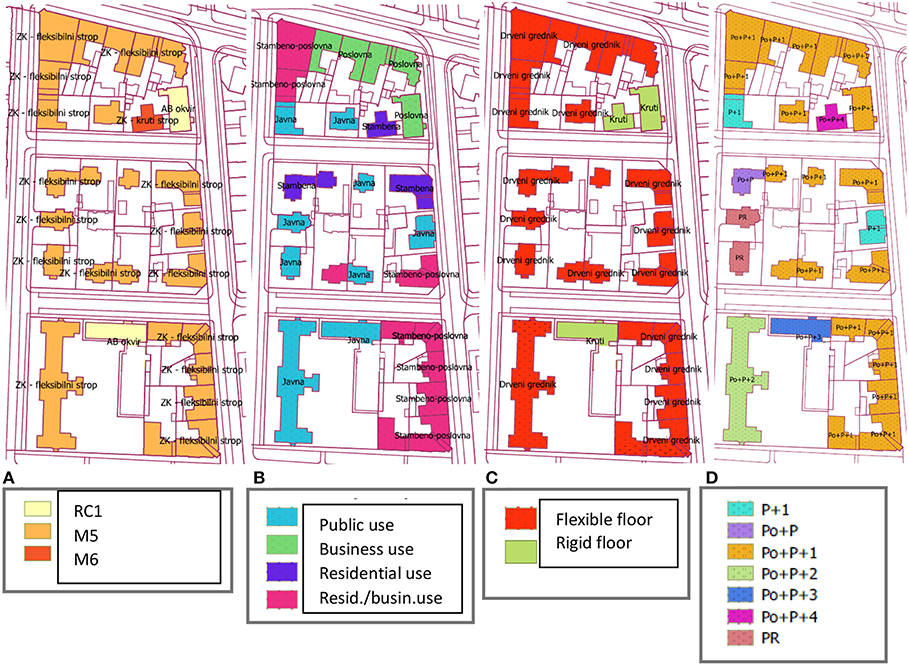
Figure 7. Visualization of (A) Structural System, (B) Usage, (C) Floor Type, and (D) Floor Number, using QGIS Application.
Since buildings from database can be divided into three types: unreinforced masonry with wooden (flexible) floors (M5), unreinforced masonry with reinforced concrete floors (i.e., rigid floors) (M6) and reinforced concrete frames (RC1), the most probable value of the vulnerability index of these types of buildings is taken over from Giovinazzi and Lagomarsino (2004) and shown in Table 2. According to EMS-98, the most probable level of vulnerability for unreinforced with wooden beams is B, and for unreinforced masonry with reinforced concrete floor and reinforced-concrete frame structures is C.
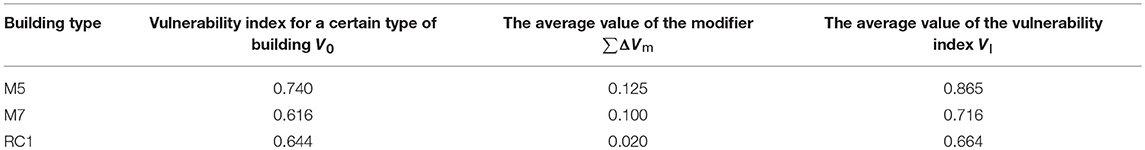
Table 2. Average Values of the Vulnerability Index.
For the calculation of the final vulnerability index V, the behavior modifier of the building ΔVm is introduced, which can increase or decrease the vulnerability index V0 from Table 2. The behavior modifier of the building ΔVm is determined according to the equation (Giovinazzi, 2005):
where: ΔVm is behavior modifier of the building and Vm,k is behavior modifier for individual building characteristics.
Behavioral modifiers for individual building characteristics were obtained experimentally or by observing typical vulnerability caused, taking into account the suggestions of the experts, and these values can be found in the aforementioned work by Milutinovic and Trendafiloski (2003).
Based on formulas (1), (2), and (3), and applying behavior modifiers based on the visual inspection of each building, the index of vulnerability and the mean degree of vulnerability for each building is calculated. The average values of the vulnerability index are shown in Table 2.
The average damage degree values for each type of building are shown in Figures 8A,B. The effect of the behavior modifier is reflected in the change of the value of the index of vulnerability. This also means that some classes of vulnerability have also changed (for example, the building with vulnerability class B has undergone to a class vulnerability A). For the observed database, 20 buildings have passed from class vulnerability B to class A (common features of these 20 buildings are: age >100 years, irregularity in the ground floor, located at the ends of a series of buildings or corner, having a heavy roof structures). One building moves from class C to class B due to modifier changes: the building is not older than 100 years, and it is a detached house (with 3 floors). A total of 7 buildings remain in the same class of damage.
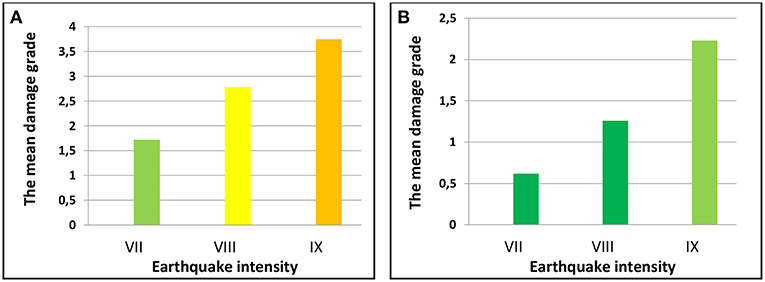
Figure 8. Average value for mean damage grade (A) masonry structures with flexible floors (M5), (B) reinforced concrete frames (RC1).
In accordance with Table 2, in Figures 9A–C, for the selected three blocks of buildings, the calculated values of the mean damage grades are displayed in the program package QGIS, for intensity VII, VIII, and IX.
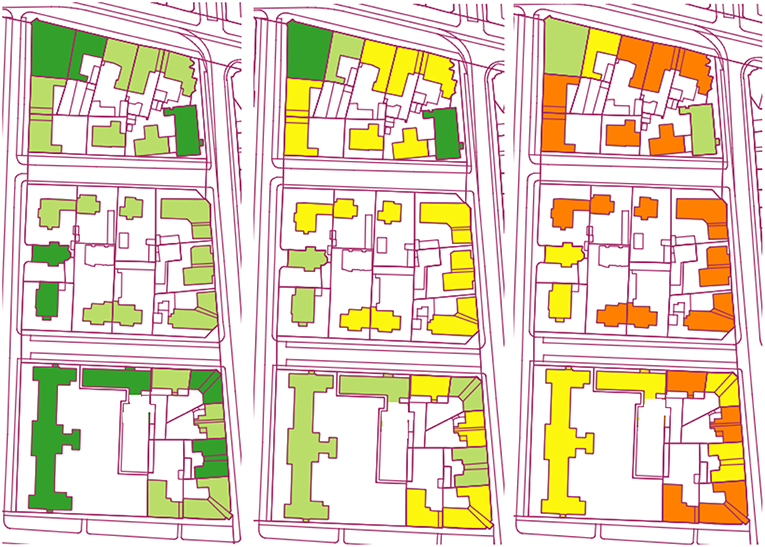
Figure 9. Values of the mean damage grades for three levels of earthquake intensity: (A) VII, (B) VIII, and (C) IX.
For the selected blocks of buildings the assessment of the probability of reaching damage levels for earthquake intensity VII, VIII, and IX, was conducted with the Macroseismic method. In Table 3, the damage probability matrix is presented for the most common type of buildings in the selected blocks—unreinforced masonry structures with flexible floors (M5). The damage probability matrix was obtained using binomial distribution.
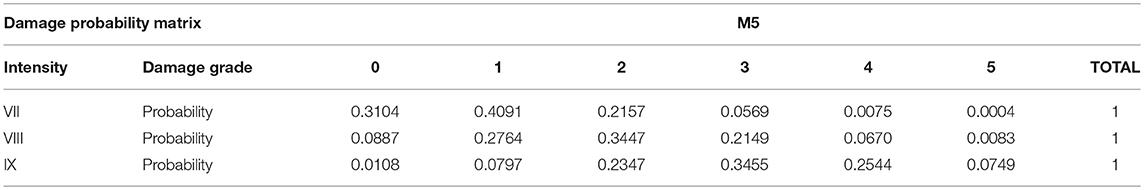
Table 3. Damage probability matrix for M5.
For the VII degree of intensity, as much as 55% of buildings will suffer damage of the 3rd damage grade, and for the IX degree of intensity, an additional 25% buildings will experience the 4th degree of damage, so for these buildings it is questionable if they should be restored after such level of damage.
Capacity Spectrum Method
The capacity spectrum method (CSM) is an analytical method of assessing the earthquake vulnerability which connects the calculation methods with the material characteristics of the structure, thus providing a more detailed investigation of the damage (Calvi and Pinho, 2006).
It can be used at various levels of accuracy, from the one that can quickly assess the risks of large groups of existing buildings, over what can be approximated for the level of behavior when designing a new structure, to the one that is needed for a detailed vulnerability assessment of the existing structures for a certain earthquake intensity (Freeman, 1998).
In the first step, a building model is chosen from the selected building classification. Model must adequately represent the characteristics of the building/group of buildings for which earthquake vulnerability is estimated with regard to the structural system, the floor number, the performance materials and the like.
In the second step, for the selected model the bearing capacity is defined and transformed into a capacity spectrum. The behavior of the structure in the nonlinear region is modeled by the Pushover Analysis. As a relevant view of the behavior of the structural system, the changes of the top floor displacement are observed. They depend on the total applied horizontal (transverse) force and we can show it like the Capacity Curves of the structural system. The requirement curve is compared with the Capacity Curve, and in the intersection of these two curves is the Performance point that approximates the structure response to the given load.
In the third step, the parameters of the Fragility function are estimated and used to estimate the probability of damage. The Fragility curves for each defined marginal condition, for different intensity of earthquake, describe the probability of a collapse or a degree of damage. Marginal conditions represent a state of damage or limitation of use under the same conditions as a structural response (Erduran et al., 2012). The Vulnerability Curves convert material damage to a cash loss, considering Intensity Measurement (IM).
In the fourth step, the Fragility Curve is transformed into the Damage Probability Matrices. The Damage Probability Matrices are obtained by discretizing continuous distributions through the Fragility Functions of damage. They display the probability of reaching a certain level of damage.
Since the unreinforced masonry with wooden floors are most vulnerable class in the study of three city blocks, the CMS method will be applied on this class of buildings in order to provide the comparison between two methods. Apart from basement and ground floor, these buildings have 1–2 floors. The average floor height is 4.2 m and the total height of the building ranges from 6 to 17 m. The use of these buildings is mixed: residential, public and business.
In accordance with the mentioned building characteristics, the building class M5.v_L (unreinforced masonry-old bricks) was selected according to Building Taxonomy-RISK-UE (ELER, 2010).
Vulnerability is calculated and compared for earthquake intensities VII, VIII and IX and related accelerations (ag) according to MKS-64.
Eurocode 8 type 1 spectrum, intended for earthquakes with M> 5.5, was adopted. According to EN 1998-1: 2004, the elastic response spectrum was calculated for the ground type B.
When calculating the elastic response spectrum, periods of 0–2 s, with intervals of 0.5 s, are taken into account.
The reduced elastic response spectrum is calculated by reducing the elastic response spectrum by using the relation:
where: T is the oscillation period of SDOF, Tc is the period from which the constant spectral acceleration ends, Rμ is the reduction factor due to ductility, and μ is the ductility factor (the ratio between the maximum displacement and the displacement during yielding).
Results of Applied Capacity Spectrum Method
For M5.v_L, the values are: μ = 5.17 and T(s) = 0.192 s. The calculation of Capacity Curves in a nonlinear static analysis involved the control points for M5.v_L: Ay = 0.208 g; Dy = 0.0019 m; Du = 0.0098 m (ELER, 2010).
Calculation results: Elastic response spectra, Reduced Elastic response spectra, Capacity Curves and the value of Performance points for certain earthquake intensities are shown in Figure 10.
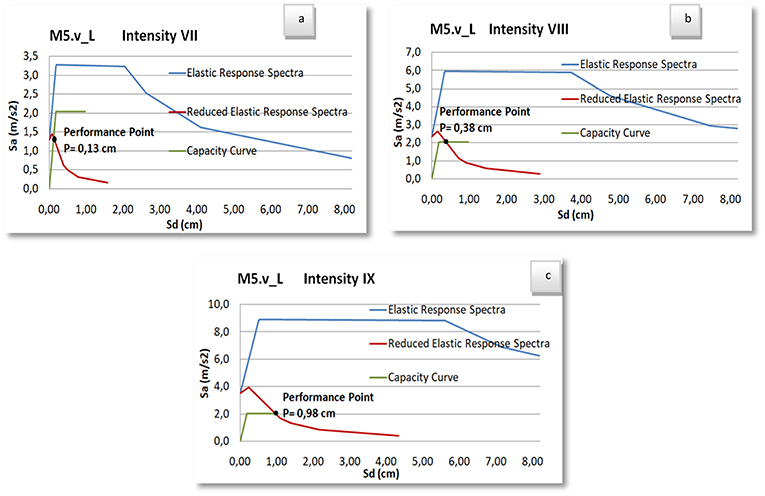
Figure 10. Curve and Performance Point for intensities VII, VIII, IX.
Probability of buildings vulnerability or collapse is calculated using Fragility Functions. The amount of spectral displacement (Sd) for different damage values (Slight, Moderate, Extensive, Complete or No Damage), which were obtained for Performance point of certain building class, denote the abscissa in the coordinate system, while the ordinate is displayed by the conditional values denoting the damage condition either being reached P([Ds = ds]) or exceeded P([Ds > ds]).
The Fragility curves were made according to the Risk-UE Project WP4 (Milutinovic and Trendafiloski, 2003), according to which the construction of the curve is also based on Capacity curves. Levels of damage according to this methodology can be described by the damage index, which is determined through the cost of repair and the cost of the entire replacement of buildings, and by the Fragility curves, or as a function of interstory drift. According to the Risk-UE Project WP4 (Milutinovic and Trendafiloski, 2003), the Fragility curves are the log-normal distribution of the median (Sd, ds) and standard deviations calculated for each limited state. The Fragility curves obtained in this way take into account the variability of the structural damage levels, Capacity curves and the requirements spectrum.
The marginal conditions, i.e., the levels of damage were adopted by D'Ayala et al. (2013). Median spectral displacement, for level of damage Slight, Moderate, Extensive, Complete, were determined using the following expressions:
Where: Dy is the displacement in the yield point, and DU is the displacement in the ultimate point.
Fragility Curves for the earthquake intensity IX are shown in Figure 11.
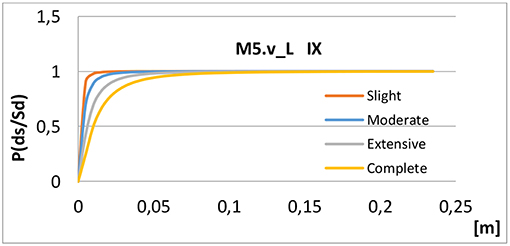
Figure 11. Fragility Curve for the earthquake intensity IX.
To estimate the earthquake vulnerability, Fragility curve for some earthquake intensity using the expression (6), were transformed into a matrix of probability of damage. The matrix results are shown in Table 4.
For earthquake intensity VII, the probability of damage decreases with the increase of the degree of damage, while for IX degree of intensity the probability of damage increases with the increase of the damage degree. VIII degree of intensity is most probable (27%) in the case of a moderate level of damage, and the percentage of damage decreases linearly to the “No damage” level on one side, while and jumpy decreases to the “Extensive” on the other side.
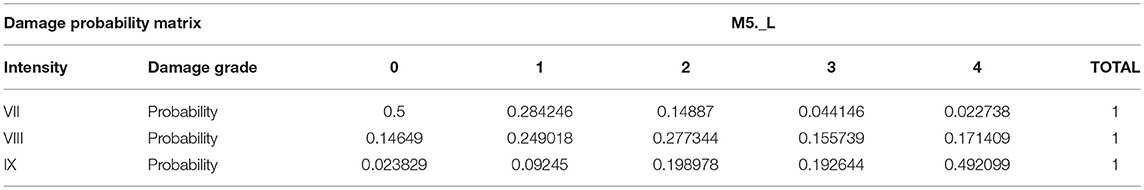
Table 4. Damage probability matrix for M5.v_L.
Observed structures have relatively small natural vibration periods due to their thickness, however, the size of the earthquake response indicators is affected by their ground plan irregularity and unfavorable ground conditions. The interaction of these parameters with the traditional unreinforced masonry buildings of the city Osijek gives a probability of collapse of 3% in the case of earthquake intensity VII, 25% in the case of earthquake intensity VIII and 72% in the case of earthquake intensity IX.
Comparison of Probabilistic and Analytically Obtained Damage Probabilities
Concepts and procedures of the methods used to evaluate the earthquake vulnerability for the buildings in Osijek database are different but they still provide an opportunity for quantitative comparison of the calculated damage probabilities.
In order to make a comparison of the results shown in Table 5, the difference in damage degree scales from the two approaches has been overcome with the assumption of an equivalent degree of damage “4 + 5” (Giovinazzi et al., 2006).
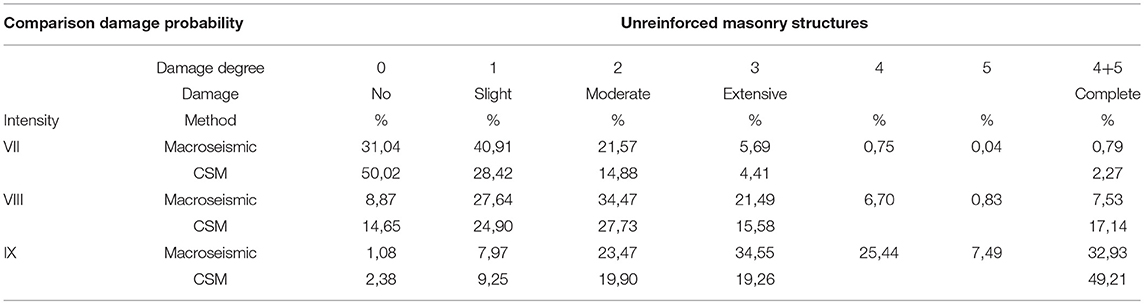
Table 5. Comparison of estimated damage probabilities.
The comparison was carried out for the most common type of buildings in the database-unreinforced masonry structures.
For all three analyzed intensities of an earthquake, the probability of reaching damage degree 0 is higher if it is estimated using the CSM, while the probabilities for reaching other damage degrees are greater using the Macroseismic method.
According to the CSM method, even in the case of an earthquake of VIII intensity, it is only 17% probability that the resulting stresses will cause cracks that could lead to the collapse of the buildings, or to the “complete” damage. The probability obtained by the Macroseismic method for the same damage grade is more than 50% less from the probability obtained by the CSM method. For VII and IX intensity, the probability of reaching a certain degree of damage, obtained by the used methods, do not show such deviations.
The results of the earthquake vulnerability calculations by the Macroseismic method show that slight damage could occur in most of the analyzed buildings in the case of intensity VII (the most likely damage level), while according to the calculations by the CSM the most likely damage level is “No damage.” For intensity VIII, the calculations by both methods show that the slight to moderate damage can be expected. For the intensity IX, the most likely damage level is 3 (“Extensive damage”), and there is also a significant probability (32%) for the occurrence of buildings collapse. Most likely damage level, obtained by CSM for intensity IX is 4, which presupposes a probability of 49% for the collapse of the buildings.
The differences between the results of the used methods can be explained by the use of different distributions, i.e., the binomial distribution in the Macrosismic method and the log-normal distribution in the CSM.
Conclusion
Vulnerability is multi-dimensional, determined by physical, economic, institutional and human factors. It is dynamic, dependent on time and spatial scale, and specific building ground floor conditions.
The estimation of vulnerability is based on buildings database.
In this paper, the buildings database of the city Osijek is presented. So far this database contains the collected and processed data on locations, structural and geometric characteristics and other data, for the total of 1,075 buildings. The purpose of the database is to enable an assessment of the earthquake vulnerability for the existing city buildings.
The buildings vulnerability was conducted and estimated for the several blocks of the city Osijek by two methods: analytical—Capacity spectrum method (CSM) and empirical—macroseismic method.
Buildings for which this calculation was intended have not been designed and built in accordance with earthquake resistant requirements, and have been revised, upgraded or modified for use, largely without thinking about the remaining sufficient stability and bearing capacity. Although due to age and use, there has been a loss of the load resistance properties and increase in fatigue of the material embedded in them, a major restoration or earthquake reinforcements has not been carried out.
The probability of reaching three different damage grades: Slight, Moderate and Extensive, obtained using the applied methods for the observed earthquake intensities, is approximately the same.
With Macroseismic method, for VII intensity a 20% less chance is obtained for reaching damage degree 0, than with CSM.
The Capacity spectrum method predicts a lower probability of the damage degree that represents the buildings collapse, than the Macroseismic method. It is assumed that these deviations have caused the behavior modifiers used in the Macroseismic method, which, depending on their values, may affect the increase/decrease of the estimated earthquake resistance of the buildings, especially for the marginal damage grades.
Despite the aforementioned, due to the low heights and massive masonry walls the estimated buildings show relatively high earthquake resistance and small earthquake risk.
The results of the analytical estimation of earthquake vulnerability, which is based on numerical-analytical calculations, can be compared to a certain level with the results of the empirical estimation, which is based on classical probability and fuzzy-set theory. However, this comparison cannot be done directly, first because of the use of different distributions (binomial distribution in the empirical method and log-normal distribution in the analytical method), and the second, because the probabilities calculated by the CMS method are related to all buildings in the selected group of buildings, while the probabilities obtained by the Macroseismic method are calculated considering the behavior modifier of each building and hence they refer to the mean damage grade of each building.
The estimated vulnerability can serve as a basis for planning and implementation of maintenance, reinforcement or adaptation of existing masonry and other buildings that were designed and constructed without taking into account the earthquake impact on their bearing capacity and stability. Besides that such estimation can indicate to the shortcomings that should be avoided during design and construction of new buildings, in order to minimize future earthquake damages.
Author Contributions
MH-N provided macroseismic method and wrote draft version, GP provided CSM method, analysis of building database. BB analysis of database, final revision of manuscript.
Conflict of Interest Statement
The authors declare that the research was conducted in the absence of any commercial or financial relationships that could be construed as a potential conflict of interest.
References
Barbat, A. H., Moya, F. Y., and Canas, J. (1996). Damage scenarios simulation for seismic risk assessment in urban zones. Earthquake Spectra 12, 371–394. doi: 10.1193/1.1585889
Brzev, S., Scawthorn, C., Charleson, A. W., Allen, L., Greene, M., Jaiswal, K., et al. (2013). GEM Building Taxonomy, Version2.0. GEM Tecnical report 2013-02 V1.0.0.
Bulajić, B. Ð., Bajić, S., and Stojnić, N. (2018). The effects of geological surroundings on earthquake-induced snow avalanche prone areas in the Kopaonik region. Cold Regions Sci. Technol. 149, 29–45. doi: 10.1016/j.coldregions.2018.02.005
Bulajić, B. Ð., Manić, M. I., and Ladinović, Ð. (2013). Effects of shallow and deep geology on seismic hazard estimates – a case study of pseudo-acceleration response spectra for the north-western Balkans. Nat. Hazards 69, 573–588. doi: 10.1007/s11069-013-0726-7
Calvi, G. M., and Pinho, R. I. (2006). Development of seismic vulnerability assessment methodologies over the past 30 years. ISET J. 43, 75–104.
Croatian Bureau of Statistics (2011). Census of Population, Households and Dwellings 2011, Population by Citizenship, Ethnicity, Religion and Mother Tongue. Statistical Reports. Croatian Bureau of Statistics (Zagreb).
D'Ayala, D., Meslem, A., Vamvatsikos, D., Porter, K., Crowley, H., and Silva, V. (2013). Guidelines for Analytical Vulnerability Assessment-Low/Mid-Rise. GEM Tehnical Report 8. doi: 10.13117/GEM.VUL-MOD.TR2014.12
ELER (2010). Technical Manual. Earthquake Loss Estimation Routine. Bogazici University. Department of Earthquake Engineering, (Istanbul).
EN 1998-1:2004. (2004). Eurorcode 8: Design of Structures for Earthquake Resistance. Part 1: General Rules, Seismic Actions and Rules for Buildings. Bruxeles: European Committee for Standardization.
Erduran, E., Magsi, A. M., Gill, A. W. M., and Lindholm, C. (2012). Earthquake Risk Assessment for Quetta. Report 12/02 (version 1.0). 30 pages Kjeller (Norway) September 2012. Available online at: http://www.pmd.gov.pk/seismic/3.pdf
European Macroseismic Scale (EMS)- (1998). Ur. Grünthal, Gottfried, M., Roger M.W., Schwarz, J., Stucchi, M. Cahiers du Centre Européen de Géodynamique et de Séismologie, vol. 15, (Luxembourg).
Feriche, M., Vidal, F., Jimenez, C., and Navarro, M. (2008). “A straightforward method applicable to Earthquake Damage Scenarios and Early Loss Assessment in urban areas of Southern Spain,” in 31st General Assembly of the European Seismological Commission ESC, Hersonissos, (Crete).
Freeman, S. A. (1998). “The capacity spectrum method as a tool for seismic design,” in Proceedings of the Eleventh European Conference on Earthquake Engineering, September 6–11th 1998 (Paris: A. A. Balkema).
Giovinazzi, S. (2005).The Vulnerability Assessment and the Damage Scenario in Seismic Risk Analysis. (Doctoral thesis), Technical University Carolo-Wilhelmina at Braunschweig, University of Florence, Napier.
Giovinazzi, S., and Lagomarsino, S. (2004). “A macroseismic method for the vulnerability assessment of buildings,” in 13th World Conference on Earthquake Engineering, Paper No. 896. (Vancouver).
Giovinazzi, S., Lagomarsino, S., and Pampanin, S. (2006).”Vulnerability methods and damage scenario for seismic risk analysis as support to retrofit strategies: an european perspective,” in New Zealand Society for Earthquake Engineering (NZSEE) Conference.
Hadzima-Nyarko, M., Nikić, D., and Morić, D. (2018). Seismic Engineering-The Seismic Vulnerability of Structures (in Potresno inženjerstvo-Procjena oštetljivosti zgrada). Osijek: Faculty of Civil Engineering and Architecture in Osijek.
Kalman Šipoš, T., and Hadzima-Nyarko, M. (2018). Seismic risk of croatian cities based on building's vulnerability. Tehnički Vjesnik 25, 1088–1094. doi: 10.17559/TV-20170708190145
Lagomarsino, S., and Giovinazzi, S. (2006). Macroseismic and mechanical models for the vulnerability and damage assessment of current buildings. Bull. Earthquake Eng. 4, 415–443. doi: 10.1007/s10518-006-9024-z
Lee, V. W., Manić, M. I., Bulajić, B. Ð., Herak, D., Herak, M., and Trifunac, M. D. (2015). Microzonation of Banja Luka for performance-based earthquake-resistant design. Soil. Dyn. Earthq. Eng. 78, 71–88. doi: 10.1016/j.soildyn.2014.06.035
Lee, V. W., Trifunac, M. D., Bulajić, B. Ð., and Manić, M. I. (2016a). A preliminary empirical model for frequency-dependent attenuation of Fourier amplitude spectra in Serbia from the Vrancea earthquakes. Soil. Dyn. Earthq. Eng. 83, 167–179. doi: 10.1016/j.soildyn.2015.12.004
Lee, V. W., Trifunac, M. D., Bulajić, B. Ð., and Manić, M. I. (2016b). Preliminary empirical scaling of pseudo relative velocity spectra in Serbia from the Vrancea earthquakes. Soil. Dyn. Earthq. Eng. 86, 41–54. doi: 10.1016/j.soildyn.2016.03.007
Lee, V. W., Trifunac, M. D., Bulajić, B. Ð., Manić, M. I., Herak, D., and Herak, M. (2017a). Seismic microzoning of Belgrade. Soil. Dyn. Earthq. Eng. 97, 395–412. doi: 10.1016/j.soildyn.2017.02.002
Lee, V. W., Trifunac, M. D., Bulajić, B. Ð., Manić, M. I., Herak, D., Herak, M., et al. (2017b). Seismic microzoning of Štip in Macedonia. Soil. Dyn. Earthq. Eng. 98, 54–66. doi: 10.1016/j.soildyn.2017.04.003
Lee, V. W., Trifunac, M. D., Bulajić, B. Ð., Manić, M. I., Herak, D., Herak, M., et al. (2017c). Seismic microzoning in Skopje, Macedonia. Soil. Dyn. Earthq. Eng. 98, 166–182. doi: 10.1016/j.soildyn.2017.04.007
Milutinovic, Z. V., and Trendafiloski, G. S. (2003). An Advanced Approach to Earthquake Risk Scenarios with Applications to Different European Towns. WP4: Vulnerability of Current Buildings RISK-UE. Contract: EVK4-CT-2000-00014 WP4. Available online at: http://www.civil.ist.utl.pt/~mlopes/conteudos/DamageStates/Risk%20UE%20WP04_Vulnerability.pdf
Salgado-Gálvez, M. A., Cardona, O. D., Carreño, M. L., and Barbat, A. H. (2015). “Probabilistic seismic hazard and risk assessment in Spain,” in Centro Internacional de Métodos Numéricos en Ingeniería Edificio C1, Campus Norte UPC Gran Capitána S/N 08034 (Barcelona).
Sandi, H., Pomonis, A., Francis, S., Georgescu, E. S., Mohindra, R., and Borcia, I. S. (2007). “Seismic vulnerability assessment. Methodological elements and applications to the case of Romania,” in Proceedings of the International Symposium on Strong Vrancea Earthquakes and Risk Mitigation, (Bucharest), 329–341.
SYNER-G (2011). Systematic Seismic Vulnerability and Risk Analysis for Buildings, Lifeline Networks and Infrastructures Safety Gain - D.3.1 - Fragility functions for common RC building types in Europe. Technical report, European Research Project funded by FP7, Project No 244061, Seventh Framework Programme.
Keywords: building topology, building database, macroseismic method, capacity spectrum method, seismic vulnerability assessment
Citation: Pavić G, Bulajić B and Hadzima-Nyarko M (2019) The Vulnerability of Buildings From the Osijek Database. Front. Built Environ. 5:66. doi: 10.3389/fbuil.2019.00066
Received: 09 January 2019; Accepted: 07 May 2019;
Published: 24 May 2019.
Edited by:
Ehsan Noroozinejad Farsangi, Graduate University of Advanced Technology, IranReviewed by:
Claudia Casapulla, University of Naples Federico II, ItalyFadzli Mohamed Nazri, University of Science, Malaysia, Malaysia
Copyright © 2019 Pavić, Bulajić and Hadzima-Nyarko. This is an open-access article distributed under the terms of the Creative Commons Attribution License (CC BY). The use, distribution or reproduction in other forums is permitted, provided the original author(s) and the copyright owner(s) are credited and that the original publication in this journal is cited, in accordance with accepted academic practice. No use, distribution or reproduction is permitted which does not comply with these terms.
*Correspondence: Marijana Hadzima-Nyarko, bWhhZHppbWFAZ2Zvcy5ocg==