 David De-León-Escobedo
95% of researchers rate our articles as excellent or good
Learn more about the work of our research integrity team to safeguard the quality of each article we publish.
Find out more
ORIGINAL RESEARCH article
Front. Built Environ. , 11 December 2018
Sec. Bridge Engineering
Volume 4 - 2018 | https://doi.org/10.3389/fbuil.2018.00076
Sometimes, in the absence of a strict supervision, bridges are built with a reinforced concrete strength below its nominal value. If the difference is not so high to consider the bridge demolition, a question arises about how much the compensation should be. In this paper, a rational basis to orient negotiations, taken as the ratio between expected life-cycle costs for the actual and nominal concrete strengths is proposed and illustrated for a bridge in Mexico City. The calculation of the expected life-cycle cost includes the bridge annual failure probability under the dead, live and seismic loads and the costs of failure consequences. Uncertainty is considered only on the seismic load. The bridge annual failure probability is calculated by FORM approximation and by considering scenario ground accelerations and the seismic hazard curve for the bridge site. With the total probability theorem, the overall bridge annual failure probability is approximated and the expected life-cycle costs are calculated. The process is repeated for several values of reinforced concrete strength and the compensation factors are calculated and plotted for several costs of consequences. In order to explore several cases, two reinforced concrete strength, two pier heights: 4 and 8 m, three sites in Mexico with different seismicity and three levels of failure consequences, are considered. In these examples, the dominant failure mode is the pier axial load-bending moment interaction as a result of the acting loads combination. As expected, the factors increase for a larger difference of concrete strengths, for the higher piers, for a stronger seismicity and for larger costs of failure consequences. The factors were calculated for a nominal concrete strength of 200 Kg/cm2, and variations of 180 and 160 Kg/cm2, and for a nominal strength of 420 Kg/cm2, and variations of 400 and 380 Kg/cm2.
Reinforced concrete bridges are critical components for the transportation network all around the world. Sometimes, in places where the supervision tasks are not strict, bridges are built with reinforced concrete provided with a strength lower than the specified value. If the difference is considered to be too high, demolition and reconstruction are mandatory actions. However, if that difference allows for the consideration of reinforcements/repairs a question arises about how much the concrete supplier should pay. In order to set a basis to start negotiations, compensation factors based on potential losses may serve as a starting point.
In the past, several reliability-based approaches have been presented to calculate compensation factors (Rosenblueth et al., 1974). In this treatment the earthquake occurrence was represented by a Poisson process and the cost of failure consequences were not included explicitly.
These pioneering work opened the field to generate risk and reliability-based specifications, not just for the construction industry but for any kind of market products.
Several physical models to assess the bridge deterioration due to corrosion have been available. One of the simplest models to predict the ingress of chloride ions in concrete are based on the diffusion equation (Crank, 1975; Crank and Gupta, 1975), while more advanced and recent methods use Markov Chains to model ion transport mechanisms in concrete bridges (Zhang et al., 2018). The corrosion deterioration of concrete bridges has received some attention to propose preventive maintenance strategies for groups of bridges (Thoft-Christensen, 2003) and to estimate the service life of concrete infrastructure (Pacheco-Torgal et al., 2018).
Structural redundancy for both system reliability and damage assessment, have been anayzed (Frangopol and Curley, 1987).
Some guidelines have been proposed to include reliability concepts on the structural design requirements (ISO 2394, 1998).
When data from inspections and condition assessments are available, statistical models for the evolution of condition states can be used as an alternative to physical models. The transition probabilities for these models are usually estimated using statistics from inspection data but they have also been derived from simulations with physical models that are correlated to condition states (O'Connor et al., 2011).
The importance of some variables were studied through variability and sensitivity analyses (Kong and Frangopol, 2005).
Maintenance and rehabilitation strategies have been developed by comparing load rating and reliability methods for bridges (Estes and Frangopol, 2005). Condition, safety and cost profiles for bridges with deterioration were proposed with reliability formulations (Neves and Frangopol, 2005). Lifetime optimization for deteriorating structures have been established under a probabilistic framework (Frangopol and Bucher, 2006).
Another formulation was proposed, for the Transportation Department of Arizona US, to compensate deficits on the concrete strength (Laungrungrong et al., 2008), although neither the building failure probability nor the future expected losses were considered.
Some basis for bridge risk management were presented for a reinforced concrete bridge in Mexico City (De-León and Delgado, 2008).
A framework to measure robustness, the implications for system modeling and the acceptable levels of robustness have been discussed (Baker et al., 2008).
Structural health monitoring techniques have been used to develop probability-based multiple criteria of bridge maintenance optimization (Frangopol and Orcesi, 2011).
Fragility analyses have been used to assess the seismic performance and retrofit of reinforced concrete buildings and bridges (Kumar and Gardoni, 2014). Also, the combined effect of cumulative seismic damage and corrosion was studied to assess the life-cycle cost of reinforced concrete bridges (Kumar et al., 2009).
Results of load tests and assessment of cracks by optical fiber are examples of recent technology used to appraise the bridge safety level (Olaszek et al., 2014; Rodriguez et al., 2015)
Recently, a comprehensive review of bridge damage detection based on the consideration of vibration data was presented (Casas and Moughty, 2017).
Financial measures to capture the future costs and revenues have been introduced (Gardoni et al., 2016).
Recently, a number of novel studies have been published, like a procedure to evaluate the impact of deficits on reinforce concrete strength over the seismic safety of buildings was proposed (De-León-Escobedo et al., 2017). Also, a review on bridges damage detection based on vibration analyses (Casas and Moughty, 2017) allows for the consideration of new vibration-computer analyses techniques for medium span bridges.
Examples in this work were reviewed following current design guidelines (Gobierno de la Ciudad de México, 2017a,b).
Bridges have been ranked at project and network levels based on reliability calculations, deterioration models, and cost of failure consequences (Frangopol and Yang, 2018).
Recently, a robust optimization framework has been proposed for bridges under climatic change (Frangopol et al., 2018a). Also, modern concepts as durability, economic efficiency, and green objectives are being introduced on the Life-Cycle design of concrete structures (Frangopol et al., 2018b).
A Markov chain procedure has been proposed to assess the bridge service life based on the chloride ion transport on reinforce concrete bridges in Canada (Zhang et al., 2018). And the life-cycle reliability of reinforced concrete bridges was studied under multiple hazards (Yanweerasak et al., 2018).
This paper deals with the impact of the deficit on the reinforce concrete strength over the expected life-cycle cost of bridges and proposes compensation factors in terms of the ratio between expected life-cycle costs for the actual and nominal concrete strengths. The formulation is applied to bridges under three different seismic hazard in Mexico, for two piers heights and three levels of the cost of failure consequences, to involve the economic importance of the bridge.
See a flowchart with the proposed procedure in figure 1. The resisting point (A, BM) is obtained through the interaction diagram (González COM, 2006): the demand point (P, M) is drawn into the diagram area, a straight line is drawn to join the origin to this demand point, then, this line is extended to intercept the curve of the interaction diagram. The intersection point is the resistant point. See figure 2.
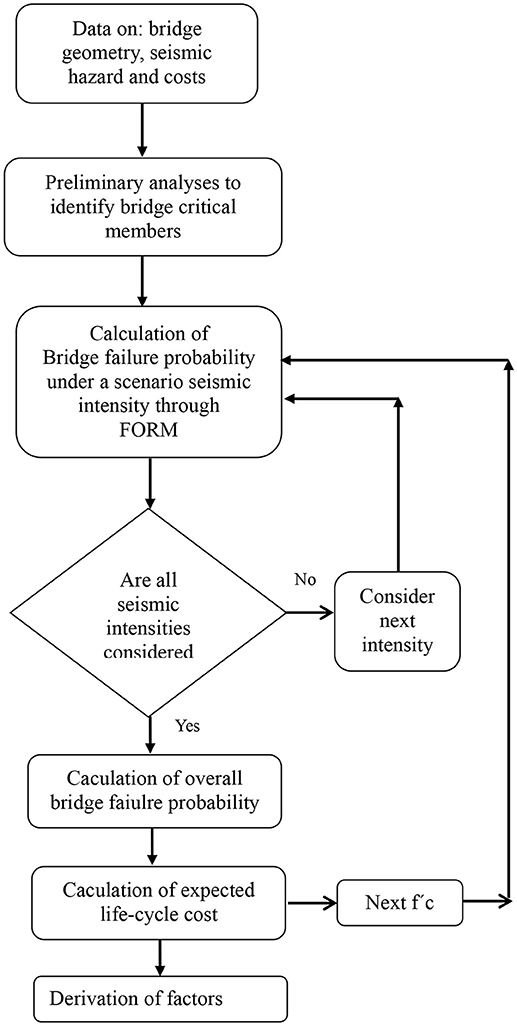
Figure 1. Flowchart of proposed procedure.
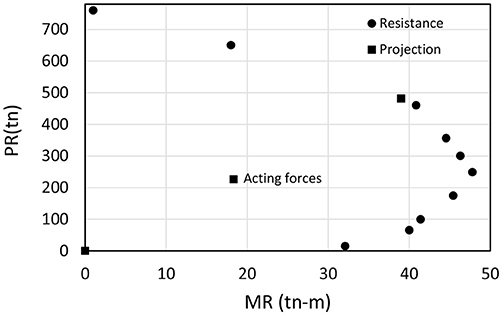
Figure 2. Interaction diagram for critical pier with acting and resisting forces.
The expected life-cycle cost E(LCC) is (Ang and De Leon, 2005):
Where Ci is the bridge initial cost and E(DC) the present value of the expected cost of damage for a year, which is composed by the present value factor PVF, the annual failure probability and the cost of the failure consequences.
The present value factor is:
where r = net annual interest rate, and T = structure lifetime.
The bridge annual failure probability is:
As the governing failure mode is the bending moment-axial force on the columns, from previous analyses, the following state function is considered:
Where: A is the axial force (act = acting, r = resisting); BM the bending moment (act = acting, r = resisting), i = i-th. scenario ground acceleration
Uncertainty is considered only on the seismic demand.
From FORM, and assuming that the bridge is a series system (the failure of the critical member constitutes on the bridge failure), the annual reliability index is calculated:
For the considered example, a series of preliminary analyses indicates that the critical member is any of the columns and that shear failure is prevented from the design details. Therefore,
And the annual failure probability is:
The bridge taken as an example is one located in Mexico City and it is a vehicles bridge built on the Benito Juarez International airport area, which is in the transition seismic zone III of the city. The bridge has a 400 m total span and the non-linear response analyses were performed by using a finite element-based commercial software (RAM Advanse, 2006). The reinforced concrete strength is f′c = 200 and 420 kg/cm2 and the yielding strength of rebars is fy = 4,200 kg/cm2.
Bridge description.-
The lateral view of a longitudinal axis of the bridge may be seen in Figure 3.
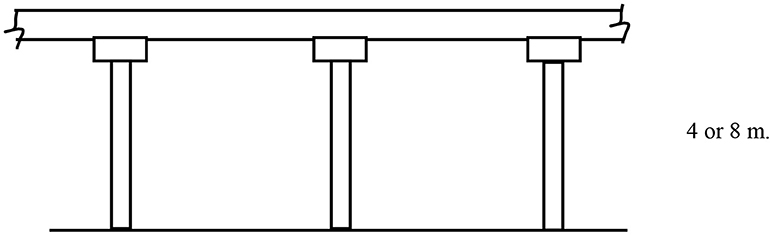
Figure 3. Lateral view of a longitudinal axis of the bridge.
Heights 4 and 8 m.
The typical pier, with circular cross section, appears in Figure 4. Essentially, the main structural components of the bridge are: the transverse cap, two piers, the footing, and the piles.
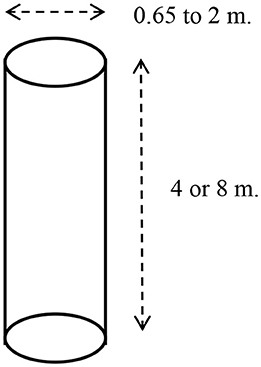
Figure 4. Typical pier of the bridge.
A series of preliminary analyses reveals that the critical failure mode is the axial load-bending moment combination as a result of the dead+live+seismic demand over the bridge.
By following the above described procedure, several interaction diagrams are calculated for several values of the concrete strength f′c. As an example of the comparison of diagrams for 2 values of f′c, under the same seismic intensity ai and same loss level, Figure 5 shows the diagrams for f′c = 200 and 160 Kg/cm2 and for ai = 0.5 g.
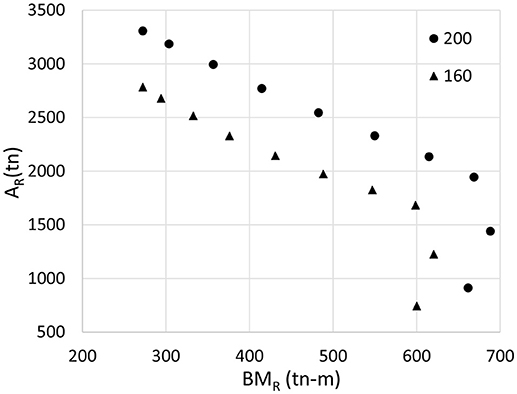
Figure 5. Interaction diagram for critical pier for f′c = 160 and 200 Kg/cm2.
Then, the bridge failure probability is calculated by using Equations (5–8) and the expected life-cycle cost through Equations (1, 2).
The axial load on the pier is obtained from the bridge dead load and the vehicles weight (see Table 1).
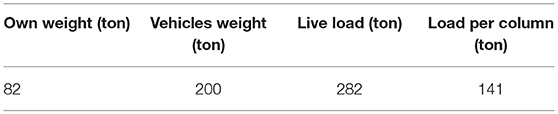
Table 1. Calculation of axial load on the critical pier.
Also, the seismic hazard (in this case, Mexico City) of the site is considered. Figure 6 shows the cumulative probability distribution of seismic ground acceleration.
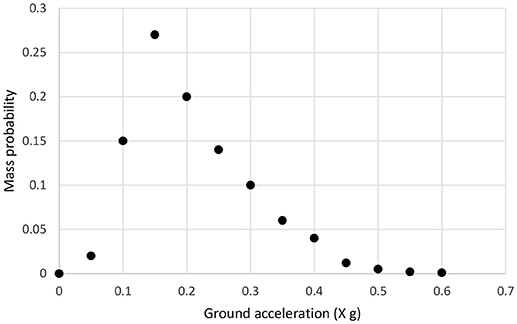
Figure 6. Cumulative probability distribution of ground acceleration.
Ground accelerations and probabilities from Figure 6 are discretized, see Table 2.
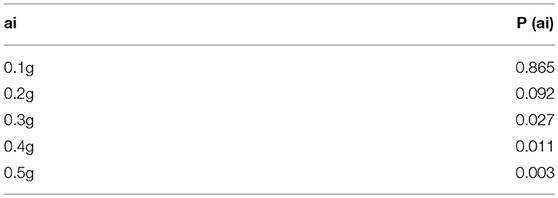
Table 2. Scenario seismic ground accelerations and occurrence probabilities.
In addition, the initial costs and failure costs are estimated in terms of the material and labor costs and the cost of failure consequences. See Table 3 for the initial costs for scenario ground accelerations.
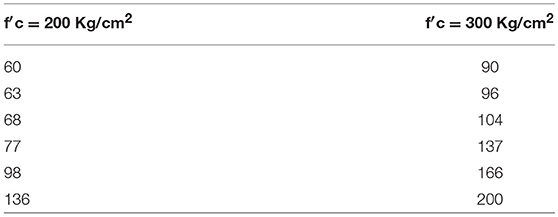
Table 3. Initial costs for scenario seismic ground accelerations (million USD).
Calculations of failure probability are performed for all combinations of f′c, pier height and seismic intensity, and the expected life-cycle cost is assessed for the three values of costs of failure consequences.
The cost of failure consequences is considered first to be 1,000 million USD and, in order to assess the factors sensitivity for the losses level, this cost is considered to be also 500 and 100 million USD.
The factors for nominal f′c = 200 Kg/cm2, loss level of 1,000, 500, and 100 million USD, and values of f′c = 200, 180, and 160 Kg/cm2, are shown in Figure 7 for H = 4 m and in Figure 8 for H = 8 m.
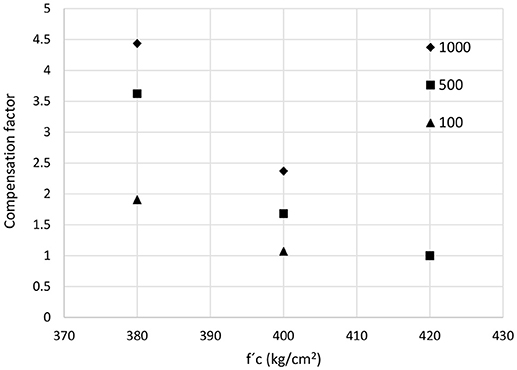
Figure 7. Compensation factors for several actual values of f′c, several losses levels, H = 4 m and nominal f′c = 420 Kg/cm2, Ciudad de México.
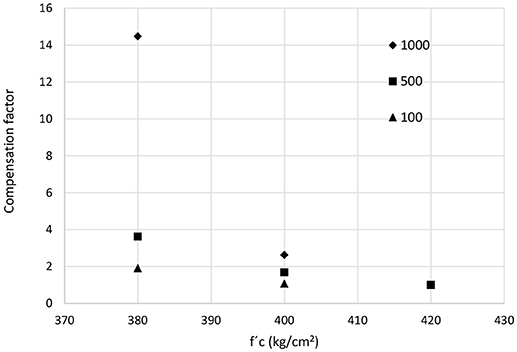
Figure 8. Compensation factors for several actual values of f′c, several losses levels, H = 8 m and nominal f′c = 200 Kg/cm2, Ciudad de México.
Also, the variation on the reliability index for the same actual values of concrete strength, is shown in Figure 9.

Figure 9. Reliability index for a bridge in Mexico City and several actual values of f′c, H = 4 and 8 m.
Also, the factors and the variation of the reliability index were calculated for H = 8 m, assuming that the nominal concrete strength is f′c = 420 Kg/cm2, for a several actual values of concrete strength of 400 to 380 Kg/cm2. However, it was found that the factors do not have a significant variation and the reason is that a higher nominal concrete strength produces a higher values of the reliability index (lower failure probabilities) and, therefore, the expected losses have a lower variation respect to the one showed for a nominal strength of 200 Kg/cm2.
The variation on the reliability index, for H = 8 m, is shown in Figure 9.
The cumulative probability of the seismic intensities in Acapulco, a city located in the Pacific coast of Mexico, 380 km to the south of Mexico City, is shown in Figure 10. Table 4 shows the ocurrence probabilities.
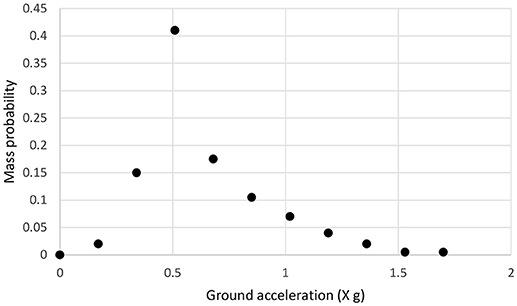
Figure 10. Mass probability distribution of ground acceleration for Acapulco.
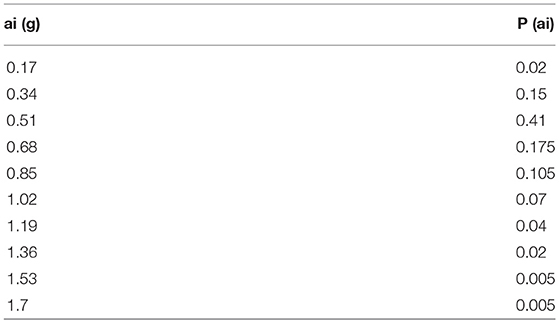
Table 4. Scenario seismic ground accelerations and occurrence probabilities for Acapulco.
Given the stronger seismic demands in Acapulco, the piers design shall consider larger diameters and larger number and size of rebars. See Table 5 for the initial costs for scenario ground accelerations.
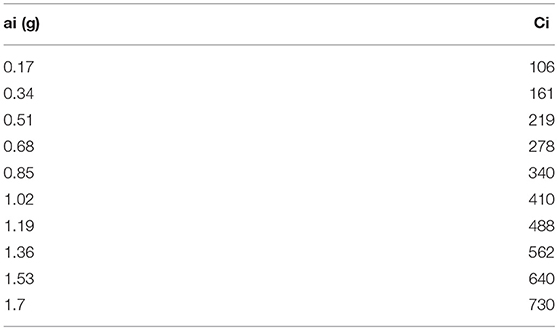
Table 5. Initial costs for scenario seismic ground accelerations (million USD) for Acapulco and H = 4 m, f′c = 420 kg/cm2.
Bridge failure probabilities and expected life-cyle costs are assessed and the compensation factors are calculated.
Compensation factors were also calculated for H = 4 and 8 m, as seen in Figures 11, 12.
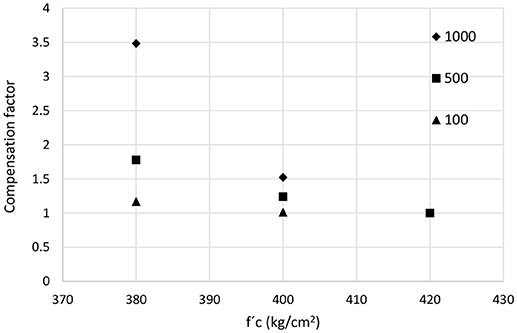
Figure 11. Compensation factors for several actual values of f′c, several losses levels, H = 4 m and nominal f′c = 200 Kg/cm2, Acapulco.
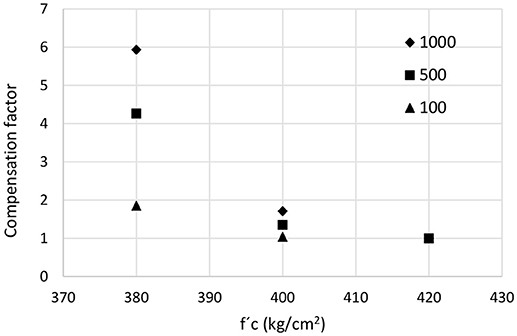
Figure 12. Compensation factors for several actual values of f′c, several losses levels, H = 8 m and nominal f′c = 420 Kg/cm2, Acapulco.
The variation on the bridge reliability index is calculated, for H = 4 and 8 m, and the results are plotted in Figure 13.
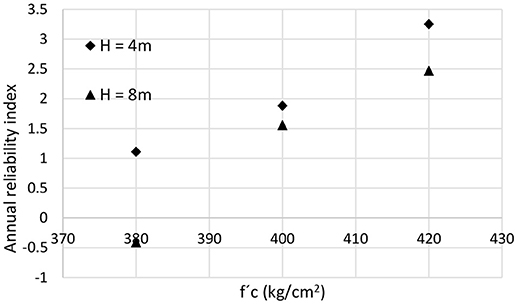
Figure 13. Reliability index for several actual values of f′c, H = 4 and 8 m, Acapulco.
The cumulative probability of the seismic intensities in Oaxaca, a city located at the southeast of Mexico City, at 530 km, is observed in Figure 14. Table 6 shows the ocurrence probabilities.
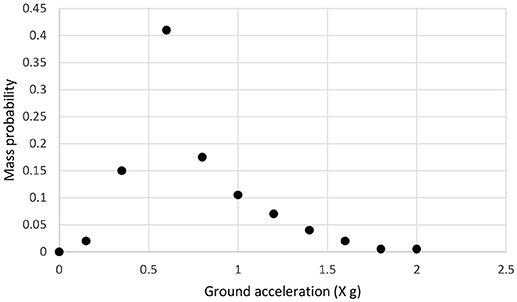
Figure 14. Mass probability distribution of ground acceleration, Oaxaca.
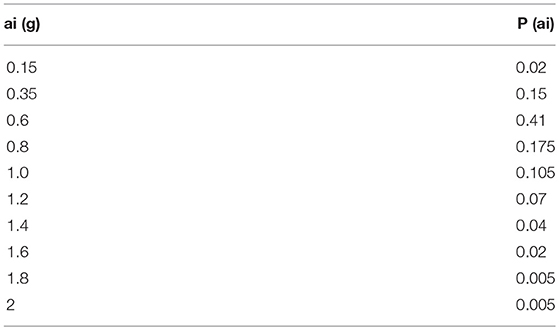
Table 6. Scenario seismic ground accelerations and occurrence probabilities for Oaxaca.
Given the stronger seismic demands in Oaxaca, the piers design shall consider larger diameters and larger number and size of rebars. See Table 7 for the initial costs for scenario ground accelerations.
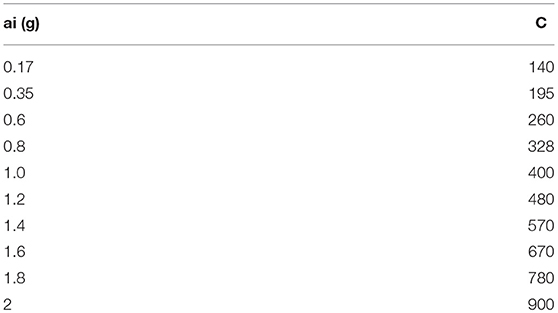
Table 7. Initial costs for scenario seismic ground accelerations (million USD) for Oaxaca, H = 4 m and f'c = 420 kg/cm2.
Bridge failure probabilities and expected life-cyle costs are assessed and the compensation factors are calculated.
Compensation factors were also calculated for H = 4 and 8 m, as seen in Figures 15, 16.
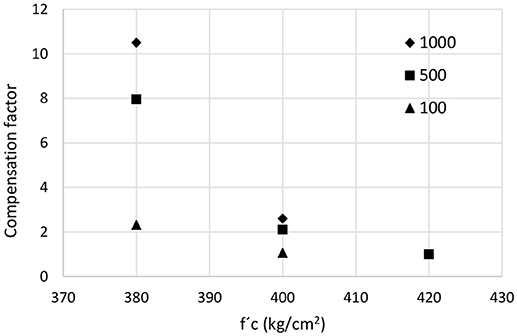
Figure 15. Compensation factors for several actual values of f′c, several losses levels, H = 4 m and nominal f′c = 200 Kg/cm2, Oaxaca.
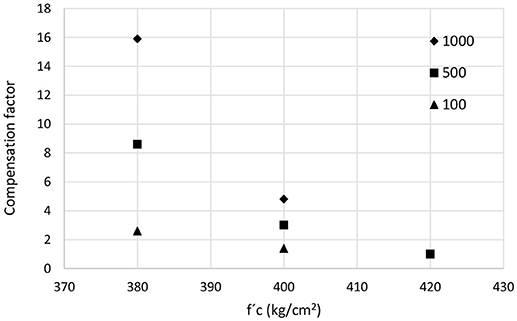
Figure 16. Compensation factors for several actual values of f′c, several losses levels, H = 8 m and nominal f′c = 420 Kg/cm2, Oaxaca.
The variation on the bridge reliability index is calculated, for H = 4 and 8 m, and the results are plotted in Figure 17.
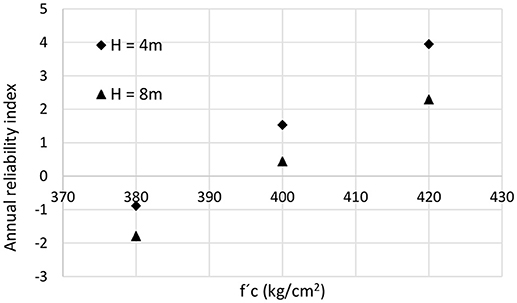
Figure 17. Reliability index for several actual values of f′c, H = 4 and 8 m, Oaxaca.
The deficit on concrete strength produces, as expected, an increment on the failure probability and, therefore, on the expected life-cycle cost. It is worthy to note that, as the difference between actual and nominal concrete strength, and as the bridge importance increases, the compensation factor increases too. Also, as the pier height increases, the compensation factor increases because a certain deficit on concrete strength produces larger deficits on the resisting moments and, therefore, larger failure probabilities and larger expected losses. Similarly, concrete strength deficits on sites with a higher seismic hazard, produce larger failure probabilities and larger compensation factors. This is verified for Mexico City, Acapulco, and Oaxaca as the seismic intensities were taken into account. However, the frequency contents and duration should be incorporated in future studies to consider the effect of the specific dynamic characteristics and fatigue vulnerability of the bridge.
If the provided concrete strength is higher than the nominal value, the factor is < 1, with the meaning that a bonus may be payed due to the additional benefits, or reduced expected losses.
In the case of Mexico City with a nominal concrete strength of 200 Kg/cm2, or higher, the deficit on strength up to 220 Kg/cm2, ~25% on reduction, is not significant. The reason is that, for these higher values of concrete strength, the failure probability is lower than for strengths of 200 Kg/cm2 and, then, the increment of the values of expected losses, which depend on the failure probability, is also lower.
Because of the shape of the seismic hazard curve for Mexico City, the range of the most significant seismic intensities was between 0.15 and 0.3 g. The conditional failure probabilities for these scenario intensities were the most significant contribution on the total failure probability. For the case of Acapulco,
The present value factor considered a net annual interest rate of 8% and a bridge lifetime of 200 years. From these values, the factor resulted on a value slightly higher than 12 which represent that the cost of future seismic damages on the bridge is about 12 times the average cost for a single earthquake.
Also, the loss levels of 1,000, 5,000, and 10,000 million USD intended to consider three importance levels for the bridge, accounting for 3 levels of economic and human losses according to the traffic and number of human lives on risk (moderate, high, and extremely high), which correspond to 3 levels of traffic volume and population density in Mexico City.
One of the shortcomings of the proposed procedure is the assumption that the bridge is built with a uniform concrete strength for the whole structure. Another one is that the bridge type is a slab supported by beams and a cap to distribute the load to piers and piles. Other structural types require the corresponding adaptation of the proposed procedure, especially on the failure mode and state function G.
A reliability-based procedure was proposed and illustrated to account for the concrete strength deficits that may occur on reinforced concrete bridges located on seismic zones.
The compensation factors may serve a starting point to initiate negotiations between the involved parts.
For the analyzed case, the factors were calculated considering that the nominal concrete strength is 200 Kg/cm2 and they ranged from 1 to 9 for the most unfavorable combination of actual concrete strength (140 Kg/cm2) and highest losses level (10,000 million USD).
It is recommended to extend the procedure to consider other structural types, other seismicity levels, and combination of concrete strengths on the bridge structural components.
The procedure may be adapted to consider other defects, either manufacturing or construction imperfections, to derive tolerances in geometry, and other material properties.
The author confirms being the sole contributor of this work and has approved it for publication.
The author declares that the research was conducted in the absence of any commercial or financial relationships that could be construed as a potential conflict of interest.
Ang, A., and De Leon, D. (2005). Modeling and analysis of uncertainties for risk-informed decisions in infrastructures Engineering. J. Struct. Infrastruct. Eng. Maintenance Manage. Life-Cycle Design Perform. 1, 19–31. doi: 10.1080/15732470412331289350
Baker, J. W., Schubert, M., and Faber, M. H. (2008). On the assessment of robustness. Struct. Safety 30, 253–267. doi: 10.1016/j.strusafe.2006.11.004
Casas, J. R., and Moughty, J. J. (2017). Bridge damage detection based on vibration data: past and new developments. Front. Built Environ. 3:4. doi: 10.3389/fbuil.2017.00004
Crank, J., and Gupta, R. S. (1975). Isotherm migration method in two dimensions. Int. J. Heat Mass Transf. 18, 1101–1107. doi: 10.1016/0017-9310(75)90228-8
De-León, D., and Delgado, D. J. (2008). “Basis for risk management on bridges on seismic zones,” in 14th World Conference on Earthquake Engineering, Beijing.
De-León-Escobedo, D., Delgado-Hernández, D. J., Arteaga-Arcos, J. C., and Flores-Gomora, J. (2017). Bonus and penalties for differences between the provided and specified concrete strength including expected losses for R/C buildings in Mexico City, Earthquakes and Structures. Techno Press. 12, 349–357. doi: 10.12989/eas.2017.12.3.349
Estes, A. C., and Frangopol, D. M. (2005). Load rating versus reliability analysis. J. Struct. Eng. 131, 843–847. doi: 10.1061/(ASCE)0733-9445(2005)131:5(843)
Frangopol, D. M., and Bucher, C. (2006). Optimization of lifetime maintenance strategies for deteriorating structures considering probabilities of violating safety, condition, and cost thresholds. Probabilist. Eng. Mech. 21, 1–8. doi: 10.1016/j.probengmech.2005.06.002
Frangopol, D. M., and Curley, J. P. (1987). Effects of damage and redundancy on structural reliability. J. Str. Engrg. 113, 1533–1549.
Frangopol, D. M., Mondoro, A., and Liu, L. (2018a). Multi-criteria robust optimization framework for bridge adaptation under climate change. Struct. Safety Elsevier 74, 14–23 doi: 10.1016/j.strusafe.2018.03.002
Frangopol, D. M., and Orcesi, A. D. (2011). Probabilistic-based multiple-criteria optimization of bridge maintenance using monitoring and expected error in the decision process. Struct. Multidiscip. Optimization 44, 137–148. doi: 10.1007/s00158-010-0613-8
Frangopol, D. M., Wang, Z., Jin, W., and Dong, Y. (2018b). Hierarchical life-cycle design of reinforced concrete structures incorporating durability, economic efficiency and green objectives. Eng. Struct. 157, 119–131. doi: 10.1016/j.engstruct.2017.11.022
Frangopol, Yang (2018). Risk-informed bridge ranking at project and network levels. J. Infrastruct. Syst. 24, 1–13. doi: 10.1061/(ASCE)IS.1943-555X.0000430
Gardoni, P., Guevara-Lopez, F., and Contento, A. (2016). The Life Profitability Method (LPM): a financial approach to engineering decisions. Struct. Safety 63, 11–20. doi: 10.1016/j.strusafe.2016.06.006
González COM (2006). (In Spanish) Aspectos Fundamentales del Concreto Reforzado, 4a. Mexico City: Limusa Noriega.
Kong, J. S., and Frangopol, D. M. (2005). Sensitivity analysis in reliability-based lifetime performance prediction using simulation. J. Mater. Civ. Eng. 17, 296–306. doi: 10.1061/(ASCE)0899-1561(2005)17:3(296)
Kumar, R., and Gardoni, P. (2014). Effect of seismic degradation on the fragility of reinforced concrete bridges. Eng. Struct. 79, 267–275. doi: 10.1016/j.engstruct.2014.08.019
Kumar, R., Gardoni, P., and Sanchez-Silva, M. (2009). Effect of cumulative seismic damage and corrosion on life-cycle cost of reinforced concrete bridges. Earthq. Eng. Struct. Dyn. 38, 887–905. doi: 10.1002/eqe.873
Laungrungrong, B., Mobasher, B., and Montgomery, D. (2008). “Development of Rational Pay Factors Based on Concrete Compressive Strength Data”. Report No. FHWA-AZ-08- 608. Transport Department, Arizona.
Neves, L. C., and Frangopol, D. M. (2005). Condition, safety and cost profiles for deteriorating structures with emphasis on bridges. Reliab. Eng. Syst. Safety 89, 185–198. doi: 10.1016/j.ress.2004.08.018
O'Connor, A., Sheils, E., Breysse, D., and Schoefs, F. (2011). Markovian bridge maintenance planning incorporating corrosion initiation and nonlinear deterioration. J. Bridge Eng. 18, 189–199. doi: 10.1061/(ASCE)BE.1943-5592.0000342
Olaszek, P., Łagoda, M., and Casas, J. R. (2014). Diagnostic load testing and assessment of existing bridges: examples of application. Struct. Infrastruct. Eng. 10, 834–842. doi: 10.1080/15732479.2013.772212
Pacheco-Torgal, F., Melchers, R. E., Shi, X., De Belie, N., Van Tittelboom, K., and Sáes, A. (2018). Eco-efficient Repair and Rehabilitation of Concrete Infrastructures. Woodhead Publishing Series in Civil and Structural Engineering.
Rodriguez, G., Casas, J. R., and Villalba, S. (2015). Cracking assessment in concrete structures by distributed optical fiber. Smart Mater. Struct. 24:5. doi: 10.1088/0964-1726/24/3/035005
Rosenblueth, E., Esteva, L., and Damy, J. (1974). Bonus and penalty in acceptance criteria for concrete, Procs. Am. Concrete Instit. 71, 466–472.
Thoft-Christensen, P. (2003). “Preventive Maintenance Strategies for Bridge Groups- Analysis- Vol.2”. Final Report, HA-project 3/344(B).
Yanweerasak, T., Pansuk, W., Akiyama, M., and Frangopol, D. M. (2018). Life-cycle reliability assessment of reinforced concrete bridges under multiple hazards. Struct. Infrastruct. Eng. 14, 1011–1024. doi: 10.1080/15732479.2018.1437640
Keywords: compensation factors, reinforced concrete bridges, concrete strength deficit, seismic hazard, failure probability, expected life-cycle cost
Citation: De-León-Escobedo D (2018) Compensation Factors for Bridges Built With a Reinforced Concrete Strength Below Its Nominal Value and Located on Seismic Hazard Zones. Front. Built Environ. 4:76. doi: 10.3389/fbuil.2018.00076
Received: 16 July 2018; Accepted: 22 November 2018;
Published: 11 December 2018.
Edited by:
Xin Ruan, Tongji University, ChinaReviewed by:
Mario D'Aniello, Università degli Studi di Napoli Federico II, ItalyCopyright © 2018 De-León-Escobedo. This is an open-access article distributed under the terms of the Creative Commons Attribution License (CC BY). The use, distribution or reproduction in other forums is permitted, provided the original author(s) and the copyright owner(s) are credited and that the original publication in this journal is cited, in accordance with accepted academic practice. No use, distribution or reproduction is permitted which does not comply with these terms.
*Correspondence: David De-León-Escobedo, ZGF2aWRkZWxlb25lc2NvYmVkb0B5YWhvby5jb20ubXg=
Disclaimer: All claims expressed in this article are solely those of the authors and do not necessarily represent those of their affiliated organizations, or those of the publisher, the editors and the reviewers. Any product that may be evaluated in this article or claim that may be made by its manufacturer is not guaranteed or endorsed by the publisher.
Research integrity at Frontiers
Learn more about the work of our research integrity team to safeguard the quality of each article we publish.