- 1School of Engineering, The University of British Columbia, Kelowna, BC, Canada
- 2Institute for Research in Civil and Mechanical Engineering UMR CNRS 6183, University of Nantes, Nantes, France
- 3Construction Research Centre, National Research Council Canada, Ottawa, ON, Canada
Seismically deficient bridges, coupled with their aging and deterioration, pose significant threat to safety, integrity, and functionality of highway networks. Given limited funds available for bridge retrofitting, there is a need for an effective management strategy that will enable decision-makers to identify and prioritize the high-risk bridges for detailed seismic evaluation and retrofit. In this paper, a risk-based preliminary seismic screening technique is proposed to rank or prioritize seismically-deficient bridges. The proposed risk assessment entails hierarchically integrating seismic hazard, bridge vulnerability, and consequences of failure. The bridge vulnerability accounts for chloride-induced corrosion deterioration mechanisms. A Bayesian belief network based modeling technique is used to aggregate through the hierarchy and generate risk indices. The efficacy of the proposed method is illustrated on two existing bridges that are assumed to be located in high seismic zones and designed under different standards concerning their structural safety under seismic loads and durability performance.
Introduction
The seismic vulnerability of existing bridges in many countries is apparent from different earthquake reconnaissance reports, e.g., Northridge earthquake in USA (Mitchell et al., 1995; Basöz et al., 1999) and Hyogo-ken Nanbu earthquake in Japan (Anderson et al., 1996; Kawashim, 2000). Thus, bridges located in high seismic risk zones of Canada, such as British Columbia and the St. Lawrence valley in Quebec, for example, are prone to damage (e.g., Mitchell et al., 1991, 2013) and require detailed vulnerability assessment (e.g., Filiatrault et al., 1994). The seismic screening and retrofitting of all bridges owned or managed by a given department of transportation is prohibitively expensive and cannot be accommodated given the limited funds and competing needs. Hence, there is a need to identify and prioritize high risk bridges for seismic retrofit (e.g., Mitchell et al., 1994; Sexsmith, 1994) using risk-based prioritization approaches (Ellingwood, 2001; Lounis and McAllister, 2016). The problem is further compounded with the prevalence of aging and corrosion-induced deterioration (e.g., Zhong et al., 2012). Thus, in high seismic risk regions, efficient bridge management entails accounting for the prevalent deterioration and site specific seismic risk (Mayet and Madanat, 2002).
Despite its practicality and relevance, the use of risk as a criterion for decision-making may not be easy given the complexities of assessing both the probability and the consequence of failure (Haimes, 2009). The assessment of seismic risk for highway bridges and its management are subject to uncertainties (e.g., Sexsmith, 1994). The uncertainty can be divided into three different categories (Klir and Yuan, 1995): (i) randomness (inherent to some process); (ii) incompleteness (what we do not know); and (iii) fuzziness (difficulty in establishing and defining boundaries). Thus, mathematical techniques that incorporate expert knowledge, qualitative and quantitative empirical data are required (Chen et al., 2016; Franchin et al., 2016).
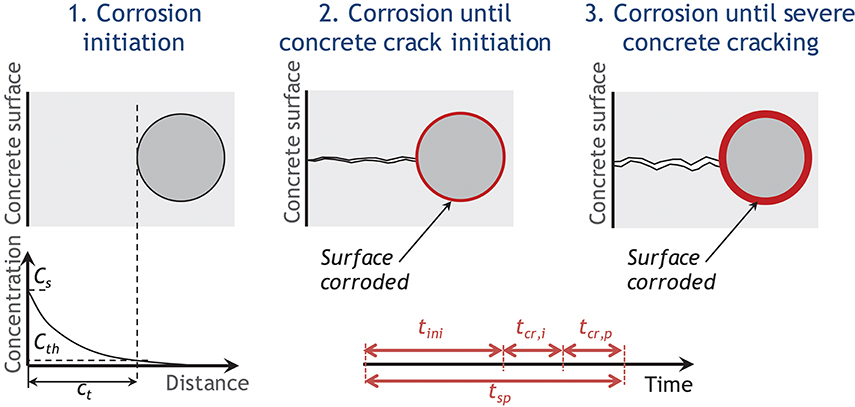
Chloride ingress from de-icing salts and seawater is the principal cause of deterioration of reinforced concrete (RC) structures, with consequent reduction in serviceability, functionality and safety, increase in maintenance costs as well as users costs (De-Leon-Escobedo et al., 2013; Bastidas-Arteaga and Schoefs, 2015; Lounis and McAllister, 2016). Bhide (2008) highlighted that “about 173,000 bridges on the interstate system of the United States are structurally deficient or functionally obsolete due in part to corrosion.” In order to minimize maintenance costs and failure risks, there is need to develop deterioration models to estimate the effects of chloride ingress on safety, serviceability, durability, and to develop optimized maintenance plans (Lounis and McAllister, 2016; Bastidas-Arteaga, 2018). For instance, De-Leon-Escobedo et al. (2013) provided a probabilistic approach to assess the time to corrosion initiation and the optimal inspection time by accounting for epistemic and aleatory uncertainty. The time to corrosion damage, (severe cracking or spalling), tsp could be obtained as the sum of three stages (Figure 1) (Bastidas-Arteaga and Stewart, 2016): (i) corrosion initiation (tini); (ii) corrosion until concrete crack initiation (tcr, i, time to first cracking–hairline crack of 0.05 mm width), and; (iii) corrosion until severe concrete cracking (tcr, p, time for crack to develop from crack initiation to a limit crack width, wlim)–i.e., tsp = tini + tcr, i + tcr, p.
The impact of corrosion on the seismic vulnerability of highway bridges is an on-going research endeavor. Recent experimental studies (e.g., Guo et al., 2015; Yang et al., 2016; Yuan et al., 2017) accounted for the three above-mentioned stages and have shown that with increasing level of corrosion-induced deterioration, there is significant reduction in strength and energy dissipation capacity. The impact of the deterioration on vulnerability assessment is also investigated analytically (e.g., Alipour et al., 2010; Ghosh and Padgett, 2010; Simon et al., 2010; Akiyama et al., 2011; Ma et al., 2012; Zhong et al., 2012). Current seismic screening criteria do not consider some factors, such as aging, deterioration, and loss of strength, that are important for a reliable structural performance evaluation of existing bridges. The main reasons for this include the lack of reliable deterioration models, and the prohibitive costs for the analysis of a large portfolio of bridges. To address these shortcomings, a practical Bayesian belief network (BBN)-based hierarchical approach for seismic risk bridge evaluation and screening for seismic retrofit is presented in this paper. This approach has been used for reliability updating in some previous studies for modeling the mechanisms of chloride-ingress into concrete (Tran et al., 2016) or lifetime assessment from accelerated tests (Tran et al., 2018). The application of the proposed approach is illustrated on a portfolio of existing bridges in high seismic hazard zones by using different design standards and integrating the durability performance in the seismic risk.
Bayesian Belief Network for Bridge Risk Assessment
A BBN is a graphical model that permits a probabilistic relationship among a set of variables (Pearl, 1988). The BBN is Direct Acyclic Graph (DAG) consisting of a set of nodes (parents and children) that are connected by edges to illustrate their dependencies. Nodes in BBN are graphical representations of objects and events that exist in the real world and can be modeled as continuous or discrete random variables. A conditional Probability Density Function (PDF), f(X|pa(X)) or Probability Mass Function (PMF), p(X|pa(X)) is assigned to each child node, where pa(X) are the parents of X in the DAG. An edge may represent causal relationships between the variables (nodes) but this is not a requirement. The graphical structure of a BBN encodes conditional independence assumptions among the random variables. Hence, a BBN is a compact model representing the joint PDF or PMF of random variables. In this study, only BBN with discrete random variables are considered.
BBN allows the introduction of new information (evidences) from the observed nodes to update the probabilities in the network. On the basis of the Bayes' theorem for n number of mutually exclusive hypotheses Hi, i = 1, …, n, and a given evidence E, the updated probability is computed as:
where p(H|E) is one's belief for hypothesis H upon observing evidence E, p(E|H) is the likelihood that E is observed if H is true, p(H) is the probability that the hypothesis holds true, and p(E) is the probability that the evidence takes place. The network supports the computation of the probabilities of any subset of variables given evidence about any other subset. These dependencies are quantified through a set of conditional probability tables (CPTs); each variable is assigned a CPT of the variable given its parents.
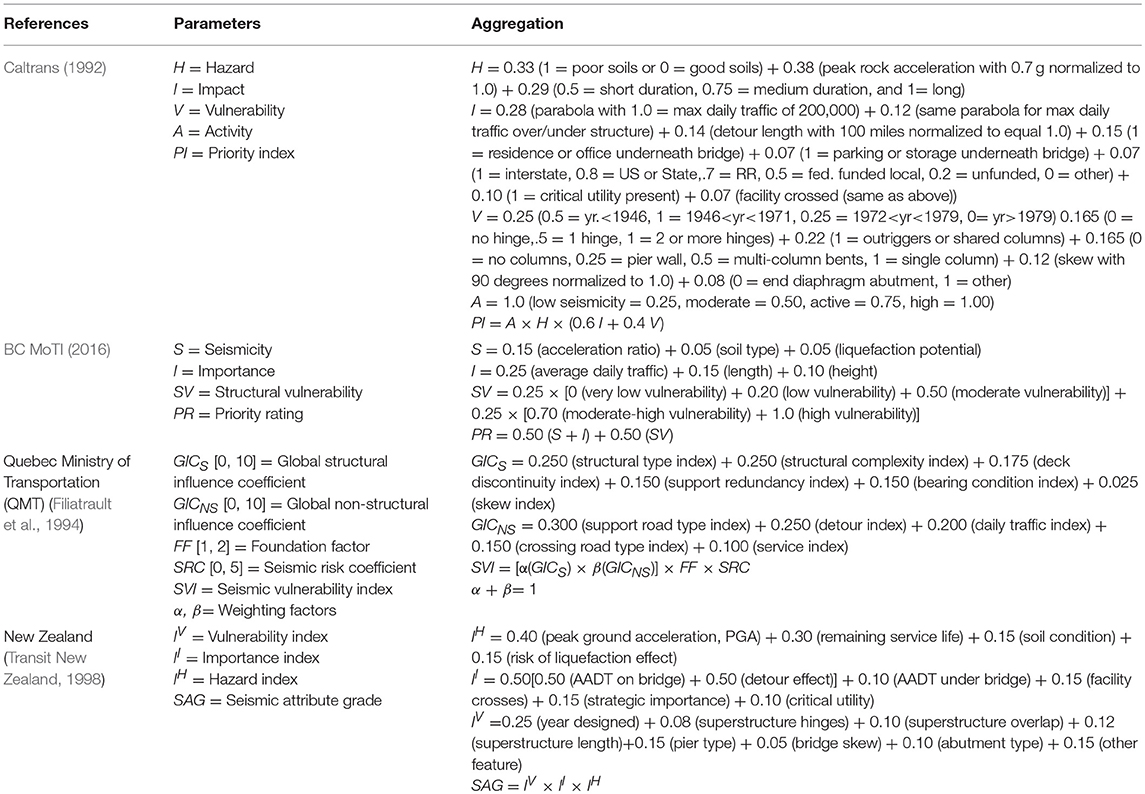
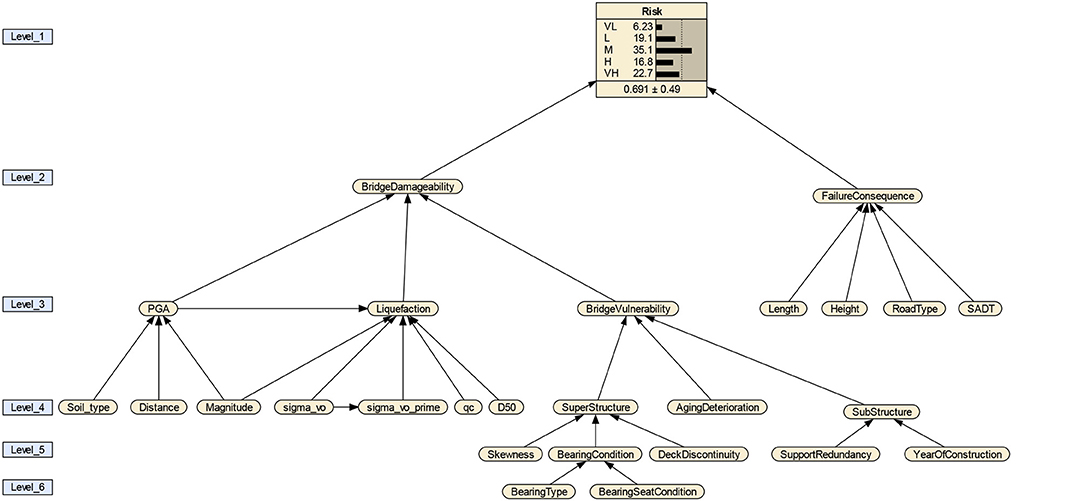
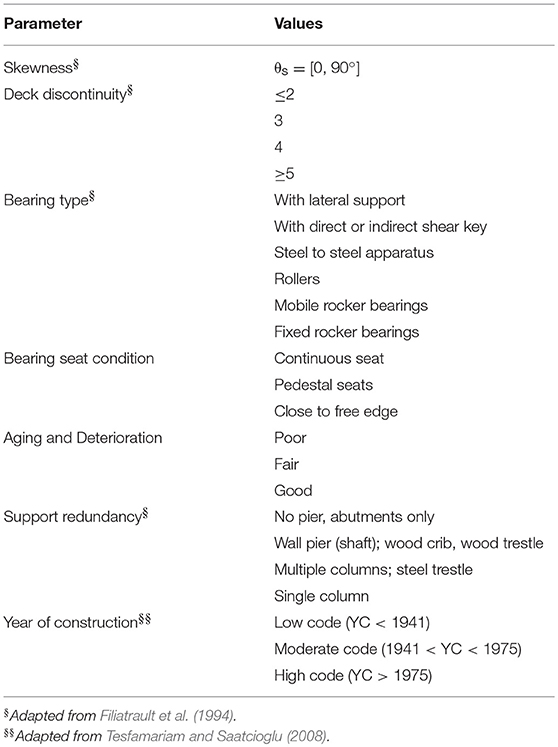
The quantification of the structural safety under seismic loads requires complex numerical or analytical models. Different seismic screening tools were developed for existing bridges in Canada (e.g., Filiatrault et al., 1994; Sexsmith, 1994), USA (Caltrans (California Department of Transportation), 1992) and New Zealand (Transit New Zealand, 1998). Filiatrault et al. (1994) developed bridge screening criteria based on the Caltrans' (1992) prioritization procedure. Details of the different bridge prioritization are summarized in Table 1. However, the prioritization summarized in Table 1 do not account for aging and deterioration. For initial seismic screening, complexity of the bridge vulnerability assessment can be handled through a system-based approach (Haimes, 2009; Tesfamariam and Modirzadeh, 2009; Franchin et al., 2016). A six-level hierarchical structure using BBN model is shown in Figure 2. The BBN model is implemented in Netica software (Norsys Software Corp, 2006). Details of the hierarchy are discussed in the subsequent sections.
Bridge Damageability
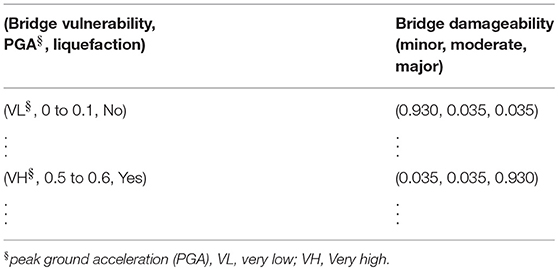
The bridge damageability is used to quantify the expected damage degree for a given level of shaking. The Canadian highway bridge design code (CSA, 2014) uses four damage states (minimal damage, repairable damage, extensive damage, probable replacement) and service levels (immediate, limited, service disruption, life safety). A sample of the CPT for bridge damageability is summarized in Table 2. For example, for Bridge vulnerability = very low (VL), PGA = [0, 0.1], liquefaction = No, from Table 2, the bridge damageability for (minor, moderate, major) are (0.930, 0.035, 0.035). The bridge damageability can be classified as minor = 93%, with negligible/small probabilities are assigned to moderate = 3.5% and major = 3.5%. The low probabilities are associated with the consideration degree of uncertainties in the CPT generation.
With the framework of the performance-based earthquake engineering, under different hazard levels, different functional classes of bridges (Lifeline bridges, Major-route bridges, Other bridges) will have different performance expectations (Table 3). For example, a bridge classified as Other bridges, with PGA value obtained from hazard level of 10% probability of exceedance in 50 years (475 years return period), the expected performance level is service limited with Repairable damage.

Table 3. CAN-CSA-S16-14 performance criteria (CSA, 2014).
Site Seismic Hazard
The site seismic hazard is determined by PGA, soil type, and liquefaction potential (Figure 2). With consideration of different fault types, the PGA is quantified as a function of moment Magnitude, site to fault Distance, fault type, and Soil Type (Atkinson, 2004). The PGA values are computed for desired hazard level specified in Table 3. The unconditional probabilities (UPs) for Magnitude Distance, and Soil Type are assumed to take equal probabilities defined as 1/nk, where nk is number of states per variable.
For the present study, the BBN for Liquefaction shown in Figure 2 is adopted from Tesfamariam and Liu (2013) that was generated through empirical data. The Liquefaction is conditioned on six factors: PGA, magnitude, average grain size (D50), tip resistance (qc), total vertical over-burden pressure (sigma_vo), and effective vertical overburden pressure (sigma_vo_prime).
Bridge Vulnerability
The bridge vulnerability is assessed by considering Super Structure, Sub Structure, and Aging and Deterioration (level 4 in Figure 2). Discretisation of the parameters and corresponding transformation are summarized in Table 4. The Super Structure is quantified by Skewness of the bridge, Deck Discontinuity, and Bearing Condition (level 5). The Bearing Condition in turn depends on the Bearing Type and Bearing Seat (level 6). The substructure is quantified by considering Support Redundancy and Year of Construction (level 5). The Year of Construction has implications on both seismic design and durability (e.g., concrete cover depth effect on corrosion). Bridges designed prior to 1971 are particularly vulnerable due to elastic seismic design methods and non-ductile detailing (Yalcin, 1997). Furthermore, a major change in the bridge seismic design code was introduced in ATC-6 (ATC, 1981) that was adopted by AASHTO (198). Elements of the superstructure and substructure are prone to different level of deterioration and aging. In this paper, chloride-induced corrosion is the primary deterioration mechanism considered and is modeled through stationary Markov chain. The details are given in the next section.
Consequences of Failure
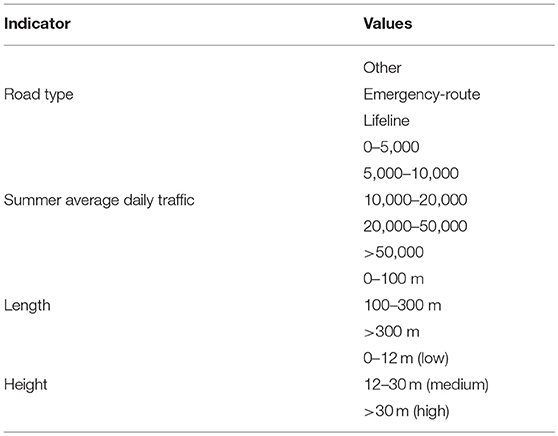
The Failure Consequences of highway bridges account for fatalities, injuries, traffic delays due to bridge closure, criticality of bridge to lifeline operations (e.g., passage of emergency services vehicles), impacts on neighboring businesses and communities, etc. In this paper, the Failure Consequences are quantified through four parameters (level 3 of the hierarchy, Figure 2); Length and Height of the bridge, Road Type and Summer Average Daily Traffic (SADT) (Table 5). The cost of bridge replacement depends on many parameters: length, height, width, location, river crossing or overpass, time available for construction, etc. In this paper, however, the Length and Height of the bridge are used as surrogate parameters to quantify the cost of bridge replacement in the event of major damage or collapse. The Road Type, can be classified according to of the Canadian Highway Bridge Design Code (CSA) classification, “lifeline,” “emergency-route,” and “other” bridges (CSA, 2014). The SADT is used to quantify the impact of bridge damage on disruption/loss of personal mobility, and traffic delays. Furthermore, other parameters can also be included, e.g., width of the bridge, importance of the bridge in the overall network, other utilities carried by the bridge (gas, electricity, water).
Stationary Markovian Approach for Modeling Chloride-Induced Deterioration Processes
A discrete-time Markov process can be used to predict the future states of a concrete structure by knowing its present state. Space of the variables/phenomena of interest is discretised into M states. The Markov process is thus used to determine the probability that an event belongs to a state j knowing that for a preceding time step it belonged to a state i. This probability, noted aij = p[Xt+1 = j|Xt = i], is called transition probability. It is considered herein that aij is independent of t (stationary Markov process). The transition probabilities can be grouped in a matrix of size M×M called transition matrix P. According to the Chapman-Kolmogorov equations, by knowing the initial state, the probabilities of belonging to the other states after t transitions, q(t), are:
where the vector qini contains the probabilities of belonging to the states at an initial time–for example at t = 0. If it is supposed that after construction (t = 0) there is no deterioration, all the structures/structural components belong to the first state. Consequently, qini will become qini = [1, 0, 0, …, 0] and Equation (2) provides a vector containing the probabilities of belonging to a state j at time t, where state j corresponds to more deterioration than at state i (i.e., assuming no repair is done).
In this study, the variables of interest are three (M = 3 states) and represent each stage of the deterioration process described in Figure 1:
State 1: This state represents the chloride ingress process at the concrete cover. The structural components are supposed to belong to this state if the concentration of chlorides at the cover depth is lower than the threshold value to corrosion initiation t ∈ [0, tini].
State 2: This state considers that the corrosion process has started in the structural components. It starts after corrosion initiation and ends once concrete cover cracking initiates t ∈]tini, tini + tcr, p].
State 3: This state encompasses the process of cover cracking propagation. It initiates once a hairline crack is nucleated in the concrete cover and ends when a limit crack width is reached t ∈]tini + tcr, p, tsp].
For M = 3 states, the transition matrix becomes:
Transition matrices are estimated from Monte Carlo simulations of a probabilistic model of chloride-induced deterioration (Bastidas-Arteaga and Stewart, 2015, 2016). From all simulations, the frequency of belonging to a given state (i.e., a histogram) is determined. The probability of belonging to a state j at time t is obtained from:
where nj(t) is the number of observations in the state j measured at time t and N is the total number of simulations.
The transition probabilities aij are computed by minimizing the difference between the probabilities estimated from simulations and those obtained from the stationary Markov model q(t) (Equation (5) (Bastidas-Arteaga and Schoefs, 2012).
where a is a vector containing the transitions probabilities to estimate in Equation (3) (optimization parameters) and fj(a) is the explained sum of squares (ESS) for each state j:
where tana represents the analysis period used to perform the adjustment. This problem of multi-objective optimization has been solved by using a goal attainment method (Gembicki, 1974) available in the ‘optimization toolbox’ of Matlab®.
Sensitivity Analysis of the BBN Model
Since the final output of the BBN is dependent on the CPTs, there is a need to carry out a sensitivity analysis to identify critical input parameters that have a significant impact on the output results (Laskey, 1995; Castillo et al., 1997). Since the input parameters of the BBN have discrete and continuous values, the variance reduction method was used (Pearl, 1988). The variance reduction method works by computing the variance reduction of the expected real value of a query node Q (e.g., PGA) due to a finding at varying variable node F (e.g., Soil type, Distance, Magnitude, see Figure 2). Thus, the variance of the real value of Q given evidence F, V(q/f), is computed as (Pearl, 1988):
where q is the state of the query node Q, f is the state of the varying variable node F, p(q/f) is the conditional probability of q given f, Xq is the numeric value corresponding to state q, and E(Q/f) is the expected real value of Q after the new finding f for node F.
A sensitivity analysis for the model illustrated in Figure 2 is performed for risk, at Level 1, by varying the basic input parameters (at the base levels). The top six sensitive parameters for the risk assessment, measured in terms of variance reduction, are: Aging and Deterioration (0.718%), Road Type (0.0855%), Year of Construction (0.0294%), Height (0.0221%), and Length (0.0179%).
Application
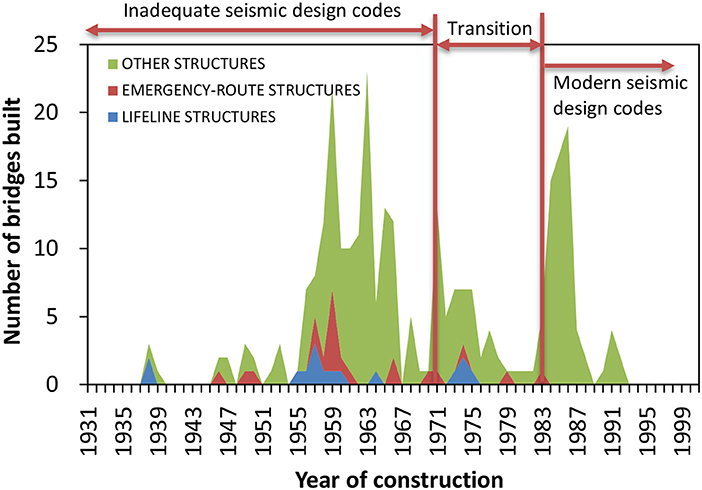
The proposed methodology will be illustrated on highway bridges from British Columbia (BC), Canada. A non-exhaustive inventory of the lifeline, emergency-route and other bridges in BC are plotted in Figure 3. Figure 3 shows that most of the bridges were built before the modern code were implemented, and possibly, some have been retrofitted. Each bridge, however, for different hazard levels, will have different performance limit states (Table 2).
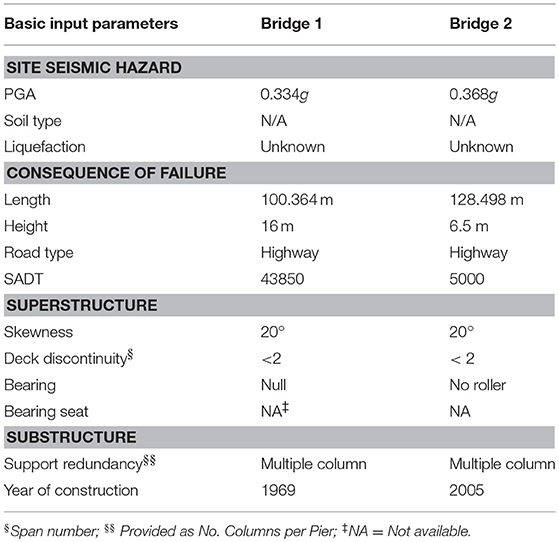
Two bridges designed in 1969 (old code) and 2005 (modern code) are considered herein. The basic input parameters for the two bridges are given in Table 6. For Bridges 1 and 2, from 2015 National Building Code of Canada seismic hazard (http://www.earthquakescanada.nrcan.gc.ca/hazard-alea/interpolat/index_2015-en.php), the PGA values correspond to a 2% probability of exceedance in 50 years. In this paper, values shown as N/A, e.g., soil type, are handled in BBN by keeping the initial UP values. Alternatively, the best and worst values can be considered, and interval risk values are computed.
Quantification of Transition Probabilities
This application focuses on existing RC bridges built in a coastal area and subjected to a splash and tidal exposure. Durability design standards have been modified according to the experience feedback under real operating conditions, the better understating of deterioration mechanism, the use of new construction materials and methods, etc. For instance, evolution of design cover recommendations according to French standards for structures built between 1950 and 2010 and a splash and tidal zone are shown in Figure 4. It is observed that modern design codes recommend larger concrete covers to improve the durability performance of RC structures in a chloride-contaminated environment.
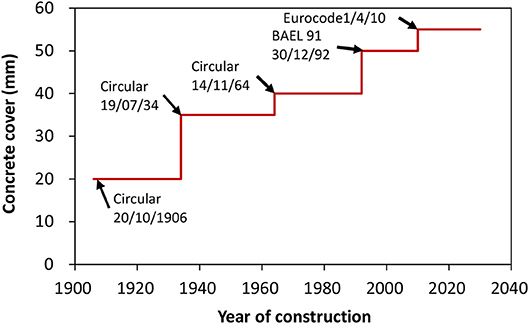
Figure 4. Design concrete cover for structures built since 1906 in France. Adapted from: Bastidas-Arteaga and Stewart, 2016.
For the existing bridges shown in Table 6, no information is available about the characteristics of the concrete used for their construction as well as the design concrete cover. For simplicity, this paper assumes that both bridges were built using the same concrete with a characteristic compressive strength of = 35 MPa. It is also considered that the rebar diameter of stirrups is d0 = 16 mm for all structural components. This example takes into account the evolution in time of the concrete cover for existing bridges given in Table 8. We also assume that all structural components will be subjected to one-dimensional chloride ingress in a splash a tidal zone.
The random variables used to estimate damage probabilities of each state [, Equation (4)] are given in Table 7. It is assumed that all the random variables are independent to provide the worst scenario that overestimate deterioration consequences. Damage probabilities could be updated by considering real values for concrete properties. For old structures, it could be expected low concrete strength and larger variability. This will certainly reduce the durability performance and increase seismic vulnerability. Real data could be also very useful to estimate correlations between the parameters given in Table 7 and improve deterioration assessment.
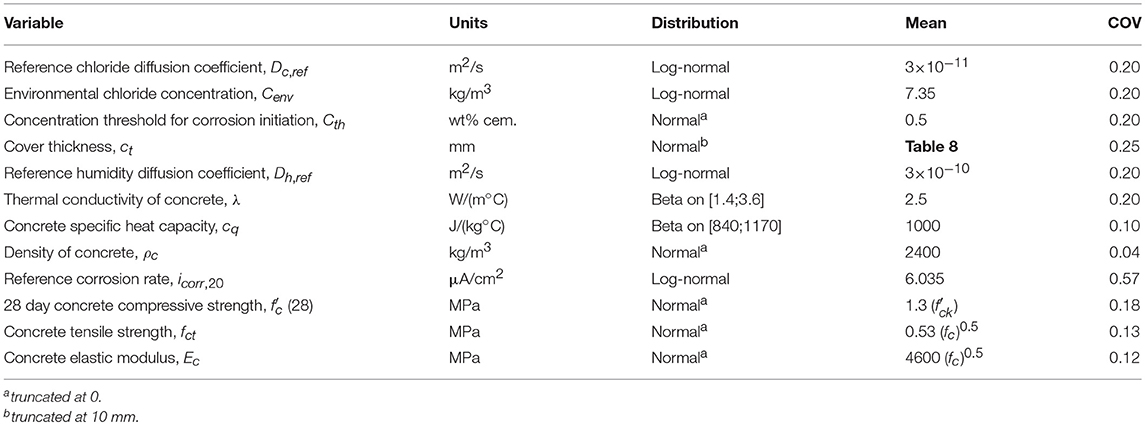
Table 7. Random variables (Bastidas-Arteaga and Stewart, 2016).
Uncertainties in Table 7 will be propagated into comprehensive deterioration models to assess the durability performance of bridges from initial construction up to severe concrete cracking (three stages in Figure 1). For the stage of corrosion initiation, the implemented finite element model for chloride ingress accounts for: (i) chloride ingress by diffusion and convection; and (ii) influence of temperature and relative humidity variations (Nguyen et al., 2017). The corrosion propagation model is based on electrochemical principles and takes into account only temperature variations (DuraCrete, 2000). Two models combining mechanical and electrochemical principles assess the stages of corrosion until concrete crack initiation [tcr, i, El Maaddawy and Soudki (2007)] and severe concrete cracking [tcr, p, Mullard and Stewart (2011)].
Results and Discussion
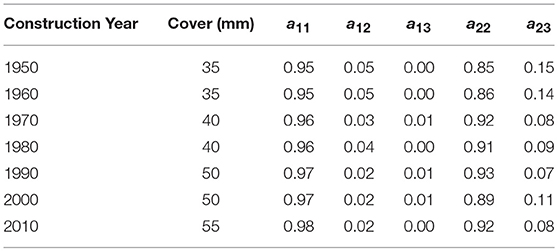
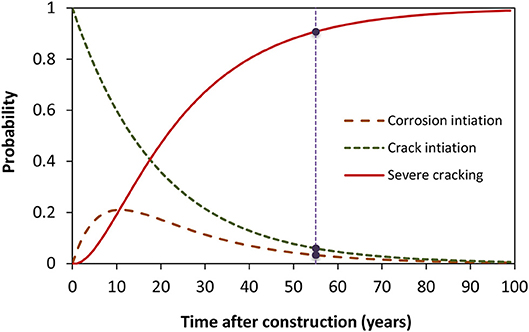
The transition matrices for different construction years and concrete covers are computed and summarized in Table 8. For example, using the results shown in Table 8, the Markov transition probabilities for Bridge 1 (construction year 1967, thus the transition matrix for year 1960 is used) are plotted in Figure 5. With the evaluation done in 2018, the bridges are 55 and 13 years old, respectively. From Figure 5, for Bridge 1, time after construction = 55 years, the probabilities for corrosion initiation, concrete crack initiation and severe concrete cracking are [0.06, 0.03, 0.91]. Similarly, using the transition matrix in Table 8, for Bridge 2, the values can be computed to be [0.69, 0.21, 0.10]. As expected, the probability of severe concrete cracking is larger for the older bridge (Bridge 1).
For year 2018, the risk assessment was carried out for Bridges 1 and 2, with PGA values of 0.334 and 0.368 g, respectively, for hazard level of 2% probability of exceedance in 50 years (Table 6). Figure 6 shows results of bridge vulnerability, damageability, failure consequence and risk. Given that Bridge 1 is seismically deficient (from a design point-of-view) and higher deterioration values, it is showing a higher vulnerability value, i.e., Bridge 1 has higher expected value (EV = 0.62) than Bridge 2 (EV = 0.35). Since similar levels of PGA values are considered for both bridges, consequently, as expected, Bridge 1 is showing higher Bridge damageability value.
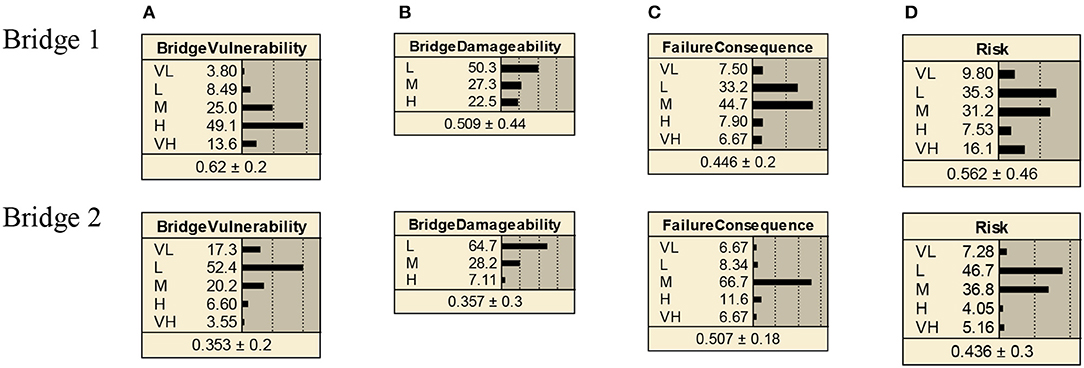
Figure 6. Comparison of Bridge 1 and Bridge 2: (A) bridge vulnerability, (B) bridge damageability; (C) failure consequence; and (D) risk. VL, very low; L, low; M, medium; H, high and VH, very high.
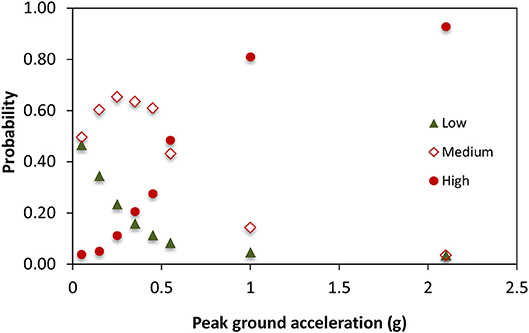
For the two bridges classified as “other bridges” and 2% probability of exceedance in 50 years PGA values, the CAN-SCA-S16-14 (CSA, 2014) performance criterion is probable replacement (Table 3). The evolution of the low, medium and high damage probability with respect to PGA values, for Bridge 1, are shown in Figure 7. As expected, damage probability increases for larger PGA values.
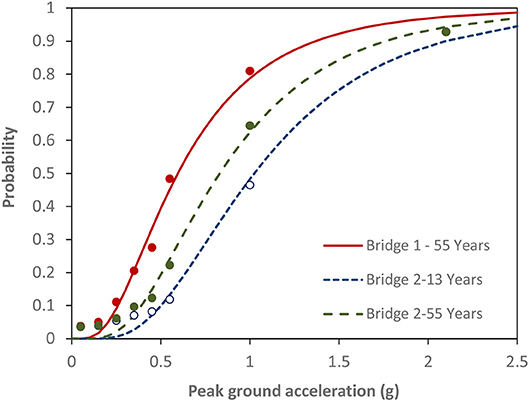
Using the damageability probabilities for high, fragility curves are generated for the two bridges (Figure 8). Figure 8 shows that, as expected, for all PGA values, the curve of Bridge 1 (constructed in 1963, age = 55 years) shows higher probability of damage. To highlight the impact of aging and deterioration, the vulnerability of Bridge 2 (constructed in 2005, age = 13 years), is computed at the age 55 years (assuming all other parameters are time-invariant). Figure 8 also indicates that, the same bridge, with aging and deterioration, the probability of damage increases. In addition, it can be discerned that, Bridge 2, after 55 years, performs better than Bridge 1 highlighting the impact of the recommendations proposed by modern design codes with respect to seismic and durability performance.
Conclusions
Existing approaches to bridge management and decision making have serious limitations as they express all losses in monetary terms and consider only one criterion at a time, e.g., minimization of owner costs. On the other hand, a multi-objective approach for decision-making, can incorporate all relevant objectives and enables a better evaluation of the effectiveness of preservation and protection strategies in terms of several objectives (safety, mobility, cost) and determines the optimal solution that achieves the best trade-off between all of the objectives (including conflicting ones, such as safety and cost).
A practical BBN-based approach for risk-based prioritization is proposed to provide support and relevant information to decision-makers. The risk is quantified through consideration of the bridge vulnerability, site seismic hazard and consequences of failure. A BBN using six levels is proposed to integrate all key parameters that affect bridge seismic risk. The proposed risk-based technique is applied for two bridges under a high seismic hazard. The technique showed promising results that are useful to evaluate the vulnerability of bridges by accounting for seismic hazard and chloride-induced damage. It could be extended to include other deterioration processes, cumulative damage due to previous earthquakes or at a network level, however, it has to be further calibrated with additional models and databases of field data.
Author Contributions
ST developed the seismic screening and BBN model. EB-A and ZL contributed on corrosion deterioration and Markov modeling.
Funding
Some of this work was undertaken while professor ST was visiting the Institute for Research in Civil and Mechanical Engineering at the University of Nantes. The support of the University of Nantes for funding this position of Visiting Scholar is gratefully acknowledged. The first author also acknowledges the financial support through the Natural Sciences an Engineering Research Council of Canada (RGPIN-2014-05013) under the Discovery Grant programs.
Conflict of Interest Statement
The authors declare that the research was conducted in the absence of any commercial or financial relationships that could be construed as a potential conflict of interest.
References
AASHTO (1983). Standard Specifications for Highway Bridges, 16th Edn. Washington, DC: American Association of State Highway and Transportation Officials.
Akiyama, M., Frangopol, D. M., and Matsuzaki, H. (2011). Life-cycle reliability of RC bridge piers under seismic and airborne chloride hazards. Earthq. Eng. Struct. Dyn. 40, 1671–1687. doi: 10.1002/eqe.1108
Alipour, A., Shafei, B., and Shinozuka, M. (2010). Performance evaluation of deteriorating highway bridges located in high seismic areas. J. Bridge Eng. 16, 597–611. doi: 10.1061/(ASCE)BE.1943-5592.0000197
Anderson, D. L., Mitchell, D., and Tinawi, R. G. (1996). Performance of concrete bridges during the Hyogo-ken Nanbu (Kobe) earthquake on January 17, 1995. Can. J. Civil Eng. 23, 714–726, doi: 10.1139/l96-884
ATC (Applied Technology Council) (1981). Seismic Design Guidelines for Highway Bridges. Report No. ATC-6, Palo Alto, CA.
Atkinson, G. (2004). “An overview of developments in seismic hazard analysis. Keynote paper (5001),” in Proceedings 13th World Conference on Earthquake Engineering (Vancouver, BC)
Basöz, N. I., Kiremidjian, A. S., King, S. A., and Law, K. H. (1999). Statistical analysis of bridge damage data from the 1994 Northridge, CA, earthquake. Earthq. Spec. 15, 25–54. doi: 10.1193/1.1586027
Bastidas-Arteaga, E. (2018). Reliability of reinforced concrete structures subjected to corrosion-fatigue and climate change. Int. J. Concr. Struct. Mater. 12, 1–10. doi: 10.1186/s40069-018-0235-x
Bastidas-Arteaga, E., and Schoefs, F. (2012). Stochastic improvement of inspection and maintenance of corroding reinforced concrete structures placed in unsaturated environments. Eng. Struct. 41, 50–62. doi: 10.1016/j.engstruct.2012.03.011
Bastidas-Arteaga, E., and Schoefs, F. (2015). Sustainable maintenance and repair of RC coastal structures. Proc. Institut. Civil Eng. Maritime Eng. 168, 162–173. doi: 10.1680/jmaen.14.00018
Bastidas-Arteaga, E., and Stewart, M. G. (2015). Damage risks and economic assessment of climate adaptation strategies for design of new concrete structures subject to chloride-induced corrosion. Struct. Safe. 52, 40–53. doi: 10.1016/j.strusafe.2014.10.005
Bastidas-Arteaga, E., and Stewart, M. G. (2016). Economic assessment of climate adaptation strategies for existing RC structures subjected to chloride-induced corrosion. Struct. Infrastruct. Eng. 12, 432–449. doi: 10.1080/15732479.2015.1020499
BC MoTI (BC Ministry of Transportation and Infrastructure) (2016). Bridge Standards and Procedures Manual. Supplement to CHBDC S6-14. (October 2016). Victoria, BC: BC MoTI.
Bhide, S. (2008). Material Usage and Condition of Existing Bridges in the U.S. Portland Cement Association.
Caltrans (California Department of Transportation) (1992). Multi-attribute Decision Procedure for the Seismic Prioritization of Bridge Structure. Internal report, Division of Structures. California Department of Transportation, Sacramento, CA.
Castillo, E., Gutiérrez, J. M., and Hadi, A. S. (1997). Sensitivity analysis in discrete Bayesian networks. IEEE Transact. Syst. Man Cyber. A Syst. Hum. 27, 412–423. doi: 10.1109/3468.594909
Chen, L., van Westen, C. J., Hussin, H., Ciurean, R. L., Turkington, T., Chavarro-Rincon, D., et al. (2016). Integrating expert opinion with modelling for quantitative multi-hazard risk assessment in the Eastern Italian Alps. Geomorphology 273, 150–167. doi: 10.1016/j.geomorph.2016.07.041
CSA (Canadian Standards Association) (2014). Canadian Highway Bridge Design Code, CAN/CSA-S6-14. Canadian Standards Association, Toronto, ON.
De-Leon-Escobedo, D., Delgado-Hernandez, D., Martinez-Martinez, L. H., Rangel Ramírez, J., and Arteaga, J. C. (2013). Corrosion initiation time updating by epistemic uncertainty as an alternative to schedule the first inspection time of pre-stressed concrete vehicular bridge beams. Struct. Infrastruct. Eng. 10, 998–1010. doi: 10.1080/15732479.2013.780084
DuraCrete. (2000). Statistical Quantification of the Variables in the Limit State Functions, DuraCrete - Probabilistic Performance Based Durability Design of Concrete Structures, EU - Brite EuRam III. Contract BRPR-CT95-0132, Project BE95-1347/R9.
El Maaddawy, T., and Soudki, K. (2007). A model for prediction of time from corrosion initiation to corrosion cracking. Cement Concr. Comp. 29, 168–175. doi: 10.1016/j.cemconcomp.2006.11.004
Ellingwood, B. (2001). Earthquake risk assessment in building structures. Reliab. Eng. Syst. Saf. 74, 251–262. doi: 10.1016/S0951-8320(01)00105-3
Filiatrault, A., Tremblay, S., and Tinawi, R. (1994). A rapid seismic screening procedure for existing bridges in Canada. Can. J. Civil Eng. 21, 626–642. doi: 10.1139/l94-064
Franchin, P., Lupoi, A., Noto, F., and Tesfamariam, S. (2016). Seismic fragility of reinforced concrete girder bridges using Bayesian belief network. Earthq. Eng. Struct. Dyn. 45, 29–44. doi: 10.1002/eqe.2613
Gembicki, F. W. (1974). Vector Optimization for Control with Performance and Parameter Sensitivity Indices. Ph.D. Thesis, Case Western Reserve University, Cleveland, OH.
Ghosh, J., and Padgett, J. E. (2010). Aging considerations in the development of time-dependent seismic fragility curves. J. Struct. Eng. 136, 1497–1511. doi: 10.1061/(ASCE)ST.1943-541X.0000260
Guo, A., Li, H., Ba, X., Guan, X., and Li, H. (2015). Experimental investigation on the cyclic performance of reinforced concrete piers with chloride-induced corrosion in marine environment. Eng. Struct. 105, 1–11. doi: 10.1016/j.engstruct.2015.09.031
Haimes, Y. Y. (2009). On the example definition of risk: a systems-based approach. Risk Anal. 29, 1647–1654. doi: 10.1111/j.1539-6924.2009.01310.x
Kawashim, K. (2000). Seismic performance of RC bridge piers in Japan: an evaluation after the 1995 Hyogo-Ken Nanbu earthquake. Prog. Struct. Eng. Mater. 2, 82–91. doi: 10.1002/(SICI)1528-2716(200001/03)2:1<82::AID-PSE10>3.0.CO;2-C
Klir, G. J., and Yuan, B. (1995). Fuzzy Sets and Fuzzy Logic: Theory and Applications. Upper Saddle River, NY: Prentice Hall International.
Laskey, K. B. (1995). Sensitivity analysis for probability assessments in Bayesian networks. IEEE Transact. Syst. Man Cybernet. 25, 901–909. doi: 10.1109/21.384252
Lounis, Z., and McAllister, T. P. (2016). Risk-based decision making for sustainable and resilient infrastructure systems. J. Struct. Eng. 142:F4016005. doi: 10.1061/(ASCE)ST.1943-541X.0001545
Ma, Y., Che, Y., and Gong, J. (2012). Behavior of corrosion damaged circular reinforced concrete columns under cyclic loading. Construc. Build. Mater. 29, 548–556. doi: 10.1016/j.conbuildmat.2011.11.002
Mayet, J., and Madanat, S. (2002). Incorporation of seismic considerations in bridge management systems. Comput. Aided Civil Infrastruct. Eng. 17, 185–193. doi: 10.1111/1467-8667.00266
Mitchell, D., Bruneau, M., Saatcioglu, M., Williams, M., Anderson, D., and Sexsmith, R. (1995). Performance of bridges in the 1994 Northridge earthquake. Can. J. Civil Eng. 22, 415–427. doi: 10.1139/l95-050
Mitchell, D., Huffman, S., Tremblay, R., Saatcioglu, M., Palermo, D., Tinawi, R., et al. (2013). Damage to bridges due to the 27 February 2010 Chile earthquake. Can. J. Civil Eng. 40, 675–692. doi: 10.1139/l2012-045
Mitchell, D. M., Sexsmith, R. G., and Tinawi, R. (1994). Seismic retrofitting techniques for bridges - a state of the art report. Can. J. Civil Eng. 21, 823–835. doi: 10.1139/l94-088
Mitchell, D. M., Tinawi, R., and Sexsmith, R. G. (1991). Performance of bridges in the 1989 Loma Prieta earthquake – lessons for Canadian designers. Can. J. Civil Eng. 18, 711–734. doi: 10.1139/l91-085
Mullard, J. A., and Stewart, M. G. (2011). Corrosion-induced cover cracking: new test data and predictive models. ACI Struct. J. 108, 71–79. doi: 10.14359/51664204
Nguyen, P.-T., Bastidas-Arteaga, E., Amiri, O., and El Soueidy, C.-P. (2017). An efficient chloride ingress model for long-term lifetime assessment of reinforced concrete structures under realistic climate and exposure conditions. Int. J. Concr. Struct. Mater. 11, 199–213. doi: 10.1007/s40069-017-0185-8
Norsys Software Corp (2006). Netica TM Application. Available online at: http://www.norsys.com (Accessed July 20, 2006).
Pearl, J. (1988). Probabilistic Reasoning in Intelligent Systems: Networks of Plausible Inference. San Francisco, CA: Morgan Kaufmann Publishers Inc.
Sexsmith, R. G. (1994). Seismic risk management for existing structures. Can. J. Civil Eng. 21, 180–185. doi: 10.1139/l94-021
Simon, J., Bracci, J. M., and Gardoni, P. (2010). Seismic response and fragility of deteriorated reinforced concrete bridges. J. Struct. Eng. 136, 1273–1281. doi: 10.1061/(ASCE)ST.1943-541X.0000220
Tesfamariam, S., and Liu, Z. (2013). “Seismic risk analysis using Bayesian belief networks, Chapter 7,” in Handbook of Seismic Risk Analysis and Management of Civil Infrastructure Systems, eds S. Tesfamariam and K. Goda (Cambridge: Woodhead Publishing Ltd), 175–208.
Tesfamariam, S., and Modirzadeh, S. M. (2009). “Risk-based rapid visual screening of bridges,” in Technical Council on Lifeline Earthquake Engineering Conference (TCLEE), eds A. K. K. Tang and S. Werner (Oakland, CA), 1–12. doi: 10.1061/41050(357)14
Tesfamariam, S., and Saatcioglu, M (2008) Risk-based seismic evaluation of reinforced concrete buildings. Earthquake Spect. 24, 795–821. doi: 10.1193/1.2952767
Tran, T.-B., Bastidas-Arteaga, E., and Schoefs, F. (2016). Improved Bayesian network configurations for probabilistic identification of degradation mechanisms: application to chloride ingress. Struct. Infrastruct. Eng. 12, 1162–1176. doi: 10.1080/15732479.2015.1086387
Tran, T. B., Bastidas-Arteaga, E., Schoefs, F., and Bonnet, S. (2018). A Bayesian network framework for statistical characterisation of model parameters from accelerated tests: application to chloride ingress into concrete. Struct. Infrastruct. Eng. 14, 580–593. doi: 10.1080/15732479.2017.1377737
Transit New Zealand (1998). Manual for Seismic Screening of Bridges, Revision 2. Transit New Zealand, Wellington.
Yalcin, C. (1997). Seismic Evaluation and Retrofit of Existing Reinforced Concrete Bridge Columns. Ph.D. thesis, University of Ottawa.
Yang, S. Y., Song, X. B., Jia, H. X., Chen, X., and Liu, X. L. (2016). Experimental research on hysteretic behaviors of corroded reinforced concrete columns with different maximum amounts of corrosion of rebar. Construct. Build. Mater. 121, 319–327. doi: 10.1016/j.conbuildmat.2016.06.002
Yuan, W., Guo, A., and Li, H. (2017). Experimental investigation on the cyclic behaviors of corroded coastal bridge piers with transfer of plastic hinge due to non-uniform corrosion. Soil Dyn. Earthq. Eng. 102, 112–123. doi: 10.1016/j.soildyn.2017.08.019
Keywords: Bayesian belief network, corrosion, chloride ingress, reinforced concrete, bridges, risk assessment, seismic vulnerability, decision making
Citation: Tesfamariam S, Bastidas-Arteaga E and Lounis Z (2018) Seismic Retrofit Screening of Existing Highway Bridges With Consideration of Chloride-Induced Deterioration: A Bayesian Belief Network Model. Front. Built Environ. 4:67. doi: 10.3389/fbuil.2018.00067
Received: 24 August 2018; Accepted: 30 October 2018;
Published: 28 November 2018.
Edited by:
Elias G. Dimitrakopoulos, Hong Kong University of Science and Technology, Hong KongReviewed by:
David De Leon, Universidad Autónoma del Estado de México, MexicoMario D'Aniello, Università degli Studi di Napoli Federico II, Italy
Copyright © 2018 Tesfamariam, Bastidas-Arteaga and Lounis. This is an open-access article distributed under the terms of the Creative Commons Attribution License (CC BY). The use, distribution or reproduction in other forums is permitted, provided the original author(s) and the copyright owner(s) are credited and that the original publication in this journal is cited, in accordance with accepted academic practice. No use, distribution or reproduction is permitted which does not comply with these terms.
*Correspondence: Solomon Tesfamariam, U29sb21vbi5UZXNmYW1hcmlhbUB1YmMuY2E=
 Solomon Tesfamariam
 Emilio Bastidas-Arteaga
 Zoubir Lounis3