- 1International Research Institute of Disaster Science (IRIDeS), Tohoku University, Sendai, Japan
- 2Department of Civil Engineering, Graduate School of Engineering, Tohoku University, Sendai, Japan
- 3Institute for Risk and Disaster Reduction, University College London, London, UK
This study presents a new analysis of spatial variation in fatality ratios in the 2011 Great East Japan tsunami, in order to overcome the limitations of previous studies that tended to underestimate the fatality ratios. In addition, this analysis was performed in a manner that allows the results to be compared to those from analyses of fatality ratios in other historical tsunamis. To do this, it uses population and fatality data at the village scale in areas of less than 3 km2 where the inundation ratio was greater than 70%, rather than the lower resolution data used in previous studies. The median value of the tsunami inundation depth at each location was extracted at the original 5-m grid resolution. All of the data were obtained from the Reconstruction Support Survey Archive. Based on the results, a strong correlation between the fatality ratio and inundation depth was found only in some areas of the Sendai Plain, whereas no strong correlation was observed along the Sanriku ria coastline. Fatality ratios in Sanriku were likely related not only to the force of the tsunami but also to other factors, such as the ria topography and the population’s experience of past historical tsunamis. Data from other tsunamis in regions where tsunamis frequently occur also indicate that historical tsunami experience is a key factor in reducing fatality ratios. In contrast, the Sendai Plain shows smaller variation in local tsunami amplification effect compared to that of the Sanriku ria coastline as well as fewer coastal defense structures. Therefore, the fatality ratio in that region was predominantly affected by the force of the tsunami and the residents’ individual characteristics. On the Sendai Plain, Ishinomaki City exhibited a strong correlation between the fatality ratio and inundation depth as well as between fatality ratio and building damage, because its low evacuation ratio meant that many fatalities occurred in victims’ homes. Therefore, the fatality ratio in Ishinomaki City was higher than those in other areas at the same inundation depth. Simple empirical formulas were developed for estimation of human fatalities based on inundation depths and building damage ratios.
Introduction
The 2011 Great East Japan Tsunami was generated by a magnitude 9.0 earthquake with a rupture length that spanned the entire Tohoku region (Satake et al., 2013). Direct damage from the earthquake shaking and coseismic landslides was limited, with few reports of fatalities; however, the tsunami caused a large number of fatalities, as well as damage to buildings and other property (Suppasri et al., 2012). In general, the primary parameters that affect earthquake-related fatality ratios are the magnitude of the earthquake and the shaking intensities of different building types (Jaiswal et al., 2011). After severe damage caused by the 1978 Miyagi-oki earthquake, new building design codes and retrofitting procedures were widely implemented in the area. Therefore, despite the 2011 earthquake’s large magnitude and strong ground motion, relatively little damage was caused by the earthquake itself, and the tsunami was responsible for most of the damage.
Some studies of fatality models were conducted prior to the 2011 tsunami. Endoh and Takahashi (1995) performed a full-scale prototype experiment to quantify the balance of the human body subjected to overtopping waves and proposed an empirical formula to evaluate the wave height and human dangers. Sugimoto et al. (2003) presented a method to determine the loss of life following a tsunami that utilized numerical calculations and GIS coordinates based on the Nankai tsunami in Japan. Koshimura et al. (2006) developed a method for estimating the number of casualties that may occur during evacuation from an inundation zone after a tsunami has inundated an area. The method is based on a simple model that considers the effects of hydrodynamic forces on the human body. Marchand et al. (2009) developed a model based on sea defense measures to quantify the potential damages and casualties associated with the 2004 Indian Ocean tsunami in Banda Aceh, Indonesia. Yeh (2010) introduced the use of anthropometric data in a tsunami casualty model. Muhari et al. (2011) further enhanced the human casualty model developed by Koshimura et al. (2006) by adding the human fall mechanism based on experiments by Endoh and Takahashi (1995). Yeh (2014) proposed a new casualty estimation model by incorporating temporal parameters, namely, tsunami arrival time, time of maximum run-up, tsunami warning time, time required for people to evacuate after the warning, and evacuee travel time. The fatality ratios of some historical tsunamis in Japan are summarized and discussed in Section “Historical Tsunamis” before the analysis of the 2011 tsunami.
This study examines the factors that affected human fatalities in the case of the 2011 tsunami based on the fatality ratio for the population and the tsunami inundation in each affected area. Fatality data for this tsunami were collected by national and local government agencies. As discussed below (see 2011 Great East Japan Tsunami), several previous studies have analyzed these fatality data, but they either used scales that were too large for the exposure data or mixed large- and small-scale data. This approach leads to the underestimation of the fatality ratio and yields results that are not comparable to the fatality ratios determined based on data from historical tsunamis. To overcome this problem, the areas and data investigated in this study were carefully selected to ensure the accuracy of the fatality ratios, as explained in Section “The 2011 Great East Japan Tsunami: Reconsidering the Spatial Scale.” In Section “Factors That Affect Human Casualties during Tsunami Events,” the factors that affected human fatalities are elucidated in detail based on the calculated fatality ratio of each target region. Additionally, a statistical analysis was performed, and several empirical formulas for estimating the fatality ratio were developed for this specific case study, as shown in Section “Factors That Affect Human Casualties during Tsunami Events.” The results of this study can improve the estimation of human casualties associated with future tsunamis with similar characteristics.
Historical Tsunamis
This section reviewed the human fatalities caused by historical tsunamis both inside and outside Japan, as reported in previous studies. The factors that affected human fatalities during historical tsunamis are introduced, and the relationships between these factors and the fatality ratio are discussed, with a focus on the 2011 tsunami provided in Section “Factors That Affect Human Casualties during Tsunami Events.” Figure 1 and Table 1 present data from the following studies and summarize the historical tsunamis that have occurred in Japan, including the 1741 Oshima-Oshima tsunami (Tsuji et al., 2002), the 1771 Meiwa tsunami (Miyazawa et al., 2012), the 1896 Meiji Sanriku and 1933 Showa Sanriku tsunamis (Yamashita, 2008), and the 1944 Showa Tonankai and 1993 Okushiri tsunamis (Kawata, 1997). It should be noted that only events in 1896, 1933, and 2011 impact the east coast of Japan. Figure 2 presents a plot of the maximum tsunami run-up heights and fatality ratios of these historical tsunamis using data from these previous studies. In these studies, the fatality ratio was defined as the percentage of the number of dead or missing persons to the total population of the inundation zones before the tsunami. This definition is acceptable because the settlements were small and on the shore, hence the historical sizes of settlements were equal or nearly equal to the number of tsunami-exposed residents within them. However, more recently settlements have merged and extended inland, so that their residential areas are large compared to the actual tsunami inundation area in the case of the 2011 tsunami (see The 2011 Great East Japan Tsunami: Reconsidering the Spatial Scale). The relationships between these parameters are discussed in the following sections.
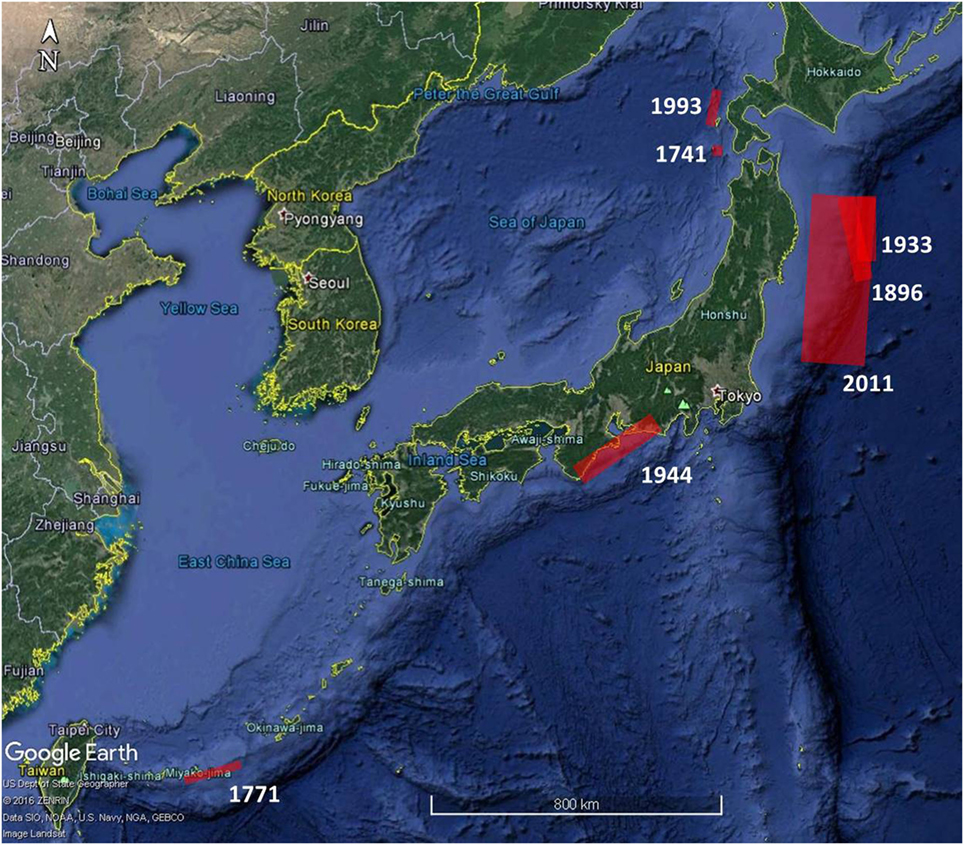
Figure 1. Approximate source areas of historical tsunamis in Japan for which detailed tsunami heights and fatality ratios are available.
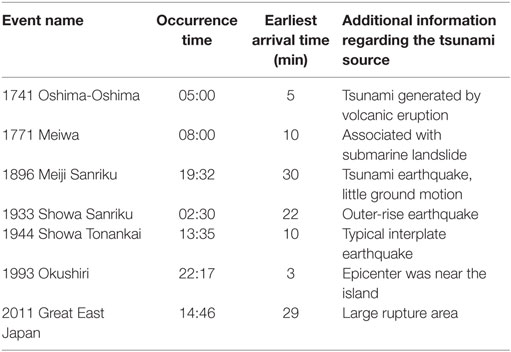
Table 1. Times of earthquake occurrence and earliest tsunami arrival times to the nearest coastlines for the historical tsunamis plotted in Figure 2.
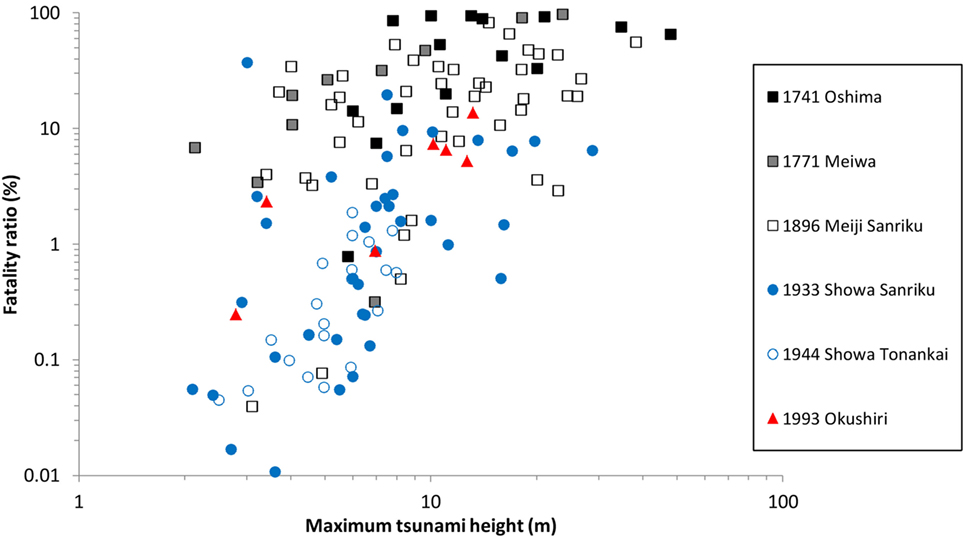
Figure 2. Relationship between the maximum tsunami heights and fatality ratios of historical tsunamis in Japan. Previously published 2011 Tohoku data are not shown for reasons discussed in Section “2011 Great East Japan Tsunami.”
It is also useful to compare the 2011 event in Japan to historical tsunamis in countries with high frequencies of destructive tsunamis (as high as 1/50 years on some coastlines). These countries have correspondingly high levels of tsunami awareness and readiness to evacuate in response to the slightest sign that a tsunami may occur, particularly in traditional coastal communities that have long been established on vulnerable coastlines.
1741 Oshima-Oshima Tsunami, 1771 Meiwa Tsunami, and 1896 Meiji Sanriku Tsunami
These three tsunamis occurred more than 100 years ago at a time when no large tsunamis had recently occurred on the affected coastlines. Additionally, no coastal defense structures or warning systems above the local level existed in the period. These three tsunamis were much larger than other historical tsunamis in these regions. The 1741 Oshima-Oshima tsunami was generated by a volcanic eruption (Tsuji et al., 2002), the 1771 Meiwa tsunami was associated with a submarine landslide (Miyazawa et al., 2012), and the 1896 Meiji Sanriku tsunami was triggered by a tsunami earthquake, an earthquake with little ground shaking that nevertheless generated a large tsunami (Satake and Tanioka, 1999). These events resulted in very high fatality ratios, especially in the case of the 1771 tsunami. For these three tsunamis, the time of event occurrence and the earliest tsunami arrival time (Table 1) had no influence on the fatality ratio because the residents were not alerted by the source events of the tsunamis and so would only have been alerted by seeing or hearing the incoming tsunami wave minutes before its impact.
1933 Showa Sanriku Tsunami, 1944 Tonankai Tsunami, and 1946 Nankai Tsunami
The 1933 Showa Sanriku tsunami occurred just 37 years after the 1896 Meiji Sanriku tsunami. The two tsunamis affected a similar area of the Sanriku Coast. Although the earthquake occurred in the middle of the night, it was associated with strong ground motions that provided an alert for the population exposed to the tsunami. Thus, the warning provided by the strong shaking and the experience of the previous tsunami reduced the number of human casualties, in this case, from a fatality ratio as high as 80% in the 1896 tsunami to a fatality ratio of less than 10% in 1933, even though the latter occurred in the middle of the night. The low fatality ratios characteristic of the 1944 Tonankai earthquake and tsunami (less than 2% even at tsunami heights of nearly 10 m), which occurred 90 years after the 1854 Ansei Tokai and Nankai tsunamis, can be similarly explained.
1993 Okushiri Tsunami
In contrast to the events discussed above, the 1993 Okushiri tsunami struck the coastal community within a few minutes of the source earthquake (faster than the official warning), and with larger than expected waves. Hence, it was difficult for the population to respond effectively to the shaking, and the fatality ratio was as high as 10%.
2011 Great East Japan Tsunami
The 2011 tsunami caused a large number of human casualties in two regions on the eastern coast of Japan, namely, on the Sanriku Coast, where there is high tsunami awareness and many structural countermeasures have been implemented, and on the Sendai Plain and other areas with lower awareness and fewer structural countermeasures. The Sanriku Coast had relatively recently experienced two major tsunamis in 1896 and 1933; however, these two tsunamis had almost no impact on the Sendai Plain and other areas. Using regression analysis to determine the controlling factors, Ueda (2012) considered human fatalities at the village, town, and city scales, whereas Yun and Hamada (2015) considered human fatalities associated with a combination of city and street-level scales. Aldrich and Sawada (2015) used a similar statistical regression approach that combined a mixture of data at the town and village scales; however, they found that a political indicator [level of support for the governing Liberal Democratic Party of Japan (LDP)] and a social indicator (pre-disaster crime rates) exhibited the strongest correlations with the fatality rate, apart from the size of the tsunami itself. They suggest that these two indicators are indicators of investment in pre-disaster community preparedness and of social cohesion and argue that these factors enabled efficient evacuation. We discuss their interpretations of their data in Section “Conclusion.”
Together with Suppasri et al. (2013), these previous studies identified different fatality ratio characteristics based on different geographical settings, historical backgrounds, and disaster countermeasures on the Sanriku Coast vs. those on the Sendai Plain. The fatality ratios calculated in these previous studies were less than 20% in areas where the tsunami run-up height was less than 20 m. However, because the scales used in these previous studies differ from (are larger than) those used to evaluate other historical events, their results are not strictly comparable; thus, it is not appropriate to include the previously published results for the 2011 tsunami in Figure 2.
2004 Indian Ocean Tsunami, 2007 Solomon Islands Tsunami, and 2010 Chile Tsunami
In this section, we review examples from other countries with high occurrence frequencies of damaging tsunamis, where effective self-warning and evacuation plans, even at the last minute, have led to large reductions in fatalities in some affected communities compared to other communities affected by the same tsunamis.
This effect was first noted in the 2004 Sumatra tsunami, during which traditional communities on Simeulue and the Andaman and Nicobar Islands were self-evacuated in response to earthquake shaking; consequently, they experienced much lower fatality rates than did non-indigenous communities in the same areas (e.g., Sieh, 2006). The first quantitative study of the effect was conducted during a post-tsunami damage survey after the 2007 Solomon Islands tsunami, in which the fatality ratios of traditional Solomon Islands communities were much less than those of immigrant communities who had moved to the Solomon Islands from Kiribati in the central Pacific (Fritz and Kalligeris, 2008; McAdoo et al., 2008). Testimony from these communities strongly indicated that the traditional communities were alerted by the earthquake shaking followed by sea-level drawdown. They responded with a rapid evacuation initiated and led by the village elders, resulting in a lower fatality ratio. By contrast, in the immigrant communities, many people, including many children, did not evacuate since their arrival in the Solomon Islands between 1955 and 1962 postdated the previous large tsunamis in the area (McAdoo et al., 2009). Notably, children from the immigrant communities explored the reefs exposed by the drawdown, and many perished when the tsunami swept across the reefs. A subsequent study (McAdoo et al., 2009) found that the fatality ratios in the traditional or indigenous communities were less than 1% overall and were dominated by fatalities in a single village where the tsunami run-up height (12 m) was twice as high as it was anywhere else. The fatality ratios in the immigrant villages were approximately 4% overall, several times the average fatality ratio in the traditional communities.
Similarly, during the 2010 Chile tsunami, prompt and effective evacuations occurred in coastal fishing communities that had previously been affected by the 1960 tsunami and other earlier tsunamis. In contrast, much higher fatalities occurred among transient groups of tourists at coastal campsites (Fritz et al., 2011). Other recent examples of effective self-evacuations in long-established coastal communities have been reviewed by Okal (2015). These studies emphasize the role of community-based education and awareness programs in promoting self-warning and voluntary evacuations as effective measures in near-field areas where strong earthquake shaking provides sufficient warning.
The 2011 Great East Japan Tsunami: Reconsidering the Spatial Scale
Spatial Scale
The spatial scale in Japan can be classified as follows: Level 1, prefectures; Level 2, cities/towns/villages; Level 3, village sections; and Level 4, streets (1 × 2 km2), as shown in Figure 3A. However, as noted in the previous section, previous studies of the 2011 tsunami event have been based on large-scale population data or both large- and small-scale data. For example, Ueda (2012) used Level 2 data, whereas Yun and Hamada (2015) used a mixture of data from Levels 2–4 in their analysis. Therefore, the fatality ratios calculated by these authors are underestimates for the fatality ratios in the areas actually inundated, because they include in their calculations many people resident in parts of Level 2 domains outside the inundation areas. Their results cannot be compared to those from different areas for the same event or to those from the same areas for historical events where many communities were small and on the shore hence totally inundated. Therefore, the fatality ratios were recalculated in this study using a spatial scale as fine as Level 3 to investigate the factors that affect human fatalities and accurately compare the characteristics of the 2011 tsunami to those of other historical tsunamis.
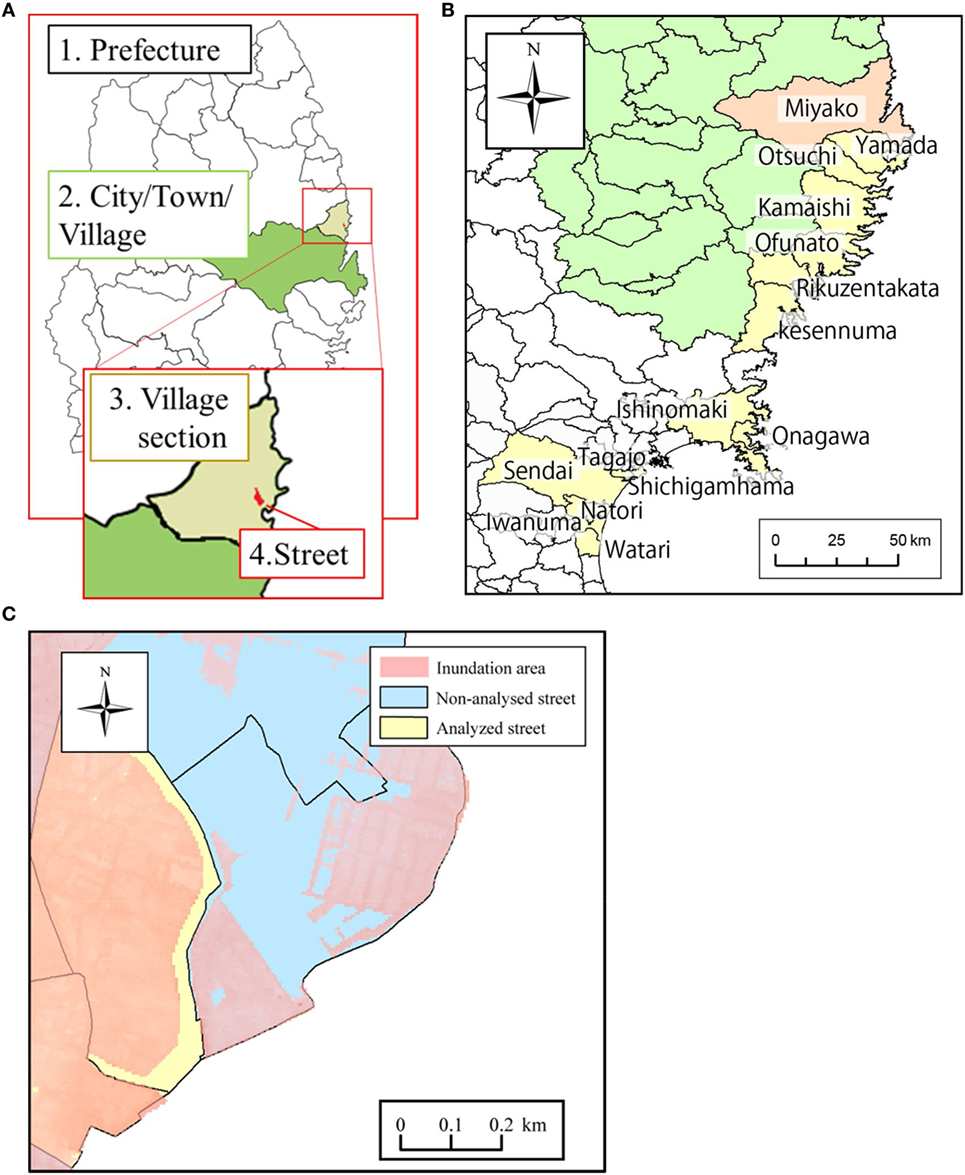
Figure 3. (A) Spatial scale used in this study, (B) study areas, and (C) inundation area selected for this study.
Data
In this study, areas affected by the 2011 tsunami (Figure 3B) distinguished at the street level were selected from the Reconstruction Support Survey Archive (2016) based on two criteria: (1) the areas were required to be smaller than 3 km2 to ensure that they only reflected the characteristics of one area and (2) the tsunami inundation ratios (the ratio of the area that is inundated) were required to be larger than 70% to ensure that the calculated fatality ratios were those of the actual exposed population (or as close as possible) to avoid including the non-exposed population, as shown in Figure 3C. Tsunami inundation depths at a resolution of 5 m × 5 m were also obtained from the Reconstruction Support Survey Archive (2016). In this study, the fatality ratio was defined as the ratio of the number of dead or missing persons to the total population before the 2011 tsunami, as illustrated in Eq. 1. A limitation should be noted when using the resident or nighttime population in this study. This event occurred in the afternoon, and retired or self-employed persons were home, while others may have been working outside of the village in which they lived: although equally, people resident outside the inundation area may have been working or at school in the inundation zone. Both the total number of people in the inundation zone at the time of the tsunami and the age distribution of that population are therefore subject to a degree of uncertainty given the data used.
Method of Calculation
Sets of inundation depths and fatality ratios at the village level (Level 3) from the Reconstruction Support Survey Archive (2016), Pearson’s product-moment correlation coefficients (Pearson’s R), and statistical data at each city/town/village level (Level 2) were computed in both Sanriku Coast and Sendai Plain study areas (Figure 3A). The Pearson’s R values provide the basis for the discussion presented in Section “Factors That Affect Human Casualties during Tsunami Events,” in which three different regions are examined separately: the Sanriku Coast, Sendai Plain, and Ishinomaki City. Finally, empirical formulas were proposed based on previously proposed fatality prediction models used by the central and local governments in Japan. Additional details regarding the determination of the empirical formulas are given in Section “Comparisons with Existing Empirical Equations for Human Fatality Estimation and Proposed New Equations.”
Factors That Affect Human Casualties during Tsunami Events
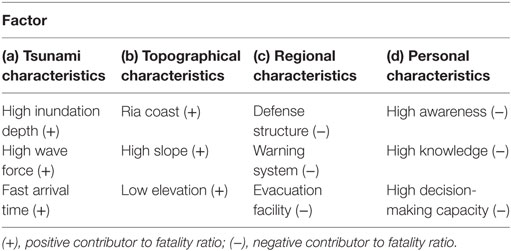
Many factors have been identified in previous studies [i.e., Aldrich and Sawada (2015) and Yun and Hamada (2015)], both quantitative and qualitative, that affect human fatality ratios during tsunami events. Their effects vary with the different characteristics of each event, which can be divided into four categories: (a) characteristics of the tsunami itself, such as arrival time, inundation depth, peak wave, and impact forces; (b) characteristics of the topography such as slope, land elevation, and coastal types; (c) characteristics of tsunami mitigation measures in the impacted region, such as evacuation routes and facilities, warning systems and disaster awareness programs, and extent of constructed barriers or tsunami defenses; and (d) personal characteristics of individuals in the population of the inundation zone, such as disaster awareness and knowledge of effective mitigation actions, mental and physical ability to gather and interpret information, mental ability to make evacuation decisions, and physical ability to implement these decisions. More details about the variables of each factor are summarized in Table 2.
The characteristics in the first two categories are widely known to strongly affect the fatality rate, and as a result numerous studies have been devoted to ensuring that tsunami models correctly represent the interactions between tsunami waves and topography to produce the resulting inundation and flow fields. Similarly, characteristics in the last two categories are co-dependent and also depend on the history of tsunamis in the region. Data from survivor interviews in the aftermath of the Tohoku 2011 tsunami (Ando et al., 2013), as well as video records of the disaster, strongly indicate that the actions of many were influenced by their expectations of likely tsunamis and the capacities of official tsunami warning systems, coastal defenses, and tsunami refuge areas. Failures of these defenses and refuges to protect against the tsunami resulted in significantly increased casualties in some places (Ando et al., 2013; Day and Fearnley, 2015). When interpreting the results of statistical approaches to understanding the importance of different characteristics based on the factors that influence fatality rates, it is important to recognize the complexities that may be associated with the interactions between characteristics.
Factors That Affect Human Fatality Ratios on the Sanriku Coast
The Sanriku Coast has a distinctive coastal topography, namely, that of a so-called ria coastline, where tsunamis can be easily amplified (Suppasri et al., 2013). The local communities there have experienced with historically recent tsunami disasters (the 1896 Meiji Sanriku and 1933 Showa Sanriku tsunamis). Thus, the human fatality ratios on the Sanriku Coast were affected by the factors shown in Eq. 2 and Table 3. There is a weak correlation between inundation depth and fatality ratio in this region [Figure 4A; R ≤ 0.32 (Figure 4D)], with large scatter and a strong negative correlation in Onagawa, likely due to personal characteristic factors such as an expectation of safety in areas not expected to be inundated.
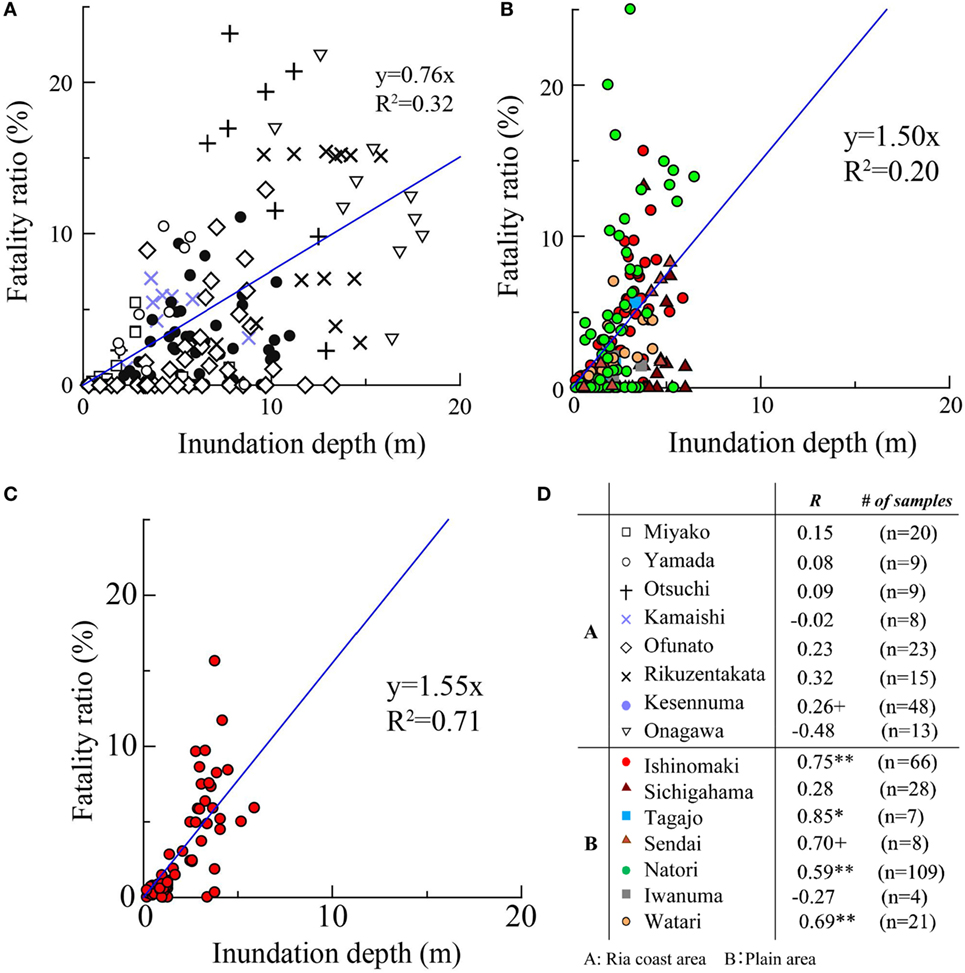
Figure 4. Plots of fatality ratio vs. inundation depth for (A) the Sanriku Coast, (B) Sendai Plain, (C) the urban area of Ishinomaki City, and (D) the correlation coefficients in the form of Pearson’s R for each location. Note that **p = 0.01 and + p < 0.10.
Factors That Affect Human Fatality Ratios on the Sendai Plain
The Sendai Plain has low relief [(b) topographical characteristics], and relatively few disaster prevention facilities have been established in the area [(c) regional characteristics]. As a result, a strong linear relationship between the inundation depth and fatality ratio can be observed in some areas of the Sendai Plain [Figure 4D, such as Ishinomaki (Pearson’s R = 0.75), Tagajo (R = 0.85), Sendai (R = 0.75), Natori (R = 0.59), and Watari (R = 0.69)], as shown in Figure 4B. Human fatality ratios in this region are likely controlled only by tsunami and personal characteristics, as shown in Table 3 and Eq. 3.
Factors That Affect Human Fatalities in the Urban Area of Ishinomaki City on the Sendai Plain
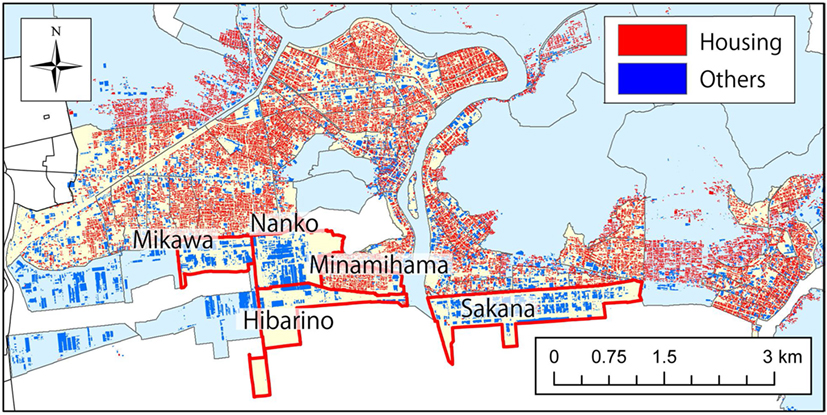
The urban area of Ishinomaki City comprises two main zones, including housing and factory zones, as shown in Figures 4 and 5. The tsunami evacuation ratio in the urban area of Ishinomaki City during the 2011 tsunami was uniformly quite low [(d) human characteristics] (Mikami, 2014). Hence, variations in the personal characteristics of the residents had little effect on variations in the human fatalities within this area, which were controlled mainly by the characteristics of the tsunami, as shown in Eq. 4 and Table 3. As a result, a strong correlation between the inundation depth and fatality ratio (R = 0.85 in Figure 4D) can be observed in Figure 4C.
Relationship between the Fatality Ratio and Building Damage
This section focuses on the fatality ratios and levels of building damage in the urban area of Ishinomaki City (Figures 5 and 6). Figure 7A shows a good correlation (R = 0.75) between the inundation depths and fatality ratios in the residential areas of the city. To compare this relationship with the level of building damage, the building damage ratio (PD) is defined as shown in Eq. 5 based on the equation proposed by Hatori (1984).
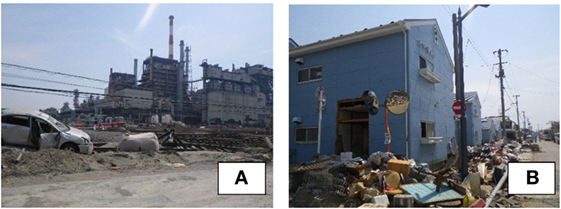
Figure 6. Damage in Ishinomaki City: (A) photograph of an industrial area and (B) photograph of a residential area (photograph date: 15/4/2011).

Figure 7. Plots for the urban area of Ishinomaki City showing (A) fatality ratio vs. inundation depth, (B) building damage ratio vs. inundation depth, and (C) fatality ratio vs. building damage ratio. See Figure 5 for geographic locations. (1) to (4) refers to models (1) to (4) as discussed in Section “Comparisons with Existing Empirical Equations for Human Fatality Estimation and Proposed New Equations.”
The results shown in Figure 7B reveal that the inundation depth exhibits a close correlation with the building damage ratio (R = 0.89). Figure 7C shows that the fatality ratio also exhibits a good correlation (R = 0.75) with the building damage ratio up to 0.9. However, some variability or weak correlation is observed when the building damage ratio is closer to 1.0. These findings suggest that a large number of the human casualties in this event occurred in the victims’ homes because of the low evacuation ratio. In other words, human fatalities and building damage likely occurred at the same time. This analysis is consistent with the survey results, which indicated that approximately 63% of the casualties in Ishinomaki occurred in the victims’ homes. In addition, a study conducted by Goto (2015) found that no tsunami evacuation drills had been performed in the residential areas and that this scenario was responsible for the failure to evacuate at least 20% of the residents. By contrast, more extensive evacuation was observed in industrial areas (red circles in Figure 7), where far more tsunami information was available to the populations of industrial workers. This suggests that tsunami warning and evacuation drills organized at the level of the workplace were effective.
Comparisons with Existing Empirical Equations for Human Fatality Estimation and Proposed New Equations
Several previous studies have been performed in Japan, which have yielded empirical equations for estimating fatality ratios. Miyano and Ro (1992) used the number of damaged buildings in the case of the 1944 Tonankai earthquake as a parameter for estimating the number of casualties. Shizuoka Prefecture (2001) adapted this previously developed equation by adding population data as an input parameter to address the case of the 1993 Okushiri tsunami. The Suppasri et al. (2012) in Japan used tsunami inundation depth and population data as input parameters for fatality estimation based on the same 1993 Okushiri tsunami.
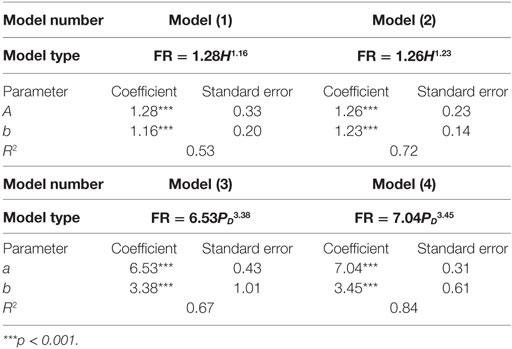
Based on the findings from Sections “Factors That Affect Human Fatalities in the Urban Area of Ishinomaki City on the Sendai Plain” and “Relationship Between the Fatality Ratio and Building Damage,” human fatalities in residential areas in Ishinomaki City, which is located in a plain area with few tsunami prevention facilities, low tsunami awareness, and limited evacuation plans, were strongly correlated with tsunami characteristics. In addition, many previously proposed models were relatively simple and used only tsunami-related parameters, namely, inundation depth and building damage. Therefore, we also develop empirical equations based on the improved fatality ratios in case of the 2011 tsunami. The exponential model and power model were selected to construct a single regression equation for calculating the fatality ratio using the inundation depth and building damage ratio. These models were selected because regression analysis can be performed based on the relationship between the fatality ratio, inundation depth, and building damage ratio, and a value of 0 is applicable when using these models.
In the present study, the inundation depths (H) and building damage ratios (PD) in the case of the 2011 tsunami were considered as input parameters to estimate the fatality ratios via empirical equations. The data shown in Figures 7A,B were used as a basis for developing the equations for fatality ratio estimation shown in Table 3. Models (1) and (2) are equations in which the inundation depth is used as the input parameter (FR = aHb), whereas models (3) and (4) use the building damage ratio. Models (1) and (3) include data from industrial areas, whereas models (2) and (4) are based only on data from residential areas, as shown in Figures 4 and 5. The latter models can be used to estimate fatality ratios in areas where low evacuation rates are expected. Proposed equations for fatality ratio estimation are shown in Table 4. These formulas can be applied to areas where less evacuation or late evacuation behavior is expected.
Comparison with the 2004 Indian Ocean Tsunami
The fatality ratios of the historical tsunamis discussed in Section “Historical Tsunamis” were compiled based on tsunami run-up height rather than inundation depth. Therefore, a direct comparison with this study is not possible. However, a detailed study of the fatality ratios and inundation depths in the case of the 2004 Indian Ocean tsunami was performed by Koshimura et al. (2009). These authors collected fatality ratios for each village in Banda Aceh, which was the largest area affected by this tsunami event. They reported that the potential tsunami casualties increased upwards from an inundation depth exceeding 2 m (fatality ratio = 10%) and that the maximum fatality ratio of 100% was reached for an inundation depth of 8 m.
By contrast, in the case of the 2011 Great East Japan tsunami analyzed in this study, the fatality ratio was approximately 3% at a 2 m inundation depth, and most fatality ratios for this event were below 20%. The fatality ratios in the case of the 2004 tsunami were much higher than those during the 2011 tsunami for the following reasons: (1) in case of the 2004 tsunami, a large number of weak buildings suffered damage from the earthquake; (2) the most recent event that occurred before the 2004 tsunami-like event was approximately 600 years prior (Jankaew et al., 2008; Monecke et al., 2008), resulting in less tsunami awareness due to a lack of experience; (3) no tsunami warning system or tsunami awareness education had been implemented in the Indian Ocean region before the 2004 tsunami; and (4) the existing small coastal defense structures in the Indian Ocean at the time of the 2004 event were intended only for shoreline protection or high-tide protection and not for protection against tsunamis.
Comparison to the 2007 Solomon Islands Tsunami
In the cases of the other studies discussed in Section “2004 Indian Ocean Tsunami, 2007 Solomon Islands Tsunami, and 2010 Chile Tsunami,” the data are often incomplete, but partial comparisons are possible. In the 2007 Solomon Islands tsunami, although directly measured data on inundation depths are sparse, the relationship between inundation depth and fatality ratio can be inferred because the majority of the affected houses were stilt-type houses with floors 1 m to 2 m above ground level. Such houses are remarkably resistant to the effects of tsunamis that do not inundate their raised floors because the water flows freely past the cross-braced stilts [see, for example, Figure 3E of Fritz and Kalligeris (2008)], but they collapse at greater inundation depths when the force of the flow acts upon the walls of the upper part of the house. Thus, the destruction of all houses in many traditional communities affected by the 2007 Solomon Islands tsunami indicates inundation depths greater than the 1 m to 2 m range. Nevertheless, most of these communities reported 0% fatality ratios, while the community with the highest fatality ratio–of 3%–among affected traditional communities experienced inundation of no less than 5 m depth (Fritz and Kalligeris, 2008). We can therefore conclude that typical fatality ratios would therefore be much lower than 3% at a 2 m inundation depth in such communities and, therefore, even less than those observed at the same inundation depth in the 2011 Great East Japan tsunami.
Conclusion
First, this study reviewed the relationship between the maximum tsunami heights and fatality ratios of historical tsunamis in Japan. The data clearly reveal different trends, as extremely large tsunamis (associated with landslides or tsunami earthquakes) that occurred more than 100 years ago resulted in high fatality ratios. Experiences from these tsunamis appear to have reduced the fatality ratios in the subsequent generations, as is the case in South Pacific countries where damaging tsunamis occur with a high frequency of one every 50 years or less. As a result, traditional coastal communities in these places possess a high level of tsunami hazard awareness, the ability to self-warn based on a variety of warning signs, and knowledge of the necessity for rapid evacuation. However, a similar high-fatality scenario occurred recently in Japan (Okushiri, 1993) when a tsunami formed at an unexpected location and arrived very quickly.
Second, this study focused on the 2011 Great East Japan tsunami. The main limitations of previous studies were noted, namely, the scales of the areas used to calculate the fatality ratios relative to the areas of inundation. To address this shortcoming, the fatality and population data used in this study were carefully selected to ensure that the calculated fatality ratios had the same definition in all areas and to enable comparisons with other historical tsunamis. In this study, the factors that affect human fatalities were interpreted after careful investigation of the relationship between the maximum inundation depths and fatality ratios. The identified factors that affect human fatalities include tsunami characteristics, topographical characteristics, regional characteristics, and human characteristics. There were few disaster prevention facilities and a low evacuation ratio in the urban area of Ishinomaki City on the Sendai Plain because of the lack of historical large tsunamis in this area, which led to a strong relationship between the fatality ratios and building damage ratios. Empirical formulas were also proposed to estimate the fatality ratios based on the inundation depths and building damage ratios in the residential areas of Ishinomaki City. These formulas can be applied to areas where less evacuation or late evacuation behavior is expected.
Third, a comparison of the data from the 2011 tsunami (city area of Ishinomaki) and that from the 2004 Indian Ocean tsunami (Banda Aceh) reflects the effects of different regional characteristics and human characteristics on the human fatality rate, with a much lower fatality ratio at the same inundation depth in 2011 in Japan. A similar effect was observed for the variation in the fatality rates between different communities in the Solomon Islands 2007, Chile 2010, and other tsunamis.
We emphasize that analyses involving statistically significant correlations between characteristics and fatality rate must be performed with caution and based on various data sources, such as the information provided by survivor interviews and video recordings from tsunami disasters. As an example, we cite the correlation between pre-2011 political support for the governing LDP party and the fatality rate of the Tohoku 2011 tsunami identified by Aldrich and Sawada (2015), which they interpret as indicative that political support was rewarded by greater investment in tsunami defenses, local hazard awareness, and warning systems. However, survivor interviews (Ando et al., 2013) indicate that the net effect of the tsunami defenses may have been harmful, and decisions to evacuate were rarely influenced by locally generated official warnings but strongly associated with self-warning based on knowledge of previous events, as was observed during other tsunamis discussed above. Thus, the statistical correlation identified by Aldrich and Sawada may be associated with greater political support for the LDP in more stable and traditional communities, which are also characterized by more widespread and deeply ingrained knowledge of previous tsunamis, such as those of 1896 and 1933. Thus, correlation does not imply causation in this case.
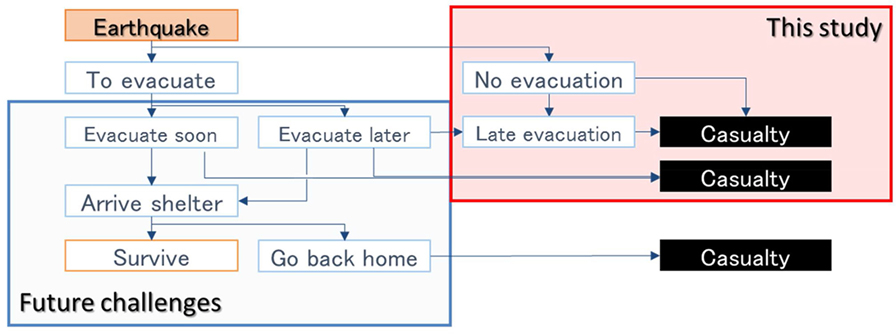
In summary, this study has clarified the factors that affect human fatality ratios in the case of the 2011 tsunami in Japan and found that the urban area of Ishinomaki can serve as a good example of a case in which the residents decided not to evacuate, decided to evacuate but did so too late, and suffered fatalities during evacuation, as shown in Figure 8. Thus, the findings of this study can improve the understanding of evacuation scenarios that lead to human casualties and facilitate the estimation of human casualties associated with potential future tsunamis in similar areas.
Ethics Statement
Although the study analyzed and discussed about human casualty and analyzed fatality ratios, we have received a permission from the Reconstruction Support Survey Archive (http://fukkou.csis.u-tokyo.ac.jp/) for a usage of fatality data. These data are only officially provided to authorized institutions for academic purposes. We generalized the data and plotting so that individual data can not be identified in all explanations and illustrations. As stated above, we used the fatality data prepared by the archive. The data are fatality ratio for each village where individual data cannot be identified.
Author Contributions
AS wrote the whole paper, illustrations, and gave detailed discussions on the analysis and general comments. NH did the analysis and illustrations. FM gave detailed discussions on the analysis. FI and PL gave general comments. SD wrote additional parts of the paper and gave overall comments.
Conflict of Interest Statement
The authors declare that the research was conducted in the absence of any commercial or financial relationships that could be construed as a potential conflict of interest.
Funding
The authors would like to express our sincere gratitude to the reviewers for their valuable advice. This research was funded by the Reconstruction Agency of the Government of Japan, Tokio Marine & Nichido Fire Insurance Co., Ltd., Willis Research Network, and JSPS Grant-in-Aid for Young Scientists (B) “Applying developed fragility functions for the Global Tsunami Model (GTM)” (No. 16K16371), through IRIDeS, Tohoku University.
References
Aldrich, D. P., and Sawada, Y. (2015). The physical and social determinants of mortality in the 3.11 tsunami. Soc. Sci. Med. 124, 66–75. doi: 10.1016/j.socscimed.2014.11.025
Ando, M., Ishida, M., Hayashi, Y., Mizuki, C., Nishikawa, Y., and Tu, Y. (2013). Interviewing insights regarding the fatalities inflicted by the 2011 Great East Japan earthquake. Nat. Hazards Earth Syst. Sci. 13, 2173–2187. doi:10.5194/nhess-13-2173-2013
Day, S., and Fearnley, C. (2015). A classification of mitigation strategies for natural hazards: implications for the understanding of interactions between mitigation strategies. Nat. Hazards 79, 1219–1238. doi:10.1007/s11069-015-1899-z
Endoh, K., and Takahashi, S. (1995). “Numerically modelling personnel danger on a promenade breakwater due to overtopping waves,” in Proceedings of the XXIV International Conference on Coastal Engineering (ICCE), ed. B. L. Edge (Kobe, Japan: American Society of Civil Engineers), 1016–1029.
Fritz, H. M., and Kalligeris, N. (2008). Ancestral heritage saves tribes during 1 April 2007 Solomon Islands tsunami. Geophys. Res. Lett. 35, L01607. doi:10.1029/2007GL031654
Fritz, H. M., Petroff, C. M., Catalán, P. A., Cienfuegos, R., Winckler, P., Kalligeris, N., et al. (2011). Field survey of the 27 February 2010 Chile tsunami. Pure Appl. Geophys. 168, 1989–2010. doi:10.1007/s00024-011-0283-5
Goto, Y. (2015). Tsunami evacuation features of organizations and individuals in Kadonowaki and Minamihama of Ishinomaki. Proc. Civ. Eng. 71, 930–942; (in Japanese). doi:10.2208/jscejseee.71.I_930
Hatori, T. (1984). Damage probability of houses by tsunamis. Bull. Earthq. Res. Inst. 59, 433–439; (in Japanese).
Jaiswal, K. S., Wald, D. J., Earle, P. S., Porter, K. A., and Hearne, M. (2011). “Earthquake fatalities models within the USGS prompt assessment of global earthquakes for response (PAGER) system,” in Human Casualties in Earthquakes – Progress in Modelling and Mitigation, eds R. Spence, E. So, and C. Scawthorn (Dordrecht: Springer), 83–94.
Jankaew, K., Atwater, B. F., Sawai, Y., Choowong, M., Charoentitirat, T., Martin, M. E., et al. (2008). Medieval forewarning of the 2004 Indian Ocean tsunami in Thailand. Nature 455, 1228–1231. doi:10.1038/nature07373
Kawata, Y. (1997). Prediction of loss of human lives due to catastrophic earthquake disaster. Jpn. Soc. Nat. Disast. Sci. 16, 3–13. Japanese.
Koshimura, S., Katada, T., Mofjeld, H., and Kawata, Y. (2006). A method for estimating casualties due to the tsunami inundation flow. Nat. Hazards 39, 265–274. doi:10.1007/s11069-006-0027-5
Koshimura, S., Oie, T., Yanagisawa, H., and Imamura, F. (2009). Developing fragility functions for tsunami damage estimation using numerical model and post-tsunami data from Banda Aceh, Indonesia. Coast. Eng. J. 51, 243–273. doi:10.1142/S0578563409002004
Marchand, M., Buurman, J., Pribadi, A., and Kurniawan, A. (2009). Damage and casualties modelling as part of a vulnerability assessment for tsunami hazards: a case study from Aceh, Indonesia. J. Flood Risk Manag. 2, 120–131. doi:10.1111/j.1753-318X.2009.01027.x
McAdoo, B. G., Fritz, H. M., Jackson, K. L., Kalligeris, N., Kruger, J., Bonte-Grapentin, M., et al. (2008). Solomon Islands tsunami, one year later. EOS 89, 169–170. doi:10.1029/2008EO180001
McAdoo, B. G., Moore, A., and Baumwoll, J. (2009). Indigenous knowledge and the near field population response during the 2007 Solomon Islands tsunami. Nat. Hazards 48, 73–82. doi:10.1007/s11069-008-9249-z
Mikami, T. (2014). The survey analysis about the victims by the tsunami under the Great East Japan earthquake – Yamada-cho and Ishinomaki city. Proc. Civ. Eng. 70, 908–915. Japanese. doi:10.2208/jscejseee.70.I_908
Miyano, M., and Ro, H. J. (1992). Examination of Human Damage at the Time of the Earthquake Based on Historical Damage Survey Data, Vol. 2. Report of Institute of Social Safety Science, 127–135. (in Japanese).
Miyazawa, K., Goto, K., and Imamura, F. (2012). “Re-evaluation of the 1771 Meiwa tsunami source model, southern Ryukyu Islands, Japan,” in Advances in Natural and Technological Hazards Research, Submarine Mass Movements and Their Consequences, Vol. 31, eds Yamada Y., Kawamura K., Ikehara K., Ogawa Y., Urgeles R., Mosher D., et al. (Dordrecht: Springer), 497–506.
Monecke, K., Finger, W., Klarer, D., Kongko, W., McAdoo, B. G., Moore, A. L., et al. (2008). A 1,000-year sediment record of tsunami recurrence in northern Sumatra. Nature 455, 1232–1234. doi:10.1038/nature07374
Muhari, A., Imamura, F., Koshimura, S., and Post, J. (2011). Examination of three practical run-up models for assessing tsunami impact on highly populated areas. Nat. Hazards Earth Syst. Sci. 11, 3107–3123. doi:10.5194/nhess-11-3107-2011
Okal, E. A. (2015). The quest for wisdom: lessons from 17 tsunamis, 2004-2014. Phil. Trans. R. Soc. A 373, 20140370. doi:10.1098/rsta.2014.0370
Reconstruction Support Survey Archive. (2016). Victims Situation. Available at: http://fukkou.csis.u-tokyo.ac.jp/
Satake, K., Fujii, Y., Harada, T., and Namegaya, Y. (2013). Time and space distribution of coseismic slip of the 2011 Tohoku earthquake as inferred from tsunami waveform data. Bull. Seismol. Soc. Am. 103, 1473–1492. doi:10.1785/0120120122
Satake, K., and Tanioka, Y. (1999). Sources of tsunami and tsunamigenic earthquakes in subduction zones. Pure Appl. Geophys. 154, 467–483. doi:10.1007/s000240050240
Shizuoka Prefecture. (2001). The 3rd Earthquake Damage Assumption Result. Shizuoka, Japan, 171–175. (in Japanese).
Sieh, K. (2006). Sumatran megathrust earthquakes: from science to saving lives. Philos. Trans. A Math. Phys. Eng. Sci. 364, 1947–1963. doi:10.1098/rsta.2006.1807
Sugimoto, T., Murakami, H., Kozuki, Y., Nishikawa, K., and Shimada, T. (2003). A human damage prediction method for tsunami disasters incorporating evacuation activities. Nat. Hazards 29, 587–602. doi:10.1023/A:1024779724065
Suppasri, A., Imamura, F., and Koshimura, S. (2012). Tsunami hazard and casualty estimation in a coastal area that neighbors the Indian Ocean and South China Sea. J. Earthquake and Tsunami 6, 1250010. doi:10.1142/S1793431112500108
Suppasri, A., Koshimura, S., Imai, K., Mas, E., Gokon, H., Muhari, A., et al. (2012). Damage characteristic and field survey of the 2011 Great East Japan tsunami in Miyagi prefecture. Coast. Eng. J. 54, 1250008. doi:10.1142/S0578563412500088
Suppasri, A., Shuto, N., Imamura, F., Koshimura, S., Mas, E., and Yalciner, A. C. (2013). Lessons learned from the 2011 Great East Japan tsunami: performance of tsunami countermeasures, coastal buildings and tsunami evacuation in Japan. Pure Appl. Geophys. 170, 993–1018. doi:10.1007/s00024-012-0511-7
Tsuji, Y., Nishihata, T., Sato, T., and Sato, K. (2002). Inundation heights of the 1741 Oshima-Oshima volcanic eruption tsunami along the coast of Hokkaido. Kaiyo Mon. 28, 15–44; (in Japanese).
Ueda, R. (2012). “Multiple regression analyses of human damage due to tsunami in the 2011 Great East Japan earthquake – synthetic study on characteristics of tsunami and social factors,” in Proceedings of Institute of Social Safety Science, Vol. 18. (Tokyo: Institute of Social Safety Science), 443–450. (in Japanese).
Yamashita, F. (2008). Tsunami and Disaster Prevention-Sanriku Tsunami, Vol. 158. Tokyo: Kokon-Shoin Publishing. (in Japanese).
Yeh, H. (2010). Gender and age factor on tsunami casualties. Nat. Hazard Rev. 11, 29–34. doi:10.1061/(ASCE)1527-6988(2010)11:1(29)
Yeh, H. (2014). “Tsunami hazard and casualty estimation model,” in Tenth US National Conference on Earthquake Engineering (Alaska: Frontiers of Earthquake Engineering Anchorage).
Keywords: the 2011 Great East Japan tsunami, human fatalities, fatality ratio, building damage, Ishinomaki City
Citation: Suppasri A, Hasegawa N, Makinoshima F, Imamura F, Latcharote P and Day S (2016) An Analysis of Fatality Ratios and the Factors That Affected Human Fatalities in the 2011 Great East Japan Tsunami. Front. Built Environ. 2:32. doi: 10.3389/fbuil.2016.00032
Received: 23 September 2016; Accepted: 06 December 2016;
Published: 22 December 2016
Edited by:
Katsuichiro Goda, University of Bristol, UKReviewed by:
Nick Horspool, GNS Science, New ZealandLucinda Jane Leonard, University of Victoria, Canada
Copyright: © 2016 Suppasri, Hasegawa, Makinoshima, Imamura, Latcharote and Day. This is an open-access article distributed under the terms of the Creative Commons Attribution License (CC BY). The use, distribution or reproduction in other forums is permitted, provided the original author(s) or licensor are credited and that the original publication in this journal is cited, in accordance with accepted academic practice. No use, distribution or reproduction is permitted which does not comply with these terms.
*Correspondence: Anawat Suppasri, c3VwcGFzcmlAaXJpZGVzLnRvaG9rdS5hYy5qcA==
 Anawat Suppasri
 Natsuki Hasegawa2
 Panon Latcharote