
94% of researchers rate our articles as excellent or good
Learn more about the work of our research integrity team to safeguard the quality of each article we publish.
Find out more
ORIGINAL RESEARCH article
Front. Built Environ. , 28 September 2015
Sec. Earthquake Engineering
Volume 1 - 2015 | https://doi.org/10.3389/fbuil.2015.00017
A new computer-based platform has been proposed whose novelty consists in modeling the local site effects of the ground motion propagation using a hybrid approach based on an equivalent linear model. The soil behavior is modeled assuming that both the shear modulus and the damping ratio vary with the shear strain amplitude. So, the hysteretic behavior of the soil is described using the shear modulus degradation and damping ratio curves. In addition, another originality of the proposed system architecture consists in the evaluation of the conditional mean spectrum on the entire Italian territory automatically, knowing the geographical coordinates. The computer-based platform based on signal processing has been developed using a modular programing approach, to enable the selection and the processing of earthquake ground motion records. The proposed computer-based platform combines in unified environment different features, such as (i) selection of ground motion records using both spectral and waveform matching, (ii) signal processing, (iii) response spectra analysis, and (iv) soil response analysis. The computer-based platform OPENSIGNAL is freely available for the general public at http://areeweb.polito.it/ricerca/ICRED/Software/OpenSignal.php.
Nowadays, the state-of-practice in earthquake engineering design has progressively moved toward the use of dynamic non-linear time history analysis with respect to response spectrum analysis, because of the exponential increment of computational power. All these methods need as prerequisite the selection of a proper suite of earthquake ground motions to be reliable. In fact, among all possible sources of uncertainty (e.g., structural material properties, modeling approximations, design and analysis assumptions, etc.), the selection of earthquake ground motion has the highest effect on the variability of the structural response (Padgett and Desroches, 2007). The selection of earthquake records on most of seismic design codes are based on parameters obtained by disaggregated seismic hazard maps at a specific site, such as the magnitude, M, and the source-to-site distance, R, but other parameters can also be used, such as the soil type, the source mechanism, and the duration. Other parameters can also be used based on intensity measures, such as the peak ground acceleration, pga, the spectral acceleration at the fundamental period of the structure Sa(T1). Other selection criteria are based on spectral matching to a specific target spectrum, such as (1) a design code spectrum, (2) a seismic scenario determined from a ground motion prediction relationship (Campbell and Bozorgnia, 2008), (3) a uniform hazard spectrum (UHS), and (4) a conditional mean spectrum (CMS) (Baker, 2011). Using design code spectrum and UHS might bring to over-softening and over-damping during the analysis (Baker, 2011); therefore, a matching procedure based on the CMS has been developed and presented for the Italian territory in this paper. The local seismic response has been modeled using an equivalent linear model, assuming that both the shear modulus and the damping ratio vary with the shear strain amplitude. So, the hysteretic behavior of the soil is described using the shear modulus degradation and damping ratio curves.
A large number of computer programs, public and commercial, are available at the Observatories and Research Facilities for European Seismology (ORFEUS) data center1, such as SMARTS 2.0, Shake-91, DIMAS, and PickEv 2000, and at the Pacific Earthquake Engineering research center2, such as SIMQKE-I and SIMQKE-II. Most of existing public signal processing software are developed to analyze a single seismic earthquake record at a time (e.g., Seismosignal – available at http://seismosoft.com/ or view wave available at http://iisee.kenken.go.jp/staff/kashima/viewwave.html). For multiple records analysis, commercial software are needed, such as Bispec (Hachem, 2003), but they have the inconvenient that they are not freely available in the market. Other examples of data processing software are USDP (Akkar, 2008) and TSPP (Boore, 2009). However, most of these programs can be used after the earthquake records are selected, but they are not able to guide you through the ground motion selection process from a given database, for example, so they do not provide users with the ability to perform all of these functions in an integrated fashion. Iervolino et al. (2010) developed a Matlab-based software called REXEL, which allows ground motion selection using the Italian database, Itaca (Luzi et al., 2008); however, the proposed software is not able to perform multiple signal processing and it is not able to build the CMS on the Italian territory automatically, by using as input the GIS coordinates. Similar software have also been developed by Corigliano et al. (2012) who implement a software called ASCONA (Corigliano et al., 2012) for the selection of compatible natural ground motions. Recently, also Katsanos and Sextos (2013) developed a Matlab-based software environment integrating finite element analysis with earthquake records selection which works with the PEER database. However, signal processing, soil response analysis, and the possibility to use new target spectra, such as the Conditional Mean Spectra, is not included in the programs mentioned above.
The process which is usually followed by each designer in order to select “reliable” earthquake records is shown in Figure 1 that also describes the structure of the computer platform which has been developed. Each part of the computer environment has been implemented in MATLAB (2012) and has a graphical user interface that is simple and intuitive to be used.
The advantage of the proposed platform is combining all the steps that are described in Figure 1 together. It can read data a large variety of file formats from the most common ground motion databases, such as the PEER-NGA strong motion database (PEER)3, the European Strong-Motion database (ESMD)4, Chilean Database (UCHILE) and from ITalian ACcelerometric Archive (ITACA)5, but it allows also reading manually seismic records selecting the free format. It is composed of several interactive graphical interfaces that integrate the most common signal processing and selection criteria techniques used in earthquake engineering. In the next paragraphs, each part of the platform is described in detail, where more attention is given to the spectral matching procedure and at the site response analysis.
Many ground motion parameters, such as peak displacements and velocities, are used often in different field of earthquake and geotechnical engineering (Boore and Bommer, 2005); however, their values are affected by the noise of the earthquake ground motion. The influence of noise in ground motion records is evident at low and high frequencies where the signal-to-noise ratio is usually lower compared to the mid spectrum. In particular, the effect of low frequencies noise (<1 Hz) on strong motion intensity parameters, such as ground velocities, displacements, and response spectra ordinates, is evident. Then, filtering operations became the primary tool for correcting the ground motion records and consequentially it has become standard practice to cut low and high frequencies by looking at the spectra of the Fourier amplitude spectra and the signal-to-noise ratio. The Butterworth filter is the most used in seismic applications and it is designed to have a flat frequency response in the pass-band range, while it is equal to 0 in the stop-band range. Analytically, the frequency response amplitude of the Butterworth filter is given by
where ω is the generic angular frequency, ωc represents the cutoff frequency, and N is the order of the filter. This type of filter is often used for processing ground motion records, because, for example, the low frequencies can generate unrealistic soil permanent deformations. The source of this error as mentioned above is generated by the high and low frequency noise which contaminate the signal.
Baseline corrections can be applied using different techniques, in the time domain to remove unwanted trends and in the frequency domain to remove unwanted frequencies.
In the frequency domain, the noise is most easily removed by the use of a bandpass filter, like the low-pass filter which is set up to values <0.1. In addition, the effect of aliasing can be eliminated by filtering the original ground motion beyond the Nyquist frequency (12.5 Hz). In most of the databases, ground motion records are already filtered, but there might be cases in which some records are unfiltered and in that case, the filtering option in the environmental platform can be used.
Figure 2 shows the main user dialog window of the computer environment. The number identifies the steps to be followed in order to obtain a correct processing procedure and they are summarized below:
1. Import the record with “Open” or insert the name.dat of the file.
2. Select the correct database.
3. Push “Read” for reading the file and extracting of the main information.
4a. Select the measure units for the accelerations.
4b. Tip the “Bandpass and Bandstop” for filtering the signal.
5. Push “View” for loading the acceleration history and plotting the signal properties and the time histories.
In the Input Data (upper left), the records are uploaded and read automatically for the selected ground motion databases (PEER, ESMD, UCHILE and ITACA) or using the option “free format.” The signal processing module (Figure 2) allows to correct the ground motion records with the Butterworth filter by modifying the default set up values (fmin = 0.25 Hz, fmax = 25 Hz, n = 4) if needed. The effect of the filter is shown in the Time Histories visualization panel where the time histories of accelerations, velocities, and displacements, both filtered and unfiltered are displayed.
In the Signal Analysis block (low right in Figure 2), the main parameters of the earthquake records (e.g., peak ground acceleration, velocity and displacement, duration, etc.) both peak and root mean square values are calculated and saved both for filtered and unfiltered data. The Arias Intensity and the Fourier Transform graph are plotted, too. Finally, all processed data and records can be exported in other common formats, such as MS Excel and txt (bottom left in Figure 2).
Once the set of ground motions are selected and filtered, the Elastic Response Spectra (acceleration, velocity, displacement, etc.) can be computed for a given value of damping ratio. Furthermore, the mean and median acceleration response spectra of the uploaded set of records with the associated range of dispersion (±σ) can be also evaluated and plotted using also log and semi-log scales.
Different types of target spectrum can be defined during the ground motion selection process. The design spectrum (DS) can be evaluated according to the Italian seismic standards, the NTC 2008 (NTC-08, 2008) for any point in the Italian territory, once the parameters are defined (e.g., nominal life, soil category, damping ratio, over strength factor q to describe the inelastic behavior, etc.). Additionally, the DS according to the European seismic standard, EC8 (CEN, 2004), and to the US standards (FEMA, 2009) can be evaluated inserting the proper parameters.
Furthermore, the platform allows evaluating for a given probability of exceedance the UHS, and the Predicted Mean Spectrum (PMS) using different ground motion prediction equations (GMPE), which are currently available: Ambraseys et al. (1996), Campbell and Bozorgnia (2008), Boore and Atkinson (2008), and Chiou and Youngs (2008). Two additional attenuation laws have been recently inserted to define the CMS for the Chilean sites (Contreras and Boroschek, 2012) and the Regional Indian attenuation equations for Indian sites (Iyengar et al., 2010). However, the novelty of the proposed system architecture is that it allows evaluating the CMS (Baker and Cornell, 2006) for the first time on the entire Italian territory automatically knowing the GIS coordinates and in any other site worldwide knowing the proper parameters.
Non-linear response history analyses are used to generate sets of demands, which are predictive of the buildings performance. FEMA P-58-1 (FEMA, 2012) identifies three different types of performance assessment: intensity-based assessment, scenario-based assessment, and time-based assessment. Each of these methodologies includes the development of an appropriate target acceleration response spectrum, the selection of an appropriate suite of earthquake ground motions, and the scaling of motions for consistency with the target spectrum. Evaluation of a response spectrum as target spectrum is the first step to apply the procedure above mentioned and for this purpose Seismic Performance Assessment of Buildings rules assert that the spectral shape should be consistent with the geologic characteristics of the site. The two most used spectra are the UHS and CMS. The first one is created with referring to a given hazard level and probability of exceedance by enveloping the results of the probabilistic seismic hazard analysis (PSHA) for each period. Furthermore, this is an efficient way of representing seismic hazards for probabilistic performance evaluation of structures, but, at the same time, the spectral values at each period cannot occur in a single ground motion. In other words, the amplitude of a single ground motion is not equally spaced from the UHS at all period. Thus, the UHS is not very representative as target spectrum for any individual ground motion. This limitation has led to focus on the CMS, which is obtained conditioning on a spectral acceleration at only one period. The deaggregation parameters (M, R, and ϵ), obtained from the PSHA as mean values, depending on the period of interest, must be determined to calculate the predicted mean and SD of log spectral acceleration values at all periods using an adequate GMPE. Once the GMPE is selected, the CMS can be defined as the sum of two contributions and is given by
where the first term is the logarithmic spectral acceleration log(Sa(Tref)); the second term is the product between the conditional mean ϵ value, for the period of interest Tref, the SD of log distribution σlog(Sa), and the correlation coefficient (ρ(Ti , Tref)).
The parameter ϵ is a measure of the difference between the log spectral acceleration of a record and the mean log spectral demand predicted, while the correlation coefficient ρ defines the linear correlation between a pair of ϵ values associated to two different periods. While specific correlation equations exist for the California sites (Chiou and Youngs, 2008; Baker and Jayaram, 2008), a new correlation equation (Cimellaro, 2013) has been developed for the European sites analyzing 595 strong motion records and considering the Ambraseys GMPE which is given by
where Tmin = min(T1 , T2), Tmax = max(T1 , T2), while A0, A1, A2, A3, A4 are the model parameters. This correlation equation has been implemented in the platform together with the correlation models proposed by Chiou and Youngs (2008) for the Californian sites.
Figure 3 shows the main user dialog window for defining the CMS. The number identifies the steps to be followed in order to obtain the CMS and the PMS at a given site and they are summarized below:
1a. Select the geological institute (INGV(Italy)) providing the deaggregation parameters.
1b. Insert the spectral acceleration of the UHS to be found in the geological institute internet site. This step is not necessary for defining the CMS and PMS.
2. Select the attenuation model (Ambraseys et al., 1996).
3. Select the correlation coefficient model.
4. Insert the geographic coordinates.
5. Select the exceedance probability.
6. Select the referring period.
7. Run the analysis with “Load.”
When the analysis is completed the mean values of the deaggregation function of referring period, the mean values of deaggregation function of PGA, the spectra and the main information about the CMS are plotted in the spaces with the blue contour.
Ground motion selection and scaling procedures are applied in order to obtain a set of motions that are usually used in dynamic elastic and even non-linear response history analysis.
The proposed framework retrieves records from the PEER-NGA strong motion database (PEER – available at http://ngawest2.berkeley.edu/), the European strong motion database (ESMD – available at http://www.isesd.hi.is/ESD_Local/frameset.htm). The current PEER database includes 21,336 three-component records from 600 shallow crustal events with small-to-moderate magnitude located in California. It covers a magnitude range of 3–7.9, and a rupture distance range of 0.05–1533 km. The estimated or measured time-averaged shear-wave velocity in the top 30 m at the recording sites (Vs30) ranges from 94 to 2100 m/s. The European strong motion database includes around 3000 uniformly processed and formatted European strong-motion records and associated earthquake, station, and waveform parameters (Ambraseys et al., 1996). In details, it includes 462 triaxial strong-motion records from 110 earthquakes and 261 stations in Europe and the Middle East.
Two selection criteria can be used which are based on Waveform Matching and Spectral Matching.
The Waveform Matching can be obtained selecting some specific seismological parameters obtained by the disaggregated seismic hazard maps at a specific site, such as the moment magnitude, Mw, the fault distance or Joyner–Boor distance (R or RJB, expressed in kilometer), the fault mechanism, the soil type according to EC8, and the waveform parameters (e.g., peak ground acceleration, peak ground velocity, peak ground displacement).
The Spectral Matching instead requires an additional step, which is the definition of the target spectrum and the type of matching to be carried out. The current available options in the platform are three: (i) Single period, (ii) Multi periods (up to three values), and (iii) Mean Deviation. A selected percentage error is defined in all cases to vary the number of earthquakes selected. The second step is the selection of the Target Spectrum among the CMS, the DS, the UHS, the PMS, or any User Defined (UDS) response spectrum.
After the selection of the target spectrum, the search of the records between the ground motion databases available in the computer environment is performed. Both horizontal and vertical components of ground motion can be considered in both search methods. All the records that are spectrum compatible are identified. Then, the records found can be preselected manually in a table and visually inspected comparing both response spectra and other data (e.g., location) and only after this further check the records can be downloaded and saved.
In the Italian territory, the epsilon values, which are necessary to evaluate the CMS, have been evaluated assuming a perfectly rigid soil with a flat topography. Therefore, if the target spectrum is the CMS, the selection procedure does not lead to a representative set of acceleration time histories at the site. Therefore, it is necessary to implement site response analysis and project the earthquake record from the bedrock to the soil surface. In reality, the soil parameters affect the seismic response of a geotechnical system, as the soil filters the seismic input and specific frequencies may be amplified while others might not. So, in order to take into account the local site effects of the ground motion propagation, a system of dynamic equations is solved by direct integration using the implicit Newmark method, which is given by the following equations
where Δt defines the time step, u, , and represent the displacement, velocity, and acceleration of the system, respectively. The parameters are determined at the time i + 1 starting from the known values at time i. The parameters β and γ define the variation of the acceleration over the time step and in the present paper they have been assumed equal to β = 1/4 and γ = 1/4 (average acceleration method). The layered soil column above the bedrock is modeled as a multi-degree of freedom system with lumped parameters (spring-dashpot system) and the seismic excitation is imposed at the base of the physical model (bedrock) as an acceleration history (Figure 4).
The equations of motion of the system can be expressed in the following matrix format as
where [M], [C], and [K] are the mass, damping, and stiffness matrices, respectively, while , , and {u} are the vectors of the absolute nodal accelerations, velocities, and displacements, respectively. The term represents the earthquake load, where each component of the vector {I} is equal to a unit value. In a non-linear formulation, the energy of the system is dissipated through the hysteretic loading–unloading cycles, thus, an equivalent viscous damping matrix may be defined in order to simulate the process of dissipation. In addition, in the time domain analyses, the damping depends on the frequencies. The damping matrix is determined using the Rayleigh damping formulation where the damping matrix [C] is defined as follows
with
where ξ is the damping ratio of the soil system and f0 and f1 are the two control frequencies. The main approximation of this procedure consists in the underestimation of the damping at frequencies (Hashash and Park, 2002) between f0 and f1, and the overestimation of the damping at frequencies lower than f0 and higher than f1. Thus, the selection of the two control frequencies is very important in order to obtain reliable results. The proposed procedure evaluates the damping matrix according to Hudson et al. (1994) in which f0 is the fundamental frequency of the soil column, while f1 represents the predominant frequency of the ground motion. In addition, the variation of damping ratio among the soil layers is taken into account in the computer environment calculating the damping matrix [C] by assembling the elements of the damping matrices
The proposed method uses an equivalent linear model (hybrid approach), which describes the soil behavior assuming that both the shear modulus and the damping ratio vary with the shear strain amplitude. So, the hysteretic behavior of the soil is described using the shear modulus degradation curve (G − γ) and the damping ratio curve (ξ − γ). The use of this curve in combination with Eq. 6 is explained in the work of Bardet et al. (2000). In the proposed platform, clay, sand, and rock degradation curves are available by default (Bardet et al., 2000). The dynamic equations of the system given in Eq. 6 are solved using Newmark method evaluating the nodal displacements and the corresponding shear deformations γ at a given time instant t. The γ values are inserted in the curves to update the shear modulus G and the damping ratio ξ, which are used to define the new stiffness and damping (Eq. 9) matrices defined at the same time instant t. The proposed method has some limitation at large shear strain deformations, because in that case, the soil presents a non-linear behavior and both stiffness and damping depend on the number of loading–unloading cycles. Nevertheless, it was observed that at medium deformations, the non-linear behavior of the soil is not significantly influenced by the load path (Jardine et al., 1986). Thus, the proposed hybrid approach can lead to reliable results for the range of medium deformations. The comparison between the proposed approach and the method implemented in EERA (Bardet et al., 2000) is shown in Table 1.
It necessary to mention that the site response analysis tool of OPENSIGNAL is independent from the other tools (matching, filtering, etc.). However, if you decide to use the tools in sequence you should be aware that it can be applied only to records of the database, which have been recorded on rock site.
As illustrative example to show the applicability of the proposed methodology and the capabilities of the computer-based platform environment, six ground motion records (two records from each database) have been chosen from three different databases to test the record processing tool. The list of records selected is given in Table 2, where are shown two different bin sets of six records taken from each database.
The six uncorrected records have values of PGA between 90 and 105 cm/s2 and local magnitude between 4.0 and 6.0. Every uncorrected record in Table 2 has been filtered with a Butterworth filter having fmin = 0.25 Hz, fmax = 25 Hz, and n = 4. The filtered set of records is then used for the response spectral analysis. Figure 5 shows the elastic response spectra of the ground motion set in Table 2 with a damping ratio equal to 5%.
After uploading the records, the computer platform allows computing the main signal parameters divided in three main categories:
- Peak values: PGA, PGV, and PGD;
- Time values: arias intensity, duration, peak acceleration time;
- Root mean square values: aRMS, vRMS, dRMS.
The parameters are calculated for both the unfiltered (Original) and filtered (Modified) records. As example, the signal properties of “Friuli” earthquake are summarized in Table 3.
Wide varieties of techniques have been developed for selecting a reliable set of earthquake records to be used in the dynamic structural analysis (Cimellaro et al., 2011). One selection criteria is based on spectral matching to a specific target spectrum. Thus, the definition of a target spectrum represents the preliminary phase of the spectral matching, and for this purpose, OPENSIGNAL allows choosing between five different spectra:
- Design spectrum (DS) according to NTC-08, 2008, EC8, and FEMA 302;
- Uniform hazard spectrum (UHS);
- Predicted mean spectrum (PMS) according to Ambraseys et al. (1996), Campbell and Bozorgnia (2008), and Boore and Atkinson (2008), Contreras and Boroschek (2012) and Iyengar et al. (2010) GMPE;
- Conditional mean spectrum (CMS);
- User defined spectrum (UDS).
As example, the site of Soveria Mannelli (16.3859° longitude, 39.0969° latitude, close to Lamezia Terme) in southern Italy has been selected. The Spectral matching is carried out considering the UHS spectrum and the CMS spectrum as target spectrum. The CMS has been defined for the period of 1 s and for a probability of exceedance of 10% in 50 years. The CMS has been built taking into account the deaggregation values associated to the referring period (Barani et al., 2009; Cimellaro, 2013). The information related to the UHS is taken from the INGV internet website6 for the Italian sites and from the USGS internet website7 for the US sites. Figure 6 is shown together the three target response spectra (CMS, UHS, and PMS) at the specific site, which are going to be used for selecting the earthquake records.
OPENSIGNAL is available in three different approaches for spectral matching called:
- Single period approach,
- Multi period approach, and
- Mean deviation approach.
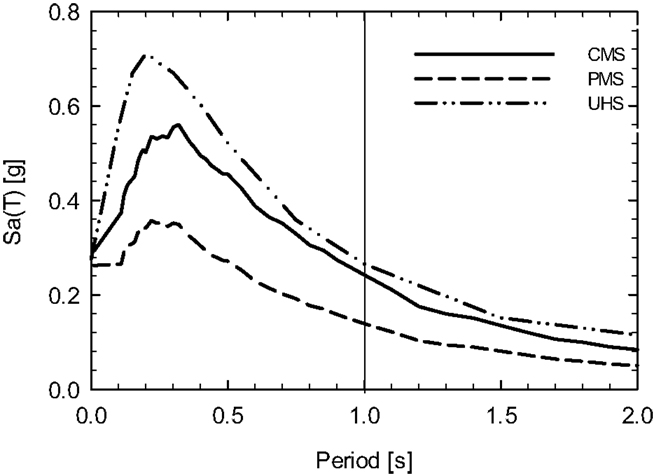
Figure 6. Conditional mean spectrum (CMS), predicted mean spectrum (PMS), and uniform hazard spectrum (UHS) in Soveria Mannelli, Italy.
The “single period approach” does matching using a single control point, while the multi period approach uses more points for the matching. The mean deviation approach defines the mean error during the matching.
The computer environment allows using any of the matching procedures above mentioned, selecting the tolerance in term of percentage error for the first two approaches or in term of mean deviation for the latter one. The search can be performed for the X, Y, or Z components for both the ESMD and PEER records. In Table 4, the parameters used for the matching criteria for both the ESMD and PEER database are summarized, while the results of the three spectral matching procedures for ESMD and PEER database are shown in Figures 7–12 for the case when the fundamental period of the structure is assumed equal to T = 1 s.
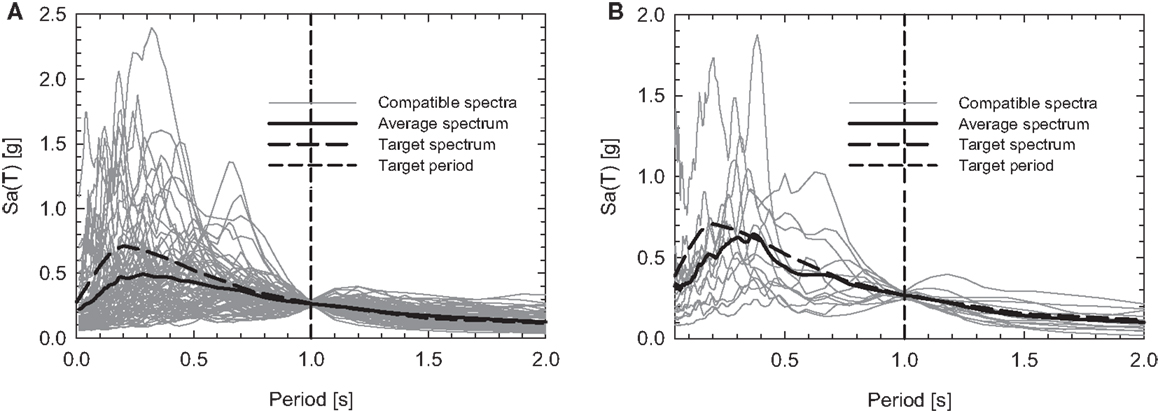
Figure 7. Single period matching with uniform hazard spectrum as target spectrum, for the (A) PEER database and (B) ESMD.
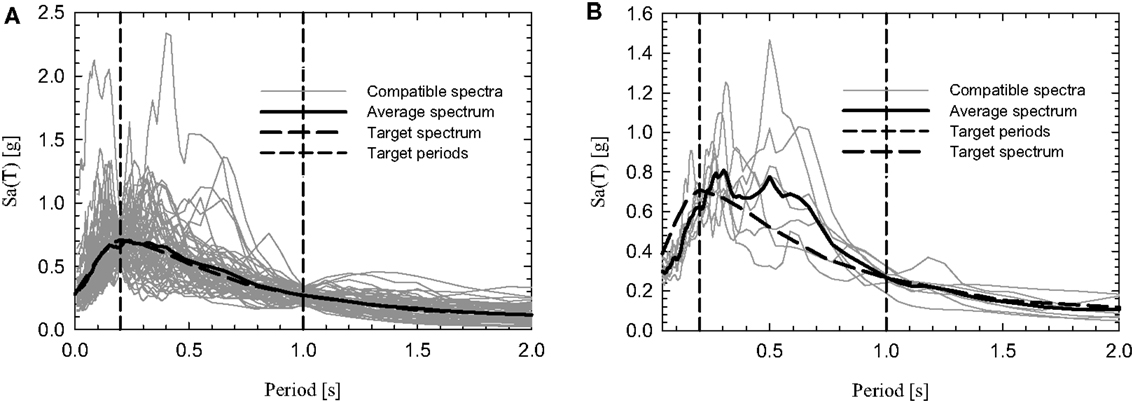
Figure 8. Multi period matching with uniform hazard spectrum as target spectrum, for the (A) PEER database and (B) ESMD.
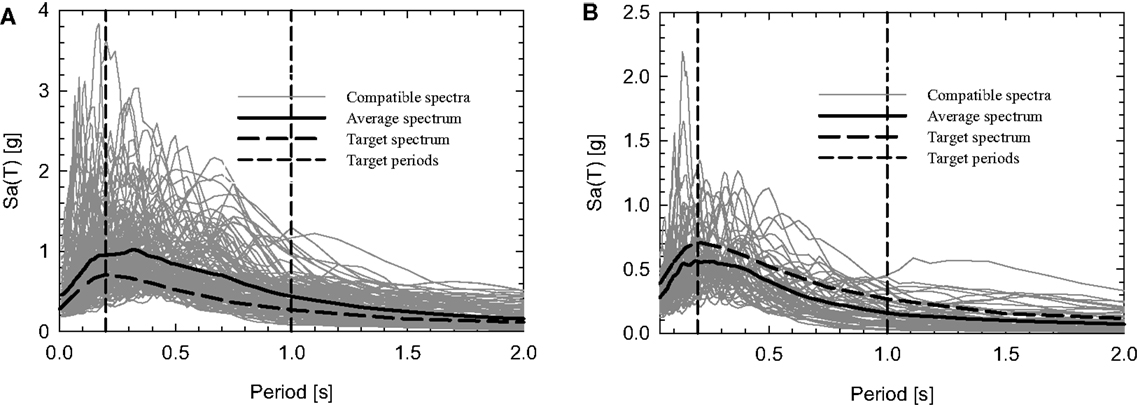
Figure 9. Mean deviation matching with uniform hazard spectrum as target spectrum, for the (A) PEER database and (B) ESMD.
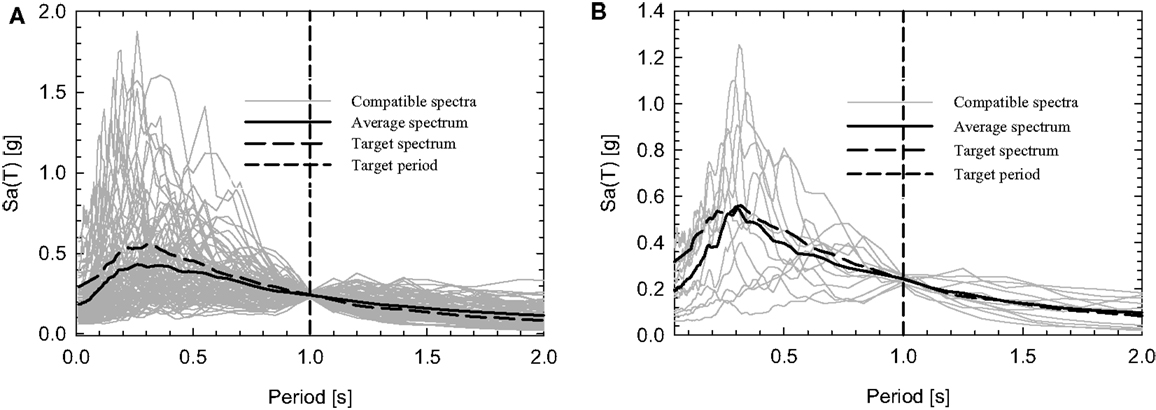
Figure 10. Single period matching with conditional mean spectrum as target spectrum, for the (A) PEER database and (B) ESMD.
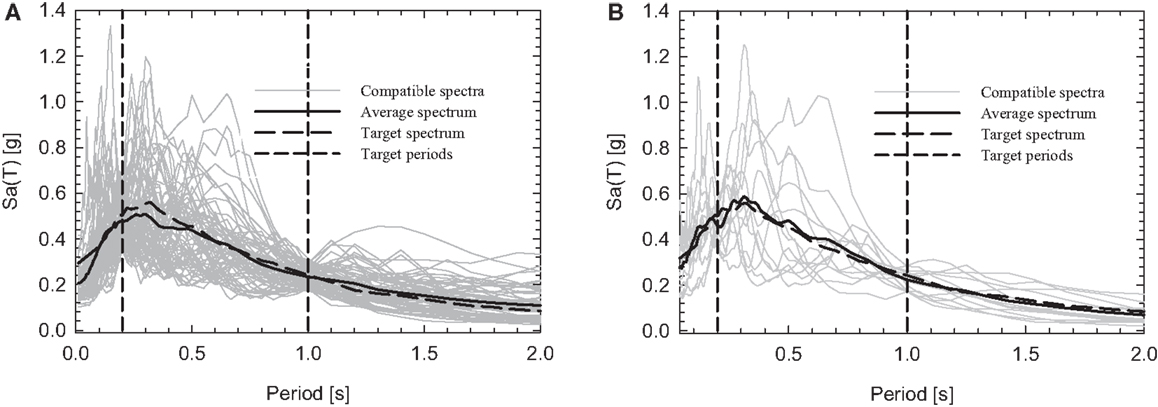
Figure 11. Multi period matching with conditional mean spectrum as target spectrum, for the (A) PEER database and (B) ESMD.
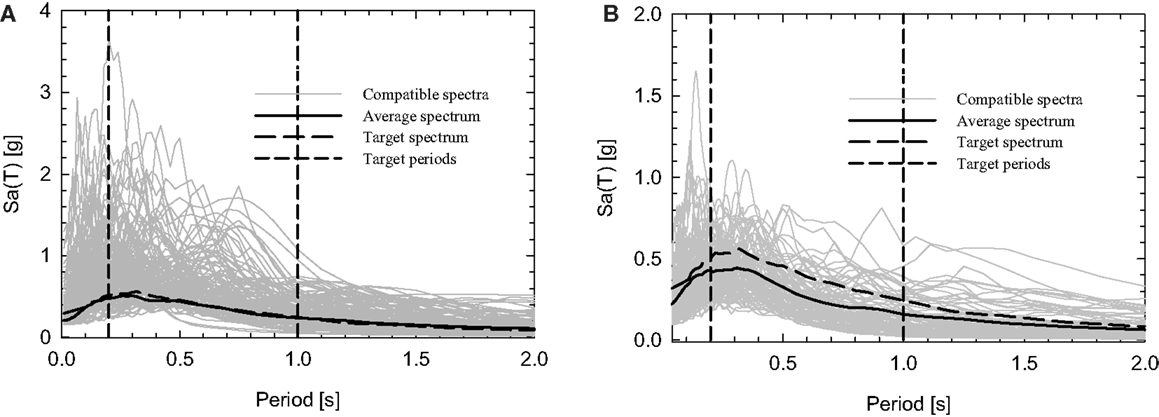
Figure 12. Mean deviation matching with conditional mean spectrum as target spectrum, for the (A) PEER database and (B) ESMD.
In order to show the applicability of the proposed site response analysis method, two different ground motions records, Val Nerina and Friuli earthquake, have been considered (Table 5).
The soil stratigraphy selected for the application is summarized in Table 6 in which layer 1 is closest to the soil surface, while layer 6 is closest to the bedrock.
The accuracy of the numerical solution depends on the number of sub-layers, or rather on the degrees of freedom. Since the generic earthquake half wave length should be described by three to four points at least for each layer, the thickness to be assigned to each layer should not be greater than the ratio between the shear-wave velocity (Vs) and six-height times the predominant seismic frequency (fmax). In order to satisfy this requirement, the entire soil stratigraphy has been divided in equal parts using the following equation
The amplification effect due to the soil stratigraphy is shown in Figure 13 in which the response spectrum on bedrock is compared with the response spectrum on the soil surface, for both Val Nerina (Figure 13A) and Friuli (Figure 13B) earthquake.
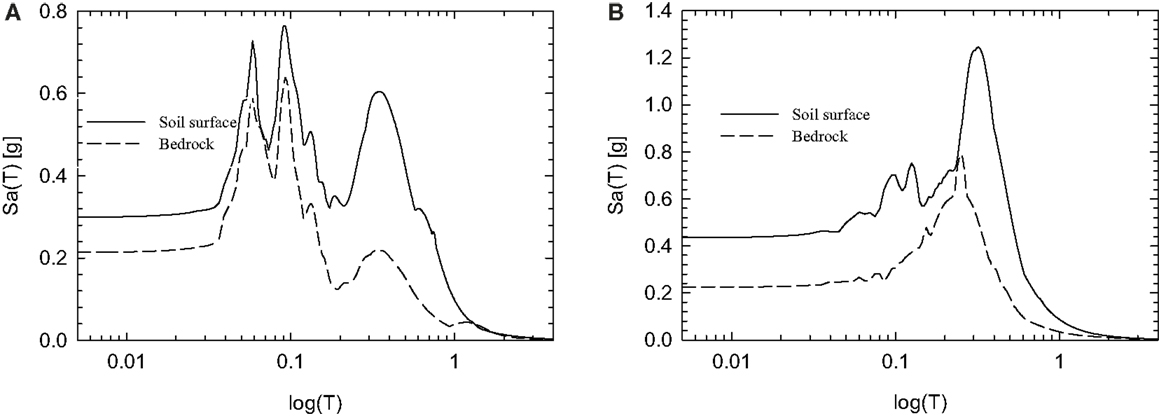
Figure 13. Val Nerina earthquake (A) and Friuli earthquake (B) comparisons between bedrock and soil surface results.
Finally, the results obtained with OPENSIGNAL and EERA are compared in Figure 14 for the same earthquake records.
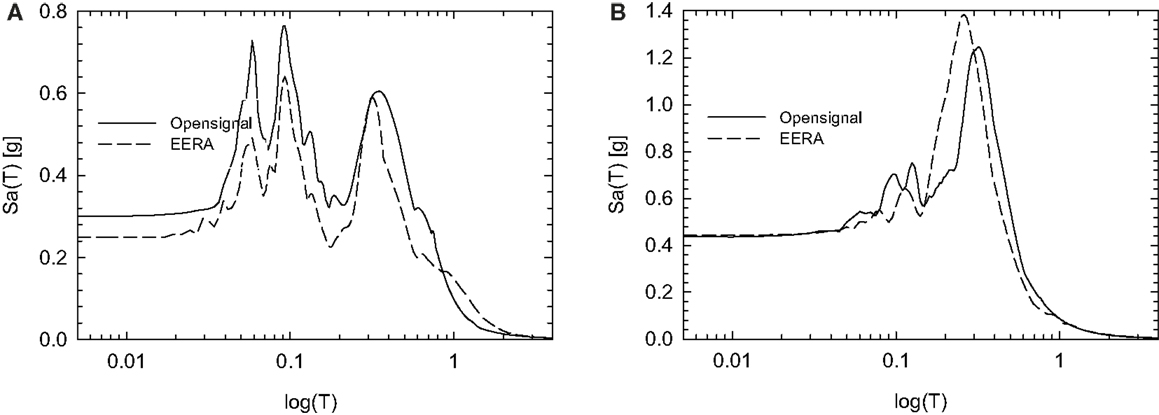
Figure 14. Val Nerina earthquake (A) and Friuli earthquake (B) comparisons between EERA and OPENSIGNAL results.
It is important to mention that the proposed hybrid method for soil response analysis presents some limitations. In fact, it can lead to inaccurate results for high amplitude records, because they produce large shear deformations in the soil column and in the large strain range, it is necessary to consider the real τ − γ curve in order to appreciate the non-linear behavior of the soil. In these cases, therefore, it is better to use specific non-linear site response analysis software (e.g., EERA). In addition, since the proposed method uses the Rayleigh formulation to define the damping at each step, the solution is strictly dependent on the f0/f1 ratio. At this purpose, for high value of the frequency ratio, the Rayleigh damping approach might lead to underestimated damping values, so the final record might be amplified.
The use of ground motion data is growing worldwide due to the increasing availability of records and increased interest from the earthquake engineering community in using non-linear response history analysis in seismic analysis and design. In particular, the selection and processing of earthquake records plays a key role in seismic risk assessment of buildings and structures in general.
The paper presents a new software platform for processing and selection of seismic records, called “OPENSIGNAL,” that are freely available for the general public. The platform consists of a number of modules, integrated in a unified environment and aimed for: selection of ground motion records, signal processing, response spectra analysis, soil spectra analysis, etc.
The main novelties of the platform are (i) the capacity of modeling the local site effects of the ground motion propagation, using a hybrid approach based on an equivalent linear model and (ii) the evaluation of the CMS according to seven different attenuation models, using the geographical coordinates (for Italian sites) or the seismological characteristics (for any site). The platform provides the possibility of using various ground motion record formats (PEER, EMSD, ITACA, and UCHILE), as well as free format records.
OPENSIGNAL allows the automatic reading of the ground motion records from the mentioned databases, reducing the processing time. The possibility to choose the filtering parameters and to modify the time history by scaling, provide the user a useful and flexible tool.
All the above mentioned modules can also work independently other than in sequence allowing more flexibility in the utilization of the software.
The authors declare that the research was conducted in the absence of any commercial or financial relationships that could be construed as a potential conflict of interest.
The research leading to these results has received funding by the European Community’s Seventh Framework Programme – the Marie Curie International Outgoing Fellowship (IOF) Actions-FP7/2007-2013 under the Grant Agreement no. PIOF-GA-2012-329871 of the project IRUSAT – Improving Resilience of Urban Societies through Advanced Technologies.
Akkar, S. (2008). “An introduction to utility software for data processing (USDP),” in 4th BSHAP Project Workshop 16-17 December 2008 (Budva).
Ambraseys, N. N., Simpson, K. A., and Bommer, J. (1996). Prediction of horizontal response spectra in Europe. Earthq. Eng. Struct. Dyn. 25, 371–400. doi:10.1002/(SICI)1096-9845(199604)25:4<401::AID-EQE551>3.0.CO;2-B
Baker, J. W. (2011). Conditional mean spectrum: tool for ground-motion selection. J. Struct. Eng. 137, 322–331. doi:10.1061/(ASCE)ST.1943-541X.0000215
Baker, J. W., and Cornell, C. A. (2006). Spectral shape, epsilon and record selection. Earthq. Eng. Struct. Dyn. 35, 1077–1095. doi:10.1002/eqe.571
Baker, J. W., and Jayaram, N. (2008). Correlation of spectral acceleration values from NGA ground motion models. Earthq. Spectra 24, 299–317.
Barani, S., Spallarossa, D., and Bazzurro, P. (2009). Disaggregation of probabilistic ground-motion hazard in Italy. Bull. Seismol. Soc. Am. 99, 2638–2661. doi:10.1785/0120080348
Bardet, J., Ichii, K., and Lin, C. (2000). EERA: A Computer Program for Equivalent-Linear Earthquake Site Response Analyses of Layered Soil Deposits. Los Angeles, CA: Department of Civil Engineering; University of Southern California.
Boore, D. M. (2009). “TSPP – A Collection of FORTRAN Programs for Processing and Manipulating Time Series.” Reston, VA: U.S. Geological Survey, Open-File, Report 2008-1111, v. 2.0, 52.
Boore, D. M., and Atkinson, G. M. (2008). Ground-motion prediction equations for the average horizontal component of PGA, PGV, and 5%-damped PSA at spectral periods between 0.01 s and 10.0 s. Earthq. Spectra. 24, 99–138. doi:10.1193/1.2830434
Boore, D. M., and Bommer, J. J. (2005). Processing of strong-motion accelerograms: needs, options and consequences. Soil Dyn. Earthq. Eng. 25, 93–115. doi:10.1016/j.soildyn.2004.10.007
Campbell, K. W., and Bozorgnia, Y. (2008). NGA ground motion model for the geometric mean horizontal component of PGA, PGV, PGD and 5% damped linear elastic response spectra for periods ranging from 0.01 to 10 s. Earthq. Spectra. 24, 139–171. doi:10.1193/1.2857546
CEN. (2004). Eurocode 8: Design of Structures for Earthquake Resistance Part 1: General Rules, Seismic Actions and Rules for Buildings. Brussels: European Committee for Standardization.
Chiou, B. S.-J., and Youngs, R. R. (2008). An NGA model for the average horizontal component of peak ground motion and response spectra. Earthq. Spectra. 24, 173–215. doi:10.1193/1.2894832
Cimellaro, G. P. (2013). Correlation in spectral accelerations for earthquakes in Europe. Earthq. Eng. Struct. Dyn. 42, 623–633. doi:10.1002/eqe.2248
Cimellaro, G. P., Reinhorn, A. M., D’Ambrisi, A., and De Stefano, M. (2011). Fragility analysis and seismic record selection. J. Struct. Eng. 137, 379–390. doi:10.1061/(ASCE)ST.1943-541X.0000115
Contreras, V., and Boroschek, R. (2012). “Strong ground motion attenuation relations for Chilean subduction zone interface earthquakes,” in 15 WCEE (Lisbon).
Corigliano, M., Lai, C., Rota, M., and Strobbia, C. (2012). ASCONA: automated selection of compatible natural accelerograms. Earthq. Spectra 28, 965–987. doi:10.1193/1.4000072
FEMA. (2009). NEHRP Recommended Seismic Provisions for New Buildings and Other Structures. Federal Emergency Management Agency (FEMA P-750). Washington, DC: Federal Emergency Management Agency.
FEMA. (2012). FEMA P-58-1: Seismic Performance Assessment of Buildings. Volume 1–Methodology. Washington, DC: Federal Emergency Management Agency.
Hachem, M. (2003). BISPEC Program Description and User’s Manual. Available at: http://www.ce.memphis.edu/7137/PDFs/BispecHelpManual.pdf
Hashash, Y. M. A., and Park, D. (2002). Viscous damping formulation and high frequency motion propagation in non-linear site response analysis. Soil Dyn. Earthq. Eng. 22, 611–624. doi:10.1016/S0267-7261(02)00042-8
Hudson, M., Idriss, M. I., and Beikae, M. (1994). QUAD4M – A Computer Program to Evaluate the Seismic Response of Soil Structures Using Finite Element Procedures and Incorporating a Compliant Base. Davis, CA: Center for Geotechnical Modeling, Department of Civil and Environmental Engineering, University of California; Washington, DC: The National Science Foundation.
Iervolino, I., Galasso, C., and Cosenza, E. (2010). REXEL: computer aided record selection for code-based seismic structural analysis. Bull. Earthq. Eng. 8, 339–362. doi:10.1007/s10518-009-9146-1
Iyengar, R. N., Chadha, R. K., Rao, K. B., and Kanth, S. T. G. R. (2010). “Development of probabilistic seismic hazard map of India,” in The National Disater Management Authority, ed. R. N. Iyengar (New Delhi: Government of India), 86 p.
Jardine, R., Potts, D., Fourie, A., and Burland, J. (1986). Studies of the influence of nonlinear stress-strain characteristics in soil structure interaction. Geotechnique 36, 377–396. doi:10.1680/geot.1986.36.3.377
Katsanos, E. I., and Sextos, A. G. (2013). ISSARS: an integrated software environment for structure-specific earthquake ground motion selection. Adv. Eng. Software 58, 70–85. doi:10.1016/j.advengsoft.2013.01.003
Luzi, L., Hailemikael, S., Bindi, D., Pacor, F., Mele, F., and Sabetta, F. (2008). ITACA (ITalian ACcelerometric Archive): a web portal for the dissemination of Italian strong-motion data. Seismol. Res. Lett. 79, 716–722. doi:10.1785/gssrl.79.5.716
NTC-08. (2008). Nuove Norme Tecniche per le Costruzioni (NTC08) (in Italian). Gazzetta Ufficiale Della Repubblica Italiana. Rome: Consiglio Superiore dei Lavori Pubblici, Ministero delle Infrastrutture, 29.
Keywords: soil response analysis, ground motion selection, spectral matching, filtering, conditional mean spectrum
Citation: Cimellaro GP and Marasco S (2015) A computer-based environment for processing and selection of seismic ground motion records: OPENSIGNAL. Front. Built Environ. 1:17. doi: 10.3389/fbuil.2015.00017
Received: 02 June 2015; Accepted: 08 September 2015;
Published: 28 September 2015
Edited by:
Solomon Tesfamariam, The University of British Columbia, CanadaReviewed by:
Iolanda-Gabriela Craifaleanu, Technical University of Civil Engineering Bucharest, RomaniaCopyright: © 2015 Cimellaro and Marasco. This is an open-access article distributed under the terms of the Creative Commons Attribution License (CC BY). The use, distribution or reproduction in other forums is permitted, provided the original author(s) or licensor are credited and that the original publication in this journal is cited, in accordance with accepted academic practice. No use, distribution or reproduction is permitted which does not comply with these terms.
*Correspondence: Gian Paolo Cimellaro, Department of Civil and Environmental Engineering, University of California Berkeley, Davis Hall, Berkeley, CA 94720-1710, USA,Z2lhbnBhb2xvLmNpbWVsbGFyb0Bwb2xpdG8uaXQ=
Disclaimer: All claims expressed in this article are solely those of the authors and do not necessarily represent those of their affiliated organizations, or those of the publisher, the editors and the reviewers. Any product that may be evaluated in this article or claim that may be made by its manufacturer is not guaranteed or endorsed by the publisher.
Research integrity at Frontiers

Learn more about the work of our research integrity team to safeguard the quality of each article we publish.