 Panayiotis M. Pourpourides
94% of researchers rate our articles as excellent or good
Learn more about the work of our research integrity team to safeguard the quality of each article we publish.
Find out more
ORIGINAL RESEARCH article
Front. Blockchain, 28 March 2025
Sec. Blockchain Economics
Volume 8 - 2025 | https://doi.org/10.3389/fbloc.2025.1550720
We investigate the long-term impact of macroeconomic and financial factors on cryptocurrency metrics using both parametric and non-parametric methods. Our analysis examines how these factors influence cryptocurrency prices, market capitalizations, and Bitcoin’s hash rate. The results establish that two key factors, the US dollar and the price of gold, adversely affect Bitcoin and other cryptocurrency metrics, including the prices and market capitalizations of decentralized finance and layer-one protocols. Bitcoin’s hash rate demonstrates greater market sensitivity than its price, with the dollar having a stronger impact on Bitcoin than gold. The dollar primarily affects Bitcoin’s price, whereas gold mainly influences its hash rate. These findings, along with Bitcoin’s properties, support the view of Bitcoin as a digital asset analogous to physical gold, playing a role similar to a substitute for the latter.
Decentralized digital currencies, known as cryptocurrencies, have revolutionized electronic payments and financial services by leveraging innovative technologies that ensure data permanence and challenge traditional centralized financial systems. These cryptocurrencies, characterized by their secure encryption algorithms, offer accessible and cost-effective alternatives to traditional financial intermediaries, governments, and central banks. Cryptocurrencies operate on distributed ledger technologies (DLTs) -e.g. blockchains-which maintain a chronological record of transactions in a decentralized and tamper-resistant manner. This research delves into the profound long-run interplay between macroeconomic and financial fundamentals and cryptocurrency metrics, focusing specifically on the influential factors impacting cryptocurrency prices, market caps (capitalizations) and Bitcoin (BTC)’s hash rate. The research reveals that the relative strength of the US dollar, as measured by the DXY index, and the price of gold are two key factors negatively affecting the long-term variation of cryptocurrency metrics. Although there is an overall strong positive correlation between the prices of gold and BTC, after accounting for other factors, individual fluctuations in the gold price lead to a negative influence on the price of BTC. This aspect, along with BTC’s fixed supply, network decentralization and security, underscores BTC as a digital store of value, reinforcing the concept that it can also function as a substitute for physical gold. While both gold and BTC respond negatively to a strengthened US dollar, BTC’s reaction is notably stronger. In relation to BTC’s price, its hash rate, reflecting mining activity, exhibits a broader market exposure. The study also demonstrates that while the value of the US dollar and the price of gold consistently drive variations in cryptocurrency prices and BTC’s hash rate, with dominant influence, their impact tends to diminish over time.
Despite the challenging economic landscape, Distributed Ledger Technologies (DLTs) are continuously evolving, serving as a transformative force within the financial services sector. Beyond reshaping the utilization of fiat currencies, DLTs have extended their disruptive influence to encompass traditional financial paradigms and may soon even impact central bank monetary policies. Benigno et al. (2022) theoretically emphasize the complexities of central bank monetary policy, in the presence of single solitary global cryptocurrency. These complexities are anticipated to intensify considerably in a more realistic multi-country setting, which includes multiple global cryptocurrencies. Benigno (2023), further shows that the government has control of the price level only if a privately issued currency is inflationary. It’s crucial to recognize that cryptocurrencies often exhibit either transient inflationary characteristics or, in some instances, a lack of strict inflationary tendencies due to deflationary mechanisms embedded in their code.
A pivotal milestone occurred on 9 June 2021, when the government of El Salvador enacted legislation recognizing BTC as legal tender. This unprecedented move marked the inaugural instance of a country adopting a cryptocurrency in such a manner. Subsequently, in a noteworthy development, the BTC Futures Exchange-Traded Fund (ETF) became the inaugural cryptocurrency ETF to be granted trading approval by the United States Securities and Exchange Commission (SEC), just over a month later. According to the 2022 Statista Global Consumer Survey (Statista, 2022a), encompassing 56 countries across diverse development levels and geographical regions, approximately 18% of respondents reported owning or utilizing cryptocurrencies—an impressive 75% surge from 2019.1 By October 2022, the collective market cap of the cryptocurrency sphere approximated 1 trillion USD, marking a reduction from the all-time high of nearly 3 trillion USD recorded in November 2021 (coinmarketcap.com). To provide context, the combined market cap of domestic firms listed on global stock exchanges reached around 105 trillion USD as of June 2022, growing to 122 trillion USD in 2021 (Statista, 2022b). This disparity underscores the rapid ascent of the cryptocurrency market, with an astounding 309% increase in overall market cap between 2019 and 2022, juxtaposed against a more modest 12.6% growth in the worldwide stock market. Remarkably, the growth span from 2019 to the pinnacle year of 2021 witnessed a staggering 980% expansion in cryptocurrency market cap, compared to the stock market’s 31% growth. As suggested by key surveys such as Bitstamp (2022) and Gemini (2022), perceived regulatory gaps have seemingly curtailed substantial institutional investments and broader adoption within the crypto sector. Critics contend that given the sector’s youthfulness, absence of centralized authority, and presence of smaller centralized entities, periods of economic turmoil make crashes, insolvencies, and bankruptcies an inevitable aspect of the cryptocurrency industry. Notably, the sector has persevered through significant crises, including the collapses of 2016 (MtGox) and 2022 (involving Terra Luna UST, Celcius, Voyager, Three Arrows Capital, FTX, and BlockFi).
In this research we examine a wide array of crypto-related metrics, encompassing the prices and market caps of layer one native coins as well as decentralized finance (DeFi) protocols and BTC’s hash rate. In conjunction with a representative collection of macroeconomic and financial indicators, we aim to foster a more profound empirical comprehension of the interplay between cryptocurrencies and the broader macroeconomic and financial landscape. The investigation encompasses both daily and monthly data frequencies, taking into account significant crypto-specific events. Through this comprehensive analysis, the research extends the existing literature and contributes to the elucidation of the intricate relationship between cryptocurrencies and macroeconomic and financial forces. The long-term relationships are estimated using both parametric (dynamic ordinary least squares) and non-parametric (fully modified ordinary least squares) methodologies. Estimation is augmented by robust standard errors to account for concerns regarding error autocorrelation and heteroskedasticity. The parametric and non-parametric estimates lead to the same conclusions. While all the independent variables demonstrate cointegration, only the price of gold and the value of the US dollar consistently exhibit statistically significant effects on BTC’s price, hash rate, market cap, as well as the prices and market caps of other cryptocurrencies. To be specific, a one percentage point increase (decrease) in the price of gold corresponds to an approximate 3.6 percentage point decrease (increase) in the BTC price. While as a whole there is a high positive correlation between the prices of gold and BTC, after controlling for various other factors, variations in the price of gold cause a robust negative effect on the price of BTC. This specific aspect, coupled with BTC’s fixed supply, proof of work (PoW) security, and decentralized network, underscores its position as a digital store of value, further bolstering the idea that it can function as a credible alternative to physical gold.2 Investors substitute one asset for the other rather than merely seeing them move in tandem. The impact of the US dollar’s value, as assessed by the DXY index, has a notably stronger and more pronounced adverse influence—ranging from 21 to 27 times greater—on the price of BTC compared to the effect of the price of gold. Additionally, the negative impact of the DXY index on the price of gold is significantly smaller when compared with its influence on the price of BTC.
The estimates suggest that the hash rate of BTC, which reflects the mining activity on the BTC blockchain, exhibits a greater degree of general market exposure in comparison to the BTC price. Not only is the negative impact of the gold price on the hash rate estimated to be notably more substantial than its effect on its own price, but the hash rate is also positively influenced by fluctuations in the Federal Funds Rate and S&P 500, in contrast to the BTC price. This indicates that during a tighter Federal Reserve monetary policy, miners reduce BTC network activities. One reason could be their perception of tightened policy affirming high inflation and a move to safer assets, potentially lowering BTC’s price. Moreover, a tighter monetary approach might signal increased energy costs to miners. While the S&P 500 is found to positively impact Bitcoin’s price, mainly in daily frequencies, it yields the opposite effect on the hash rate. The latter effect might stem from miners’ responsiveness to market dynamics. A thriving S&P 500 could lure attention and resources from BTC mining as miners chase potentially better returns elsewhere. Additional analyses indicate that price indices and market caps of two prominent DeFi protocols, namely Maker and Synthetix, display comparable patterns to BTC in response to the price of gold and the DXY index. Nevertheless, the impacts are somewhat less robust, as seen in instances such as the DXY index’s influence on price and gold’s effect on market cap. This could potentially be attributed to the constraints of limited time series data. Finally, we compute metrics of the daily contribution of the price of gold and the DXY index as well as their joint contribution in explaining the variation of the price and hash rate of BTC. These metrics affirm the significant contributions of both DXY and the price of gold to the decline in BTC’s price and hash rate. Notably, DXY predominantly affects the price reduction, while the price of gold primarily drives the hash rate decrease. This study indicates that although these factors explain a significant portion of BTC’s price and hash rate decline, their impact gradually diminishes.
While the literature addressing cryptocurrencies within the context of monetary theory and finance is relatively recent, it is continuously evolving. Theoretical efforts are predominantly centered on BTC and the proof-of-work (PoW) consensus mechanism. Notably, Garratt and Wallace (2018), Schilling and Uhlig (2019), Fernández-Villaverde and Sanches (2019), Cong et al. (2021), Pagnotta (2022), and Biais et al. (2023) illustrate the emergence of multiple equilibria (i.e., indeterminacy) when BTC is introduced into otherwise conventional monetary models.3 Benigno et al. (2022) and Benigno (2023) further emphasize the complexities of monetary policy in the presence of cryptocurrencies.
The empirical research examining the link between crypto and the macroeconomy has been relatively overlooked by the academic literature. An early work by Ciaian et al. (2016) uses an extended Barro (1979) type framework to derive an empirically estimable model of the BTC price. While they find that BTC specific characteristics such as the number of transactions, the number of addresses and views of Wikipedia drive the price at a daily frequency, they find little evidence that macroeconomic and financial factors such as Dow Jones, exchange rates and oil prices have an impact on the BTC price. Similar results are shown by Syafiqah and Basah (2021) using monthly data while Benigno and Rosa (2023) find that BTC is unresponsive to macroeconomic news, using a specific methodology and a small sample of high frequency data. Syafiqah and Basah (2021) however report evidence of cointegration between macroeconomic indicators and the price of XMR of the Monero blockchain. Lee and Rhee (2022) estimate a VECM using monthly data and find long-term relationships between BTC and macro indicators such as S&P 500, VIX, the 10-year treasury yield, CPI, the gold price and the dollar index. Carrick (2016) suggests that BTC complements other currencies, particularly those of emerging economies. Corelli (2018) not only finds a substantial connection between BTC and currencies of emerging economies but also establishes a relationship between the latter and five other high-market-cap cryptocurrencies. His findings further highlight the weaker links of cryptocurrencies and currencies of developed economies.4 The empirical finding of the link between crypto and currencies of emerging economies is justified by evidence reported in the Gemini (2022) survey which suggests that investors consider crypto as a good hedge against currency devaluations, especially in countries that experienced 50% or more devaluation of their currency against the USD over the last 10 years.
In this study, we refrain from analyzing the reaction to methodology-dependent macroeconomic news. Additionally, given the focus on the US economy using US indicators, and considering that most cryptocurrency transactions are tied to the US dollar as a primary benchmark, we choose not to include exchange rates from various countries. Instead, I focus on the impact of the relative value of the US dollar, as measured by the DXY index. The subsequent sections of this paper are structured as follows. Section 2 offers a concise historical review, tracing the technical evolution of cryptocurrencies. Section 3 encompasses the empirical analysis, including data description, analysis, estimation of long-run relationships, and illustration of dynamic effects. Finally, Section 4 provides the concluding remarks.
The evolution of cryptocurrencies is closely interwoven with technological progress, particularly the groundbreaking concept of blockchain. This section delves into the key milestones that have shaped the technical landscape of cryptocurrencies, offering insights into their genesis, development, and the emergence of blockchain as a foundational building block. By understanding the foundational elements of cryptocurrencies, we can make more informed connections between their technical evolution and their interactions with broader economic factors and the subsequent analysis of the interplay between cryptocurrencies and macroeconomic indicators.
Haber and Stornetta (1991) tackled the challenge of verifying the creation and modification times of a digital document. The proposed time-stamping approach guarantees prevention against retroactively or proactively altering sequentially occurring data, even when involving collusion with a time-stamping service. While the term “blockchain” is not explicitly referenced, this marks the initial introduction of a concept similar to a “blockchain”. Szabo (1996) pioneered the formalization of “smart contracts” as digitally specified commitments, encompassing protocols governing their fulfilment. These contracts proved revolutionary, facilitating secure and efficient execution of diverse financial transactions. Szabo (1998) introduced “bit gold”, a digital currency concept leveraging computational power costs within a decentralized framework. This involves generating bits via solving fluctuating computational equations, akin to the PoW consensus mechanism—initially proposed by Dwork and Naor (1992) to combat email spam. Szabo aimed to establish a secure, decentralized digital asset, minimizing reliance on central authorities. Decentralization resolves the trust issue in valuing money through third parties. Despite well-documented bit gold methodology, implementation never occurred. Subsequently, Konst (2000) proposed block theory, interlinking secure blocks, and employing cryptography to trace entry authenticity back to the origin.
In 2008, an individual or group using the alias Satoshi Nakamoto released a paper titled “Bitcoin: A Peer-to-Peer Electronic Cash System” (Nakamoto, 2008), marking the inception of the first cryptocurrency.5 The paper merged concepts from prior research to propose a decentralized, distributed time-stamp system that generates computational evidence for transaction chronology. It introduced a network of validating computers (nodes) operating without a central authority, employing a PoW consensus mechanism. The total supply of BTC is capped at 21 million units, ensuring no more will ever exist.6 Nakamoto’s paper outlines BTC’s creation to address costly third-party mediation in transactions. The initial BTC block, termed the genesis block (or block 0), was mined on 3 January 2009, sparking a financial revolution. BTC’s invention marked the inception of a decentralized money market and an alternative to inflationary fiat currencies, aiming to serve as a long-term inflation hedge. Athey et al. (2016) find BTC’s main usage as an investment, consistent with Glaser et al.’s (2014) results. In the short term, BTC acts as a “risk-on” speculative asset, though the prevailing perception positions it primarily as a store of value, akin to physical gold despite differing properties. The findings presented in this study align with this perspective.
BTC possesses significant limitations. Firstly, despite adhering to key smart contract design principles outlined by Szabo (1996) and being a smart contracting platform, its scripting language presently does not support DApps (decentralized applications).7 Secondly, while the PoW consensus mechanism ensures robust security, it results in significant resource wastage, with only a single miner being rewarded per block despite numerous miners expending resources to mine it. Moreover, scalability remains an issue; the BTC network struggles to handle substantial transaction volumes swiftly. Ethereum, an open-source blockchain introduced in July 2015 (Buterin, 2014), addressed the lack of DApps by incorporating smart contract functionality. Many distributed ledger technologies tackle resource wastage by employing proof of stake (PoS) consensus mechanisms for transaction validation or alternative approaches like efficient PoW. Ethereum, the second-largest blockchain by market cap, initially operated on a PoW consensus until 15 September 2022, when it transitioned to PoS through the ‘Merge’.8 Despite adopting the PoS model, the Ethereum blockchain still faces challenges related to scalability and high transaction costs. These constraints have triggered substantial growth within the blockchain industry, propelling initiatives to counter them through the implementation of Layer 2 (L2) protocols and the creation of new blockchains.9 Presently, over 1,000 blockchains or, more generally, DLTs exist, with around 20,000 cryptocurrencies built atop them. Developers continually aim to enhance three primary attributes: decentralization, scalability, and security, collectively referred to as the ‘Blockchain Trilemma’. This term arises due to the common trade-off between these attributes; for instance, heightened decentralization might sacrifice scalability, while prioritizing scalability could compromise security. Beyond addressing the blockchain trilemma, where some blockchains assert partial solutions, a prevailing trend is interoperability—constructing infrastructure that facilitates active communication between diverse blockchain protocols.
To estimate the long-run relationship between cryptocurrencies and macroeconomic and financial indicators, we assess various cryptocurrency measures across different samples and frequencies. The central hypothesis examines whether and to what extent crypto metrics are influenced by major macroeconomic and financial variables.
The effects on cryptocurrencies are measured via the construction of crypto indicators using closing prices and market caps of major coins as well as the hash rate of BTC.10 Apart from BTC, we collect and utilize price data for the following altcoins: ETH, Litecoin (LTC), BNB, XRP, DOGE, ADA, Maker (MKR), AAVE, UniSwap (UNI), Curve (CRV), PancakeSwap (CAKE), Synthetix (SNX), SushiSwap (SUSHI), Compound (COMP), Balancer (BAL), Yearn. finance (YFI) and the stablecoin USDT. The sample starting dates of each coin vary depending on data availability which implies that the sample periods of each indicator and thus the various indicator samples considered in estimation will vary. The reasoning behind the choice of the specific cryptocurrencies is the high market cap ranking in combination with the length of the available time series. Specifically, we consider the price of BTC
Apart from BTC indicators, we consider two more sets of price and market cap indicators, one for layer-one native coins that incorporates DOGE and USDT, and another for DeFi protocols. Specifically,
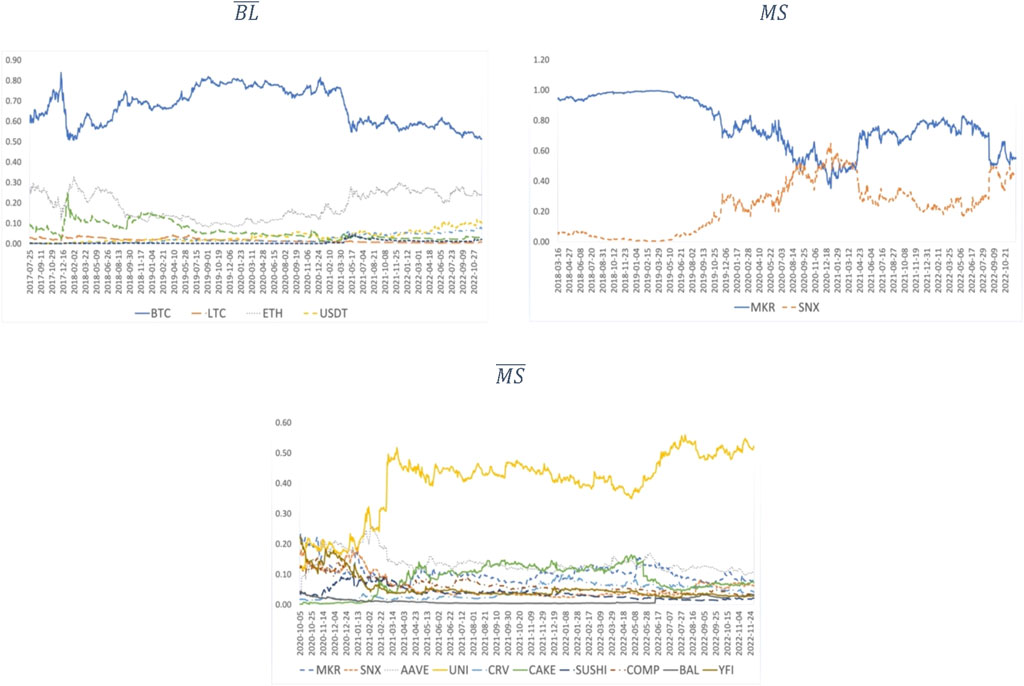
Figure 1. Market cap shares for
Figure 2, displays the time series of crypto prices and corresponding market caps. The figure shows that crypto prices as well as market caps exhibit a positive correlation. Table 1 gives a better insight into correlations by displaying the Pearson correlation coefficient between the crypro variables, expressed in logarithms, in two different ways using daily data. The upper triangular of the table exhibits cross correlations which are computed using complete samples, while the lower triangular exhibits the mean of rolling correlations (10-day window) along with standard deviations in parentheses. While the complete sample correlations is a good indicator of the relationship of two variables, it may also lead to cases with biased outcomes under certain conditions.14 The mean of rolling correlations with a 10-day window, along with the corresponding standard deviations, offers a more robust and nuanced approach. The rolling correlation methodology, captures the dynamic nature of the relationship between the variables over time and address aforementioned issues. The complete sample correlations suggest that, apart from the hash rate in a few cases, there is a strong positive co-movement between the variables. The rolling correlations indicate however that in most cases the correlations are not only significantly lower than those of complete samples but also very volatile. The fact that correlations reduce when one considers a rolling window is an indication that complete sample correlations are substantially driven by large swings due to systemic evens that move most variables in the same direction. In the estimation the latter is taken into consideration as we control for major crypto-specific events which generate large swings to crypro prices with no effects on financial markets and macroeconomic variables. Exceptions are the correlations of the following pairs which preserve a correlation of at least 0.96 under both complete and rolling samples, with a low standard deviation for the latter: (
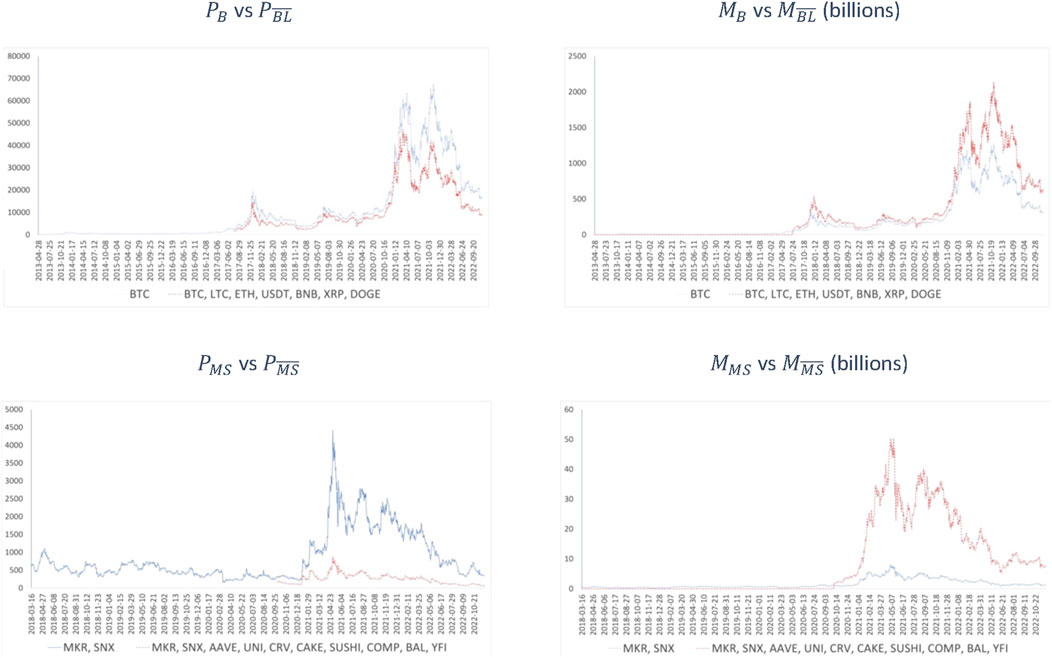
Figure 2. Prices and market caps of the crypto indicators.
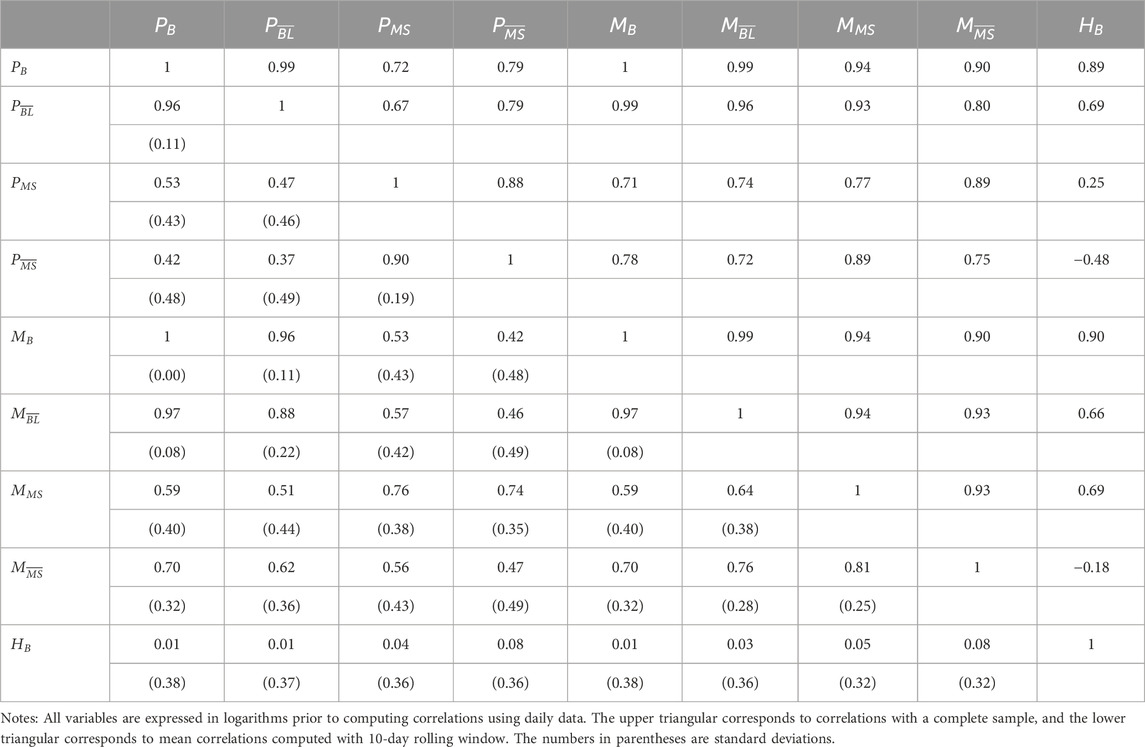
Table 1. Correlations of crypto variables.
An intriguing case is the hash rate of BTC. While
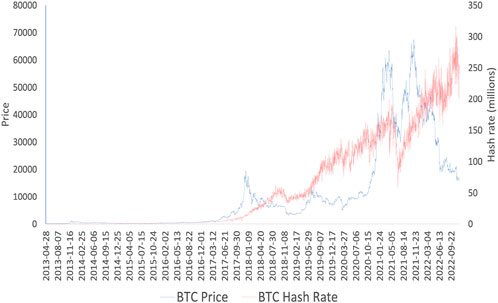
Figure 3. The price of BTC vs. its hash rate.
To evaluate the degree of interaction of crypto with macroeconomic and financial variables, we deploy a list of selected indicators. At daily frequencies, the latter consists of the S&P 500 (SP500) index, the DXY index, the price of gold (GOLD) and the federal funds effective rate (FFR).15 For convenience, we represent the set of macroeconomic and financial indicators as
At the monthly frequency, we are keeping the same indicators, despite the fact that there is available data for
The present study aims to investigate potential long-term associations between cryptocurrency variables and macroeconomic and financial indicators. To ensure an appropriate statistical specification of the model, we begin by assessing the order of integration of the variables through unit root tests. Based on the results of these tests, we proceed by presenting estimates of the long run relationship, if any, using the dynamic ordinary least squares (D-OLS) parametric approach of Stock and Watson (1993) and the fully modified ordinary least squares (FM-OLS) non-parametric approach of Phillips and Hansen (1990).
Supplementary Tables S2A, S3A display various cases of stationarity tests for the daily and the monthly data series, respectively by employing the Augmented Dickey-Fuller (ADF), the Phillips-Perron (PP) and the Kwiatkowski-Phillips-Schmidt-Shin (KPSS) unit root tests. In the cases where the tests give conflicting results, we give more weight to the PP test over the ADF test, as the former accounts for serial correlation or heteroscedasticity while being more robust in the presence of structural breaks (case of FFR at monthly frequencies). The tests provide adequate evidence both at daily and monthly frequencies that the series
Having established the order of integration of the series, we next turn to testing for long-run relationships using robust standard errors which address problems of error autocorrelation and heteroskedasticity.18 Specifically, a model is employed in which the dependent variable is represented by one of the following variables:
To estimate the long-run relationship between the cryptocurrency variables and
Based on the results from the Johansen test, which provide clearer evidence of cointegration at the monthly frequencies, greater emphasis will be placed on these results over those from the daily frequencies, although the estimates do not differ significantly. Table 2 presents the estimation results for the price and hash rate of BTC using the D-OLS and FM-OLS methodologies at both daily and monthly frequencies. The findings reveal that
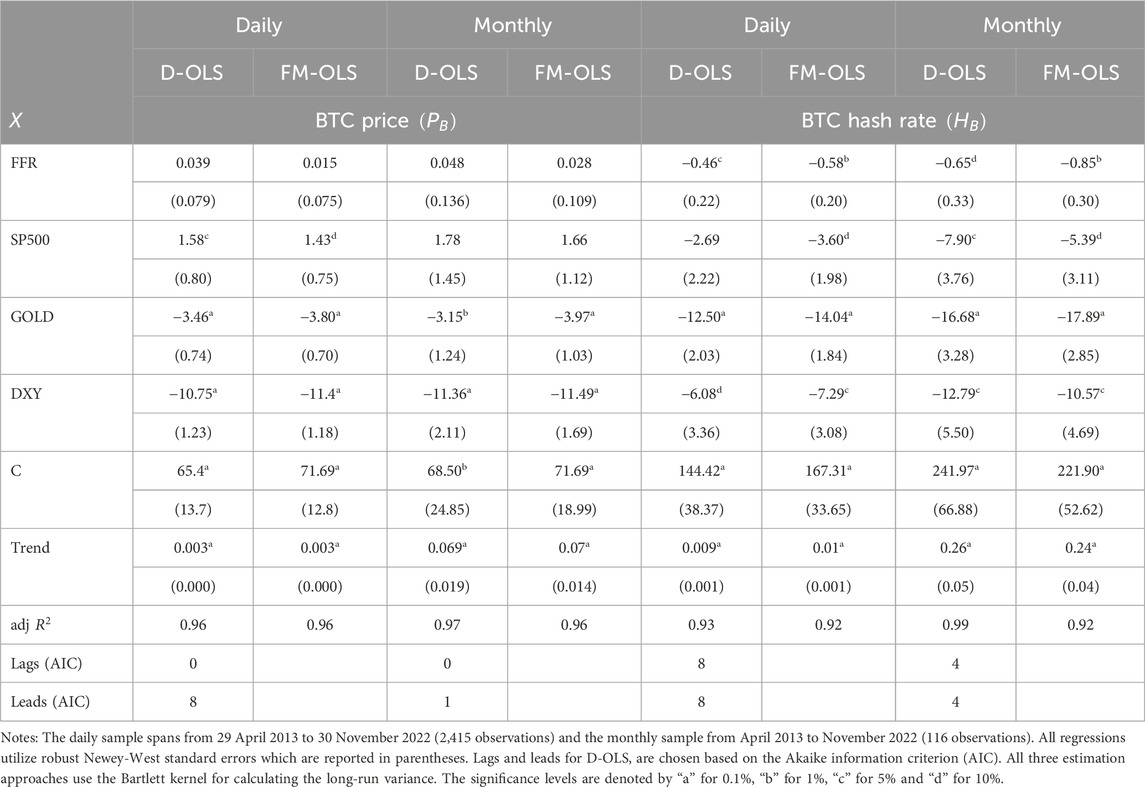
Table 2. The long-run relationships of

Table 3. The long-run relationship of
In addition to the price of gold, the price of BTC is influenced, similar to gold, by the value of the US dollar, as measured by the
The estimates align with key financial theories, particularly asset pricing models that explore how macroeconomic factors influence asset values. Specifically, the findings resonate with the Consumption-based Asset Pricing Model (C-CAPM) and the Arbitrage Pricing Theory (APT), both of which suggest that asset prices are shaped by systematic risk factors such as macroeconomic variables. The strong negative influence of the
The hash rate of BTC, which indicates the mining activity on the BTC blockchain, demonstrates a higher level of market exposure compared to the BTC price. The impact of the gold price on the hash rate is estimated to be significantly higher than its effect on the price itself, with a range of 4.5–5.29 (3.61–3.69) times greater at monthly (daily) frequencies. Specifically, a one-percentage-point increase in the price of gold corresponds to an approximately 17.3 (13.3) percent decrease in the hash rate on a monthly (daily) basis. The impact of the DXY index on the hash rate is comparable to its effect on the price. A one-percentage-point rise in the DXY index leads to a 10.57–12.79 (6.08–7.29) percent decline in the hash rate at monthly (daily) frequencies. In contrast to the BTC price, the hash rate appears to also be influenced by the FFR and S&P 500. An increase of one percent in the FFR is associated with a decline in the hash rate of BTC by approximately 0.65–0.85 (0.46–0.58) percent on a monthly (daily) basis. This suggests that when the Federal Reserve implements a tighter monetary policy, miners tend to reduce their mining activities on the BTC network. One possible explanation is that miners perceive a tightened monetary policy as a confirmation of high inflation and an investor shift towards less risky assets, resulting in a decrease in the price of BTC Additionally, a tighter monetary policy may be seen by miners as confirmation of elevated energy prices, leading to higher mining costs. Interestingly, while the S&P 500 exhibits a positive effect on the price of BTC, particularly at daily frequencies, it has the opposite effect on the hash rate. However, it is important to note that this result is statistically significant at the 10% level on a daily basis, where noise is higher, and between the 5% and 10% levels on a monthly basis, where noise is somewhat smoothed out. The positive influence of the stock market on the BTC price could be attributed to the perception that a bullish stock market environment signals overall economic growth and positive investor sentiment, leading to increased demand and higher prices for BTC. On the other hand, the negative impact of the S&P 500 on the BTC hash rate may be due to miners’ reactions to market dynamics. Miners are primarily concerned with the profitability of their operations, which relies on various factors such as the cost of energy, mining difficulty, and block rewards. It is plausible that a rising S&P 500 indicates a flourishing traditional market, diverting attention and resources away from BTC mining as miners opt for potentially higher returns in other investment avenues. Consequently, the BTC hash rate experiences a decline as miners shift their focus and resources, leading to a negative correlation with the S&P 500. However, further research is needed to delve deeper into the complex interplay between stock market indices, BTC prices, and mining activities to gain a comprehensive understanding of this phenomenon.
Figure 4, displays the logarithm of the price (on the left) and hash rate (on the right) of BTC versus the fitted values of the long-run component estimated using D-OLS and FM-OLS. The figure indicates that the estimated long-run components effectively capture the trends in both BTC’s price and hash rate. It is worth emphasizing that the relationship between the price of BTC and halving dates has been a subject of debate.19 Although only three halvings have occurred thus far, a similar pattern has been observed in the BTC price around each event. The price of BTC typically initiates an upward trend shortly before the halving, which gains momentum after the halving, ultimately reaching a peak 12 to 18 months later. However, it is important to note that there have been instances of upward trends in stock prices during the periods surrounding the three BTC halvings, which do not appear to be directly related to the halvings themselves. It is possible that the coinciding upward trends during the halvings were influenced by favorable macroeconomic and financial conditions, as well as increased liquidity in the market. Considering this perspective, it is plausible that the cycles in BTC prices may align more closely with liquidity cycles rather than halving cycles themselves. The notion that halvings amplify the perception of scarcity for BTC might have merely reinforced the more pronounced surges in Bitcoin’s value during liquidity cycles, rather than serving as the primary driver behind them. Given the limited evidence for halving effects and the common pattern observed in crypto and stock prices around the halving period, the empirical analysis has deliberately avoided imposing any specific controls for halving cycles or effects. Introducing such controls could introduce biases into the results, potentially distorting the relationship between crypto prices and other variables.
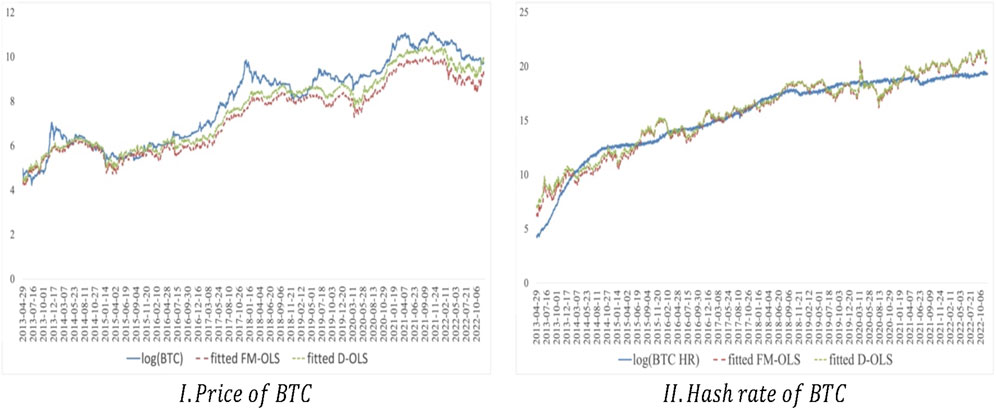
Figure 4. The logarithm of the price (I) and hash rate (II) of BTC vs. their long term component, estimated by D-OLS and FM-OLS.
Since the price indicator
Given that the evidence for cointegration from Johansen’s tests is clearer in the monthly data, we use the regression analysis of
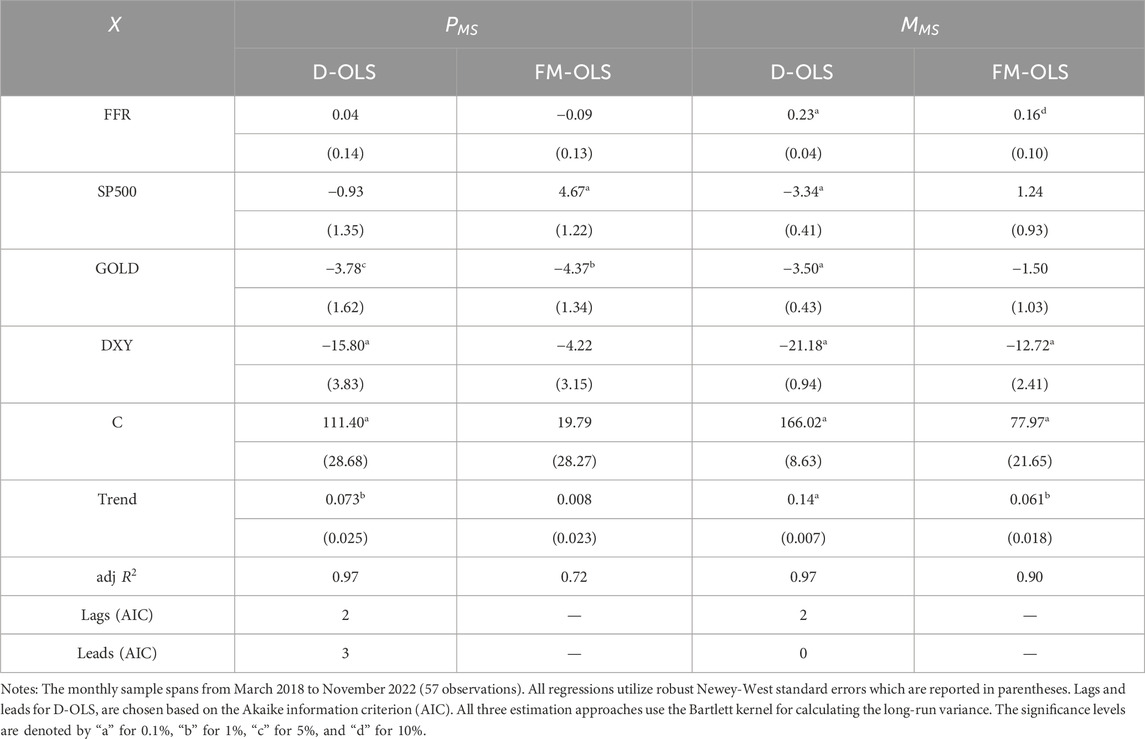
Table 4. Estimation of the long-run relationships of
The relationship between the market capitalization of the
For completeness, we also provide estimates using the Autoregressive Distributed Lag (ARDL) model for the daily sample, as this method combines both short-run and long-run dynamics. It should be noted, however, that while ARDL is well-suited for handling mixed-order integration—which is not a major concern in our sample—and capturing short-run dynamics, unlike D-OLS and FM-OLS, it does not inherently allow for the incorporation of robust standard errors, which may affect inference in the presence of autocorrelation and heteroskedasticity. ARDL long-run estimates are included in Supplementary Table A7 of the Supplementary Appendix as a robustness check, acknowledging its advantages in modeling short-run adjustments in the daily data. As can be seen, the main results on BTC remain intact, with gold and
Thus far, we have established the statistical significance of the price of gold and the
where
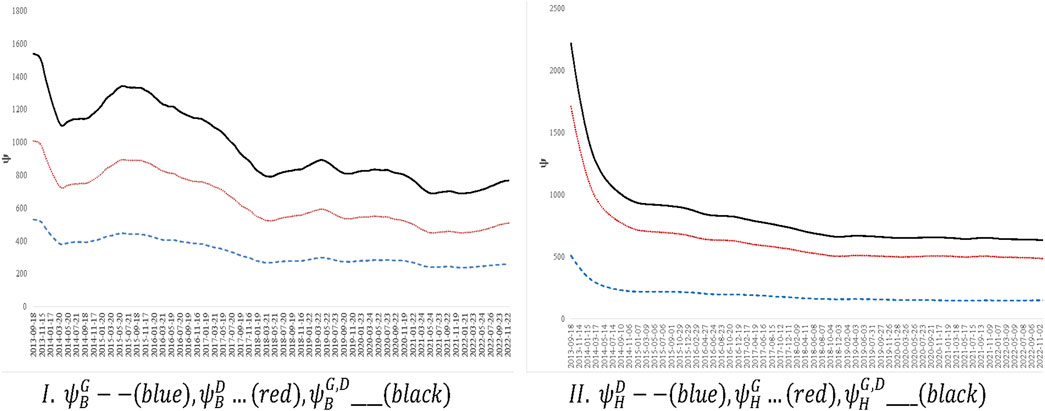
Figure 5. Percentage shifts of
The initial observation drawn from Figure 5 is that the
The second observation drawn from the figure is the fact that the contribution of both factors to the variation in the BTC price and hash rate between the beginning and end of the sample decreases substantially. At the beginning of the sample,
In summary, both
In this research, we delved into the long-term impacts of macroeconomic and financial fundamentals on cryptocurrency metrics such as prices, market caps, and the hash rate of Bitcoin. The fact that the prices and market caps of most cryptocurrencies exhibit a robust correlation with the price of BTC, allows us to effectively narrow our focus on a small set of cryptocurrencies. To assess the long-run relationship of the latter with macroeconomic and financial fundamentals, we rely on indicators such as the price of gold, the relative value of the US dollar as gauged by the DXY index, the S&P 500 index, and the federal funds rate. The long-term relationships are estimated employing both parametric (D-OLS) and non-parametric (FM-OLS) methods, yielding comparable results. Despite a high and positive Pearson correlation coefficient between BTC and gold prices, both the gold price and the DXY index consistently exhibit statistically significant adverse effects on BTC prices when accounting for other factors. These effects extend not only to the price and market cap of BTC, but also to the prices and market caps of other cryptocurrencies, and even the hash rate of BTC. The empirical evidence, combined with BTC’s fixed supply, network security, and decentralization, further strengthens the notion of BTC as a digital alternative to gold—a store of value. However, disparities between gold and BTC interactions with the federal funds rate and the S&P 500 were observed. Moreover, BTC’s response to the US dollar’s value is notably amplified compared to gold. It is also noteworthy that the hash rate of Bitcoin is more sensitive to market dynamics compared to the price of BTC. The empirical evidence further suggests that fluctuations in the value of the US dollar primarily influence the price of BTC, whereas fluctuations in the price of gold predominantly impact the hash rate of BTC. Nevertheless, the influence of these two factors as contributors to BTC metric variations tends to wane over time. In conclusion, this study unveils the intricate interplay between the price of gold and the relative value of the US dollar with cryptocurrency metrics, especially the price and hash rate of BTC. The findings illuminate Bitcoin’s distinct status in the financial landscape, solidifying its reputation as a digital counterpart to a traditional store-of-value asset such as gold. Looking at the bigger picture, the findings suggest that cryptocurrencies, especially Bitcoin, are becoming more intertwined with the traditional financial system. As these digital assets show stronger links to key macroeconomic factors like gold and the US dollar, it is clear that policymakers will need to rethink their approach to financial stability, inflation management, and monetary policy. A deeper understanding of these relationships could play a crucial role in shaping future regulations that balance the risks and opportunities of the growing digital economy.
Publicly available datasets were analyzed in this study. This data can be found here: https://coinmarketcap.com.
PP: Conceptualization, Data curation, Formal Analysis, Funding acquisition, Investigation, Methodology, Project administration, Resources, Software, Supervision, Validation, Visualization, Writing–original draft, Writing–review and editing.
The author(s) declare that financial support was received for the research and/or publication of this article.
The author declares that the research was conducted in the absence of any commercial or financial relationships that could be construed as a potential conflict of interest.
The author declare that no Generative AI was used in the creation of this manuscript.
All claims expressed in this article are solely those of the authors and do not necessarily represent those of their affiliated organizations, or those of the publisher, the editors and the reviewers. Any product that may be evaluated in this article, or claim that may be made by its manufacturer, is not guaranteed or endorsed by the publisher.
The Supplementary Material for this article can be found online at: https://www.frontiersin.org/articles/10.3389/fbloc.2025.1550720/full#supplementary-material
1Notably, ownership or usage rates in 2022 for countries such as Nigeria and Thailand stood at 45% and 44% respectively, while in countries like Australia and the United States, they reached 18% and 16% respectively.
2A blockchain validates transactions through nodes, which are essentially individual computers or devices that comprise the blockchain network. These nodes collaborate to verify and record new transactions on the blockchain. In a Proof of Work (PoW) consensus mechanism, miners compete against each other to process transactions on the network by solving a mathematical puzzle, for which they are rewarded. The node that successfully solves the puzzle adds the next block to the chain and receives new currency units. PoW serves as a highly secure consensus mechanism that progressively increases the network’s difficulty over time, ultimately making it exceptionally resistant to hacking attempts.
3Garratt and Wallace (2018) highlight the significance of self-fulfilling beliefs about BTC, Schilling and Uhlig (2019) explore the evolution of BTC’s price and monetary policy, Fernández-Villaverde and Sanches (2019) emphasize currency competition, Cong et al. (2021) focus on the role of mining pools for miner risk sharing, Pagnotta (2022) emphasizes the security of blockchain technology, and Biais et al. (2023) underscore the role of sunspots in prices within a general equilibrium model.
4Almansour et al. (2020) finds a weak connection only between BTC and the USD/GBP exchange rate but no significant links between BTC and exchange rates of other developed economies.
5As of now, Satoshi Nakamoto’s true identity remains undisclosed.
6BTC has a hard cap of 21 million coins, with a circulating supply of approximately 19.21 million as of November 2022. Coin release occurs gradually, halving the mining reward every 4 years. The initial 2009 reward was 50 BTC per block, valued around 850K USD at current prices (November 2022). BTC minting is projected to cease by 2,140, with miners subsequently receiving transaction fees.
7In addition to the native coin of a distributed ledger technology (DLT), tokens can function as payment methods for DApps built on the DLT. Prominent examples of DApps include DeFi protocols.
8In PoS, node owners validate blocks by staking their coins, such as ETH in this case, and receive rewards in return. As of May 2022, stateofthedapps.com reports nearly 3,000 DApps developed on the Ethereum blockchain (out of a total of 4,073 DApps across all blockchains), positioning it as the second-largest blockchain after BTC.
9L2 protocols operate atop parent blockchains or layer one (L1) blockchains (e.g., Ethereum and Bitcoin) with the goal of enhancing scalability and reducing transaction fees.
10The market cap of a cryptocurrency is defined as the product of a coin’s circulating supply and its closing price.
11Although the latter is also true for LTC, being one of the oldest cryptocurrencies while preserving its position among those with the highest market cap, we do not consider it separately or in a two-coin indicator with BTC because its market cap share relative to that of BTC is tiny; on average less than 3%.
12The hash rate increase between November 2022 and November 2021 was 70%.
13Between period July 2017 and November 2022,
14These cases encompass situations where there are nonlinear relationships between the variables, a few outliers that heavily influence the correlation result, and subgroups within the data that exhibit different correlation patterns.
15DXY measures the value of the US dollar versus a basket of six global currencies, the Euro, the UK Pound, the Canadian Dollar, the Japanese Yen, the Swedish Kroner and the Swiss Franc. GOLD corresponds to the price of gold per troy ounce. The data source for S&P 500 and FFR, is the Federal Reserve Economic Data (FRED) of the Federal Reserve Bank of St Louis. The data sources for GOLD and DXY are gold.org and marketwatch.com, respectively.
16The correlation coefficient between CPI and
17Firstly, seasonal adjustment (SA) is typically less applicable to high-frequency data. Secondly, SA often necessitates a substantial historical dataset for accurately identifying seasonal patterns, a condition not met in the relatively recent cryptocurrency market. Thirdly, SA assumes that seasonal patterns remain relatively stable over time, which may be less likely in the highly volatile cryptocurrency market. Therefore, attempting to apply SA to existing cryptocurrency data may result in inaccuracies and misinterpretations.
18The models that follow were also estimated and tested using control variables for six major crypto-specific events that caused significant adverse effects on crypto prices: (i) the Mt. Gox exchange hack; (ii) the Bitfinex exchange hack; (iii) the Luna UST stablecoin collapse; (iv) the froze of withdrawals, swaps and transfers by the crypto lender Celcius; (v) the failure of the crypto hedge fund Three Arrows Capital to meet its margin calls; (vi) the FTX exchange collapse. To do so we used standard dummies as well as dummy-type variables capturing the persistence of the effect in the daily frequency. The finding is that these control variables do not significantly change the main results. To save on space, we do not report these results which are available upon request.
19BTC halving, which occurs approximately every 4 years or after every 210,000 blocks are mined on the BTC blockchain, involves a reduction in the rewards received by miners for mining new BTC blocks. This reduction effectively decreases the rate at which new BTC enters circulation. The first halving took place on 28 November 2012, reducing the BTC block reward from 50 BTC to 25 BTC. The second halving occurred on 9 July 2016, further reducing the reward to 12.5 BTC. The third halving occurred on 11 May 2020, resulting in a block reward of 6.25 BTC. The upcoming fourth BTC halving is estimated to happen around block 840,000, expected to be mined in March or April 2024.
20This effect is statistically significant for the FM-OLS estimator at the 10% level when considering the daily frequency.
21It must be noted that DeFi ecosystems have a smaller market size and adoption relative to BTC. They are newer and more rapidly evolving, encompassing their own unique characteristics. The dynamic nature of the DeFi space increases the likelihood of missing variables in the regression model. Additionally, the shorter time series sample limit the availability of comprehensive and reliable data.
22Respectively,
Almansour, B. Y., Almansour, A. Y., and In’airat, M. (2020). The impact of exchange rates on bitcoin returns: further evidence from a time series framework. Int. J. Sci. Technol. Res. 9 (2), 4577–4581.
Athey, S., Parashkevov, I., Sarukkai, V., and Xia, J. (2016). Bitcoin pricing, adoption, and usage: theory and evidence. Working Paper.
Barro, R. J. (1979). Money and the price level under the gold standard. Econ. J. 89 (353), 13–33. doi:10.2307/2231404
Benigno, G., and Rosa, C. (2023). The bitcoin–macro disconnect. New York, NY. Federal Reserve Bank of New York Staff Reports, 1052.
Benigno, P. (2023). Monetary policy in a world of cryptocurrencies. J. Eur. Econ. Assoc. 21 (4), 1363–1396. doi:10.1093/jeea/jvac066
Benigno, P., Schilling, L. M., and Uhlig, H. (2022). Cryptocurrencies, currency competition, and the impossible trinity. J. Int. Econ. 136, 103601. doi:10.1016/j.jinteco.2022.103601
Biais, B., Bisiere, C., Bouvard, M., Casamatta, C., and Menkveld, A. J. (2023). Equilibrium bitcoin pricing. J. Finance Forthcom. 78, 967–1014. doi:10.1111/jofi.13206
Buterin, V. (2014). Ethereum: a next-generation smart contract and decentralized application platform. Ethereum whitepaper.
Carrick, J. (2016). Bitcoin as a complement to emerging market currencies. Emerg. Mark. Finance Trade 52, 2321–2334. doi:10.1080/1540496x.2016.1193002
Ciaian, P., Rajcaniova, M., and Kancs, d’A. (2016). The economics of BitCoin price formation. Appl. Econ. 48 (19), 1799–1815. doi:10.1080/00036846.2015.1109038
Cong, L. W., He, Z., and Li, J. (2021). Decentralized mining in centralized pools. Rev. Financial Stud. 34 (3), 1191–1235. doi:10.1093/rfs/hhaa040
Corelli, A. (2018). Cryptocurrencies and exchange rates: a relationship and causality analysis. Risks 6 (4), 111–11. doi:10.3390/risks6040111
Dwork, C., and Naor, M. (1993). Pricing via processing or combatting junk mail in Advances in Cryptology —CRYPTO’ 92. CRYPTO 1992. Lecture Notes in Computer Science, eds. (Berlin, Heidelberg, Germany: Springer), 740. doi:10.1007/3-540-48071-4_10
Fernández-Villaverde, J., and Sanches, D. R. (2019). Can currency competition work. J. Monetary Econ. 106, 1–15. doi:10.1016/j.jmoneco.2019.07.003
Garratt, R., and Wallace, N. (2018). Bitcoin 1, bitcoin 2, an experiment in privately issued outside monies. Econ. Inq. 56 (3), 1887–1897. doi:10.1111/ecin.12569
Glaser, F., Zimmermann, K., Haferkorn, M., Weber, M. C., and Siering, M. (2014). “Bitcoin-asset or currency? Revealing users’ hidden intentions,” in Twenty second European conference on information systems (Tel Aviv).
Haber, S., and Stornetta, W. S. (1991). How to time-stamp a digital document. J. Cryptol. 3, 99–111. doi:10.1007/bf00196791
Lee, Y., and Rhee, J. H. (2022). A VECM analysis of Bitcoin price using time-varying cointegration approach. J. Deriv. Quantitative Stud. 30 (3), 197–218. doi:10.1108/jdqs-01-2022-0001
Pagnotta, E. (2022). Decentralizing money: bitcoin prices and blockchain security. Rev. Financial Stud. 35 (2), 866–907. doi:10.1093/rfs/hhaa149
Phillips, P. C. B., and Hansen, B. E. (1990). Statistical inference in instrumental variables regression with I(1) processes. Rev. Econ. Stud. 57 (1), 99–125. doi:10.2307/2297545
Schilling, L., and Uhlig, H. (2019). Some simple bitcoin economics. J. Monetary Econ. 106, 16–26. doi:10.1016/j.jmoneco.2019.07.002
Statista (2022a). Share of respondents who indicated they either owned or used cryptocurrencies in 56 countries and territories worldwide from 2019 to 2022.
Statista (2022b). Total market capitalizations of domestic companies listed on stock exchanges worldwide from 2013 to June 2022.
Stock, J., and Watson, M. W. (1993). A simple estimator of cointegrating vectors in higher order integrated systems. Econometrica 61 (4), 783–820. doi:10.2307/2951763
Syafiqah, I., and Basah, M. Y. A. (2021). An analysis on cryptocurrencies and macroeconomic variables using VECM. ASEAN. J. Manag. Bus. Stud. 3 (1), 8–15. doi:10.26666/rmp.ajmbs.2021.1.2
Szabo, N. (1996). Smart contracts: building blocks for digital free markets. Extropy J. Transhuman Thought 16.
Keywords: JEL classification codes: E44, G10, G12, G19 blockchain, bitcoin, crypto, DEFI, macroeconomic and financial fundamentals
Citation: Pourpourides PM (2025) Long-term nexus of macroeconomic and financial fundamentals with cryptocurrencies. Front. Blockchain 8:1550720. doi: 10.3389/fbloc.2025.1550720
Received: 23 December 2024; Accepted: 10 March 2025;
Published: 28 March 2025.
Edited by:
Andrea Pinna, University of Cagliari, ItalyReviewed by:
Qing Bai, Dickinson College, United StatesCopyright © 2025 Pourpourides. This is an open-access article distributed under the terms of the Creative Commons Attribution License (CC BY). The use, distribution or reproduction in other forums is permitted, provided the original author(s) and the copyright owner(s) are credited and that the original publication in this journal is cited, in accordance with accepted academic practice. No use, distribution or reproduction is permitted which does not comply with these terms.
*Correspondence: Panayiotis M. Pourpourides, cG91cnBvdXJpZGVzcEBjYXJkaWZmLmFjLnVr
Disclaimer: All claims expressed in this article are solely those of the authors and do not necessarily represent those of their affiliated organizations, or those of the publisher, the editors and the reviewers. Any product that may be evaluated in this article or claim that may be made by its manufacturer is not guaranteed or endorsed by the publisher.
Research integrity at Frontiers
Learn more about the work of our research integrity team to safeguard the quality of each article we publish.