- International College of Liberal Arts, Yamanashi Gakuin University, Kofu, Japan
This study aims to investigate the interoperability of the Bitcoin blockchain by comparing the US dollar prices of five cryptocurrencies derived from the Bitcoin price with their corresponding market prices. The deviation rate between the derived price and the market price, referred to as the arbitrage return rate, is examined with respect to its adherence to the efficient market hypothesis and martingale theory principles, specifically regarding mean-reversion and serial independence. Hurst exponents are estimated using R/S and DFA methods, and their dynamics are analyzed using a sliding window technique. Our findings demonstrate that the Bitcoin blockchain effectively facilitates transactions among the five cryptocurrencies, though evidence suggests a potential structural change in Bitcoin blockchain interoperability following April 2023.
1 Introduction
The notion of blockchain interoperability is gaining significant traction both in academic research and industrial applications. Belchior et al. (2022a) illustrate this trend by noting a substantial increase in Google Scholar search results, from two in 2015 to 207 in 2020. This surge in research interest underscores the growing industry demand for interoperability among many existing blockchains. Historically, individual blockchains were developed to address specific use cases and challenges in isolation, neglecting cross-chain interoperability (Abebe et al., 2019; Jin et al., 2018). The adaptability of a blockchain to the requirements of its stakeholders has emerged as a critical driver behind the proliferation of new and diverse blockchains, resulting in a heterogeneous blockchain ecosystem and consequent fragmentation of the blockchain landscape (Belchior et al., 2022b; Pillai et al., 2020; Xu et al., 2017). Presently, practitioners and researchers are confronted with the challenge of balancing novelty and stability as they consider blockchain interoperability to enhance the scalability of existing systems and unlock new use cases (Belchior et al., 2022a).
In financial markets, blockchain technology finds significant application in cryptocurrencies, where digital tokens are viewed as financial assets with potential monetary use. Among the vast array of cryptocurrencies tracked across numerous exchanges, including Bitcoin (BTC), Ethereum (ETH), Tether (USDT), Binance (BNB), Solana (SOL), and Ripple (XRP), the top six cryptocurrencies dominate the market shares. As of 18 March 2024, these cryptocurrencies collectively hold 77.1% of the market capitalization, with Bitcoin alone accounting for 49.4%. Given its substantial market share, the Bitcoin blockchain is a prime candidate for hosting other blockchains. In this context, bitcoin cross-chain interoperability refers to the capability of cryptocurrencies to be exchanged with one another over the Bitcoin blockchain.
Wegner (1996) defines interoperability as the ability of multiple software components to collaborate effectively despite differences in language, interface, and execution platform. The National Interoperability Framework Observatory (NIFO) (European Commission, 2020) identifies seven layers of interoperability: technical, semantic, organizational, legal, integrated public service governance, and interoperability governance. Various factors influencing interoperability are categorized within each layer (Campmas et al., 2022). While current efforts primarily focus on the technical layer, we concentrate on semantic-level interoperability. For example, facilitating a transaction from Ethereum to a Ripple user involves at least two blockchains: the source blockchain, Ethereum, and the target blockchain, Ripple.
The process of transferring assets across different blockchains involves three fundamental steps: (i) locking an asset on the source blockchain, (ii) committing to the blockchain transfer, and (iii) creating a representation of the asset (known as a token) on the target blockchain (Belchior et al., 2022b; Hargreaves et al., 2021). Belchior et al. (2022a) distinguish transfers between heterogeneous blockchains as cross-blockchain communication (CBC), contrasting with cross-chain communication (CCC) between homogeneous blockchains. Zamyatin et al. (2021) demonstrate that no CCC protocol can tolerate misbehaving nodes without a trusted third party. The choice of a trusted third party presents two options: centralized or decentralized (Montgomery et al., 2020). A centralized trusted party could be an exchange or institution. Zamyatin et al. (2021) suggest that consensus among all distributed ledgers could be an abstraction for a trusted third party. Conversely, a decentralized trusted party could be another blockchain. Borkowski et al. (2018) propose that the source blockchain should replicate the consensus mechanism of the target blockchain. Lafourcade and Lombard-Platet (2020) argue that achieving fully decentralized blockchain interoperability is impractical. These findings underscore a crucial realization: Cross-blockchain transactions necessitate a trusted third party, which may involve institutions or consensus mechanisms from the blockchains involved.
We discuss two scenarios for establishing third-party consensus: Cryptocurrency exchanges could use either dollars or bitcoins to facilitate cross-blockchain transactions. For example, Ethereum and Ripple transactions can follow two distinct paths (see Figure 1). The first path involves utilizing a fiat currency, such as the U.S. dollar, as an intermediary to facilitate the consensus processes in both the Ethereum and Ripple blockchains. For instance, one Ether may be valued at $3,480, and with the assistance of an exchange, $3,480 could be exchanged for 5,800 Ripples. This process establishes an exchange rate between Ethers and Ripples, referred to as the cross-blockchain (CBC) exchange rate for Ripple in terms of Ether, denoted ETHXRP. The second path involves employing another blockchain, such as the Bitcoin blockchain, as the intermediary to complete the consensus between Ethereum and Ripple. This approach results in two distinct CBC exchange rates, ETHBTC and XRPBTC, along with the Bitcoin-derived CBC exchange rate, BETHXRP. Therefore, for cross-blockchain transactions between Ethereum and Ripple, there are at least two types of CBC exchange rates, contingent upon the choice of fiat currency or blockchain used. The fiat-currency-derived CBC exchange rate, specifically ETHXRP, serves as a reference point for investigating Bitcoin cross-blockchain interoperability, as BETHXRP represents.
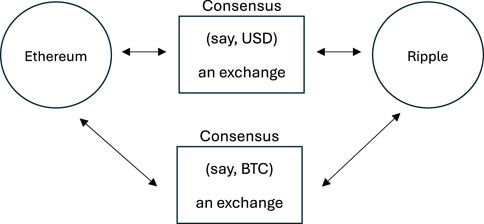
Figure 1. The cross-blockchain transactions between Ethereum and Ripple, showcasing two distinct paths.
It is observed that the proposed CBC transaction model can be simplified into a halfway model. This means that using ETHUSD represents the direct path of a CBC transaction while utilizing the bitcoin-derived ETHUSD, denoted as BETHUSD = ETHBTC × BTCUSD, signifies the indirect path of a CBC transaction. The advantage of this approach is that it allows focusing on one cryptocurrency against bitcoin at a time.
This study aims to explore the interoperability of the Bitcoin blockchain with the top five cryptocurrencies in terms of market capitalization: ETH, USDT, BNB, SOL, and XRP. The methodology involves comparing the prices of these five cryptocurrencies, namely, ETHUSD, USDTUSD, BNBUSD, SOLUSD, and XRPUSD, with their bitcoin-derived counterparts: BETHUSD, BUSDTUSD, BBNBUSD, BSOLUSD, and BXRPUSD. Tether is the most widely used dollar-pegged stablecoin. Incorporating Tether in the analysis is worthwhile because of its profitable correlation with Bitcoin (Bianchi et al., 2020) and its noted instability in terms of price, returns, volatility, and trading volume (Grobys and Huynh, 2022; Hoang and Baur, 2021).
In the context of cross-blockchain interoperability, Ether’s price in dollars, facilitated by the Bitcoin blockchain, should not consistently deviate from Ether’s dollar price. Alternatively, the arbitrage return rate, defined as the difference between these two prices, should not consistently present predictable patterns. The absence of long-term memory in the arbitrage returns not only aligns with efficient market theories but also suggests that the Bitcoin blockchain can effectively facilitate transactions across other blockchains.
Fama’s (1970) efficient market hypothesis (EMH) states that abnormal returns only exist by chance and that no individual can consistently predict future prices using current information. Samuelson’s (1973) martingale model suggests that successive returns should not exhibit serial dependence. However, anomalies cannot simply be dismissed as random errors (Tversky and Kahneman, 1988). Frankfurter and McGoun (2001) argue that anomalies are generic in nature and suggest a certain type of market efficiency. Latif et al. (2011) find that calendar, fundamental, and technical anomalies can lead to abnormal profit. Fama (1990) contends that “such anomalies can be explained only in the context of some particular situations.”
One example of an anomaly is the slow response of investors to new information. Jegadeesh and Titman (1993) observe that adjustments to announcements usually take 12 months, with variations ranging from 6 months to 2 years Barberis and Shleifer (2012) attribute this slow adjustment to under-reaction and overreaction. As Fama (1998) concludes in his work, “Market efficiency survives the challenge from the literature on long-term return anomalies.”
Bariviera et al. (2017) use the detrended fluctuation analysis (DFA) method to analyze Bitcoin’s intraday returns over 5–12 h with 500 data points. They argue that DFA is better suited for nonstationary data than the R/S method, which tends to confuse short-term and long-term memory. Their study finds that long-term memory is not linked to market liquidity and decreases over time. Fousekis and Tzaferi (2021) utilize frequency connectedness analysis, a method introduced by Baruník and Křehlík (2018), to examine how shocks in one stochastic process affect another at various frequencies, exploring the relationship between returns and trading activities. They suggest that asymmetry, characterized as a temporal link between returns and trading volume, can be influenced by the strength of spillovers. Assaf et al. (2022) explore long-term memory by employing a matrix derived from the wavelet-based multivariate long-memory estimator developed by (Achard and Gannaz, 2016). They discover significant long-term correlations between Bitcoin and five other cryptocurrencies. El Alaoui et al. (2019) observe a nonlinear interaction between Bitcoin returns and the growth rate of trading volume using multifractal detrended cross-correlation analysis (MF-DCCA). Stosic et al. (2019) apply the multifractal detrended fluctuation analysis (MF-DFA) to Bitcoin, concluding that Bitcoin returns do not exhibit long-term memory but show anti-persistent long-term correlations in volume changes.
This study proposes employing the rescaled range analysis (R/S) method and detrended fluctuation analysis (DFA) to estimate Hurst exponents using sliding windows. The Hurst exponent is a statistical metric for predictability and is commonly utilized to assess whether a time series exhibits long-term memory, which manifests as volatility clustering in return time series (Bariviera, 2017). A higher Hurst exponent also enhances the accuracy of backpropagation Neural Networks (Qian and Rasheed, 2004). Additionally, Bai-Perron tests for breakpoints complement the Hurst exponent methodology. This study contributes to the literature by investigating long-term memory in Bitcoin-related arbitrage returns. The analysis is conducted using the R programming language.
The remainder of the paper is structured as follows: Section 2 outlines the dataset and methodology, Section 3 presents the results and discussion, and Section 4 concludes the paper.
2 Data and methodology
The data is collected daily from Yahoo Finance. This dataset includes six cryptocurrencies: Bitcoin (BTC), Ethereum (ETH), Tether (USDT), Binance (BNB), Solana (SOL), and Ripple (XRP). Each cryptocurrency has its price time series: BTCUSD, ETHUSD, USDTUSD, BNBUSD, SOLUSD, and XRPUSD. Since we use the Bitcoin blockchain as the trusted third-party abstraction, there are five cross-blockchain (CBC) exchange rates: ETHBTC, USDTBTC, BNBBTC, SOLBTC, and XRPBTC. For simplicity, we exclude “CBC” from the notation. The investigation period spans from 11 November 2017, to 18 March 2024, totaling 2319 observations after discarding two missing values. However, Solana, launched in 2020, extends from 10 April 2020, to 18 March 2024, comprising 1438 observations. Using Yahoo Finance as the primary data source for cryptocurrency prices carries the risk of data inaccuracies. However, it provides consistency and minimizes timestamp issues.
In order to assess the interoperability of the Bitcoin blockchain, it is necessary to generate a Bitcoin-derived dollar price for each cryptocurrency, denoted as BCRYPTOUSD. This process involves evaluating how closely the consensus mechanism of the bitcoin blockchain mirrors that of other cryptocurrency blockchains and, subsequently, how it translates this consensus into a dollar value within its own mechanism. The computation for the bitcoin-derived cryptocurrency price is outlined by Nan and Kaizoji (2017, 2019).
where “CRYPTO” represents any given cryptocurrency.
For instance, the calculation of BETHUSD on 18 March 2024, can be derived from ETHUSD and ETHBTC using Equation 1:
This indicates that one ether is valued at $3561 when bridged by the bitcoin blockchain. Notably, ETHBTC was quoted at $3561.764 on the same day.
Similarly, there are 2319 observations for four bitcoin-derived cryptocurrency prices: BETHUSD, BUSDTUSD, BBNBUSD, and BXRPUSD, while BSOLUSD has 1438 observations.
For each cryptocurrency and US dollar pair, two prices are quoted: one direct price and one indirect price bridged by the bitcoin blockchain. The arbitrage return rate between these two prices can be constructed using the equation provided by Nan and Kaizoji (2020) and Pichl and Kaizoji (2017).
where
The Hurst exponent, denoted as H, quantifies the degree of serial dependence in a time series. Initially developed to measure long-term memory in hydrological time series by Hurst (1951), it was later introduced by Mandelbrot and Wallis (1968) for analyzing financial time series. Theoretically, the value of the Hurst exponent categorizes a time series into three groups, as outlined by Qian and Rasheed (Qian and Rasheed, 2004): (i) a white noise when 0 < H < 0.5, (ii) a random walk when H = 0.5, and (iii) a persistent series when H > 0.5. As H approaches 0, the strength of serial dependence weakens, while it strengthens as H approaches 1.
Various estimators of the Hurst exponent based on scaling properties exist, with two commonly used ones being the R/S estimator, which relies on the rescaled range statistic, and the detrended fluctuation analysis (DFA) estimator. Additionally, we employ a sliding window method to assess the dynamics of the estimated Hurst exponents.
2.1 R/S estimator
The rescaled range analysis (R/S) method scales the range of the cumulative sum of deviation of a time series from its mean (Bariviera, 2017). Let
(i) Split
Each subperiod has an equal length of
Note that the subscripts have different meanings:
(ii) Calculate the mean
Note that the last subperiod
(iii) Calculate the demeaned
where
(iv) Calculate the cumulative series of
(v) Find the range
(vi) Rescale the range
(vii) Repeat steps (i) through (vi) by varying
The length of the subseries,
where we aim for
The R/S statistic is known to asymptotically follow the relation shown in Equation 4 (Hurst, 1951)
where
2.2 DFA estimator
The detrended fluctuation analysis (DFA), introduced by Peng et al. (Peng et al., 1995) mitigates spurious detection of long-range dependence (Bariviera, 2017). Unlike the R/S method that measures the maximum range in both directions, DFA calculates the average of the squared vertical distance of
The DFA procedure involves five steps (Penzel et al., 2003).
(i) Determine the cumulative demeaned series
where
(ii) Divide
which may result in a short segment at the end of the profile. To mitigate its impact, the procedure is repeated from the opposite end, resulting in a total of
(iii) Compute the local trend for each subperiod using an OLS regression. Then, determine the variance for each subperiod using Equation 6:
where
(iv) Obtain the fluctuation function by taking the square root of averaged variances over
(v)Repeat steps (i)-(iv) for different time scale
If the time series
Similarly,
2.3 Sliding window
The sliding window technique involves employing a fixed window size, denoted as,
This approach impacts the estimation procedures of R/S and DFA by substituting
3 Results
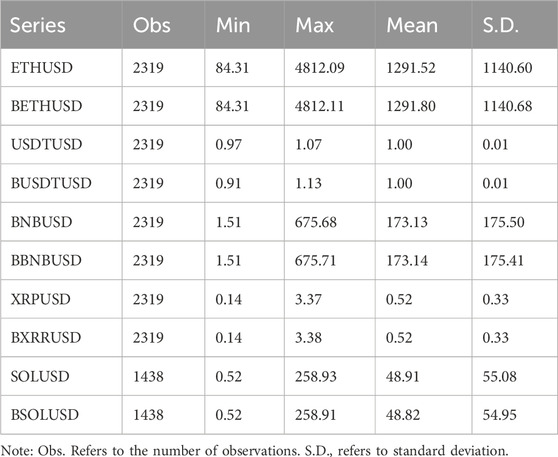
Table 1 displays the summary statistics of cryptocurrency and bitcoin-derived cryptocurrency prices. Notably, the bitcoin-derived prices do not exhibit significant deviations from their direct prices regarding minimum, maximum, mean, and standard deviation. This observation suggests that the Bitcoin blockchain’s interoperability maintains unbiasedness from an unconditional statistical perspective.
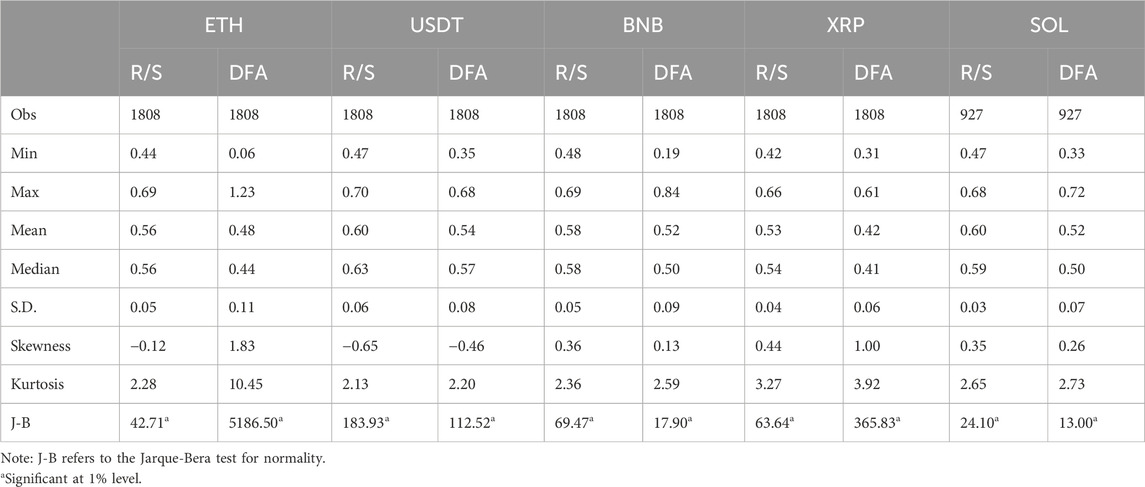
Table 2 provides the descriptive statistics of the return rates associated with arbitrage between the bitcoin-derived and direct prices. While the mean of the arbitrage return rates is nearly zero across all cases, the daily standard deviations range between 1% and 2%, implying that approximately 95% of the data points exhibit deviations from the mean within the range of −6%–6%. Some extreme values are observed, such as a 38% negative deviation for Ripple and a 12% positive deviation for USDT. Furthermore, these return series exhibit skewed leptokurtic and non-normal characteristics.
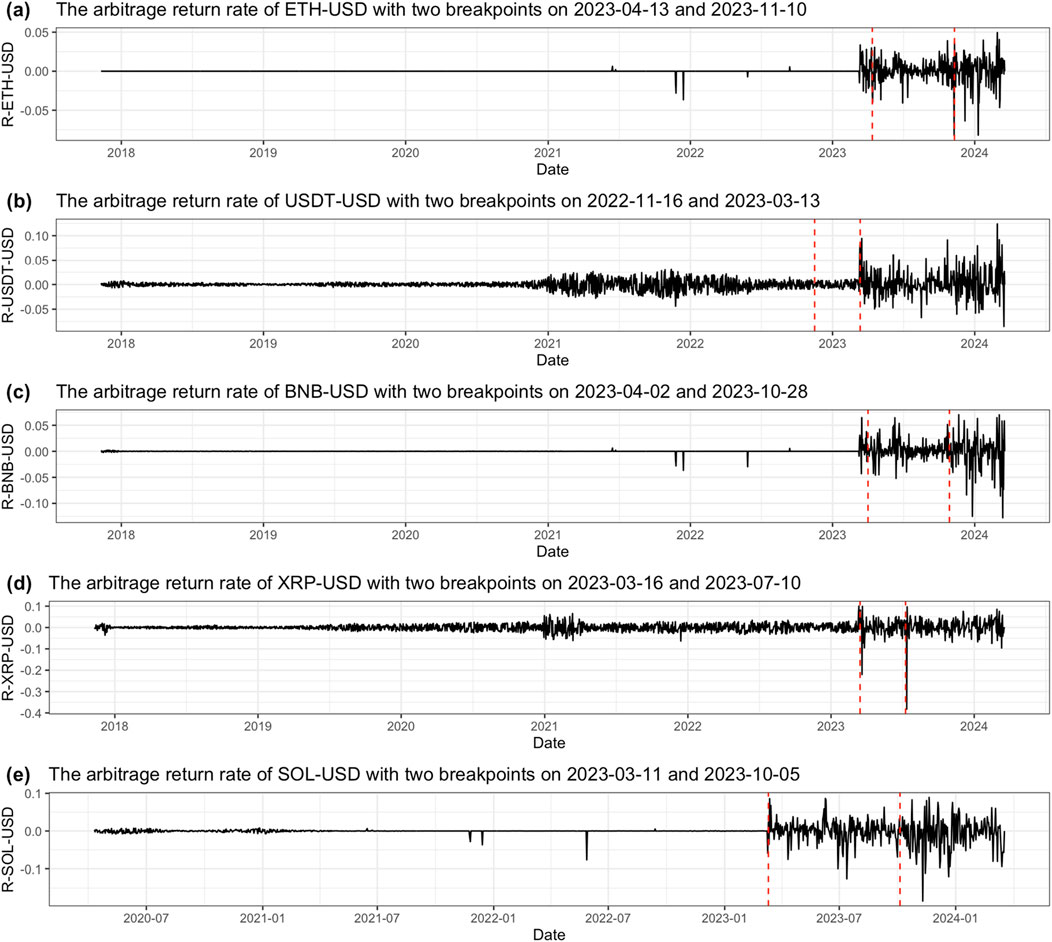
Figure 2 displays the time series of arbitrage returns, with red dashed lines indicating breakpoints. Each series exhibits a mean-reverting characteristic with occasional spikes. However, a sudden increase in fluctuation magnitudes was observed towards the end of the time series across all five cryptocurrencies. We employ the Bai-Perron test (Bai and Perron, 2003) to identify potential structural changes in each arbitrage return series and determine the locations of these breakpoints. Two breakpoints are highlighted in Figure 2 with red dashed lines. Notably, one common breakpoint occurred for all five return processes between 13 March 2023, and 13 April 2023. These observations raise questions about the Bitcoin blockchain’s interoperability: Are these fluctuations persistent and predictable? What caused such a change? Partial answers to these questions lie in the values of the Hurst exponents. Table 3 provides summary statistics of the Hurst exponents estimates.
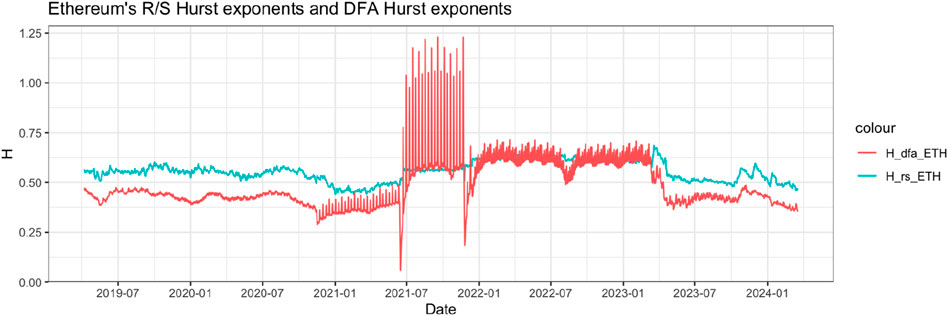
Figure 3 illustrates Ethereum’s Hurst exponents estimated using the R/S and DFA methods. Both series exhibit a similar trend, with the R/S estimates mostly above the DFA’s. The DFA estimator (H_dfa_ETH) displays increased volatility in the middle section of the series. These findings suggest that while the DFA broadly aligns with the R/S regarding changes in H values, they diverge in terms of their levels: the R/S tends to overestimate H, whereas the DFA tends to underestimate H but is more sensitive to anomalies. Both methods indicate that Ethereum’s arbitrage return series lacks strong, predictable persistence over the sample period: the R/S implies a random walk process, while the DFA suggests a mean-reverting process. However, from July 2021 to April 2023, the serial dependence strengthened, particularly in the DFA, which exhibits evident long-term memory despite its volatility. Interestingly, both estimators return to non-persistent levels after April 2023, indicating that the highly oscillating period in the latter part of Ethereum’s arbitrage returns (see Panel (a) of Figure 1) does not enhance predictability. Though mean-reverting processes could suggest predictability, Fama (1998) concludes that anomalies tend to reverse, so unpredictability still holds in the long term.
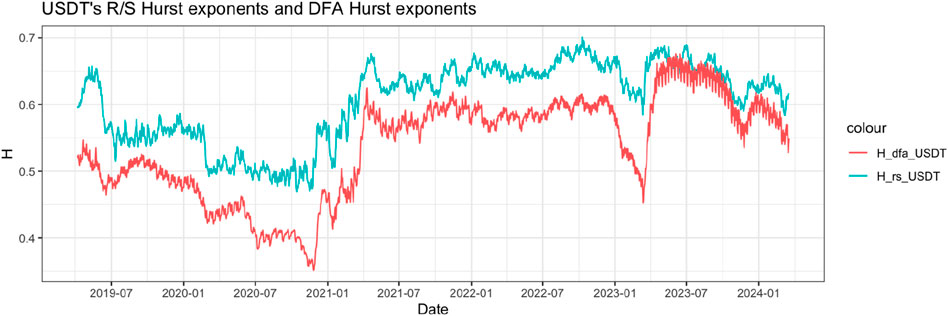
The stablecoin examined in our study, Tether, has demonstrated significant serial dependence strength since April 2021 (refer to Figure 4). This suggests that the Bitcoin blockchain encountered challenges in facilitating transactions between USDT users and U.S. dollars. This period of malfunction could lead to predictable profits. However, after the conclusion of 2023, there appears to be a declining trend in the estimated Hurst exponents for USDT. Correspondingly, USDT’s arbitrage return behavior exhibited volatility during this period.
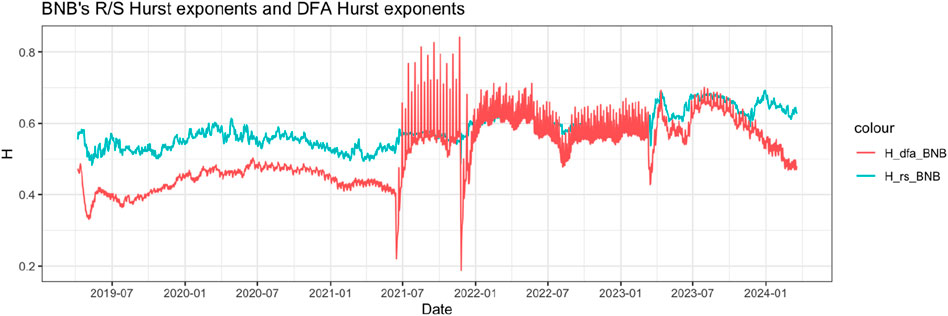
Regarding Binance, the Hurst exponents estimated through the R/S method indicate either a random walk pattern or a limited level of serial dependence strength, as depicted in Figure 5. The DFA estimator tended to highlight a strong trend post-July 2021 but has reverted to indicating a random walk process since the onset of 2024.
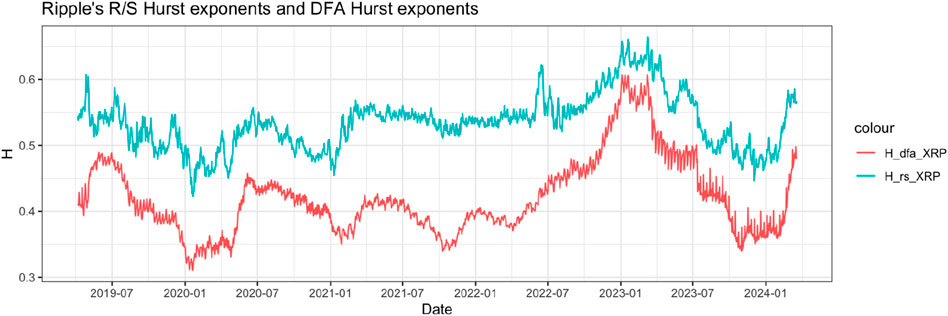
The disparity between the R/S Hurst and DFA Hurst exponents is most pronounced for Ripple’s arbitrage returns, as illustrated in Figure 6. This indicates that the R/S method perceives the return pattern as more identifiable and predictable, while the DFA considers it white noise. However, since the conclusion of 2022, Ripple’s arbitrage returns have exhibited a strong trend, which has dissipated since July 2023. The observed disparity between these methods, particularly for Ripple’s arbitrage returns, can be attributed to the distinct sensitivities of each technique to different types of data noise and trends. Specifically, the DFA method mitigates the spurious detection of long-range dependence (Bariviera, 2017).
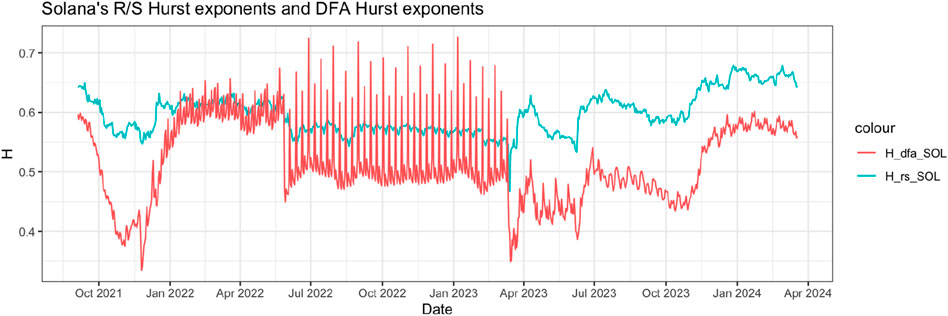
Finally, Solona’s arbitrage returns demonstrated significant persistence from January 2022 to June 2022 (see Figure 7). Afterwards, the DFA Hurst exponents displayed high oscillations, suggesting increased and cyclic predictability from June 2022 to March 2023. Subsequently, there was a divergence between the R/S and DFA estimators. Both estimators indicated a higher level of dependence strength at the beginning of 2024.
4 Conclusion
Cross-blockchain interoperability is a critical concern for facilitating transactions across various existing cryptocurrencies, with the interoperability heavily reliant on a trusted third party. One viable option is to utilize a blockchain as this intermediary party to bridge cross-blockchain transactions. Given its substantial market capitalization, the Bitcoin blockchain is a strong contender for fulfilling this role, encompassing approximately 50% of the market share. Consequently, our investigation focused on assessing the interoperability of the bitcoin blockchain with the other top five cryptocurrencies by market capitalization: Ethereum, Tether, BNB, Solana, and Ripple.
We introduced a middle-ground approach wherein each cryptocurrency is linked to US dollars via the Bitcoin blockchain instead of directly facilitating transactions between two cryptocurrencies. This approach mitigates ambiguity arising from asymmetric influences of individual cryptocurrencies. Subsequently, interoperability was examined by comparing the dollar price derived through the Bitcoin blockchain with each cryptocurrency’s “direct” dollar price. The deviation rate between these two prices served as the arbitrage-return rate. Adhering to efficient market theories, we scrutinized whether long-term serial dependence existed in all arbitrage-return time series.
The dynamics of Hurst exponents, estimated using the R/S and DFA methods, indicate weak evidence of memory persistence, with characteristics leaning more towards a random walk or white noise pattern over our sample period from 11 November 2017, to 18 March 2024. These results are consistent with Fama’s (1970, 1990) efficient market hypothesis, suggesting that prices follow a random walk with returns reverting to a trivial mean.
Some sub-periods exhibited pronounced strength of dependence, accompanied by volatility and cyclical behavior. The observed autocorrelation may originate from a sluggish reaction to new information (Barberis and Shleifer, 2012). Cyclical behavior, likely caused by the investor overreaction (De Bondt and Thaler, 1985), aligns with Fama’s (1998) assertion that most long-term return anomalies tend to dissipate, leading to a pattern where past winners become future losers and vice versa. Concerning the high volatility observed in all five arbitrage return series after April 2023, Malkiel (2003) concludes his research by saying that regardless of how high the price volatility is, capital markets may still be efficient if the price is less predictable. These findings suggest that the values of cryptocurrencies passing through the Bitcoin blockchain do not result in predictable deviations from the prices determined within their respective blockchains through their consensus mechanisms.
Consequently, we infer that the semantic layer of the Bitcoin blockchain’s interoperability generally operated effectively, assuming the exclusion of the technical layer and other layers beyond the scope of this study. Nonetheless, we observed a significant increase in volatility clustering since April 2023 across all cryptocurrencies. These phenomena may stem from structural changes in the functionality of the Bitcoin blockchain. We propose further exploration into the potential decreased dependency of other cryptocurrencies on Bitcoin as a topic for future research.
Data availability statement
The original contributions presented in the study are included in the article/Supplementary Material, further inquiries can be directed to the corresponding author.
Author contributions
ZN: Conceptualization, Data curation, Formal Analysis, Funding acquisition, Investigation, Methodology, Project administration, Resources, Software, Supervision, Validation, Visualization, Writing–original draft, Writing–review and editing.
Funding
The author(s) declare that no financial support was received for the research, authorship, and/or publication of this article.
Acknowledgments
We are deeply grateful to the referees for their valuable suggestions and insightful comments, which have greatly improved our paper's quality and clarity.
Conflict of interest
The author declares that the research was conducted in the absence of any commercial or financial relationships that could be construed as a potential conflict of interest.
Publisher’s note
All claims expressed in this article are solely those of the authors and do not necessarily represent those of their affiliated organizations, or those of the publisher, the editors and the reviewers. Any product that may be evaluated in this article, or claim that may be made by its manufacturer, is not guaranteed or endorsed by the publisher.
Supplementary material
The Supplementary Material for this article can be found online at: https://www.frontiersin.org/articles/10.3389/fbloc.2024.1410191/full#supplementary-material
References
Abebe, E., Behl, D., Govindarajan, C., Hu, Y., Karunamoorthy, D., Novotny, P., et al. (2019). “Enabling enterprise blockchain interoperability with trusted data transfer (industry track),” in Proceedings of the 20th international middleware conference industrial track, 29–35. doi:10.1145/3366626.3368129
Achard, S., and Gannaz, I. (2016). Multivariate wavelet whittle estimation in long-range dependence. J. Time Ser. Analysis 37 (4), 476–512. doi:10.1111/jtsa.12170
Assaf, A., Bhandari, A., Charif, H., and Demir, E. (2022). Multivariate long memory structure in the cryptocurrency market: the impact of COVID-19. Int. Rev. Financial Analysis 82, 102132. doi:10.1016/j.irfa.2022.102132
Bai, J., and Perron, P. (2003). Critical values for multiple structural change tests. Econ. J. 6 (1), 72–78. doi:10.1111/1368-423x.00102
Barberis, N. C., and Shleifer, A. (2012). Style investing. Available at: https://direct.mit.edu/books/edited-volume/chapter-pdf/2275647/9780262305495_caf.pdf.
Bariviera, A. F. (2017). The inefficiency of Bitcoin revisited: a dynamic approach. Econ. Lett. 161, 1–4. doi:10.1016/j.econlet.2017.09.013
Bariviera, A. F., Basgall, M. J., Hasperué, W., and Naiouf, M. (2017). Some stylized facts of the Bitcoin market. Phys. A Stat. Mech. Its Appl. 484, 82–90. doi:10.1016/j.physa.2017.04.159
Baruník, J., and Křehlík, T. (2018). Measuring the frequency dynamics of financial connectedness and systemic risk. J. Financial Econ. 16 (2), 271–296. doi:10.1093/jjfinec/nby001
Belchior, R., Vasconcelos, A., Correia, M., and Hardjono, T. (2022a). Hermes: fault-tolerant middleware for blockchain interoperability. Future Gener. Comput. Syst. 129, 236–251. doi:10.1016/j.future.2021.11.004
Belchior, R., Vasconcelos, A., Guerreiro, S., and Correia, M. (2022b). A survey on blockchain interoperability: past, present, and future trends. ACM Comput. Surv. 54 (8), 1–41. doi:10.1145/3471140
Bianchi, D., Rossini, L., and Iacopini, M. (2020). Stablecoins and cryptocurrency returns: what is the role of Tether? Available at: https://papers.ssrn.com/sol3/papers.cfm?abstract_id=3605451.
Borkowski, M., Ritzer, C., McDonald, D., and Schulte, S. (2018) Caught in chains: claim-first transactions for cross-blockchain asset transfers, 56. Whitepaper: Technische Universität Wien, 57–58.
Campmas, A., Iacob, N., and Simonelli, F. (2022). How can interoperability stimulate the use of digital public services? An analysis of national interoperability frameworks and e-Government in the European Union. Data and Policy 4, e19. doi:10.1017/dap.2022.11
De Bondt, W. F. M., and Thaler, R. (1985). Does the stock market overreact? J. Finance 40 (3), 793–805. doi:10.1111/j.1540-6261.1985.tb05004.x
El Alaoui, M., Bouri, E., and Roubaud, D. (2019). Bitcoin price–volume: a multifractal cross-correlation approach. Finance Res. Lett. 31. doi:10.1016/j.frl.2018.12.011Available at: https://www.sciencedirect.com/science/article/pii/S1544612318306251.
European Commission (2020). National Interoperability Framework Observatory (NIFO) (2024). Available at: https:// 1128 joinup.ec.europa.eu/collection/digital-skills-public-sector/solution/interoperable- 1129 europe-academy/national-interoperability-framework-observatory-nifo.
Fama, E. F. (1970). Efficient capital markets: a review of theory and empirical work. J. Finance 25 (2), 383–417. doi:10.2307/2325486
Fama, E. F. (1990). Stock returns, expected returns, and real activity. J. Finance 45 (4), 1089–1108. doi:10.1111/j.1540-6261.1990.tb02428.x
Fama, E. F. (1998). Market efficiency, long-term returns, and behavioral finance. J.Finan. Econ. 49 (3), 283–306. doi:10.1016/S0304-405X(98)00026-9
Fousekis, P., and Tzaferi, D. (2021). Returns and volume: frequency connectedness in cryptocurrency markets. Econ. Model. 95, 13–20. doi:10.1016/j.econmod.2020.11.013
Frankfurter, G. M., and McGoun, E. G. (2001). Anomalies in finance: what are they and what are they good for? Int. Rev. Financial Analysis 10 (4), 407–429. doi:10.1016/s1057-5219(01)00061-8
Grobys, K., and Huynh, T. L. D. (2022). When tether says Jump Bitcoin asks How low? Finance Res. Lett. 47, 102644. doi:10.1016/j.frl.2021.102644
Hargreaves, M., Hardjono, T., and Belchior, R. (2021). Open digital asset protocol. Datatracker: Internet Engineering Task Force. Available at: https://datatracker.ietf.org/doc/draft-hargreaves-odap.
Hoang, L. T., and Baur, D. G. (2021). How stable are stablecoins? Eur. J. Finance, 1–17. doi:10.1080/1351847X.2021.1949369
Hurst, H. E. (1951). Long-term storage capacity of reservoirs. Trans. Am. Soc. Civ. Eng. 116 (1), 770–799. doi:10.1061/TACEAT.0006518
Jegadeesh, N., and Titman, S. (1993). Returns to buying winners and selling losers: implications for stock market efficiency. J. Finance 48 (1), 65–91. doi:10.1111/j.1540-6261.1993.tb04702.x
Jin, H., Dai, X., and Xiao, J. (2018). “Towards a novel architecture for enabling interoperability amongst multiple blockchains,” in 2018 IEEE 38th international conference on distributed computing systems (ICDCS), 1203–1211. Available at: https://ieeexplore.ieee.org/abstract/document/8416383/.
Lafourcade, P., and Lombard-Platet, M. (2020). About blockchain interoperability. Inf. Process. Lett. 161, 105976. doi:10.1016/j.ipl.2020.105976
Latif, M., Arshad, S., Fatima, M., and Farooq, S. (2011). Market efficiency, market anomalies, causes, evidences, and some behavioral aspects of market anomalies. Res. J. Finance Account. 2 (9), 1–13.
Lee, S.-H. (2022). Hurst exponent using R code | R-bloggers. Available at: https://www.r-bloggers.com/2022/08/hurst-exponent-using-r-code/.
Malkiel, B. G. (2003). The efficient market hypothesis and its critics. J. Econ. Perspect. 17 (1), 59–82. doi:10.1257/089533003321164958
Mandelbrot, B. B., and Wallis, J. R. (1968). Noah, joseph, and operational hydrology. Water Resour. Res. 4 (5), 909–918. doi:10.1029/WR004i005p00909
Mielniczuk, J., and Wojdyłło, P. (2007). Estimation of Hurst exponent revisited. Comput. Statistics and Data Analysis 51 (9), 4510–4525. doi:10.1016/j.csda.2006.07.033
Montgomery, H., Borne-Pons, H., Hamilton, J., Bowman, M., Somogyvari, P., Fujimoto, S., et al. (2020). Hyperledger cactus whitepaper. Retrieved On, 24.
Nan, Z., and Kaizoji, T. (2017). Market efficiency of the bitcoin exchange rate: evidence from Co-integration tests. Available at: https://Ssrn.Com/Abstract=3179981.
Nan, Z., and Kaizoji, T. (2019). Market efficiency of the bitcoin exchange rate: weak and semi-strong form tests with the spot, futures and forward foreign exchange rates. Int. Rev. Financial Analysis 64, 273–281. doi:10.1016/j.irfa.2019.06.003
Nan, Z., and Kaizoji, T. (2020). “The optimal foreign exchange futures hedge on the bitcoin exchange rate: an application to the US dollar and the euro,” in Advanced studies of financial technologies and cryptocurrency markets (Springer), 163–181.
Peng, C.-K., Havlin, S., Stanley, H. E., and Goldberger, A. L. (1995). Quantification of scaling exponents and crossover phenomena in nonstationary heartbeat time series. Chaos An Interdiscip. J. Nonlinear Sci. 5 (1), 82–87. doi:10.1063/1.166141
Penzel, T., Kantelhardt, J. W., Grote, L., Peter, J.-H., and Bunde, A. (2003). Comparison of detrended fluctuation analysis and spectral analysis for heart rate variability in sleep and sleep apnea. IEEE Trans. Biomed. Eng. 50 (10), 1143–1151. doi:10.1109/tbme.2003.817636
Pichl, L., and Kaizoji, T. (2017). Volatility analysis of bitcoin price time series. Quantitative Finance Econ. 1, 474–485. doi:10.3934/qfe.2017.4.474
Pillai, B., Biswas, K., and Muthukkumarasamy, V. (2020). Cross-chain interoperability among blockchain-based systems using transactions. Knowl. Eng. Rev. 35, e23. doi:10.1017/s0269888920000314
Qian, B., and Rasheed, K. (2004). Hurst exponent and financial market predictability. IASTED Conf. Financial Eng. Appl., 203–209. Available at: https://c.mql5.com/forextsd/forum/170/hurst_exponent_and_financial_market_predictability.pdf.
Samuelson, P. A. (1973). Proof that properly discounted present values of assets vibrate randomly. Bell J. Econ. Manag. Sci. 4 (2), 369–374. doi:10.2307/3003046
Wegner, P. (1996). Interoperability. ACM Computing Surveys. 28 (1), 285–287. doi:10.1145/234313.234424
Stosic, D., Stosic, D., Ludermir, T. B., and Stosic, T. (2019). Multifractal behavior of price and volume changes in the cryptocurrency market. Phys. A Stat. Mech. Its Appl. 520, 54–61. doi:10.1016/j.physa.2018.12.038
Tversky, A., and Kahneman, D. (1988). “Rational choice and the framing of decisions,” in Decision making: descriptive, normative, and prescriptive interactions, 167–192.
Xu, X., Weber, I., Staples, M., Zhu, L., Bosch, J., Bass, L., et al. (2017). A taxonomy of blockchain-based systems for architecture design. IEEE Int. Conf. Softw. Archit. (ICSA), 243–252. Available at: https://ieeexplore.ieee.org/abstract/document/7930224/. doi:10.1109/ICSA.2017.33
Zamyatin, A., Al-Bassam, M., Zindros, D., Kokoris-Kogias, E., Moreno-Sanchez, P., Kiayias, A., et al. (2021). “SoK: communication across distributed ledgers,”. Financial cryptography and data security. Editors N. Borisov,, and C. Diaz (Springer Berlin Heidelberg), 12675, 3–36. doi:10.1007/978-3-662-64331-0_1
Keywords: cryptocurrency, bitcoin, blockchain, cross-chain interoperability, Hurst exponent, DFA
Citation: Nan Z (2024) Exploring bitcoin cross-blockchain interoperability: estimation through Hurst exponent. Front. Blockchain 7:1410191. doi: 10.3389/fbloc.2024.1410191
Received: 31 March 2024; Accepted: 20 August 2024;
Published: 30 August 2024.
Edited by:
Akihiro Fujihara, Chiba Institute of Technology, JapanReviewed by:
Sinclair Davidson, RMIT University, AustraliaSergio Adriani David, University of São Paulo, Brazil
Copyright © 2024 Nan. This is an open-access article distributed under the terms of the Creative Commons Attribution License (CC BY). The use, distribution or reproduction in other forums is permitted, provided the original author(s) and the copyright owner(s) are credited and that the original publication in this journal is cited, in accordance with accepted academic practice. No use, distribution or reproduction is permitted which does not comply with these terms.
*Correspondence: Zheng Nan, bmlqZWxuYW5AZ21haWwuY29t
 Zheng Nan