 Giovanni Colavizza
94% of researchers rate our articles as excellent or good
Learn more about the work of our research integrity team to safeguard the quality of each article we publish.
Find out more
ORIGINAL RESEARCH article
Front. Blockchain, 19 January 2023
Sec. Blockchain Technologies
Volume 5 - 2022 | https://doi.org/10.3389/fbloc.2022.1073499
This article is part of the Research TopicScalable Blockchain Technology: Methods and VisionView all 6 articles
Non-Fungible Tokens (NFTs) have recently surged to mainstream attention by allowing the exchange of digital assets via blockchains. NFTs have also been adopted by artists to sell digital art. One of the promises of NFTs is broadening participation to the art market, a traditionally closed and opaque system, to sustain a wider and more diverse set of artists and collectors. A key sign of this effect would be the disappearance or at least reduction in importance of seller-buyer preferential ties, whereby the success of an artist is strongly dependent on the patronage of a single collector. We investigate NFT art seller-buyer networks considering several galleries and a large set of nearly 40,000 sales for over 230 M USD in total volume. We find that NFT art is a highly concentrated market driven by few successful sellers and even fewer systematic buyers. High concentration is present in both the number of sales and, even more strongly, in their priced volume. Furthermore, we show that, while a broader-participation market was present in the early phase of NFT art adoption, preferential ties have dominated during market growth, peak and recent decline. We consistently find that the top buyer accounts on average for over 80% of buys for a given seller. Similar trends apply to buyers and their top seller. We conclude that NFT art constitutes, at the present, a highly concentrated market driven by preferential seller-buyer ties.
More than half the global visual art market is made of sales above $1M, largely by so-called “ultra-high-net-worth individuals ” The middle-tier market is thinning, with allegedly 60% of galleries operating at a loss (Deresiewicz, 2020). While artists start their careers with high expectations, the vast majority never makes a living from their artistic practice (Plattner, 1998). In the overall “good” year of 2018, fifty artists accounted for 64% of global auction sales, the top-500 artists accounted for 89% of total sales (ArtPrice, 2019). While artistic careers have largely resisted systematic empirical study, it is known that success in the arts is influenced by a multifaceted mixture of early and self-reinforcing access to opportunity (Fraiberger et al., 2018), tightly knit social networks (Giuffre, 1999), and even sheer luck (Janosov et al., 2020). Why is it so? The traditional art market deals in heterogeneous, mostly unique goods (artworks), bought by collectors with equally heterogeneous tastes (Velthuis, 2011). As a result, uncertainty reigns. Both sellers and buyers are at a disadvantage, whereas intermediaries retain substantial brokering power (Gertsberg, 2019). These include dealers and galleries, auction houses, experts, curators, and cultural institutions. They match offer and demand by reducing information asymmetries for a margin (Akerlof, 1970). Seemingly, not even the Internet has disrupted the art market “stasis” (Velthuis, 2012).
Such feats of the traditional art market go a long way in explaining why many artists and collectors enthusiastically embraced Non-Fungible Tokens (NFTs): certificates of authenticity registered on public blockchains. The NFT blockchain technology brings with it the promise to enable radically different, actor-first markets.
NFTs constitute a new asset class solving a significant problem: digital ownership. Markets cannot operate without property rights, and digital assets have been most elusive in this respect (Kaczynski and Duke Kominers, 2021). NFTs establish at once an immutable chain of provenance and digital scarcity for an object. What is more, NFTs are programmable, therefore they can be bestowed with deterministic behavior when they are created or afterwards, expanding their purpose in an open-ended way. For example, NFTs can be programmed to yield royalties to the original creator over any transaction in the market of re-sales (Tapscott and Tapscott, 2017). From a survey among NFT artists, this emerged as the most appreciated innovation (Braidotti et al., 2021). In 2021, NFTs have rapidly gone mainstream and seen widespread adoption (Murphy and Oliver, 2021; Nadini et al., 2021).
NFTs promise solutions to many open challenges: they bring full transparency since all transactions are openly stored on a blockchain, providing immediate access to liquidity and better price discovery. They support socio-technical decentralization, shifting the power balance from intermediaries to actors (artists and collectors), supporting novel ownership and governance solutions to emerge (Evans, 2019). The effects are visible: leading NFT marketplaces SuperRare and ArtBlocks have gallery fees of 10%–15% on primary sales, and 0%–3% on re-sales; compare with an average of 30%–70% for galleries and 20% for auction houses in the traditional art market (Towse and Navarrete Hernández, 2020). In 2021 alone SuperRare paid about $10 M in artist royalties on re-sales (source cryptoart. io); compare to zero paid by traditional auction houses. This is why many view NFTs as building blocks in the realization of an open and sustainable Internet (Nguyen, 2021).
The art market is comparable to other sectors where intermediaries hold positional advantages. Examples include centralized financial services, social media platforms and scientific publishing. The arts and collectibles markets have been among the first to adopt NFTs, constituting a relatively mature stage of NFTs adoption (Franceschet et al., 2021). This is evidenced by the move of traditional art market players into NFTs and the de facto entry of NFT art into the contemporary art asset class (Kinsella, 2021). The expansion of NFTs in many other sectors is also unfolding, for example online gaming (Fowler and Pirker, 2021).
There remains considerable skepticism around NFTs, and blockchains more broadly. The main challenges stem from: 1) the absence of a legal and regulatory framework around NFTs, making their actual ownership rights unclear at best (Savelyev, 2018); 2) technical risks due to persisting platform centralization (Marlinspike, 2022) and the environmental costs of mining (Kay, 2021); 3) the possible negative impact of rampant financial speculation and, sometimes, illicit practices (Murphy and Oliver, 2021). What is more, blockchain technology, and NFTs within it, are subject to cycles of booms and busts which might significantly influence the pricing of assets and the long-term development of products.
In fact, we know very little about the potential and actual impact of NFTs. Empirical research on NFTs’ social, economic and cultural implications is just beginning (Nadini et al., 2021; Vasan et al., 2022). We know little about how NFTs are used in practice, whether they are delivering social and economic impact to a broad set of actors, what are the costs and risks involved. As a consequence, the scientific and public debate often contrasts opposite viewpoints, with harsh critiques facing radical supporters (Zeilinger, 2018; Lotti, 2019; Joselit, 2021). The systematic analysis of data, made eminently possible by its availability through public blockchains, is essential to ground such discussions in facts.
This contribution focuses on the key relationship in art markets: the one between sellers and buyers, thus most often artists and collectors. Our goal is to provide a quantitative overview of the NFT art market from the 2020–2021 boom to the 2022 bust, through the lenses of seller-buyer networks. The main question we ask is whether NFT art is collected from a more diverse set of buyers than fine arts, or instead whether strong preferential ties constitute a persistent feature of art markets even when supported by public blockchains. Previous work has shown that NFT traders tend to specialize within NFT segments and collections, and that the market is highly concentrated (Nadini et al., 2021). When considering NFT art, preliminary evidence points to significant similarities with the traditional art market in terms of systematic seller-buyer ties, sticky reputation effects, and high degrees of collector specialization (Vasan et al., 2022).
A blockchain is an append-only, distributed database, that users store and update via a decentralized protocol (Narayanan et al., 2016). Cryptography is used to avoid tampering and falsification with the data a blockchain stores. The origins of the blockchain date back to the work of Haber and Stornetta (1991) on how to create tamper-proof data. The first, popular implementation of a blockchain is bitcoin (Nakamoto, 2008): a financial blockchain exclusively devoted to tracing transactions related to minting and exchanging the bitcoin crypto currency. Bitcoin introduced the idea of “proof of work” as its decentralized protocol (also called “consensus mechanism”). The paramount problem blockchain technology solves is of great social importance: reaching consensus on authoritative records in the absence of centralized institutions and trusted third parties. The use of blockchains has been growing rapidly over the past few years, attracting widespread attention (Casino et al., 2019; Xu et al., 2019). Blockchain technology is creating a space to experiment with novel forms of decentralized organizations, markets and coordination systems (Wright and De Filippi, 2015; Ølnes et al., 2017). A key development, in this respect, has been the introduction of programmable blockchains, able to record a variety of user activities via “smart contracts.” The most well-known example is Ethereum (Buterin, 2013). Despite the growth in interest and adoption of blockchain technology, there is still limited evidence-based research on its societal, economic, and cultural impact, as well as long-term potential.
The potential of blockchain technology applications in the arts has been much anticipated and debated, primarily theoretically or relying on circumscribed qualitative studies (Sidorova, 2019). Practitioners consider the arts “one of the least discussed applications for blockchain, yet one where the technology may hit hardest” (MacDonald-Korth et al., 2018). Whitaker (2019) identifies at least three transformations which are made possible by the affordances of blockchain technology: 1) “blockchain blurs the for-profit/non-profit distinction in the arts because the decentralized structure shifts responsibility for infrastructure away from trusted central authorities” such as public property registers, or institutional intermediaries (e.g., galleries and museums); 2) “blockchain changes the ownership structure of art by creating fractional ownership of artworks and scarcity for digital works [.] these potential shared-value structures extend to resale royalties and copyright”; 3) “blockchain’s shared value structures generalize to new models of supporting the arts itself.” Indeed, blockchain technology has been used in a variety of applications, from enabling novel galleries and marketplaces (Wang et al., 2021) to tracking looted or contested cultural heritage (Whitaker et al., 2021).
Artists often see blockchains as a possible means to bring about a re-centering of the market around and in support of their creative processes, with a sustainable and inclusive outlook (Bollier, 2015; Catlow et al., 2017), where “artists set the terms of their market participation” (Potts and Rennie, 2019).
The key blockchain innovation underpinning this vision are Non-Fungible Tokens (NFTs). Art registered as an NFT is called rare digital art, crypto art, blockchain art or NFT art (Bailey, 2018; Franceschet et al., 2021) (we use NFT art throughout). NFT art may be considered a form of digital art (Paul, 2016): NFT artworks often use digital media and do not share a unique set of aesthetics. Furthermore, a share of NFT art is born-analog and has been digitized in order to register it as an NFT. Many of the innovations NFTs are bringing to the arts have antecedents in early blockchain projects such as Monegraph (Dash, 2014), Ascribe (McConaghy et al., 2017), and Plantoid (Okhaos, n.d.). NFTs are used to trade in several assets, from collectibles to virtual land; the “art” segment of NFTs has been the leading one so far, with higher average prices and volumes (Nadini et al., 2021). In March 2021, NFTs made the news thanks to Beeple’s “Everydays: The First 5,000 Days” sale, went for about $69 million at Christie’s. This sale made the artist the third highest-selling living artist at the time. Beyond the hype of large sales, NFTs are by now widely used in a growing ecosystem made of several, small to large marketplaces.
To see how, let us imagine the following scenario, illustrated in Figure 1: an artist has created an artwork, either born digital (e.g., digital sculpture or animation) or digitized (e.g., a picture of street art or a video of a performance). This artwork is stored on a computer as a file, therefore it can be endlessly copied. Programmable blockchains like Ethereum allow anyone to record transactions resulting from the interaction with a piece of code, called a “smart contract” (De Filippi et al., 2021). By interacting with a suitable smart contract (e.g., via an NFT marketplace such as SuperRare or OpenSea, or by creating their own smart contract), the artist can generate a unique certificate for their artwork. Certificates are called ‘tokens’, and typically contain a reference to the artwork by way of a URL to where it can be accessed online, artwork metadata, or even the input data required to re-create it programmatically (as is the case with generative art, e.g., on ArtBlocks). Thanks to the blockchain, a token is immutably recorded via a transaction, thus creating a transparent, auditable and scarce (i.e., unique or limited-edition) certificate of authenticity for the artwork. The token is at first deposited in the artist’s wallet, it can then be exchanged and interacted with, for example traded, used to unlock collector-only rewards and showcased on social media.
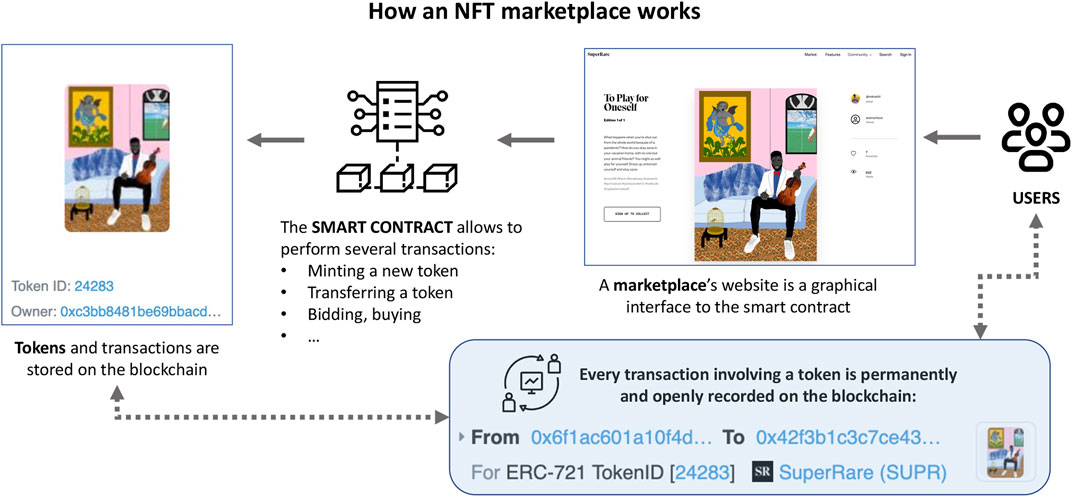
FIGURE 1. Illustration of how an NFT art marketplace works. The marketplace's website is an interface to one or more smart contracts recording events on a blockchain. The example is ‘To Play for Oneself’ by Osinachi, on SuperRare.
One reason why NFTs have become rapidly popular in the arts and collectibles markets is frustration with the status quo. The art market supports the economic exchange of creative goods with a primary cultural value. In Bourdieu’s parlance, art is one way to objectify cultural capital into goods (Throsby, 1999). The main task the art market solves is pricing artworks: a feat not easily accomplished given their heterogeneity and the diverse motivations for buying them (Velthuis, 2011; Findlay, 2014). The art market obtains its supply from living artists, selling from their studio, via galleries and fairs, and from collectors or institutions in all other cases. Intermediaries, such as auction houses, dealers and consultants are active mostly in the secondary market of re-sales (Khaire, 2017). The art market has many peculiarities and outstanding limitations, one of which is that it severely lacks in transparency (Velthuis, 2012): some see the presence of information asymmetries as the main cause of limited efficiency in the art market (David et al., 2013; Day, 2014). The attribution, provenance, authenticity, and even copyright of an artwork is often unclear, and this plays a significant role in its ultimate pricing (Cooper, 2018). The division between primary and secondary markets creates a further informational barrier, in the context of a general difficulty in estimating the quality of intrinsically unique goods (Gertsberg, 2019), and lacking regulatory frameworks Mosna (2022). What is more, price data in the art market is notoriously lacking, hindering the systematic study of artwork prices and pricing over time (van Miegroet et al., 2019).
This results is a disparity in the information available to buyers and sellers, placing both at a disadvantage and increasingly allowing prices to be used as signals of quality (Akerlof, 1970; Plattner, 1998). Information asymmetries and high uncertainty translate into high transaction costs paid to mediators, they inflate the role of expert judgements and of one’s embeddedness in existing networks. In the art market few, powerful and established intermediaries can easily marginalize anyone with reduced access to information (Gertsberg, 2019). It is thus that the reliance on personal and institutional social networks as arbiter for taste and value became commonplace in many cultural and creative sectors, well beyond the fine arts (Godart and Mears, 2009; Ebbers and Wijnberg, 2010; Williams et al., 2019; Juhász et al., 2020). Mediators thrive from information asymmetries in the art market (Bonus and Ronte, 1997; Wijnberg and Gemser, 2000; Prinz et al., 2015; De Silva et al., 2016), and often focus on consensus building among themselves (Kackovic and Wijnberg, 2020).
While reducing buyer’s uncertainty, gatekeepers channel scarce resources to a limited number of artists, enhancing the superstar phenomenon in the art market (Velthuis, 2012). “Payoffs in these markets are disproportionate to the level of talent and profits are highly rank-dependent. As a result, a small number of individuals absorb the largest portion of revenues” (Gertsberg, 2019). This has a direct consequence on the career prospects of artists. While the working conditions in the art market span a high-variance continuum from tenured contracts to self-employment (Hartog and Kackovic, 2019), “the overwhelming majority of artists do not enjoy much, if any commercial success” (Plattner, 1998). Unpaid or precarious and non-art-related work is not only widespread (McRobbie, 2016; Duffy, 2017), but also shows stratification by social class, age, and career stage across the cultural and creative industries (Brook et al., 2020), marginalization (Siebert and Wilson, 2013) and alternative copying mechanisms (Merkel, 2019).
While in recent years the art market has been changing in the direction of increased globalization, financialization, and digitization (Malik and Phillips, 2012; Velthuis and Coslor, 2012; Sidorova, 2019; McAndrew, 2021), its underlying market structure has remained static. Even the Internet has had so far limited impact (Deresiewicz, 2020), prompting some to say that “in 2022, (the art market) will look like today, or for that matter, like it did a century and a half ago, when modern art as well as its markets were born” (Velthuis, 2012). The rapid success of NFT art must be understood in the context of “static” market structures, operating often without transparency, providing little opportunity to most artists and a significant advantage to gatekeepers.
NFTs promise solutions to several challenges (Belsky, 2021): authenticity and provenance are clear and publicly auditable, access to liquidity is easier and immediate, prices are fully transparent, market structures are flexible and customizable, and NFTs are digitally native. The results are already tangible, for example in the drastic reduction of transaction costs (Franceschet et al., 2021; Towse and Navarrete Hernández, 2020). A key opportunity is finding better ways to sustain artistic and creative careers, especially so at their very beginning. NFTs can support social impact investments targeted to artists (Grannemann and Whitaker, 2019), and artist-friendly economic models including fractional equity (Whitaker, 2018; Whitaker and Kräussl, 2020) and artist royalties (Schten, 2017; van Haaften-Schick and Whitaker, 2021). Indeed in 2021 alone NFT sales volume totals about $40 billion (Murphy and Oliver, 2021). Compare with the arts and antiques market sized at $50 billion in 2020, down 22% on 2019 and 27% since 2018 (McAndrew, 2021).
To be sure, several operational, legal and regulatory questions remain open about the use of NFTs. Many innovations are properties of the NFT, not the artwork itself, and therefore rest to some extent on informal social contracts. The relationship between physical artworks and NFTs is often unspecified, bringing a lack of legal and technical clarity when exchanging NFTs in place of the artworks they relate to. Further open problems include copyright (Savelyev, 2018), environmental costs (Kay, 2021), governance (Yermack, 2017), platform centralization (Marlinspike, 2022). Answering or overcoming such challenges would be critical given the adoption and potential of NFTs.
The discourse around the actual and potential impact of NFTs in the arts is often speculative. On the one hand, critics warn against the risk of furthering the commodification of art and the financialization of artistic practices (Zeilinger, 2018). To some, it is unlikely that blockchain technology will offer an alternative to inequalities in the art world, but it will, instead, reinforce the status quo (Sommerer and Mignonneau, 2017). That NFTs are also a speculative financial asset is indisputable, as confirmed by ever abundant work on their profitability, price estimation, and correlation with other asset classes (Ante, 2021; Dowling, 2021a,b; Khezr and Mohan, 2021; Borri et al., 2022; Kräussl and Tugnetti, 2022; Bao and Roubaud, 2022); there are also signs of illicit practices, like wash trading and money laundering (Murphy and Oliver, 2021), although these risks might have been exaggerated (von Wachter et al., 2022). Indeed, there are reasons for caution: early empirical studies of the overall NFT market showcase a concentration of opportunity and winner-take-all outcomes not dissimilar to the traditional art world (Nadini et al., 2021; Vasan et al., 2022).
At the same time, it is difficult to dismiss the potential of NFTs affordances to bring about change in the art market, if only given their enthusiastic adoption by creators, the radically lower transaction costs and much improved transparency. Creative designs of new modes of organizing artistic practices and markets via blockchains are just beginning to be explored (Lotti, 2019). The companies that have been most successful in the NFTs market make innovative use of the NFT technology (e.g., artist royalties), and leverage the community of users, maintaining community engagement and easy onboarding (Kaczynski and Duke Kominers, 2021). An example is SuperRare, among the first and most successful NFT art marketplaces, which evolved from a privately owned company into a decentralized autonomous organization in summer 2021, giving partial control to the early community via the $RARE social token. SuperRare is now jointly governed by its founders, funders and community via proof of stake (SuperRare, 2021). The fact is that NFTs allow for an open design space in terms of market logic, with each marketplace taking different approaches. For example, a marketplace might use fixed artist royalties on secondary sales, or instead allow the artist to adjust them as they prefer. In practice, we do not know what drives the development and adoption of NFTs, which market designs are most successful in fostering both economically and societally beneficial outcomes, which ones have instead a mostly negative impact, and why. NFTs are re-enacting the clash between the sphere of culture and the sphere of power in the arts (Bourdieu, 1993; Throsby, 1994; Hanquinet, 2017), so that a novel equilibrium might emerge in due course. All evidence from the labor market is telling us that “our future economy will be built on creativity and technology” (Easton and Bakhshi, 2018). Many cultural and creative professions like journalism, advertising, and communication, have been greatly impacted by participatory media culture (Deuze, 2007; Miller, 2020), big data (Boyd and Crawford, 2012) and algorithms (Mittelstadt et al., 2016; Ananny and Crawford, 2018; Gandy, 2021): it might now be the turn of arts.
Given the focus of this study, we consider a set of galleries for trading unique NFT art. Collectibles and art drops, such as in ArtBlocks, are out of scope. The selected galleries cover the range from large (e.g., SuperRare) to small (e.g., Zora) in terms of sales and their priced volume. We collect data from the OpenSea API, 1 considering all available sales between a gallery’s start of operations and August 2022 included.
Table 1 provides an overview of the six galleries and their sales data from OpenSea. Galleries can have a large number of transactions (e.g., Makersplace), a high volume (e.g., Foundation), both (e.g., SuperRare), or neither (e.g., Zora), making for a varied group as intended. This is further evidenced by the average and media sale prices, which vary substantially across galleries. The total dataset comprises almost 40 k sales over several years starting in 2018, and a total priced volume of over 237 M USD. Every price in this study is given in USD, with the exchange rate calculated at the time of a sale. Lastly, we note that the number of distinct sellers and buyers is small but not negligible in an art market, with 5,636 sellers and over 10 k buyers. It is important to underline that every seller or buyer is identified by their blockchain addresses: we make no attempt to relate addresses to real-world individuals. Furthermore, not all sellers are artists/creators, and not all buyers are holders/collectors: we also make no attempt to distinguish the primary (first time sales) and secondary (resales) markets in this study. The reason is that non-priced transactions are widespread in NFT art, whereby it is easy to transfer a token from one address to another. In the absence of a reliable way to establish an individual’s identity beyond addresses, it follows that distinguishing the primary from secondary market is also not possible in a reliable way.
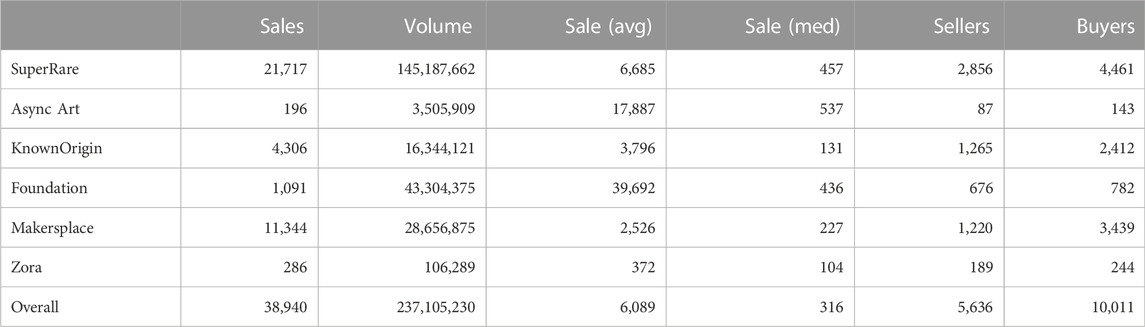
TABLE 1. Overview of the dataset per gallery. All sale values are in USD converted at the time of the sale.
In the results section we first briefly provide an overview of the NFT art market as represented by the data we discussed previously. Next, we study the concentration of the market across sellers and buyers. Finally, we explore preferential ties and the relative weight of the top sellers and buyers in one to one relationships.
Figure 2 shows an overview of the NFT art market since the start of each gallery, as represented in the dataset, and August 2022 included. Figure 2A provides the monthly number of sales per gallery and overall, while Figure 2B provides the sales volume (in USD). This result clearly shows the trends of NFT art over recent years. While in 2020 the market was active in terms of number of transactions, their volumes remained very low. 2021 has been a boom year for NFT art, and NFTs more generally, even though the market has been driven by the largest galleries (e.g., SuperRare). We are currently in a period of bear market after a significant bust since the beginning of 2022. This study considers a long time period and multiple market cycles with the goal of assessing whether market concentration and preferential ties also change and adapt to the overall market dynamics.
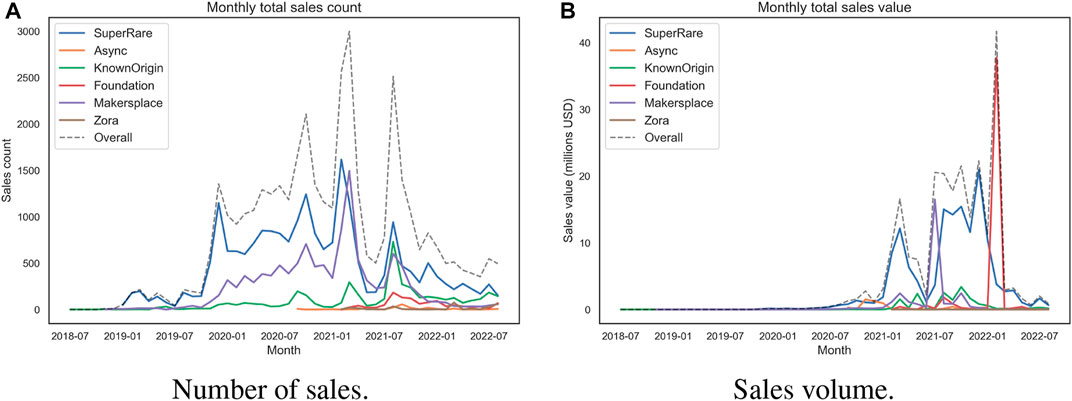
FIGURE 2. NFT art market overview. (A) Number of sales. (B) Sales volume.
We focus next on market concentration, by investigating to what extent the top sellers and buyers drive the overall market. Firstly, in Table 2, we provide the fraction of sales and priced volume controleld by the top 10% sellers and buyers, respectively. The overall picture is that of a highly concentrated market, whereby 86% and 92% of sales volume is controlled by just the top 10% of sellers and buyers respectively. The concentration around the number of sales is less pronounced, but still steep. This picture changes somewhat across galleries, with for example the small gallery Zora showing less concentration.
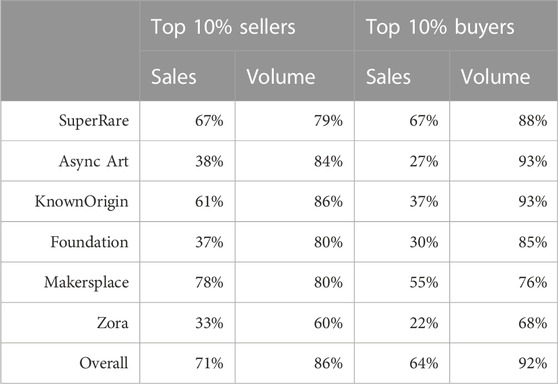
TABLE 2. Fraction of sales and volume (in USD) controlled by the top 10% sellers (columns 1 and 2), and by the top 10% buyers (columns 3 and 4).
To complement these finds we also provide the Lorenz curves showing the concentration of sales and buys. In these Lorenz curves, the sellers and buyers are sorted from top to bottom (in terms of their market activity), and the fraction of sales or volume they control is cumulatively accounted for. In this way, it is easy to show what share of the market a certain fraction of users accounts for.
Figure 3 show the concentration in the number of sales (Figure 3A) and the sales priced volume (Figure 3). Sellers are sorted on the x axis, while the fraction of sales they control is cumulatively given on the y axis. Black dotted lines can be used to find the 10%–90% and 20%–80% intersections. The concentration of sale transactions is indeed less pronounced, with Zora, Async and Foundation showing a broader market participation, and SuperRare and Makersplace a narrower one. Yet it is with sales priced volumes that the NFT art market steep concentration clearly shows. For almost all galleries the top 10% of sellers cover over 80% of sales volumes, and the top 20% about a remaining 10%, with 80% of the remaining users trading a volume of 10% of the total, or even less.
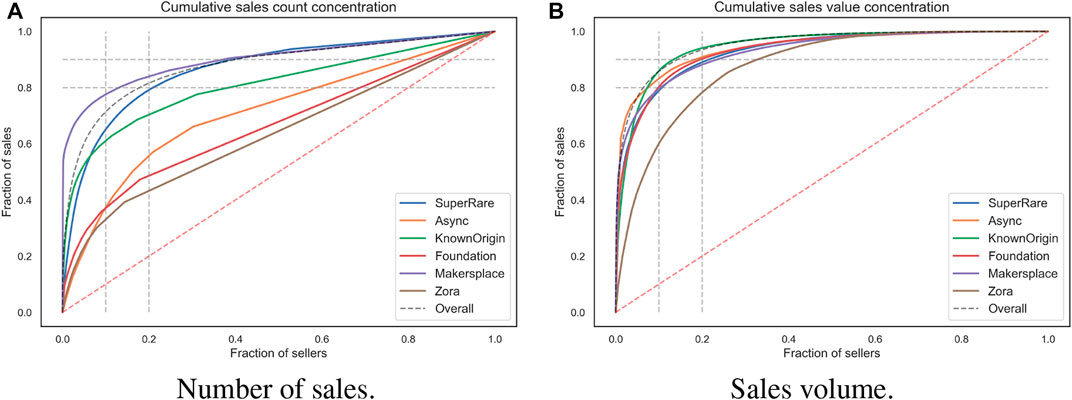
FIGURE 3. NFT art market sales concentration. Black dotted lines provide the 10%-90% and the 20%-80% intersections, while the red line shows perfect equality. (A) Number of sales. (B) Sales volume.
We similarly consider buys in Figure 4, providing Lorenz curves for the number of buys (Figure 4A) and their volumes as well (Figure 4B). While the concentration of buys is somewhat less pronounced than that of sales, the concentration of buys volumes is even stronger. In galleries such as Async and KnownOrigin, the top 10% buyers are responsible for over 90% of buys volume, with SuperRare close behind. Again Zora and, in this case, Makersplace are less concentrated.
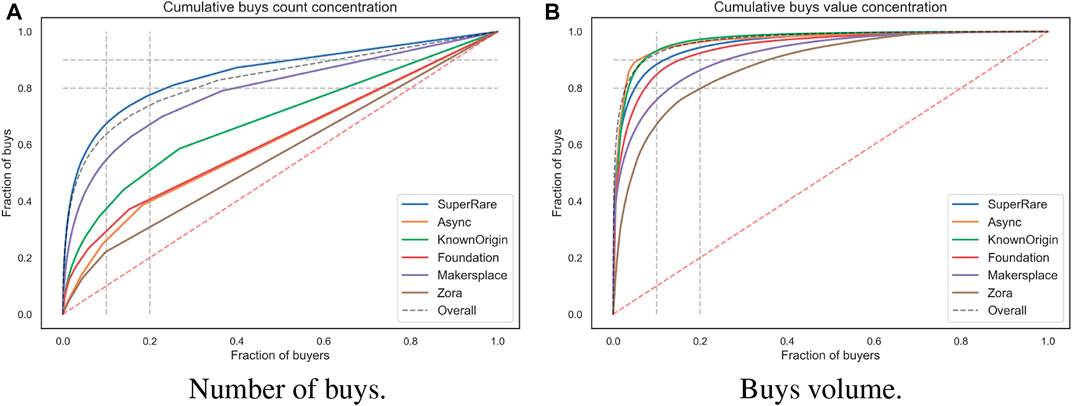
FIGURE 4. NFT art market buys concentration. Black dotted lines provide the 10%-90% and the 20%-80% intersections, while the red line shows perfect equality. (A) Number of buys. (B) Buys volume.
Our results on the NFT art market concentration echo previous studies focused on the overall NFT market. Nadini et al. (2021) find that traders tend to form tight clusters specialized by NFT category. Furthermore, in their study, “the top 10% of traders alone perform 85% of all transactions and trade at least once 97% of all assets.”
We operationalize preferential ties as the main seller-buyer directional relationships. Therefore, the preferential tie for a seller is their main buyer, and similarly for a buyer. We then focus on how large a role preferential ties play in the NFT art market. We measure their effect via Eq. (1).
pa expresses the preferential tie score of a seller a, with their preferential buyer b. The preferential buyer is simply defined as the main one by sales or volume. va,b are sales from a to b. v can represent either sales counts or their priced volumes, and va is the total number or volume of sales for a. pa thus ranges between zero and one, with one meaning that all buys from a were made by b. The same scores can be calculated for buyers and their preferential sellers. This preferential tie score is of immediate interpretation and complements the Lorenz curves discussed above.
In Table 3 we show the average preferential scores across galleries and overall, distinguishing between sellers and buyers. From these results we can immediately appreciate how strongly NFT art is driven by preferential ties: the overall seller to buyer sales are conducted via preferential ties 82% of times on average, and 86% for buyer to seller sales. Sale volumes are even more concentrated on preferential ties, with 86% and 89% respectively. Interestingly, the gallery relying most on preferential ties is Zora, which emerged as the least market concentrated.
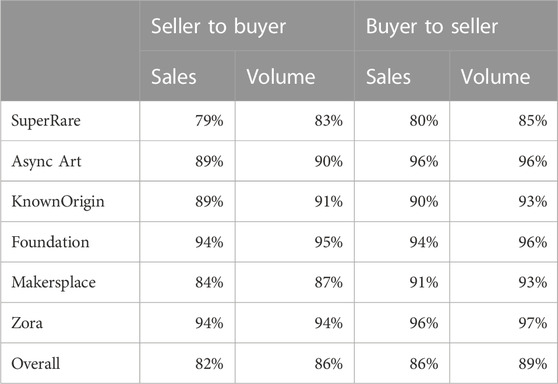
TABLE 3. Average preferential tie scores: the fraction of sales and volume (in USD) from a seller to their preferential buyer (columns 1 and 2), and from a buyer to their preferential seller (columns 3 and 4).
Next, we show the role of preferential ties over time. Figure 5 focuses on seller to buyer ties, while Figure 6 on buyer to seller ties. Both figures show preferential ties for sales (left) and priced volumes (right). These figures show the trend for SuperRare, every other gallery, and overall. This is motivated by the relative size of SuperRare in the dataset, with well over half the sales and volumes overall. Furthermore, both figures highlight the overall market volume over time, for reference. Clear and similar trends emerge for both sellers and buyers. First of all, SuperRare started off as a less concentrated gallery, with preferential ties playing a large yet less dominant role. For the other galleries, this was not the case, with preferential ties always playing a dominant role. The role of preferential ties grew over time in SuperRare, except during the first market boom in the early 2021. We can speculate that the market boom of the 2021, which initially led to a diversification of ties, rapidly consolidated into overly strong preferential ties which have been since dominating the market in all galleries. The 2022 bust does not seem to have made an impact in this respect. Currently, all galleries have average preferential tie scores of over 90% in all respects.
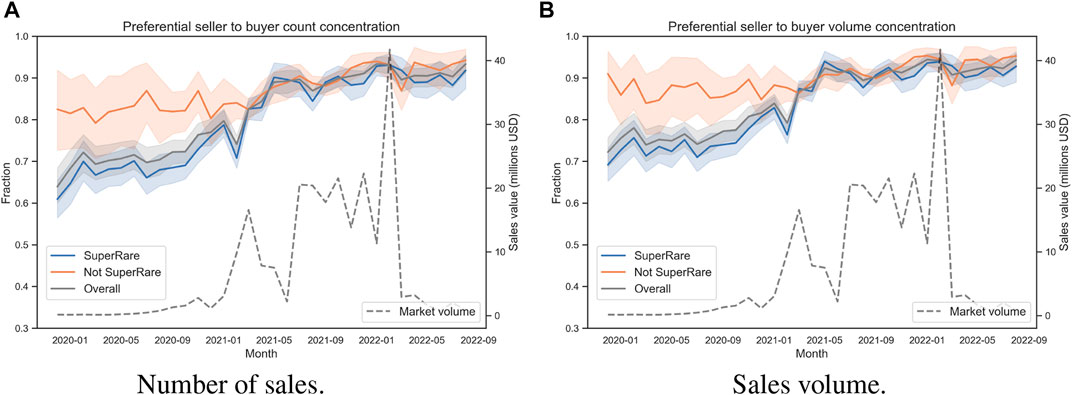
FIGURE 5. Seller to buyer preferential ties. The overall market volume, provided for comparison, is the same as the respective line in Figure 2B. 95% bootstrapped confidence intervals are provided. (A) Number of sales. (B) Sales volume.
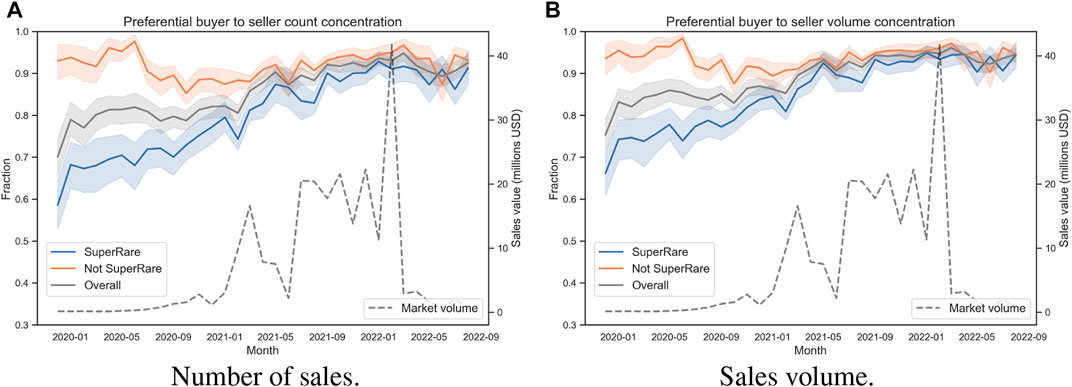
FIGURE 6. Buyer to seller preferential ties. The overall market volume, provided for comparison, is the same as the respective line in Figure 2B. 95% bootstrapped confidence intervals are provided. (A) Number of sales. (B) Sales volume.
Our results confirm and expand previous studies. Nadini et al. (2021) show that “the distribution of link weights (in NFT markets) is well characterized by a power law distribution, with the top 10% of buyer–seller pairs contributing to the total number of transactions as much as the remaining 90%.” Focusing on the Foundation NFT art gallery, Vasan et al. (2022) find that artists receive repeated investments from a small group of leading collectors. This effect is particularly strong for successful artists, who drive the bulk of the market in terms of volume.
In this work, we consider the recently emerged NFT art market, and investigate its promise to bring about a broader participation and diversity in market participation for both sellers and buyers of art. This contribution started with an effort to position NFT art in the broader context of the art market via an extended overview of previous work. The traditional art market is notoriously opaque and hard to access, with steep winner-take-all mechanics making it hard for most artists and collectors to benefit from it. Is the NFT art market any different? The answer is no.
We assemble a large dataset of sales across six NFT art galleries, representing different market segments, scales and volumes. Next, we confirm that these galleries follow in the recent history of NFT markets, characterized by a rapid growth in 2020, a boom in 2021, and a bust in 2022. We then consider market concentration and show that, while galleries differ markedly, the top sellers and buyers largely dominate transactions both in terms of sales and priced volume. Lastly, we investigate the role of preferential ties over time, finding that with the boom market all galleries converged on a very high (over 90%) preferential tie score, which persists in bear market times. Our results confirm and complement recent work at the scale of all the NFT market (Nadini et al., 2021), and at the scale of a single NFT art gallery (Vasan et al., 2022).
While our findings are useful to clarify that the NFT art market does not appear to differ from the traditional art market with respect to market concentration and the role of preferential ties, several questions remain open. The main one might be what drives market concentration and preferential ties. A hypothesis is hype and speculation, which is a purview of few wealthy traders, at least at the scale of the NFT market in 2021. A second question concerns whether there are NFT markets which managed to remain less concentrated and broader in participation, and if so how. Such questions constitute compelling ideas for future work.
Publicly available datasets were analyzed in this study2. This data can be found here: https://docs.opensea.io/reference/api-overview.
The author confirms being the sole contributor of this work and has approved it for publication.
At the time of writing, the author is a co-founder of NiftyValue (https://www.niftyvalue.com)3, a company active in the business of automatic pricing and discovery of NFT art.
All claims expressed in this article are solely those of the authors and do not necessarily represent those of their affiliated organizations, or those of the publisher, the editors and the reviewers. Any product that may be evaluated in this article, or claim that may be made by its manufacturer, is not guaranteed or endorsed by the publisher.
1https://docs.opensea.io/reference/api-overview.
2https://www.niftyvalue.com.
3https://docs.opensea.io/reference/api-overview.
Akerlof, G. A. (1970). The market for ”lemons”: Quality uncertainty and the market mechanism. Q. J. Econ. 84, 488–500.
Ananny, M., and Crawford, K. (2018). Seeing without knowing: Limitations of the transparency ideal and its application to algorithmic accountability. New Media & Soc. 20, 973–989. doi:10.1177/1461444816676645
Ante, L. (2021). Non-fungible token (NFT) markets on the Ethereum blockchain: Temporal development, cointegration and interrelations. SSRN Electron. J. doi:10.2139/ssrn.3904683
Bao, H., and Roubaud, D. (2022). Non-Fungible token: A systematic review and research agenda. J. Risk Financial Manag. 15, 215. doi:10.3390/jrfm15050215
Bonus, H., and Ronte, D. (1997). Credibility and economic value in the visual arts. J. Cult. Econ. 21, 103–118.
Borri, N., Liu, Y., and Tsyvinski, A. (2022). The economics of non-fungible tokens. SSRN Electron. J. doi:10.2139/ssrn.4052045
Bourdieu, P. (1993). The field of cultural production: Essays on art and literature. New York: Columbia University Press.
Boyd, D., and Crawford, K. (2012). Critical questions for big data: Provocations for a cultural, technological, and scholarly phenomenon. Inf. Commun. Soc. 15, 662–679. doi:10.1080/1369118X.2012.678878
Braidotti, C., Colavizza, G., Leiter, A., and Kackovic, M. (2021). The Crypto Art market between artists and collectors.
Brook, O., O’Brien, D., and Taylor, M. (2020). There’s No way that you get paid to do the arts”: Unpaid labour across the cultural and creative life course. Sociol. Res. Online 25, 571–588. doi:10.1177/1360780419895291
Buterin, V. (2013). Ethereum whitepaper. ethereum.org.
Casino, F., Dasaklis, T. K., and Patsakis, C. (2019). A systematic literature review of blockchain-based applications: Current status, classification and open issues. Telematics Inf. 36, 55–81. doi:10.1016/j.tele.2018.11.006
R. Catlow, M. Garrett, N. Jones, and S. Skinner (Editors) (2017). Artists re:thinking the blockchain (England: London: Torque Editions ; Furtherfield). OCLC: ocn988752265.
Cooper, E. (2018). “Cambridge intellectual property and information law” in Art and modern copyright: The contested image. Cambridge, United Kingdom ; New York, NY, USA: Cambridge University Press.
David, G., Oosterlinck, K., and Szafarz, A. (2013). Art market inefficiency. Econ. Lett. 121, 23–25. doi:10.1016/j.econlet.2013.06.033
Day, G. (2014). Explaining the art market’s thefts, frauds, and forgeries (and why the art market does not seem to care). Vanderbilt J. Entertain. Technol. Law 16.
De Filippi, P., Wray, C., and Sileno, G. (2021). Smart contracts. Internet Policy Rev. 10. doi:10.14763/2021.2.1549
De Silva, D. G., Gertsberg, M., and Pownall, R. A. (2016). Market evolution, bidding strategies, and survival of art dealers. SSRN Electron. J. doi:10.2139/ssrn.2866949
Deresiewicz, W. (2020). The death of the artist: How creators are struggling to survive in the age of billionaires and big tech. first edition edn. New York: Henry Holt and Company.
Deuze, M. (2007). Convergence culture in the creative industries. Int. J. Cult. Stud. 10, 243–263. doi:10.1177/1367877907076793
Dowling, M. (2021a). Fertile LAND: Pricing non-fungible tokens. Finance Res. Lett. 44, 102096. doi:10.1016/j.frl.2021.102096
Dowling, M. (2021b). Is non-fungible token pricing driven by cryptocurrencies? Finance Res. Lett. 44, 102097. doi:10.1016/j.frl.2021.102097
Duffy, B. E. (2017). Not) getting paid to do what you love: Gender, social media, and aspirational work. New Haven ; London: Yale University Press. OCLC: ocn961308402.
Ebbers, J. J., and Wijnberg, N. M. (2010). Disentangling the effects of reputation and network position on the evolution of alliance networks. Strateg. Organ. 8, 255–275. doi:10.1177/1476127010381102
Evans, T. (2019). CryptoKitties, cryptography, and copyright. Am. Intellect. Prop. Law Assoc. Q. J. 47.
Findlay, M. (2014). The value of art: Money, power, beauty. revised paperback edition edn. Munich: Prestel.
Fowler, A., and Pirker, J. (2021). “Tokenfication - the potential of non-fungible tokens (NFT) for game development,” in Extended abstracts of the 2021 annual symposium on computer-human interaction in play (ACM: Virtual Event Austria), 152–157. doi:10.1145/3450337.3483501
Fraiberger, S. P., Sinatra, R., Resch, M., Riedl, C., and Barabási, A.-L. (2018). Quantifying reputation and success in art. Science 362, eaau7224. doi:10.1126/science.aau7224
Franceschet, M., Colavizza, G., Smith, T., Finucane, B., Ostachowski, M. L., Scalet, S., et al. (2021). Crypto art: A decentralized view. Leonardo 54, 402–405. doi:10.1162/leon_a_02003
Gandy, O. H. (2021). The panoptic sort: A political economy of personal information. New York, NY: Oxford University Press.
Godart, F. C., and Mears, A. (2009). How do cultural producers make creative decisions? Lessons from the catwalk. Soc. Forces 88, 671–692. doi:10.1353/sof.0.0266
Grannemann, H., and Whitaker, A. (2019). Artists’ royalties and performers’ equity: A ground-up approach to social impact investment in creative fields. Cult. Manag. Sci. Educ. 3, 33–52. doi:10.30819/cmse.3-2.02
Haber, S., and Stornetta, W. S. (1991). How to time-stamp a digital document. J. Cryptol. 3, 99–111.
Hanquinet, L. (2017). “Inequalities: When culture becomes a capital,” in The routledge companion to global cultural policy (London: Routledge).
Hartog, J., and Kackovic, M. (2019). On the Idiosyncrasies of the Labour Market for Visual Artists: Striking features, a formal model, and suggestions for further work. LABOUR 33, 162–186. doi:10.1111/labr.12140
Janosov, M., Battiston, F., and Sinatra, R. (2020). Success and luck in creative careers. EPJ Data Sci. 9. doi:10.1140/epjds/s13688-020-00227-w
Juhász, S., Tóth, G., and Lengyel, B. (2020). Brokering the core and the periphery: Creative success and collaboration networks in the film industry. PLOS ONE 15, e0229436. doi:10.1371/journal.pone.0229436
Kackovic, M., and Wijnberg, N. M. (2020). “Artists finding galleries: Entrepreneurs gaining legitimacy in the art market,” in Entrepreneurship theory and practice. doi:10.1177/1042258720950601
Khaire, M. (2017). Culture and commerce: The value of entrepreneurship in creative industries. Stanford, California: Stanford Business Books, an imprint of Stanford University Press.
Khezr, P., and Mohan, V. (2021). Property rights in the crypto age: NFTs and the auctioning of limited edition artwork. SSRN Electron. J. doi:10.2139/ssrn.3900203
Kinsella, E. (2021). Boosted by private sales and NFTs, christie’s made $7.1 billion in 2021—its best results in five years. Artnet News. Artnet.
Kräussl, R., and Tugnetti, A. (2022). Non-Fungible tokens (NFTs): A review of pricing determinants, applications and opportunities. SSRN Electron. J. doi:10.2139/ssrn.4112429
Lotti, L. (2019). The art of tokenization: Blockchain affordances and the invention of future milieus. Media Theory 3 (1), 287–320.
MacDonald-Korth, D., Lehdonvirta, V., and Meyer, E. T. (2018). The art market 2.0: Blockchain and financialisation in visual arts. London, England: The Alan Turing Institute. Tech. rep.
Malik, S., and Phillips, A. (2012). “Tainted love: Art’s ethos and capitalization,” in Contemporary art and its commercial markets. A report on current conditions and future scenarios. Editors M. Lind, and O. Velthuis (Berlin: Sternberg Press), 209–240.
McConaghy, M., McMullen, G., Parry, G., McConaghy, T., and Holtzman, D. (2017). Visibility and digital art: Blockchain as an ownership layer on the Internet. Strateg. Change 26, 461–470. doi:10.1002/jsc.2146
McRobbie, A. (2016). Be creative: Making a living in the new culture industries. Cambridge, UK ; Malden, MA: Polity Press.
Merkel, J. (2019). ‘Freelance isn’t free.’ Co-working as a critical urban practice to cope with informality in creative labour markets. Urban Stud. 56, 526–547. doi:10.1177/0042098018782374
Mittelstadt, B. D., Allo, P., Taddeo, M., Wachter, S., and Floridi, L. (2016). The ethics of algorithms: Mapping the debate. Big Data & Soc. 3, 205395171667967. doi:10.1177/2053951716679679
Mosna, A. (2022). Give art market regulation a chance. Maastricht J. Eur. Comp. Law 29, 304–327. doi:10.1177/1023263X221082509
Murphy, H., and Oliver, J. (2021). How NFTs became a $40bn market in 2021. London, England, UK: Financial Times.
Nadini, M., Alessandretti, L., Di Giacinto, F., Martino, M., Aiello, L. M., and Baronchelli, A. (2021). Mapping the NFT revolution: Market trends, trade networks, and visual features. Sci. Rep. 11, 20902. doi:10.1038/s41598-021-00053-8
Narayanan, A., Bonneau, J., Felten, E., Miller, A., and Goldfeder, S. (2016). Bitcoin and cryptocurrency technologies: A comprehensive introduction. Princeton: Princeton University Press.
Ølnes, S., Ubacht, J., and Janssen, M. (2017). Blockchain in government: Benefits and implications of distributed ledger technology for information sharing. Gov. Inf. Q. 34, 355–364. doi:10.1016/j.giq.2017.09.007
Plattner, S. (1998). A most ingenious paradox: The market for contemporary fine art. Am. Anthropol. 100, 482–493. doi:10.1525/aa.1998.100.2.482
Potts, J., and Rennie, E. (2019). “Web3 and the creative industries: How blockchains are reshaping business models,” in A research agenda for creative industries (Cheltenham [England] ; Northampton, MA: Edward Elgar Publishing), 93–111. doi:10.4337/9781788118583.00013
Prinz, A., Piening, J., and Ehrmann, T. (2015). The success of art galleries: A dynamic model with competition and information effects. J. Cult. Econ. 39, 153–176. doi:10.1007/s10824-014-9217-2
Savelyev, A. (2018). Copyright in the blockchain era: Promises and challenges. Comput. Law Secur. Rev. 34, 550–561. doi:10.1016/j.clsr.2017.11.008
Schten, A. (2017). No more starving artists: Why the art market needs a universal artist resale royalty right. Notre Dame J. Int. Comp. Law 7.
Sidorova, E. (2019). The cyber turn of the contemporary art market. Arts 8, 84. doi:10.3390/arts8030084
Siebert, S., and Wilson, F. (2013). All work and no pay: Consequences of unpaid work in the creative industries. Work, Employ. Soc. 27, 711–721. doi:10.1177/0950017012474708
Sommerer, C., and Mignonneau, L. (2017). “The economy of attention. Transforming user attention into monetary value,” in Investigations on the cultural economy of media art. Editor A. Chierico (Milano, Italy: Digicult Editions), 60–69.
Tapscott, D., and Tapscott, A. (2017). “Blockchain could help artists profit more from their creative works,” in Harvard business review.
Throsby, D. (1994). The production and consumption of the arts: A view of cultural economics. J. Econ. Literature 32, 1–29.
R. Towse, and T. Navarrete Hernández (Editors) (2020). Handbook of cultural economics. third edition edn (Cheltenham [England] ; Northampton, MA: Edward Elgar Publishing).
van Haaften-Schick, L., and Whitaker, A. (2021). From the artist’s contract to the blockchain ledger: New forms of artists’ funding using equity and resale royalties. SSRN Electron. J. doi:10.2139/ssrn.3842210
van Miegroet, H. J., Alexander, K. P., and Leunissen, F. (2019). Imperfect data, art markets and Internet research. Arts 8, 76. doi:10.3390/arts8030076
Vasan, K., Janosov, M., and Barabási, A.-L. (2022). Quantifying NFT-driven networks in crypto art. Sci. Rep. 12, 2769. doi:10.1038/s41598-022-05146-6
Velthuis, O. (2011). “Art markets,” in A handbook of cultural economics. Editor R. Towse (Cheltenham [England] ; Northampton, MA: Edward Elgar Publishing). doi:10.4337/9781781008003
Velthuis, O., and Coslor, E. (2012). “The financialization of art,” in The oxford handbook of the sociology of finance. Editors K. K. Cetina, and A. Preda (Oxford, UK: Oxford University Press). doi:10.1093/oxfordhb/9780199590162.013.0025
Velthuis, O. (2012). “The contemporary art market between stasis and flux,” in Contemporary art and its commercial markets: A report on current conditions and future scenarios. Editors O. Velthuis, and M. Lind (Berlin: Sternberg Press), 17–50.
von Wachter, V., Jensen, J. R., Regner, F., and Ross, O. (2022). NFT Wash Trading: Quantifying suspicious behaviour in NFT markets. ArXiv:2202.03866 [cs].
Wang, Q., Li, R., Wang, Q., and Chen, S. (2021). Non-Fungible token (NFT): Overview, evaluation, opportunities and challenges. ArXiv: 2105.07447.
Whitaker, A. (2019). A primer, history, and taxonomy of blockchain use cases in the arts. Artivate 8, 21–46.
Whitaker, A. (2018). Artist as owner not guarantor: The art market from the artist’s point of view. Vis. Resour. 34, 48–64. doi:10.1080/01973762.2018.1435609
Whitaker, A., Bracegirdle, A., de Menil, S., Gitlitz, M. A., and Saltos, L. (2021). Art, antiquities, and blockchain: New approaches to the restitution of cultural heritage. Int. J. Cult. Policy 27, 312–329. doi:10.1080/10286632.2020.1765163
Whitaker, A., and Kräussl, R. (2020). Fractional equity, blockchain, and the future of creative work. Manag. Sci. 66, 4594–4611. doi:10.1287/mnsc.2020.3633
Wijnberg, N. M., and Gemser, G. (2000). Adding value to innovation: Impressionism and the transformation of the selection system in visual arts. Organ. Sci. 11, 323–329. doi:10.1287/orsc.11.3.323.12499
Williams, O. E., Lacasa, L., and Latora, V. (2019). Quantifying and predicting success in show business. Nat. Commun. 10, 1–10. doi:10.1038/s41467-019-10213-0
Wright, A., and De Filippi, P. (2015). Decentralized blockchain technology and the rise of lex cryptographia. SSRN Electron. J. doi:10.2139/ssrn.2580664
Xu, M., Chen, X., and Kou, G. (2019). A systematic review of blockchain. Financ. Innov. 5, 27. doi:10.1186/s40854-019-0147-z
Yermack, D. (2017). Corporate governance and blockchains. Rev. Finance 21, 7–31. doi:10.1093/rof/rfw074
Keywords: art, NFT art, network analysis, nFTS, social networks (online)
Citation: Colavizza G (2023) Seller-buyer networks in NFT art are driven by preferential ties. Front. Blockchain 5:1073499. doi: 10.3389/fbloc.2022.1073499
Received: 18 October 2022; Accepted: 21 November 2022;
Published: 19 January 2023.
Edited by:
Andrea Pizzoferrato, University of Bath, United KingdomReviewed by:
Martin Zeilinger, Abertay University, United KingdomCopyright © 2023 Colavizza. This is an open-access article distributed under the terms of the Creative Commons Attribution License (CC BY). The use, distribution or reproduction in other forums is permitted, provided the original author(s) and the copyright owner(s) are credited and that the original publication in this journal is cited, in accordance with accepted academic practice. No use, distribution or reproduction is permitted which does not comply with these terms.
*Correspondence: Giovanni Colavizza, Zy5jb2xhdml6emFAdXZhLm5s
Disclaimer: All claims expressed in this article are solely those of the authors and do not necessarily represent those of their affiliated organizations, or those of the publisher, the editors and the reviewers. Any product that may be evaluated in this article or claim that may be made by its manufacturer is not guaranteed or endorsed by the publisher.
Research integrity at Frontiers
Learn more about the work of our research integrity team to safeguard the quality of each article we publish.