- 1Center of Enterprise Development, School of Management and Law, Zurich University of Applied Sciences (ZHAW), Winterthur, Switzerland
- 2University of Zurich (UZH) Blockchain Center and University Research Priority Program (URPP) Social Networks, Business Administration, University of Zurich, Zurich, Switzerland
- 3Centre for Blockchain Technologies, University College London, London, United Kingdom
This study covers the evolutionary development of blockchain technologies over the last 11 years (2009–2019) and sheds lights on potential areas of innovation in heretofore unexplored sub-components. For this purpose, we collected and analyzed detailed data on 107 different blockchain technologies and studied their component-wise technological evolution. The diversity of their designs was captured by deconstructing the blockchains using the Tasca-Tessone taxonomy to build what we call the “tree of blockchain” composed of blockchain main and sub-components. With the support of information theory and phylogenetics, we found that most design explorations have been conducted within the components in the areas of consensus mechanisms and cryptographic primitives. We also show that some sub-components like Consensus Immutability and Failure Tolerance, Access and Control layer, and Access Supply Management have predictive power over other sub-components. We finally found that few dominant design models—the genetic driving clusters of Bitcoin, Ethereum, and XRP—influenced the evolutionary paths of most of the succeeding blockchains.
1. Introduction
Blockchains1 are composed of a variety of multiple components that ultimately characterize them. The landmark paper of Nakamoto (2008) introducing a peer-to-peer electronic cash system—namely Bitcoin—was the starting point for a broad range of blockchain technologies we evince today. The innovative aspect of Bitcoin was an unprecedented combination of pre-existing components. Indeed, blockchains mix technologies and concepts such as triple-entry accounting (Ibañez et al., 2020), cryptographic signatures or consensus algorithms. As such, it is natural to categorize all blockchain technologies based on the specific selection of these components. As of this writing, a multitude of different blockchain technologies exist, therefore researchers have proposed several approaches to classify them in taxonomies (e.g., Xu et al., 2017; Ballandies et al., 2018; Sarkintudu et al., 2018; Tasca and Tessone, 2019). For a detailed discussion of these blockchain taxonomies, we refer to Ballandies et al. (2018) who created an nice overview on different taxonomies. While all taxonomies take into account some important components (in some cases with some level of overlap), the most comprehensive approach is given by Tasca and Tessone (2019) as they include the highest number of attributes (30) among all taxonomies. Their fine-grained taxonomy can be seen as an overarching framework including many components proposed by other researchers. Its rich specifications allow for a detailed data analysis. Therefore, throughout this paper, we will apply the Tasca-Tessone (TT) Blockchain Taxonomy.
So far, research has mainly focused on the creation of these classification schemes. However, taxonomies turn into useful instruments only when data of real-world applications is collected and the taxonomy applied on them. Drawing inspiration from the field of biology, taxonomies cannot be just used to classify organisms—akin to technologies, in this context—, but also to explore the evolutionary dynamics that has led to their emergence. For example, the introduction of FORTRAN as first high-level general purpose programming language has fueled not only the invention of a multitude of new programming languages, but also the development of new hardware and software (Zimmermann, 2017). Similar effects may be observable in blockchains: Innovation in a blockchain component may cause the emergence of new designs in other components of the technology, thereby creating new classes of blockchain technologies.
To better understand this evolutionary dynamics, we apply the TT Blockchain Taxonomy on a comprehensive dataset of 107 different blockchains. We make use of appropriate methodological tools to unveil how they have evolved over the last 11 years, from 2009 to 2019: by calculating the entropy of different blockchain components, we can measure the innovation that took place within these components. Furthermore, we explore with mutual information the dependencies among the components. We use phylogenetic methods to study the evolution of the technology.
Our approach allows us to compare the instantiations of the technology and examine the relative innovation within different blockchain components. The insights derived from our analysis are specifically important given the current variety of blockchain architectures, which—in turn—is a direct consequence of the different technological innovation paths followed by their individual components.
Based on these insights, we create the tree of blockchain to shed light on the innovation within different components. This allows us to answer the following research questions: Which components drive the innovation in blockchain technologies? and Have some components co-evolved?
By answering these research question, we make the following contributions:
1. By applying the TT-taxonomy to real data, we demonstrate its usefulness and create a first overview on the state of blockchain technologies.
2. We present an innovative methodological approach to measure the innovation and the evolution of blockchain technologies.
3. We show that most of the innovation took place in a few components and many others are not yet explored. Furthermore, some components have co-evolved.
4. The evolutionary analysis points out that some early blockchains have laid out the design path for later technologies.
5. We provide a large data sample on 107 blockchain technologies which is publicly available for other researchers.
The paper is organized as follows: In section 2, we briefly recap the taxonomy. After, in section 3, we introduce our methodology. Section 4 presents the results from the analysis. Section 5 concludes.
2. Taxonomy
The taxonomy introduced by Tasca and Tessone (2019) compartmentalizes the blockchain components and establishes the relationships between them in a hierarchical manner. They adopt a reverse-engineering approach to unbundle the blockchains and divide them into main (coarse-grained) components. Each main component is then split into more (fine-grained) subcomponents and sub-subcomponents (where necessary). For each of these sub-components (and/or sub-sub-components), some layouts are identified and compared. The next eight subsections will resort on the TT Blockchain Taxonomy and will introduce additional layouts for the sub-components (and possibly sub-sub-components) that will be subject to our temporal evolution analysis.
2.1. Consensus
The Consensus component relates to the set of rules and mechanics that allow the maintenance and the update of the ledger and that guarantee the trustworthiness of the records in it, i.e., their reliability, authenticity, and accuracy (Bonneau et al., 2015). It encompasses the following sub-components: (1) Consensus Network Topology which describes the type of interconnection between the nodes and the type of information flow between them for transaction and/or for the purpose of validation. It can be centralized, decentralized, hierarchical. (2) Consensus Immutability and Failure Tolerance that encompasses a consensus mechanism to ensure that every node keeps its version of the full transaction history consistent with the other peers. Its possible layouts are: dPoS/PoW/DAG/PoS/Hybrid/PoU/BFT/PoW, DAG/dPoW/PoI/PoET/PoA/SCP/other. (3) Gossiping, defining how information travels through from one node to another. It can be Local, global. (4) Consensus Agreement consisting of (4.1) Latency which describes the rule of message propagation in the networks with values: Synchronous/asynchronous/not known, and (4.2) Finality, describing whether information intended to be stored in a blockchain can be safely considered perpetually stored once the recording is performed. Its values are: Deterministic/non-deterministic.
2.2. Transaction Capabilities
The Transaction Capabilities component is important to illustrate scalability of transactions and usability in possible applications and platforms. Its sub-components are: (1) Data Structure in the Blockheader, (2) Transaction Model that determines how the nodes store and update the user information in the distributed ledger. Its layouts can be: UTXO, traditional ledger, tangle, Message-based. (3) Server Storage which can be different among nodes: those which do not store the information fully are “thin clients” connected to the peer-to-peer network (Xu et al., 2018). Therefore, there are full nodes only, thin nodes. (4) Block Storage describing which information is stored in the blockchain with the layouts transactional data, user balance, transactional data and user balance. (5) Limits to Scalability.
2.3. Native Currency/Tokenization
Thus far, the financial and monetary features have been the most explored and applied blockchain properties. In particular, cryptocurrencies are generally used as incentive mechanism to encourage the participation in the verification process of the data stored. The sub-components include: (1) Native Asset which identifies the native asset (in the form of native coins or crypto-tokens) is implemented on top of the blockchain. Possible values are: Own cryptocurrency, convertible multiple assets, none. (2) Tokenization which identifies whether the possibility to create tokens that act as a digital bearer bond whose ownership is determined by data embedded in the blockchain and may include payment, utility, or hybrid tokens; possible values include: Present, present through third-party addons, none. (3) Asset Supply Management, specifies the policy of asset creation; its possible values are Limited-deterministic, unlimited-determininistic, non-deterministic, pre-mined.
2.4. Extensibility
The future ecosystem of the blockchain network and the integration possibilities of variety of blockchain related technologies is determined by the following sub-components forming the component Extensibility: (1) Interoperability illustrating the overall capability of blockchains to exchange information with other systems, outside of blockchains. Its layouts are: explicit interoperability, implicit interoperability, none. (2) Intraoperability illustrating the overall capability of blockchains to exchange information with other blockchains with layouts: Explicit intraoperability, implicit intraoperability, none. (3) Governance rules being crucial for the successful implementation of the blockchains and for their capability to adapt, change and interact. Its layouts are: Open-source community, alliance, technical leading house. (4) Script Language describing the flexibility of the scripting language to modify the conditions under which certain information (e.g., transactions) will be included into the public record (smart contracts). The layouts are: Turing complete, generic non-turing complete, application-specific non-turing complete, non-turing complete + external.
2.5. Security and Privacy
Security and privacy principles apply to any ICT system containing or processing PII, including blockchain systems. The Security and Privacy component consists of the following sub-components: (1) Data Encryption consisting of (1.1) Hashing that is used all over in blockchain technologies, e.g. for chaining blocks together, in the consensus mechanism and in address generation. Its layouts are: Equihash, SHA3, SHA2, SHA2 + RIPEMD160, Scrypt, CryptoNight, SHA3 + BLAKE, BLAKE, X11, SHA256 + RIPEMD160, Groestl, Kerl, CryptoNight + SHA3, SHA3 + Skein, SHA2 + Scrypt, SHA2 + BLAKE, Combination. (1.2) Signature which is necessary for participants of blockchain systems to authorize transactions. Its layouts are: Ed25519, ECDSA, ECDSA + Ed25519, Schnorr, BLS, W-OTS, RingCT, EC-KCDSA, ECDH, Redjubjub, Combination. (2) Data Privacy involving several alternative solutions to balance the trade-off between a decentralized peer-validate system and the security and privacy of information with the layouts: Built-in data privacy, add-on data privacy, data privacy by third party systems, no data privacy.
2.6. Codebase
The codebase delivers information about the challenges developers could face and about possible changes of the underlying programming language. Codebase is structured in three sub-components: (1) Coding Language, (2) Code License illustrating the possibility of changes to the source code of the underlying technology. Its layouts are: Open source, closed source. (3) Software Architecture.
2.7. Identity Management
The component Identity Management ensures secure access to sensitive data to establish a suitable governance model for the blockchain. It consists of two sub-components: (1) Access and Control Layer referring to Blockchains having different permissions according to which access and control to data is allowed. Its layouts are: Public blockchain, permissioned private blockchain, permissioned public blockchain. (2) Identity Layer describing the fact that the on-boarding and off-boarding of nodes/entities to the blockchain networks are handled differently by the various software solutions. It can be: Anonymous, pseudonymous, KYC/AML.
2.8. Charging and Rewarding System
Blockchain systems incur operational and maintenance costs that are generally absorbed by the network participants. The Charging and Rewarding System main component is structured in: (1) Reward System which illustrates the rewarding mechanisms designed to compensate active members contributing to data storage or transaction validation and verification. Its layouts are: Lump-sum reward, block + security reward. (2) Fee System consisting of: (2.1) Fee Reward describing the kind of rewards provided directly by the users to other participants for any request in the network for storage, data retrieval, or computation and validation. Its layouts are: Optional fees, mandatory fees, no fees. (2.2) Fee Structure describing the nature of the fees that users are required to contribute when using a blockchain. They can be: Variable fees, fixed fees.
3. Methodology
3.1. Data
The dataset includes 107 technologies (cf. Table A1). The sample contains a variegated sample of blockchain technologies introduced in the period 2009–2019. Each technology data set contains 25 sub-components (or sub-sub-components), where we could find 84.34% of the overall data. We excluded 4 sub-components of the TT Blockchain Taxonomy (Data Structure in the Blockheader, Limits to Scalability, Coding Language, Software Architecture as they are either subjective or not enough data is available. Additionally, we included the log10 of the total supply (Total Supply Log) as a sub-component for the Native Currency/Tokenization component. For a detailed description of the dataset and the sub-components (sub-sub-components), we refer to Figure A1.
The data collection was crowd-sourced, and each technology was randomly assigned to students from the University of Zurich, Zurich University of Applied Sciences and École Polytechnique Fédérale de Lausanne. To cross-check the results, some of the technologies were assigned more than once. Eventually, the quality and correctness of the whole dataset was diligently checked and validated by ourselves.
3.2. Information Theoretic Analysis
In order to analyse the information contained in the data, we apply Shannon's information theory (Shannon, 1948). We calculate the entropy of each sub-component (resp. sub-sub-component) defined here with S. The entropy measures the amount of information present in the realizations of a random variable. If a high-probability event occurs, little is leart about the random variable and the entropy is low. If a rare event occurs, the amount of information (surprisal) is high. In Biology, researchers call the entropy Shannon-Index and use it to measure biodiversity (Spellerberg and Fedor, 2003). Instead of probabilities, they use the relative frequency of a species. Similarly, if we calculate the entropy using the relative frequency of the sub-components' realized layouts in our sample, we can measure innovation. When a new layout emerges, the entropy of the sub-component will increase, since new information is conveyed. For a sub-component S with n realized layouts x ∈ X, the entropy is defined as
where p(x) is the probability mass of layout x. We normalize the entropy by dividing it through the maximum entropy log2(n).
We also calculate the mutual information between the sub-components to measure how they are related to each other. The mutual information measures the amount of information about a variable contained in another. It is a more general measure than correlation capturing also non-linear dependencies. In our specific context, it is able to determine whether two layouts from different components tend to occur jointly (or also in an anti-correlated fashion) in blockchain systems. For sub-components S1 with n layouts x ∈ X and S2 with m layouts y ∈ Y, the mutual information is given by
We further use the normalized version given by
3.3. Temporal Evolution
Our analysis of the temporal evolution of blockchain technologies borrows methods from pyhologenetics: a branch of biology that studies the evolutionary relationships between individuals or group of organisms. We construct the tree of blockchain with the R-packages metacoder (Foster et al., 2017) and taxa (Zachary et al., 2018) used in the evolutionary analysis of microbiota—microorganisms hosted by humans, animals, and plant. Similarly, blockchain technologies also "host" (rather consist of) several (micro-) components. As a consequence, these frameworks are suitable to visualize the blockchain components and their layouts. Another pivotal tool to show the formation of species already used by Charles Darwin (Darwin, 1859) is an evolutionary tree. There exists several types of evolutionary trees. We make use of a chronogram tree and a dendrogram. For constructing the chronogram, we derive the ancestors of a blockchain technology and the timing of branching from the data. While some blockchain technologies are novel inventions created from scratch, many others have "forked" off pre-existing blockchain architectures. Taking this fact into consideration, a chronogram tree where even the internal taxonomic units (nodes) can be annotated can easily be recovered and plotted with the R-packages treeio (Wang et al., 2019) and ggtree (Yu et al., 2017). For the construction of the dendrogram, we take the genetic similarities into account. We construct a hierarchial clustering dendrogram from the data. In the dataset, each row represents a blockchain technology and each column a sub-component. From this, we calculate a dissimilarity matrix of genetic distances (see Figures A2–A4). As we have nominal variables, we use the algorithm of Gower (1971). The dissimilarity dij between two rows i and j is calculated as follows:
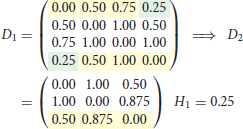
where is 0 or 1, and only 0 if either one or both layouts in rows i or j are missing. The dissimilarity contribution is 1 if the layouts of the two rows are different, otherwise 0. The resulting dissimilarity matrix with the entries dij ∈ [0, 1] can be used to construct a dendrogram. We use the UPGMA (unweighted pair group method with arithmetic mean) algorithm—a simple, yet effective hierarchical clustering method. We selected the UPGMA algorithm since with UPGMA each genetic distance in the dissimilarity matrix contributes equally to the final result. Starting with the N × N dissimilarity matrix, we combine the two nearest blockchain technologies into a new high-level cluster. Afterwards, we eliminate the two corresponding rows in the dissimilarity matrix and add a new row corresponding to the newly formed cluster. The new dissimilarities between the new cluster and the other blockchain technologies are calculated as the proportional averages of the two eliminated dissimilarities rendering a (N − 1) × (N − 1) matrix. These steps are repeated until when we remain with a single cluster—the root of the dendrogram. In the following, we illustrate the procedure in a simple example with four elements. After three steps, we arrive at the dendrogram shown in Figure 1.
1. Step
2. Step

3. Step

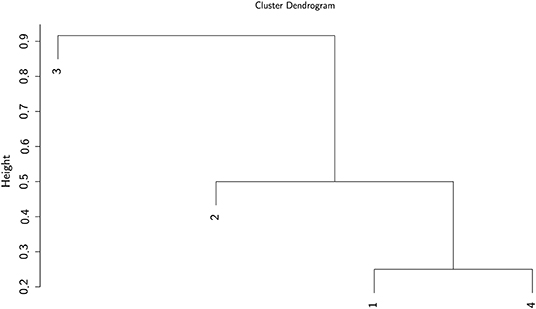
Figure 1. Example of a dendrogram. Elements 1 and 4 are clustered together, followed by 2 and then 3.
4. Results
4.1. Innovation Dynamics
Blockchain technologies have undergone an extensive innovation during the last few years, but not all their components have benefited from the same rates of innovation. Figure 2 shows the tree of blockchain. The tree represents the data set by displaying all different layouts and their frequency across the technology. The tree nicely illustrates how some sub-components seem to follow quite stable designs. For example, not many technologies have experimented with the network topology, the latency or the codebase sub-components. By contrast, other sub-components are in an exploratory state. In particular, many innovation have been carried out for the immutability and failure tolerance sub-component. Some technologies have also innovated on the cryptographic building blocks, even though SHA-2 (resp. SHA-3) based hashing and ellipic curve digital signature algorithms are still the most used schemes. On the level of the components, it is not clear where the most innovation has happened as the dynamics in the sub-components seem quite heterogeneous.
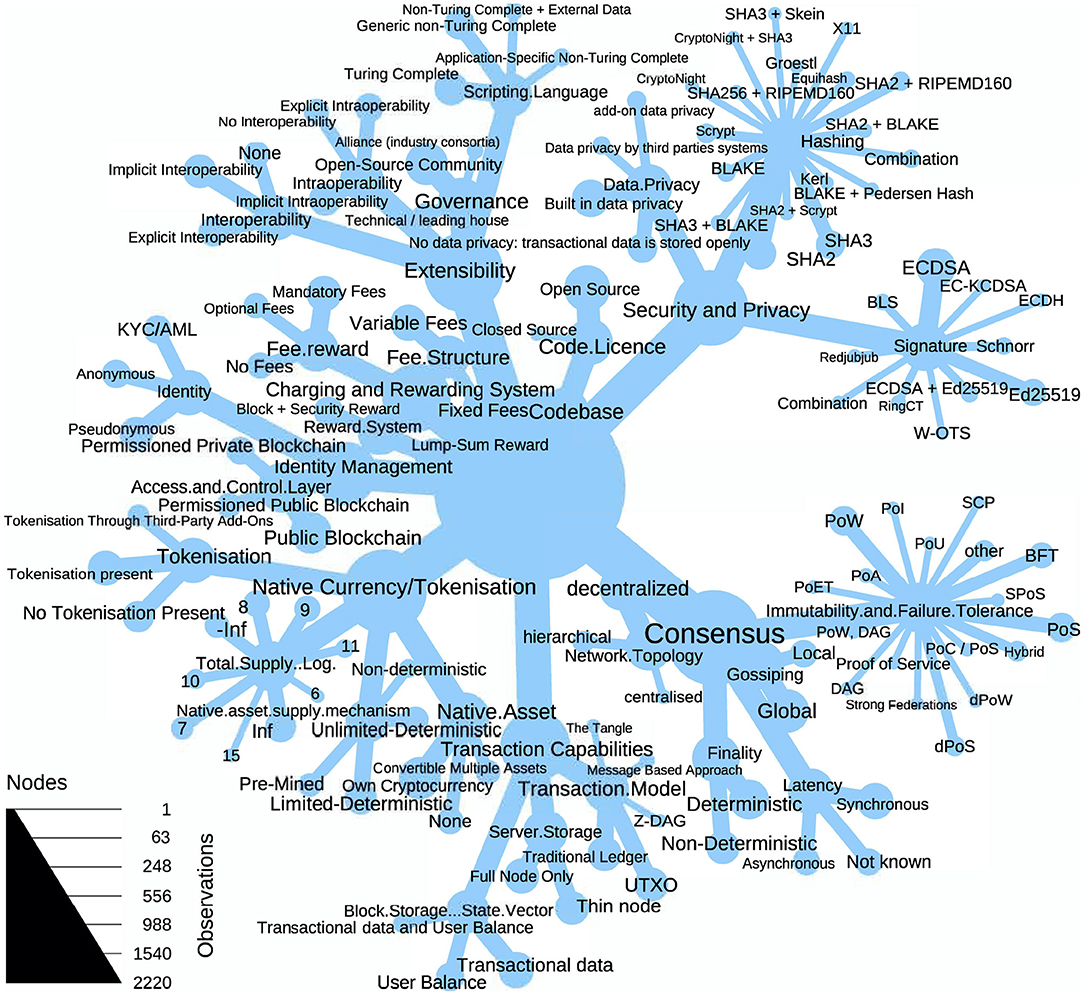
Figure 2. The tree of blockchain illustrates the varying innovation activity within the components. The nodes represent the observations in the (sub)components and the links the connection to the sub-components resp. layouts.
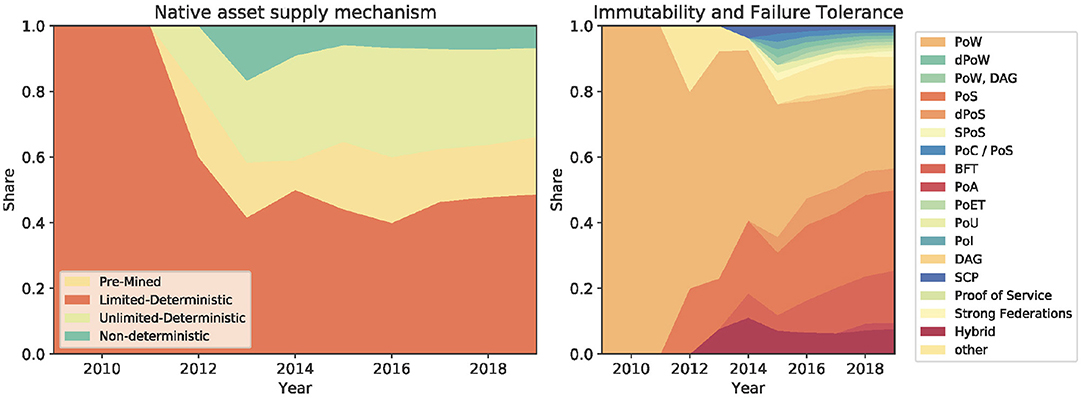
The technological innovation of blockchains is mainly driven by consensus-, security-, and supply-related sub-components while some basic principles have remained unchanged. The entropy—and thereby the surprisal effect—of the sub-components is shown in Figure 3. The highest innovation activity took place within the immutability and failure tolerance sub-component followed by the hashing algorithm. Many cryptocurrencies have also experimented with the total monetary supply, even though there is usually no clear economic foundation behind these monetary policies. The high entropy of the asset supply mechanism sub-component indicates that there is not yet a preferred solution. Similarly, the consensus mechanism is an active sub-component where innovation is still ongoing (Cachin and Vukolić, 2017; Mingxiao et al., 2017). The original ideas of the proof-of-work algorithm have been adjusted and many new layouts such as proof-of-stake, proof-of-elapsed-time, or byzantine-fault tolerance have been applied in blockchains. Most other sub-components have experienced only moderate innovation: This suggests that many of the basic design choices of the original Bitcoin architecture have been inherited. In fact, some of the most important blockchain layouts, such as the decentralized network topology and the open source code license, have barely been challenged by alternative solutions. Going back to the asset supply mechanism, we can observe from Figure 4 that from 2009 to 2012 the limited-deterministic supply layout was the only one. However, after 2012 other layouts (pre-minded, non-deterministic, unlimited-deterministic) started to become popular pushing to a higher entropy toward the end of 2019. Also the immutability and failure tolerance sub-component followed an innovation path similar to the asset supply mechanism. It started in 2009 with a single layout (proof-of-work) and soon after alternative layouts (e.g., proof-of-stake, DAG, etc) did evolve. The consensus is a central part of each blockchain system, and the current high entropy suggests that there is no dominant design yet—even though proof-of-work is still the most used algorithm. See Figure 4.
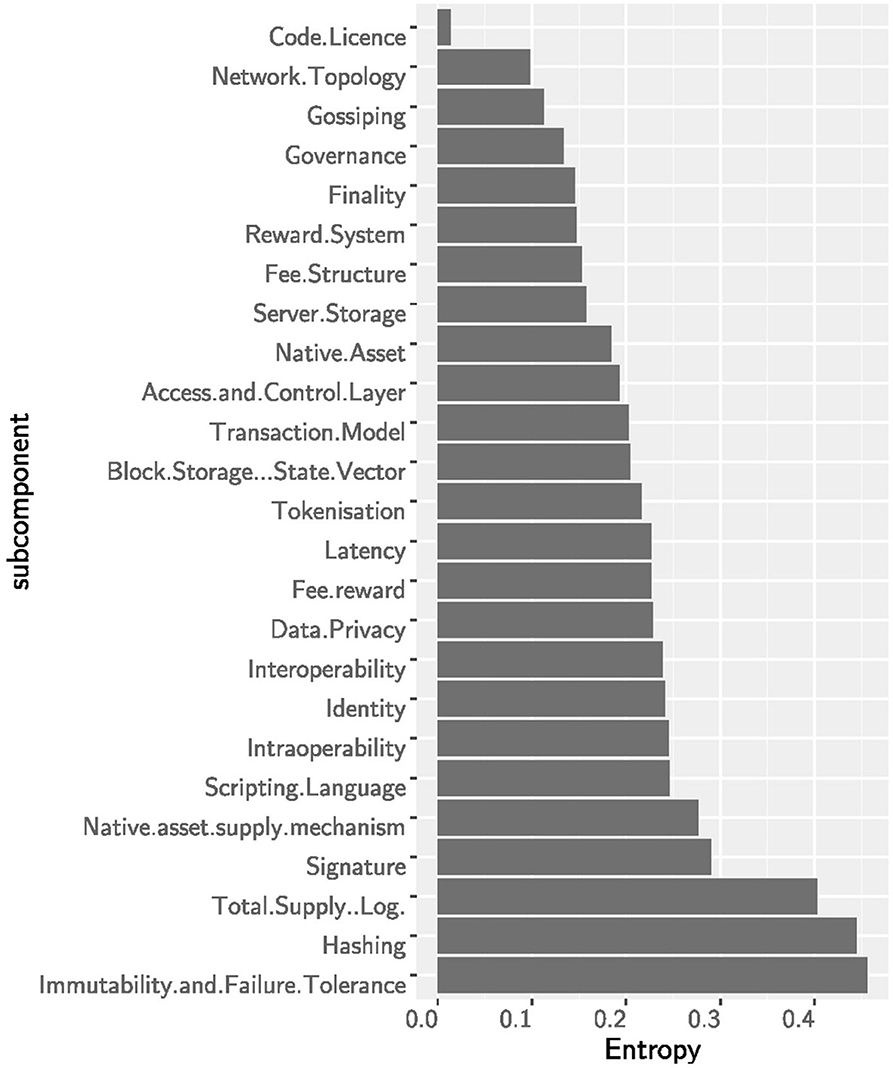
Figure 3. The entropy for the (sub)components: immutability and failure tolerance, the security subcomponents and total supply show the largest entropy. Within these, many new designs have emerged along the sample period.
The design of a sub-component contains information about the design of the other sub-components. This implies that certain design choices might emerge jointly. To measure this mutual dependency, we analyse the mutual information of the sub-components. In Figure 5 the sub-components are sorted by the sum of mutual information they share with other sub-components. This gives us a hint about the predictive power of a sub-component in a blockchain system. Again, the consensus, the security and the total supply contain a lot of information on other sub-components. This means that if we know the layouts of these information-carrying sub-components, we are able to infer the design of other sub-components. Similarly, the access and control layer holds a lot of information about the other sub-components. This comes not much as a surprise because there exist important fundamental differences between public and permissioned blockchains. In general, permissioned blockchains do not have native assets and as such also use different consensus mechanisms—not based on monetary incentives—than public infrastructures. The low cumulative mutual information of the native asset supply mechanism (despite the high entropy) consolidates the impression that the monetary policy of blockchain technologies is not a design choice based on fundamentals. Interestingly, the scripting language seems also quite indicative for the design of other sub-components. The ability of the scripting language defines whether a blockchain is able to run smart contracts which in turn implies many specific design choices. To continue, we observe a strong dependency between the access and control layer and the native asset sub-components, mainly due to the fact that the lack of a native cryptocurrency implies a permissioned infrastructure. The strong dependency between total supply and consensus is also influenced by permissioned blockchains: a total supply of zero usually implies BFT consensus. But the dependency between total supply and consensus is amplified by some design choices of permissionless blockchains. For example, a supply of 21 million as in Bitcoin generally implies PoW. Similar trivial effects are at play between the total supply and the supply mechanism (e.g., an infinite supply requires a unlimited supply mechanism). Finally, we observe a rather strong dependency between the transaction model and the supply mechanism. We argue that this is not an obvious relationship and it deserves to be investigated in further studies. Differently, intra- and interoperability tend to be implemented together but this relationship seems to be more obvious.
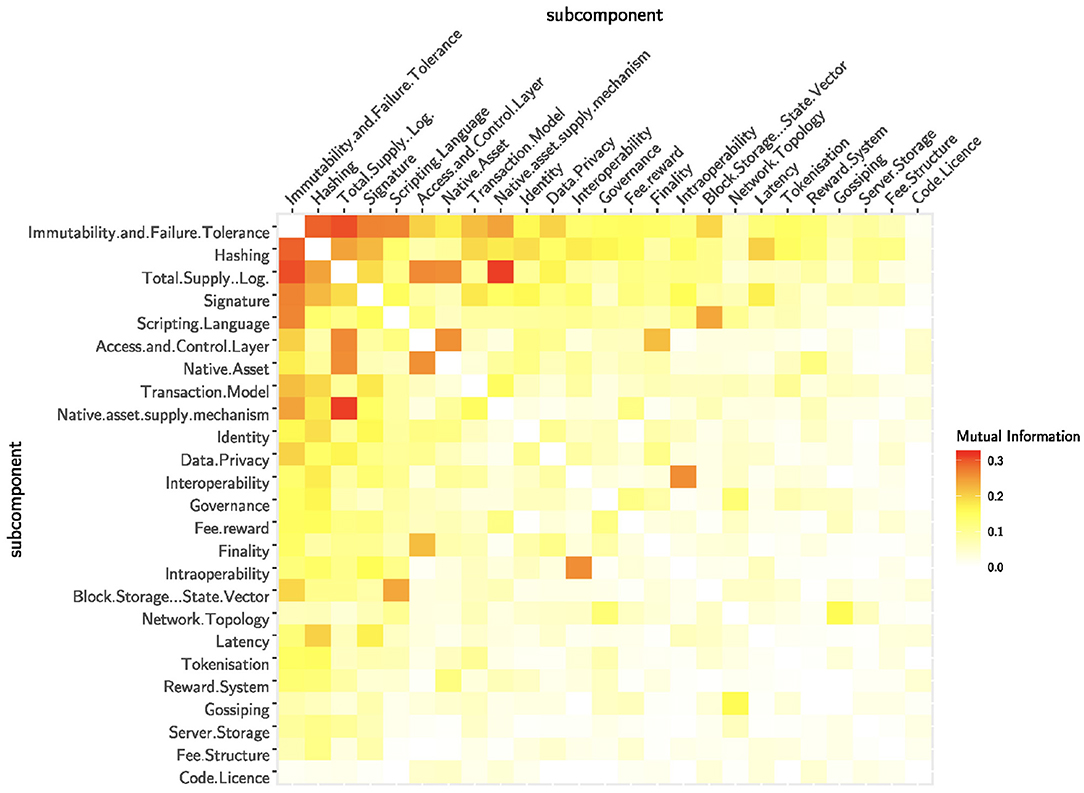
Figure 5. The normalized mutual information measures the dependencies between the sub-components. The sub-components are ordered by the total amount of mutual information.
As shown in Table 1, the results of our analysis are robust. Kendall's τ is calculated between the full sample and the bootstrapped versions for the ranking of the entropy and the ranking of the summed mutual information of the sub-components. Kendall's τ is high even for half the sample size and Kendall's test shows a significant dependence for all sub-sample sizes.
4.2. Evolutionary Analysis
In this Section we examine the temporal evolution of the blockchain components over the last 11 years (2009–2019).
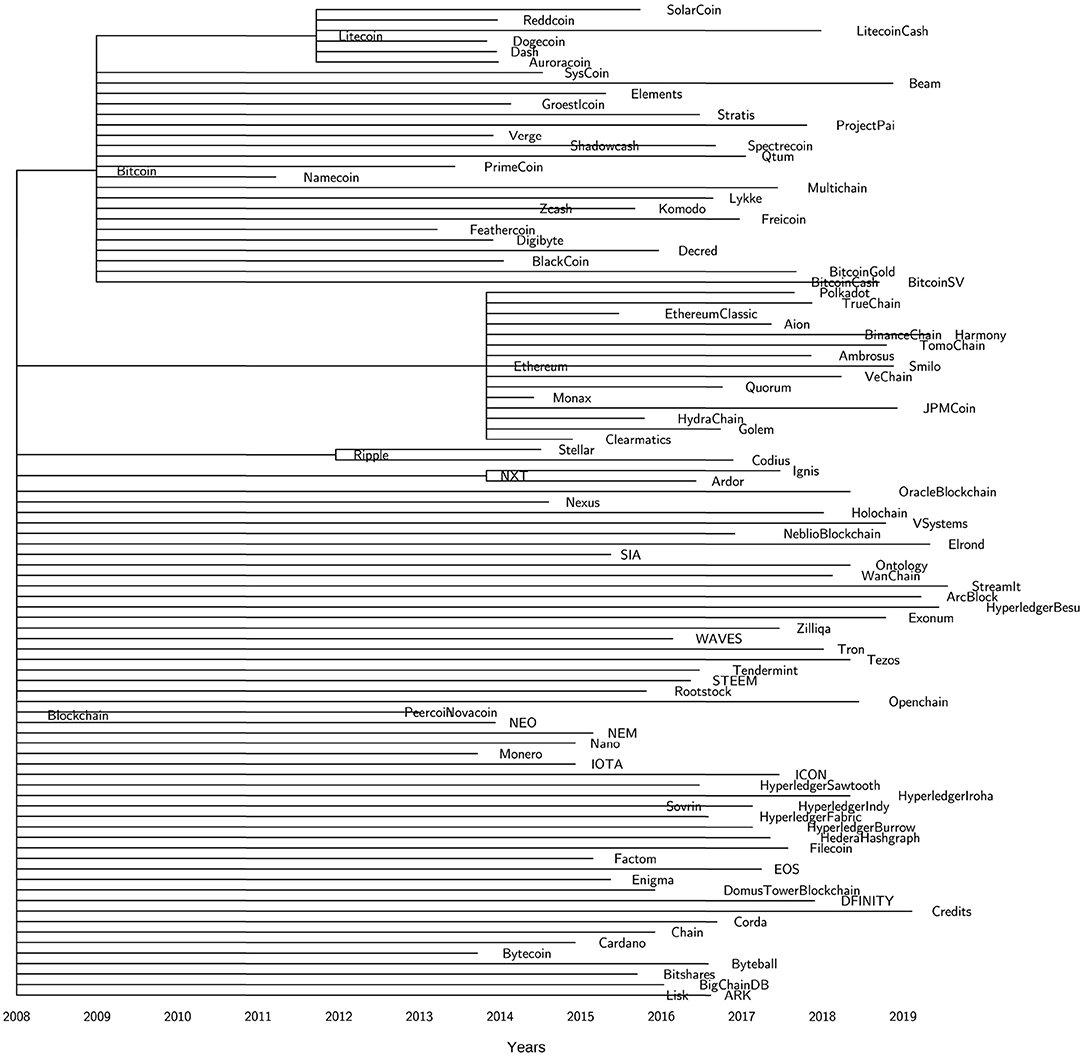
Figure 6 helps us to map over time the technology life cycle of the blockchain architectures. We observe two phases. The first phase of "technological discontinuity" (2009-2013) is characterized by revolutionary breakthrough innovations: Bitcoin, Litecoin2, XRP3, Peercoin4, Novacoin5. Bitcoin was the first-ever blockchain innovation which originated in October 2008 when the Satoshi Nakamoto whitepaper appeared in the cypherpunk mailing list. However, the genesis block was not mined until the 3rd of January 2009. As shown in the chronogram tree (Figure 6), Bitcoin was the only implemented blockchain technology for the first few years. In the meantime, the community started to think about some alternative innovations that for a while remained at the idea level only. In 2011, two Bitcoin software forks were implemented and deployed in the market, namely, Litecoin and Namecoin6. But we had to wait until 2012 to see the deployment of the first-ever Bitcoin-independent blockchain technology: XRP. While Namecoin did not lead to any further developpment, both Litecoin and XRP inspired further technologies as Dogecoin7 (Litecoin spinoff) or Stellar8 (XRP spinoff) for example. The next large innovation wave called "era of ferment" (2014-Today), ignited by Ethereum9, is characterized by technological rivalry, competitions and technological uncertainty. The Ethereum smart contract concept led to many descendants, but also to the development of a wide range of independent platforms with smart contract capabilities. Only recently, alternative architectures have started to come up (IOTA10 being the early exception) such as Tendermint11, Byteball12 and Hedera Hashgraph13. In particular, the first permissioned blockchains emerged in 2016, mainly driven by the Hyperledger14 initiative but also Corda15. Interestingly, the practice of software forks does not seem common in permissioned frameworks (or at least they are not publicly communicated). An exception are the private forks of Ethereum, for example Quorum16.
If we zoom into the taxonomy of Tasca and Tessone (2019), we could replicate the same analysis of the technology life cycle for all the blockchain sub-components. As an example, we take into consideration the sub-component immutability and failure tolerance. Figure 7 helps us to map over time its technology life cycle. In particular, we can observe three phases. Also in this case, we observe a first initial phase of "technological discontinuity" (2009-2013) characterized by revolutionary breakthrough innovations: the proof-of-work deployed in January 2009, the Ripple Consensus Algorithm (RPCA) in early 2012, the proof-of-stake mechanism deployed with Peercoin in mid 2012 and the hybrid consensus of Novacoin in 2013. Differently from the previous analysis, the second phase of technological rivalry seems to be already concluded (2014-2017). This phase reached a peak in 2015 with the larger number of new consensus mechanisms brought to the market (dPOS, DAG, PoC, etc.). Since 2018 we entered the phase of "dominant design" (2018-Today) characterized by less innovation and the emergence of consensus industry standards.
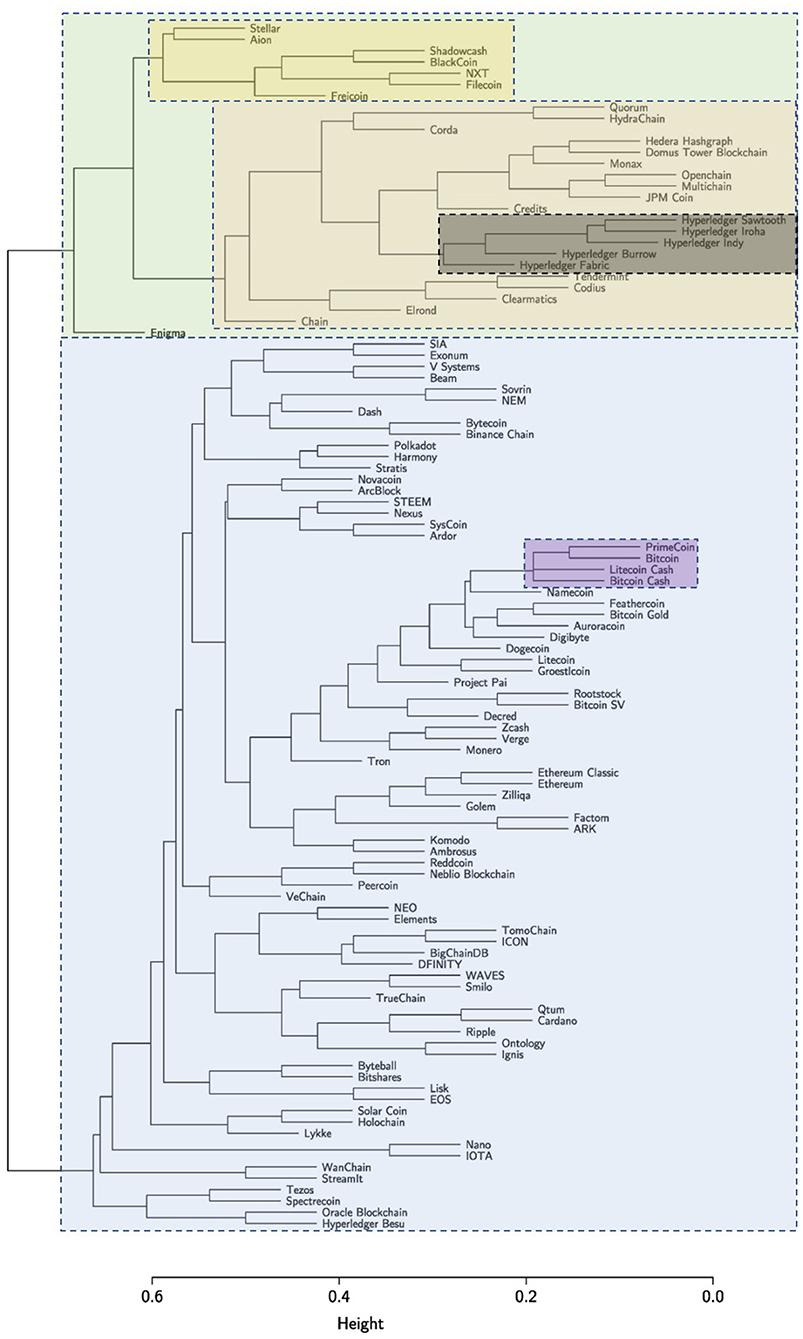
Another interesting observation we can make from our analysis is about the different evolutionary paths followed by public and permissioned blockchains (Figure 6). Although this finding seems to be quite intuitive and linked to the different governance models that characterize the two classes of blockchains, we argue that there is a clear genetic difference between public and permissioned blockchains. The application of the hierarchical clustering algorithm (UPGMA) yields the dendrogram shown in Figure 8. Starting from the root (top of the figure), the tree branches into two main clusters (blue and green). The green cluster on the right primarily includes permissioned blockchains. It is obvious that the different Hyperledger frameworks (gray) are genetically very closed to each other. Their distance (as indicated by the height on the y-axis) is very low. This cluster is again part of a larger cluster (red) consisting of almost all permissioned technologies. Of particular interest is the very yellow cluster on the right which is mainly composed of public blockchains. That cluster contains technologies such as Stellar and Filecoin17 which exhibit both features of public and permissioned blockchains.
Enigma18, however, being a second-layer technology occupies an isolated space in the right cluster. In the large blue cluster on the left, we can identify a dense subcluster (violet) around Bitcoin containing both Bitcoin Gold19 and Bitcoin Cash20 (forks of the original Bitcoin protocol). Many of the early cryptocurrencies are within or close to this subcluster, whereas more recent technologies such as Tron21, IOTA, VeChain22 and EOS23 are further away indicating the adoption of breakthrough features developed within these new technologies.
5. Conclusions
Since the introduction of Bitcoin in 2009, we have witnessed a Cambrian explosion of blockchain architectures. This expansion combined with the fact that blockchain design allows for many degrees of freedom, makes it difficult to both understand the blockchain innovation path(s) and to have an early detection of emergent technological patterns.
In this paper, we tackled this problem by using the taxonomy of Tasca and Tessone (2019) to explore innovation patterns within blockchain sub-components. We have demonstrated the usefulness of this approach by applying the taxonomy to a sample of 107 blockchain technologies. Our results provides a unique, comprehensive understanding of the (r)evolutionary and incremental changes that these technologies undertook over the last 11 years (2009–2019) and explores the connection between different design choices.
By analyzing the dependencies between the sub-components with methods from information theory and phylogenetics, we find that the consensus mechanism, the security and the asset supply components explain most of the variability of blockchain technologies. Interestingly, these components tend to induce certain layout choices in other sub-components. Furthermore, the access and control layer also has some predictive power with respect to the other sub-components. The chronogram analysis shows that the approach we have taken identifies differentiated clusters of blockchain technologies centerd around Bitcoin (and a sub-cluster around Litecoin), Ethereum, XRP, while other technologies have departed much more from previous ones.
Further, our study sheds light on the architectural divergence between public and permissioned blockchains. This reflects the different field of applications for which these technologies have been designed. Even within the public and permissioned clusters, several genetic subgroups of blockchain technology have emerged, e.g., a cluster that is directly related to Bitcoin and a cluster consisting of the Hyperledger family.
However, our work has some limitations. Our sample is not exhaustive and new blockchain designs are continuously emerging. However, we argue that our sample covers a representative share of blockchain technologies and our results are therefore valid. The whole work is based on the Tasca-Tessone taxonomy that—while useful—still is preliminary work and could be expanded to account for more complex developments. Furthermore, this study gives some insights into the evolutionary path of blockchain technologies, but does not explain the underlying drivers of this evolution. This means that the results can be used to understand the design choices taken by the platforms, but not the motivation or incentives backing these choices. This is something left for future research.
Since blockchain is still undergoing its “era of ferment” (see section 4.2) our work here lays the foundation for a continuous observation of the technological development of the platforms. We plan to continue this project and make the results available on a public webpage, where we also plan to augment our sample with additional technologies and to update the current ones. This should contribute to a better understanding of the design choices taken in blockchain technologies and at the same time inspire researchers and developers to experiment with sub-components that until now have remained technologically under-developed.
Data Availability Statement
The datasets generated for this study can be found at: https://theblockchaintree.com.
Author Contributions
The idea for this paper was conceived by all three authors, FS conducted the analysis, wrote the bulk of the text and developed together with CT the methodology, all authors commented, polished, and agreed on the final manuscript.
Conflict of Interest
The authors declare that the research was conducted in the absence of any commercial or financial relationships that could be construed as a potential conflict of interest.
Acknowledgments
We thank all students from UZH and ZHAW who helped in the data collection used in this paper. The authors thank Jiahua (Java) Xu and Gaspard Peduzzi for their majestic coordination of the work run by the Master students at the École Polytechnique Fédérale de Lausanne. CT acknowledges financial support of the University of Zurich through the University Research Priority Programme (URPP) Social Networks.
Supplementary Material
The Supplementary Material for this article can be found online at: https://www.frontiersin.org/articles/10.3389/fbloc.2020.613476/full#supplementary-material
Abbreviations
AML, anti money laundering; PoI, proof of importance; BFT, byzantine fault tolerance; PoS, proof of stake; DAG, directed acyclic graph; PoU, proof of usage; dPoS, delegated proof of stake; PoW, proof of work; dPoW, delayed proof of work; SCP, stellar consensus protocol; KYC, know your customer; SPoS, supernode proof of stake; PoA, proof of authority; UTXO, unspent transaction output; PoET, proof of elapsed time.
Footnotes
1. ^In this article we use the term “blockchain technologies” to refer also to the larger family of distributed ledger technologies, i.e., community consensus-based distributed ledgers where the storage of data is not based on chains of blocks.
14. ^https://www.hyperledger.org/
16. ^https://www.goquorum.com/
20. ^https://www.bitcoincash.org/
23. ^https://eos.io/
References
Ballandies, M., Dapp, M. M., and Pournaras, E. (2018). Decrypting distributed ledger design - taxonomy, classification and blockchain community evaluation. ArXiv abs/1811.03419.
Bonneau, J., Miller, A., Clark, J., Narayanan, A., Kroll, J. A., and Felten, E. W. (2015). “Sok: Research perspectives and challenges for bitcoin and cryptocurrencies,” in Security and Privacy (SP), 2015 IEEE Symposium on (San Jose, CA: IEEE), 104–121.
Cachin, C., and Vukolić, M. (2017). Blockchain consensus protocols in the wild. arXiv preprint arXiv:1707.01873.
Foster, Z., Sharpton, T., and Grünwald, N. (2017). Metacoder: An R package for visualization and manipulation of community taxonomic diversity data. PLoS Comput. Biol. 13:e1005404. doi: 10.1371/journal.pcbi.1005404
Gower, J. C. (1971). A general coefficient of similarity and some of its properties. Biometrics 27, 857–871. doi: 10.2307/2528823
Ibañez, J. I., Bayer, C. N., Tasca, P., and Xu, J. (2020). Rea, triple-entry accounting and blockchain: converging paths toshared ledger systems. arXiv arXiv:2005.07802.
Mingxiao, D., Xiaofeng, M., Zhe, Z., Xiangwei, W., and Qijun, C. (2017). “A review on consensus algorithm of blockchain,” in 2017 IEEE International Conference on Systems, Man, and Cybernetics (SMC) (Banff, AB), 2567–2572.
Nakamoto, S. (2008). Bitcoin: A Peer-to-Peer Electronic Cash System. Available online at: https://bitcoin.org/bitcoin.pdf.
Sarkintudu, S. M., Ibrahim, H. H., and Abdwahab, A. B. (2018). Taxonomy development of blockchain platforms: information systems perspectives. AIP Conf. Proc. 2016:020130. doi: 10.1063/1.5055532
Shannon, C. E. (1948). A mathematical theory of communication. Bell Syst. Tech. J. 27, 379–423. doi: 10.1002/j.1538-7305.1948.tb01338.x
Spellerberg, I., and Fedor, P. (2003). A tribute to claude shannon (1916–2001) and a plea for more rigorous use of species richness, species diversity and the ‘shannon–wiener' index. Glob. Ecol. Biogeogr. 12, 177–179. doi: 10.1046/j.1466-822X.2003.00015.x
Tasca, P., and Tessone, C. (2019). A taxonomy of blockchain technologies: Principles of identification and classification. Ledger 4, 1–39. doi: 10.5195/ledger.2019.140
Wang, L.-G., Lam, T., Xu, S., Dai, Z., Zhou, L., Feng, T., et al. (2019). Treeio: an R package for phylogenetic tree input and output with richly annotated and associated data. Mol. Biol. Evol. 37, 599–603. doi: 10.1093/molbev/msz240
Xu, Q., Aung, K. M. M., Zhu, Y., and Yong, K. L. (2018). “A blockchain-based storage system for data analytics in the internet of things,” in New Advances in the Internet of Things (Berlin: Springer), 119–138.
Xu, X., Weber, I., Staples, M., Zhu, L., Bosch, J., Bass, L., et al. (2017). “A taxonomy of blockchain-based systems for architecture design,” in 2017 IEEE International Conference on Software Architecture (ICSA) (Gothenburg), 243–252.
Yu, G., Smith, D. K., Zhu, H., Guan, Y., and Lam, T. T.-Y. (2017). ggtree: an R package for visualization and annotation of phylogenetic trees with their covariates and other associated data. Methods Ecol. Evol. 8, 28–36. doi: 10.1111/2041-210X.12628
Zachary, F., Scott, C., and Niklaus, G. (2018). Taxa: an R package implementing data standards and methods for taxonomic data. F1000Res. 7:272. doi: 10.12688/f1000research.14013.2
Zimmermann, K. A. (2017). History of Computers: A Brief Timeline. Available online at: https://www.livescience.com/20718-computer-history.html (accessed July 16, 2020).
Keywords: blockchain, distributed ledger technology, taxonomy, information theory, blockchain analytics, innovation, evolution
Citation: Spychiger F, Tasca P and Tessone CJ (2021) Unveiling the Importance and Evolution of Design Components Through the “Tree of Blockchain”. Front. Blockchain 3:613476. doi: 10.3389/fbloc.2020.613476
Received: 02 October 2020; Accepted: 04 December 2020;
Published: 13 January 2021.
Edited by:
Michele Marchesi, University of Cagliari, ItalyReviewed by:
Katiuscia Mannaro, University of Cagliari, ItalyHenry Michael Kim, York University, Canada
Copyright © 2021 Spychiger, Tasca and Tessone. This is an open-access article distributed under the terms of the Creative Commons Attribution License (CC BY). The use, distribution or reproduction in other forums is permitted, provided the original author(s) and the copyright owner(s) are credited and that the original publication in this journal is cited, in accordance with accepted academic practice. No use, distribution or reproduction is permitted which does not comply with these terms.
*Correspondence: Florian Spychiger, Zmxvcmlhbi5zcHljaGlnZXJAemhhdy5jaA==
 Florian Spychiger
 Paolo Tasca
 Claudio J. Tessone