 Isabella Ricchetti1
 Trixie Taucher1Reese Loebick1Simon Yung Wa Sin2Catalina Palacios1
 Sangeet Lamichhaney1,3*
- 1Department of Biological Sciences, Kent State University, Kent, OH, United States
- 2School of Biological Sciences, The University of Hong Kong, Hong Kong, Hong Kong SAR, China
- 3School of Biomedical Sciences, Kent State University, Kent, OH, United States
The range distributions of many bird species cover extensive geographic distances, exposing each local population to unique ecological challenges. Understanding the molecular basis of how species adapt to diverse habitats across their geographic range is crucial for identifying populations at risk and implementing effective conservation strategies. In this study, we employed two passerine species, the black-capped chickadee (Poecile atricapillus) and the American goldfinch (Spinus tristis), which are widely distributed across North America. This study focused on examining changes in gene expression within their distinct populations inhabiting diverse habitats across various geographical locations. A comparative transcriptomic study was conducted on wild-caught birds from two geographically separate locations, Boston, Massachusetts, and Kent, Ohio, characterized by considerable annual variability in winter severity. We tested the hypothesis that populations of both species in Kent and Boston would show differential gene expression patterns in their brains in response to unique local environmental conditions. Analyzing the differentially expressed genes (DEGs) in black-capped chickadees revealed associations with neural processes such as the generation and maintenance of neurons, activity-dependent plasticity, and cognitive ability. Many of these genes were linked to brain variation in chickadee populations related to spatial cognition associated with food caching. We also compared changes in gene expression levels with coding sequence variability to explore the underlying basis of differential gene expression patterns. We tested the hypothesis that expression differences are driven by underlying genetic variation. A population genetic analysis on transcriptome data from both species revealed no highly divergent genetic variants (single nucleotide polymorphisms or SNPs) in the coding regions of genes identified as differentially expressed. However, some of the DEGs themselves were transcription factors or regulatory molecules, as were some of the genes with highly divergent SNPs. These findings suggest that the genetic architecture underlying the differential gene expression patterns is mostly regulatory rather than protein-coding changes.
Introduction
Populations of a single species in different geographic areas are subjected to the unique selective pressures (biotic and abiotic conditions) of that environment, which may lead to short and long-term adaptation (Acasuso-Rivero et al., 2019; Liu et al., 2021). The fundamental evolutionary mechanisms driving both long and short-term adaptation involve genetic adaptation and phenotypic plasticity. Genetic adaptation involves the evolution of heritable genetic traits within a population over multiple generations in response to consistent and sustained environmental pressures or selective forces. Phenotypic plasticity refers to the ability of an organism to exhibit reversible changes in its phenotype in response to environmental fluctuations (Acasuso-Rivero et al., 2019). Knowledge of the underlying basis of phenotypic plasticity is limited for many groups of organisms, particularly in non-model natural systems. Studies have suggested changes in gene expression regulation are more prevalent in driving plastic changes than changes in protein sequences (King and Wilson, 1975; Oleksiak et al., 2002; Fraser, 2013). Hence, understanding transcriptome changes is imperative in studies of plasticity (Oleksiak et al., 2002; Canale and Henry, 2010; Pauls et al., 2013; Alvarez et al., 2015). In this study, we investigated two widely distributed passerine species, the black-capped chickadee (Poecile atricapillus) and the American goldfinch (Spinus tristis), across their ranges in North America. These species are known for their extensive distribution (Figure 1), with the black-capped chickadee inhabiting various forested habitats, including deciduous and mixed forests (Smith, 1991), while the American goldfinch is commonly found in open fields, grasslands, and cultivated areas throughout the continent (see details in Supplementary Text). By focusing on these two species, we aimed to understand how their gene expression profiles and protein coding changes vary among geographically separated populations occupying different ecological niches within North America.
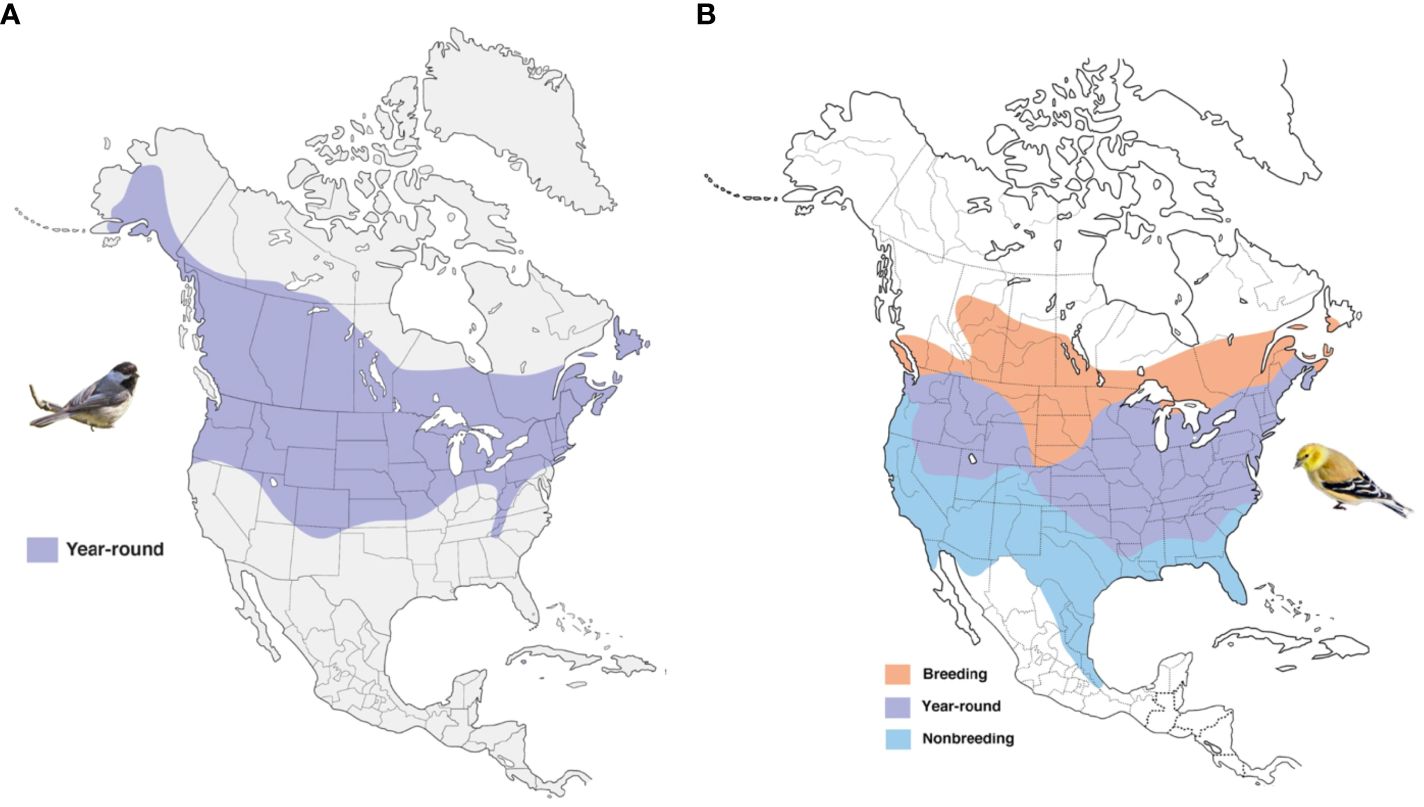
Figure 1 The range map of the Black-capped chickadee (A) and American Gold Finch (B). Map modified from Birds of the World (2022). Bird images © Wikimedia Commons.
One major stressor that birds inhabiting temperate zones experience is harsh, inclement winter conditions characterized by high snowfall, low temperatures, and short-day lengths (Ketterson and Nolan, 1982; Jacobs, 1996). These conditions increase the cost of foraging due to reduced food availability, decreased daylight, and long, cold nights of fasting (Marsh and Dawson, 1989; Stager et al., 2020). One way the energetic cost of foraging can be decreased is by migrating to areas where winter-associated difficulties of foraging are less prominent (Marsh and Dawson, 1989; Jacobs, 1996). One of our focal species, the American goldfinch, will occasionally resort to this migratory behavior. An alternative strategy for reducing foraging costs is by engaging in food storage, a behavior commonly referred to as caching (Barnea and Pravosudov, 2011). Our other focal species, the black-capped chickadee, engages in this food-caching behavior (Desrochers et al., 1988). There is evidence that both migratory (Justen and Delmore, 2022) and food-caching behaviors are, in part, mediated by transcriptome-wide changes in the brain (Pravosudov et al., 2013; Branch et al., 2022). Characterizing differences in gene expression patterns between geographically distant populations exposed to similar winter conditions may lead to insight into how these populations of birds respond to environmental stressors, and if these responses are uniform between populations.
In this study, we have characterized variation in gene expression profiles between the brains of two populations of black-capped chickadees and American goldfinches from Kent, Ohio, and Boston, Massachusetts. The habitats of Kent, Ohio, and Boston, Massachusetts, present unique ecological challenges for bird species. The Kent region experiences distinct seasons, with cold winters and hot summers. Birds must adapt to fluctuations in temperature, food availability, and nesting conditions throughout the year. Boston, however, is a highly urbanized area with dense human populations and extensive infrastructure. Birds must navigate urban landscapes, contend with habitat loss and fragmentation. Boston’s proximity to the Atlantic Ocean brings unique ecological dynamics, including coastal habitats, maritime weather patterns, and potential impacts from sea-level rise and storm surges.
We chose the brain as the tissue of interest due to its critical role in mediating behavioral and metabolic changes in response to environmental stressors, for example, through regulating various metabolic pathways like lipid metabolism or through structural changes associated with food-caching and migration (Barnea and Pravosudov, 2011; Jehl et al., 2019; Segarra et al., 2021; Justen and Delmore, 2022). These two study locations provide us with a wide degree of heterogeneity, both seasonally and between years. During the cold seasons leading up to sampling in both locations (November – March), in Kent, the daily snow amount (measured as snow water equivalent) was on average 19.5 kg/m2 greater, and daily minimum temperatures were on average 0.1103°C colder (Thornton et al., 2020). However, in the five years leading up to sampling the climate conditions, particularly snow amount, were extremely variable in both sites (Figure 2).
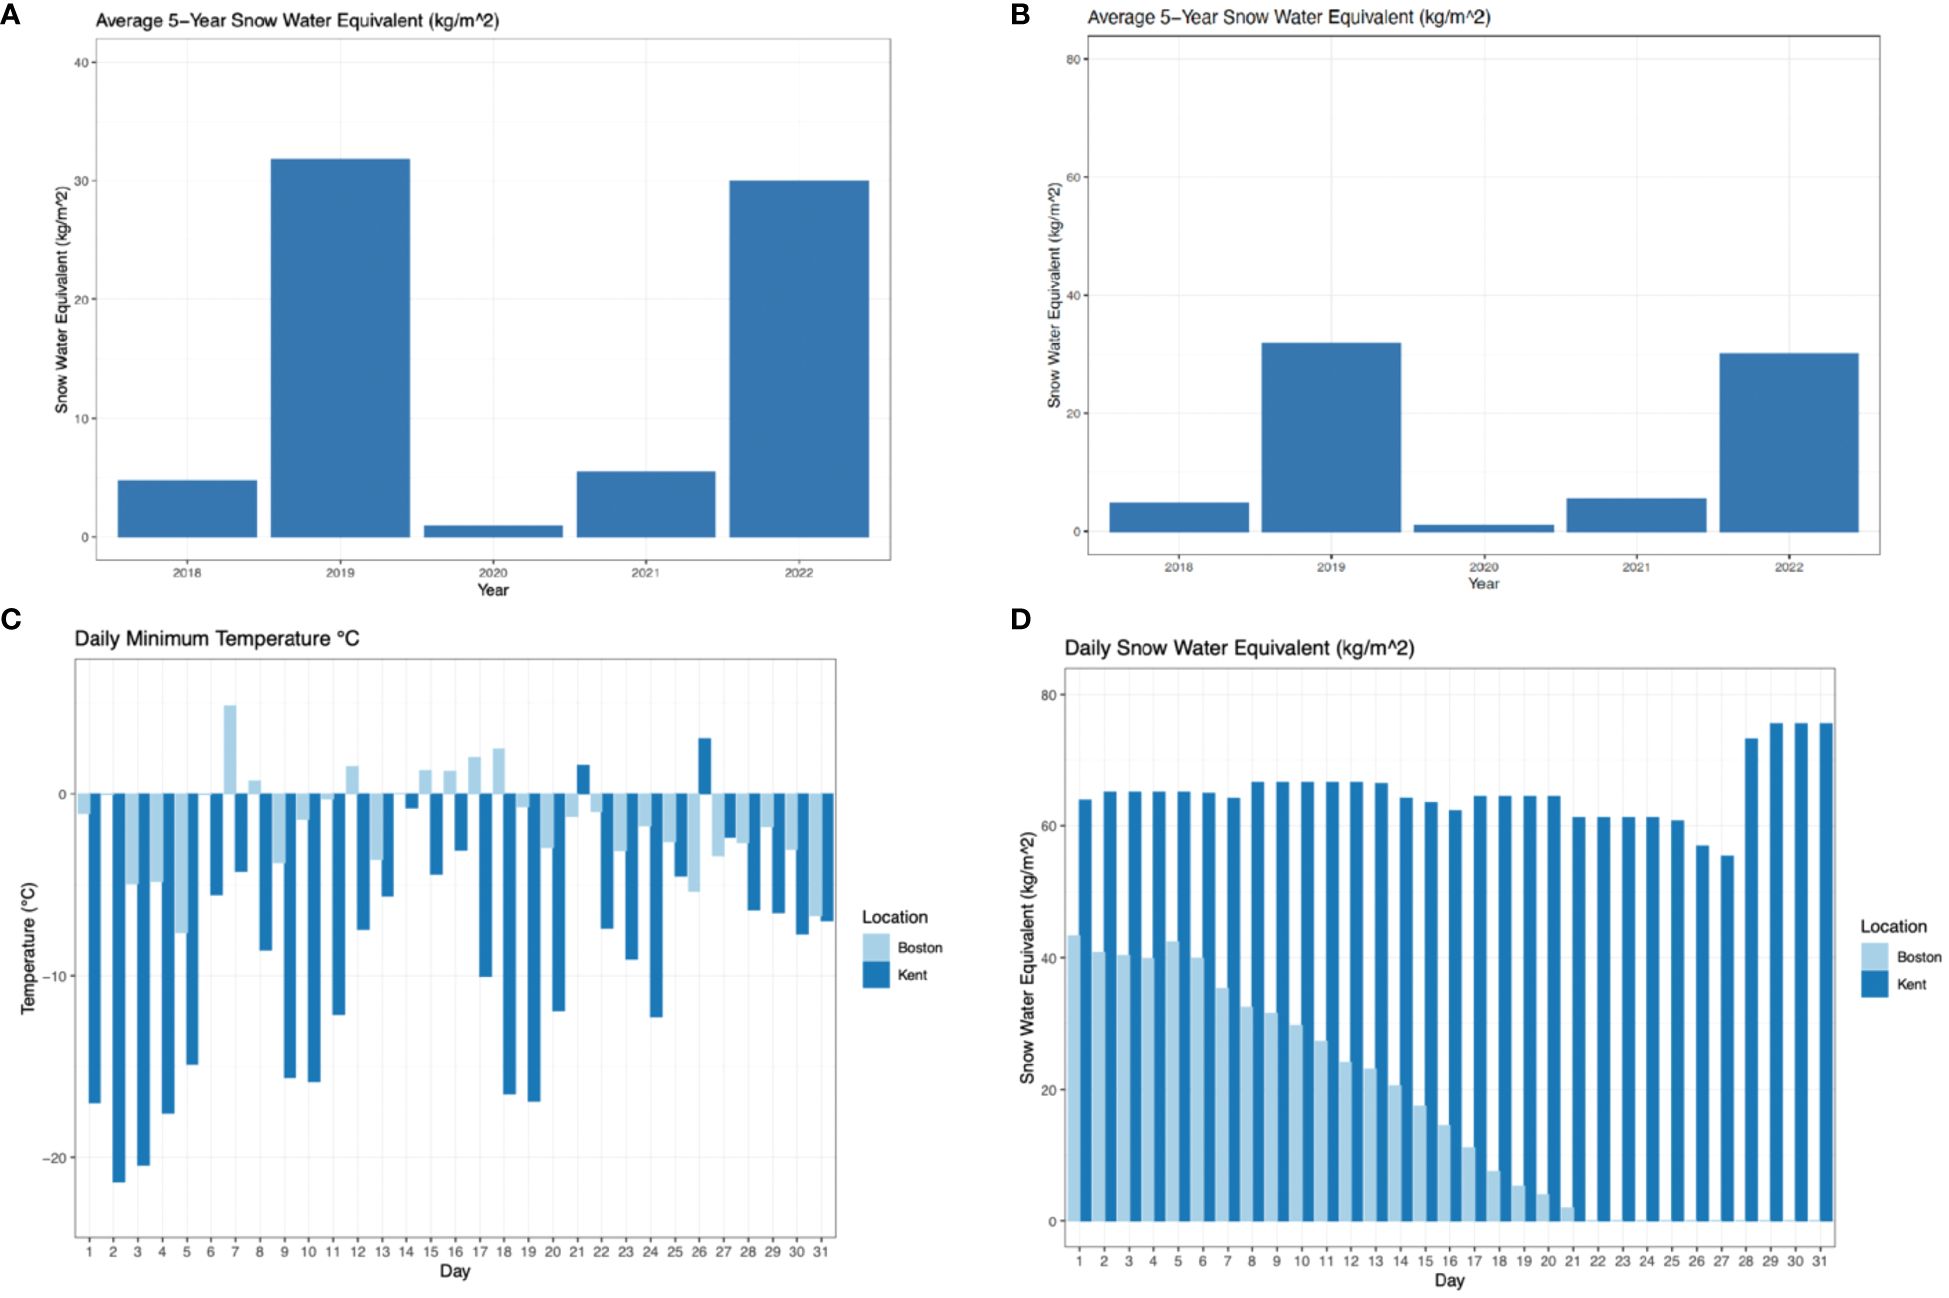
Figure 2 Climatic variables at two study locations. The average daily snow water equivalent (in kg/m²) over the entire cold season (November - March) over a five-year period in Kent (A) and Boston (B). Daily minimum temperature in °C in the month leading up to sampling in Kent and Boston (with day 31 being the latest date of sampling, February 27th, 2022, in Kent and March 17th, 2018, in Boston) (C). Daily snow water equivalent (kg/m²) in the month leading up I to sampling in Kent and Boston (with day 31 being the latest date of sampling, February 27th 2022, in Kent and March 17th, 2018, in Boston) (D).
Gene expression changes are driven by a variety of factors that include, but are not limited to, genetic changes (both cis and trans-acting mutations, or mutations within the coding regions) and epigenetic changes (DNA methylation or histone modifications). Prior studies have led to conflicting findings on the importance and prevalence of cis- and trans-regulatory variants in regulating gene expression levels. Some studies have shown that changes in cis-regulatory regions located near the gene of interest are strongly associated with changes in gene expression (Stranger et al., 2007; Pickrell et al., 2010; Nica and Dermitzakis, 2013). However, other studies have shown trans-regulatory changes are equally, or even more prominent in the regulation of gene expression (Grundberg et al., 2012; Albert et al., 2018; Wang et al., 2020). Many studies have also identified protein-coding changes to play a large role in the variation of gene expression (Urbański and Kurył, 2004; Zhu et al., 2007; Fujiki et al., 2009; Hawley and Wetmore, 2010; Lü et al., 2011).
An integrated study of gene expression changes with the characterization of genome sequence variation and epigenetic modifications can be a powerful tool to explore the underlying basis of changes in gene expression levels. In this study, we have examined the sequence variation in protein-coding genes and determined its association with the variation in gene expression changes between the two geographically distant populations of black-capped chickadees and American goldfinches. we tested two overarching hypotheses:
H1: Local populations from Kent and Boston of both species (Black-capped chickadees and American goldfinches) will exhibit differential gene expression patterns in the brain in response to their local environmental conditions.
H2: The differential gene expression patterns in the brain in both species (black-capped chickadees and American goldfinches) are partially driven by underlying genetic variation in cis and trans-regulatory regions.
Materials and methods
Sample collection, tissue harvest, and RNA sequencing
Five black-capped chickadees and eight American goldfinches were captured at Concord Field Station in Boston, Massachusetts, using mist nets and cage traps. Similarly, three black-capped chickadees and three American goldfinches were captured at a field station near Kent State University in Ravenna, Ohio, using mist nets. The birds were selectively captured at the area of occurrence, based on specific criteria, such as age, sex, or breeding status. We ensured the swift release of unsampled birds into the wild to reduce the duration of captivity and minimize the disruption to flock dynamics. This approach ensured that non-breeding and non-dominant birds in the flock were only sampled for this study.
To ensure consistency, all captured birds were subsequently housed in cages for 24 hours at room temperature, maintaining a 12-hour light photoperiod. During this time, they were provided with unrestricted access to both food and water. This standardized procedure was implemented to normalize stress levels among all the captured birds before tissue harvest.
The birds were humanely euthanized using the rapid cardiac compression method as per approved Kent State University IACUC protocol (see Ethics Statement below). Birds were immediately dissected to obtain the brain tissues and preserved in RNALater. Samples were further stored at -80°C, until downstream processing. Approximately 25 mg of brain tissue was used for the extraction of total RNA, using the QIAGEN RNeasy Tissue protocol. Following quality control procedures, the samples that met the required standards were sent for mRNA sequencing using the Illumina NovaSeq platform.
Building de novo transcriptome assembly
We used Trinity v2.9.1 (Grabherr et al., 2011; Haas et al., 2013) to build de novo reference transcriptome assembly using RNAseq data from one representative individual of each population. To assess the completeness of the transcriptome assemblies, the raw RNAseq reads were aligned back to the final transcriptomes. using Bowtie2 version 2.5.0 (Langmead et al., 2009). To further evaluate the completeness of the assembled transcriptomes, we estimated the contig Nx statistic that calculated the length of the shortest contig at which all contigs the same length or longer cover at least 50% of the genome assembly. An expression dependent N50 statistic was also calculated by factoring in the gene expression data, which is a better indicator of transcriptome assembly quality than the Nx statistic alone. The quality and completeness of the transcriptome assemblies were further assessed using BUSCO v5.2.2 (Manni et al., 2021). For this analysis, the set of conserved genes in Passeriformes was selected as a reference from the OrthoDB v10 database (Kriventseva et al., 2019).
Differential gene expression analysis
We appreciate that the sample size of these bird populations varies (black-capped chickadee - five from Boston population and three from Kent population; American goldfinch – eight from Boston population and three from Kent population). Ideally, we would have wanted to balance the same size in these populations, however the fieldwork was conducted during the time of global covid pandemic, and it was challenging to manage logistics in the field to obtain an ideal sample size in these two populations. To address this unequal sampling issue, we utilized a method that normalize RNA sequencing read counts across samples and control for sample size bias using the tool DESeq2 (Love et al., 2014). DESeq2 uses the median of ratios method for normalization, accounting for library size differences and compositional biases in RNA-seq data. By calculating the geometric mean of each gene across all samples and then dividing the counts for each gene in each sample by this mean, DESeq2 aims to normalize the data while accounting for differences in sequencing depth and RNA composition. This normalization procedure helps mitigate biases that can arise due to varying expression levels of different genes across conditions or sample size biases.
We then used Kallisto v0.46.1 (Bray et al., 2016) on the normalized RNAseq data to quantify the abundance of transcripts in each sample, followed by Sleuth v0.30.0 (Pimentel et al., 2017), to conduct statistical analysis to identify differentially expressed genes, using a cutoff q-value (Benjamini-Hochberg multiple testing corrected p-value) < 0.1 (Pimentel et al., 2017). The interactive web interface (Sleuth Live) was further used to generate clustered sample heatmaps, conduct Principal Component Analyses (PCA) and generate volcano plots for displaying differential expression results among groups.
Transcriptome annotation and functional analysis of differentially expressed genes
The Trinotate v3.2.2 pipeline (Bryant et al., 2017) was used for the annotation of the transcriptomes (see Supplementary Text for details). PANTHER v18.0 database (Mi el al., 2013), STRING v12.0 (Szklarczyk et al., 2023) and g:Profiler was used for functional analysis of the differentially expressed genes (see Supplementary Text for details).
Aligning RNA-Seq reads to reference genomes and variant calling
We mapped the RNAseq reads to high-quality reference genomes of black-capped chickadee (Poecile atricapillus) (Sayers et al., 2022) and the American goldfinch (Spinus tristis) (manuscript in preparation) using GATK-recommended best practices for variant discovery with RNA-Seq data (Brouard et al., 2019). We used a recently developed workflow from GATK (https://github.com/gatk-workflows/gatk4-rnaseq-germline-snps-indels), that is specifically optimized to call SNPs from RNAseq data to address challenges of calling SNPs from RNAseq data, arising from unequal expression of alleles (see Supplementary Text for details).
Annotation of genetic variants
We further utilized SNPEff v.5.2a (Cingolani et al., 2012) to conduct functional annotation of the filtered SNPs generated above, using genome annotation database from both species. We predicted coding effects such as synonymous or non-synonymous amino acid changes, start codon gains or losses, stop codon gains or losses, or frame shifts.
Estimation of genetic diversity and divergence
Within populations
We computed the inbreeding coefficient (F) for each individual, aiming to assess the average transcriptome-wide heterozygosity using VCFTools v0.1.13 (Danecek et al., 2011). The allele frequency of SNPs in each population was also calculated using VCFTools. Shapiro-Wilk test of normality and a two-sample, unpaired t-test were used to estimate the significance of allele frequency differences among populations.
Between populations
VCFTools was further used to calculate Weir and Cockerham’s FST value (fixation index) per site to estimate the amount of genetic divergence between the populations and to identify candidate, highly differentiated SNPs (Weir and Cockerham, 1984; Danecek et al., 2011).
Comparison between differentially expressed genes and highly divergent genetic variants
We conducted a comparison between two sets of genes: one comprising genes that exhibited significant differences in expression levels between the Boston and Kent populations in both species and the other containing genes that shared regions with SNPs displaying significant differences in allele frequencies between these same populations. The goal was to determine if there was any functional overlap between these two sets of genes. To do this, we employed STRING v12.0 to explore potential functional interactions between the proteins encoded by these two gene sets. We generated protein-protein interaction networks that encompassed all interconnected nodes, with each node representing all proteins produced by a single protein-coding locus. Within these networks, the edges were indicative of both the type and strength of evidence for protein-protein associations between genes.
Climate data extraction
The sampling locations’ longitude and latitude coordinates were utilized in Daymet’s Single Pixel Extraction Tool (Thornton et al., 2020) to retrieve minimum temperature, maximum temperature, and snow water equivalent for specified date ranges (see Supplementary Text for details).
Results
Sampling, RNA sequencing, and transcriptome assembly
We captured black-capped chickadees and American goldfinches from two locations (Kent and Boston) and collected their brain tissue samples (Table 1).
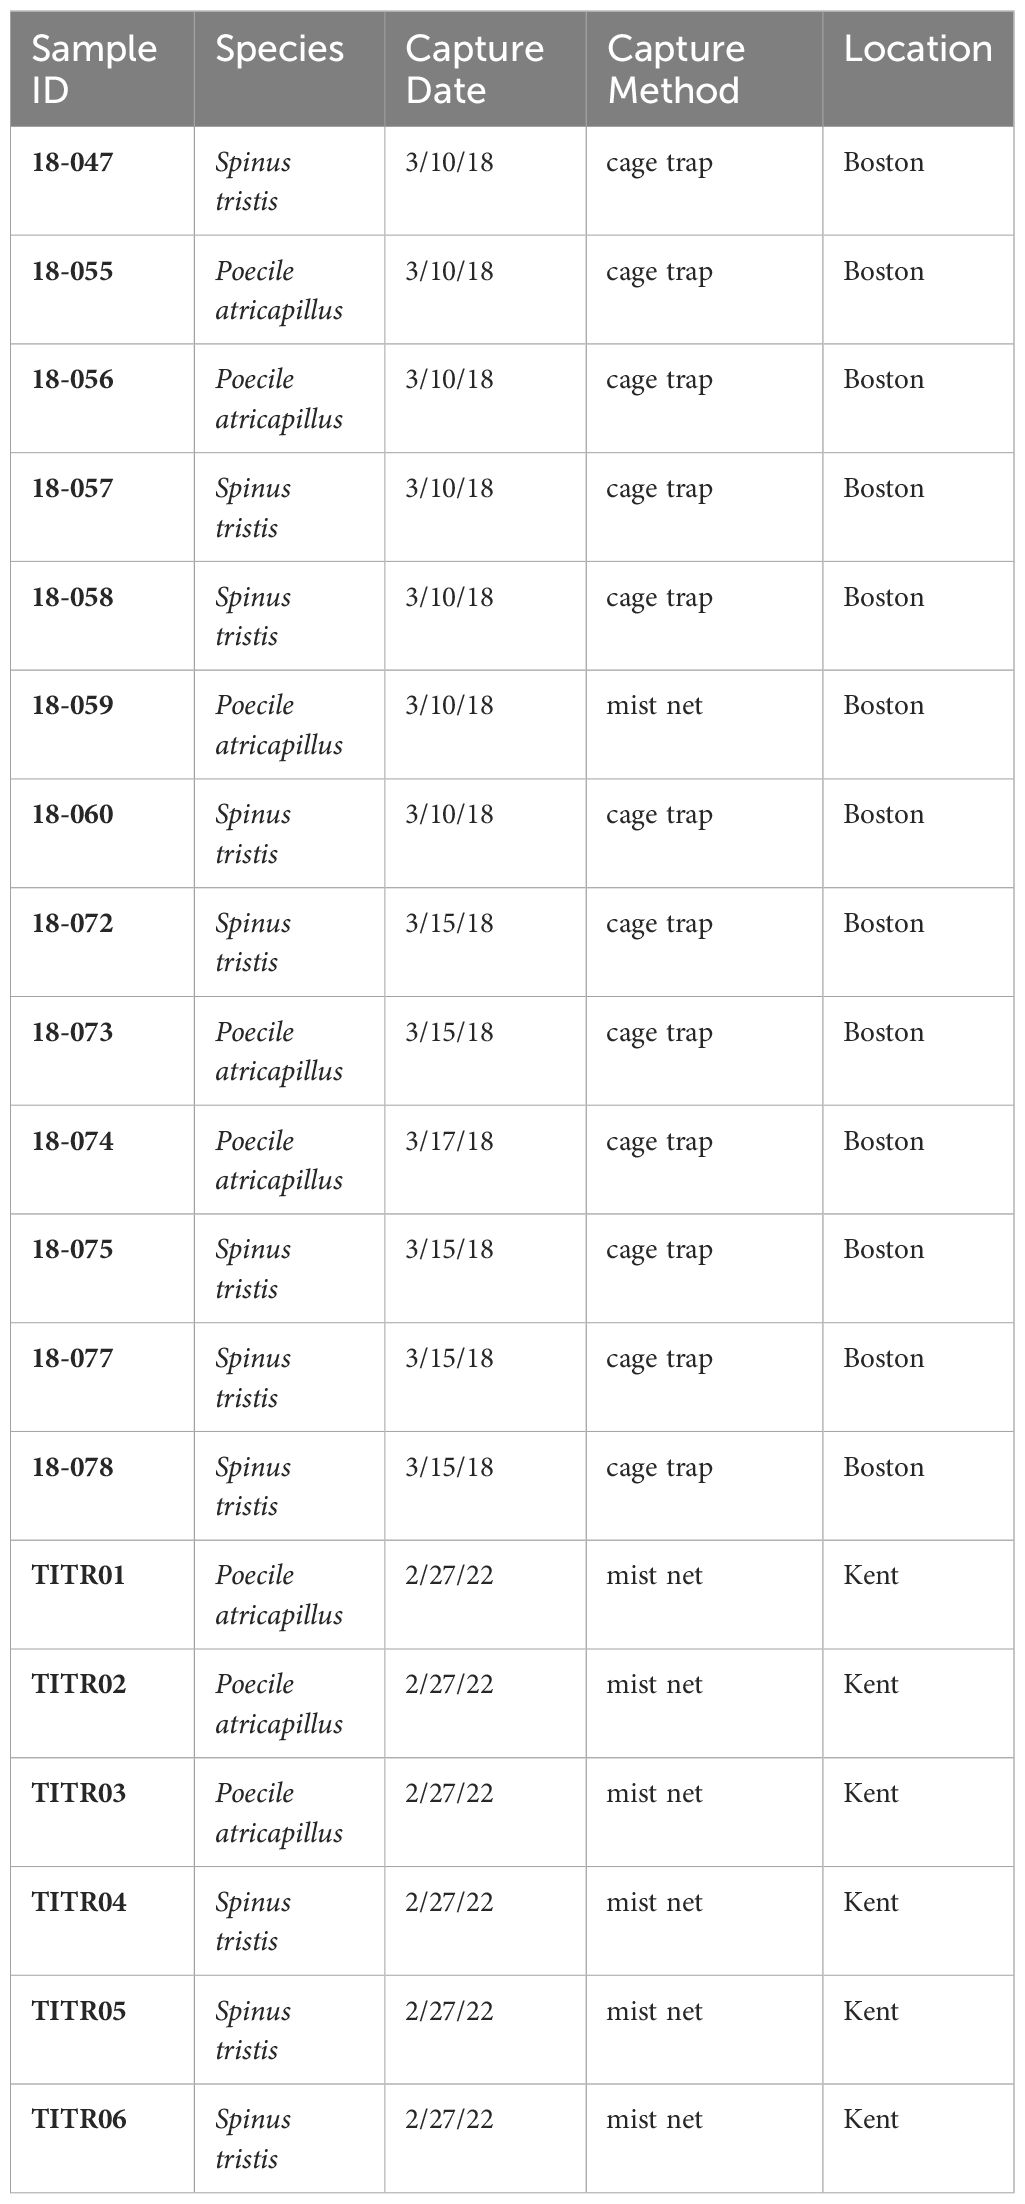
Table 1 Birds collected in Boston and Kent.
RNA was obtained from each of these samples (Supplementary Table 1). The RNA integrity number (RIN) score was 9.5 ± 0.20 (on a scale of 1-10) for all samples, which indicated high quality. RNA sequencing yielded an average of 46 million reads per sample (Supplementary Table 1).
De-novo transcriptome assemblies for each species were generated using these RNAseq reads. The black-capped chickadee transcriptome assembly had a total of 144,272 unique transcript contigs, with a Contig N50 of 3,456 bp (Table 2). Similarly, The American goldfinch transcriptome assembly had a total of 180,455 unique transcript contigs, with Contig N50 of 3,417 bp. RNAseq reads alignment rate to the reference transcriptome was ~95% for black-capped chickadee and ~96% for American goldfinch, indicating that a majority of the raw RNA-Seq reads were utilized to create the transcriptome assembly for both species.
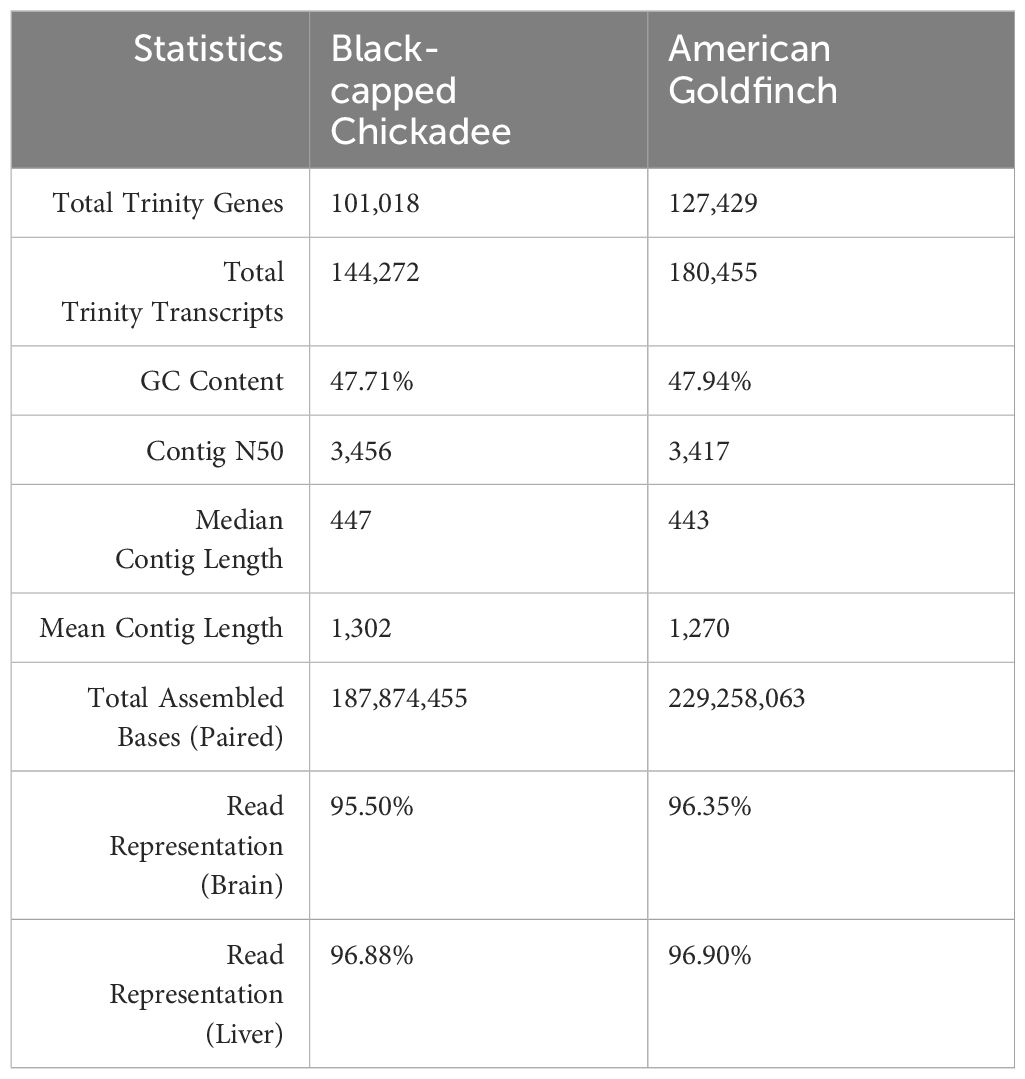
Table 2 Trinity assembly statistics for both species.
BUSCO analysis indicated that black-capped chickadee transcriptome had a total of 80.9% complete BUSCOs, with 30.3% complete and single-copy, 50.6% complete and duplicated, 2.2% fragmented, and 16.9% missing out of 10,844 total BUSCO groups searched (Supplementary Figure 1). The American goldfinch transcriptome had similar statistics (a total of 80.0% complete BUSCOs, with 27.3% complete and single-copy, 52.7% complete and duplicated, 2.3% fragmented, and 17.7% missing out of 10,844 total BUSCO groups searched (Supplementary Figure 1).
Differential gene expression analysis
We identified 108 differentially expressed genes (DEGs) in brain tissues between black-capped chickadee (BCCH) populations from Boston and Kent (Figure 3). However, in the case of American goldfinch (AMGO) populations from Boston and Kent, we only identified 14 DEGs (Figure 3). Out of 108 DEGs in BCCH, 96 were annotated to a known gene (80 were annotated using the Trinotate annotation pipeline and 16 were annotated manually, Supplementary Table 2). Similarly, for AMGO, 11 out of 14 genes were annotated to a known gene (Supplementary Table 3). We further examined the expression of these DEGs across all samples (Figure 4; Supplementary Figure 2), which showed consistent differences between all individuals of Boston and Kent populations (either up or downregulated) in both species. The principal component analysis based on the transcript abundance data showed two clusters consistent with sample geographical location, with PC1 and PC2 explaining 96.27% of the total variance in BCCH (Figure 5) and 97.76% of the total variance in AMGO (Supplementary Figure 3).
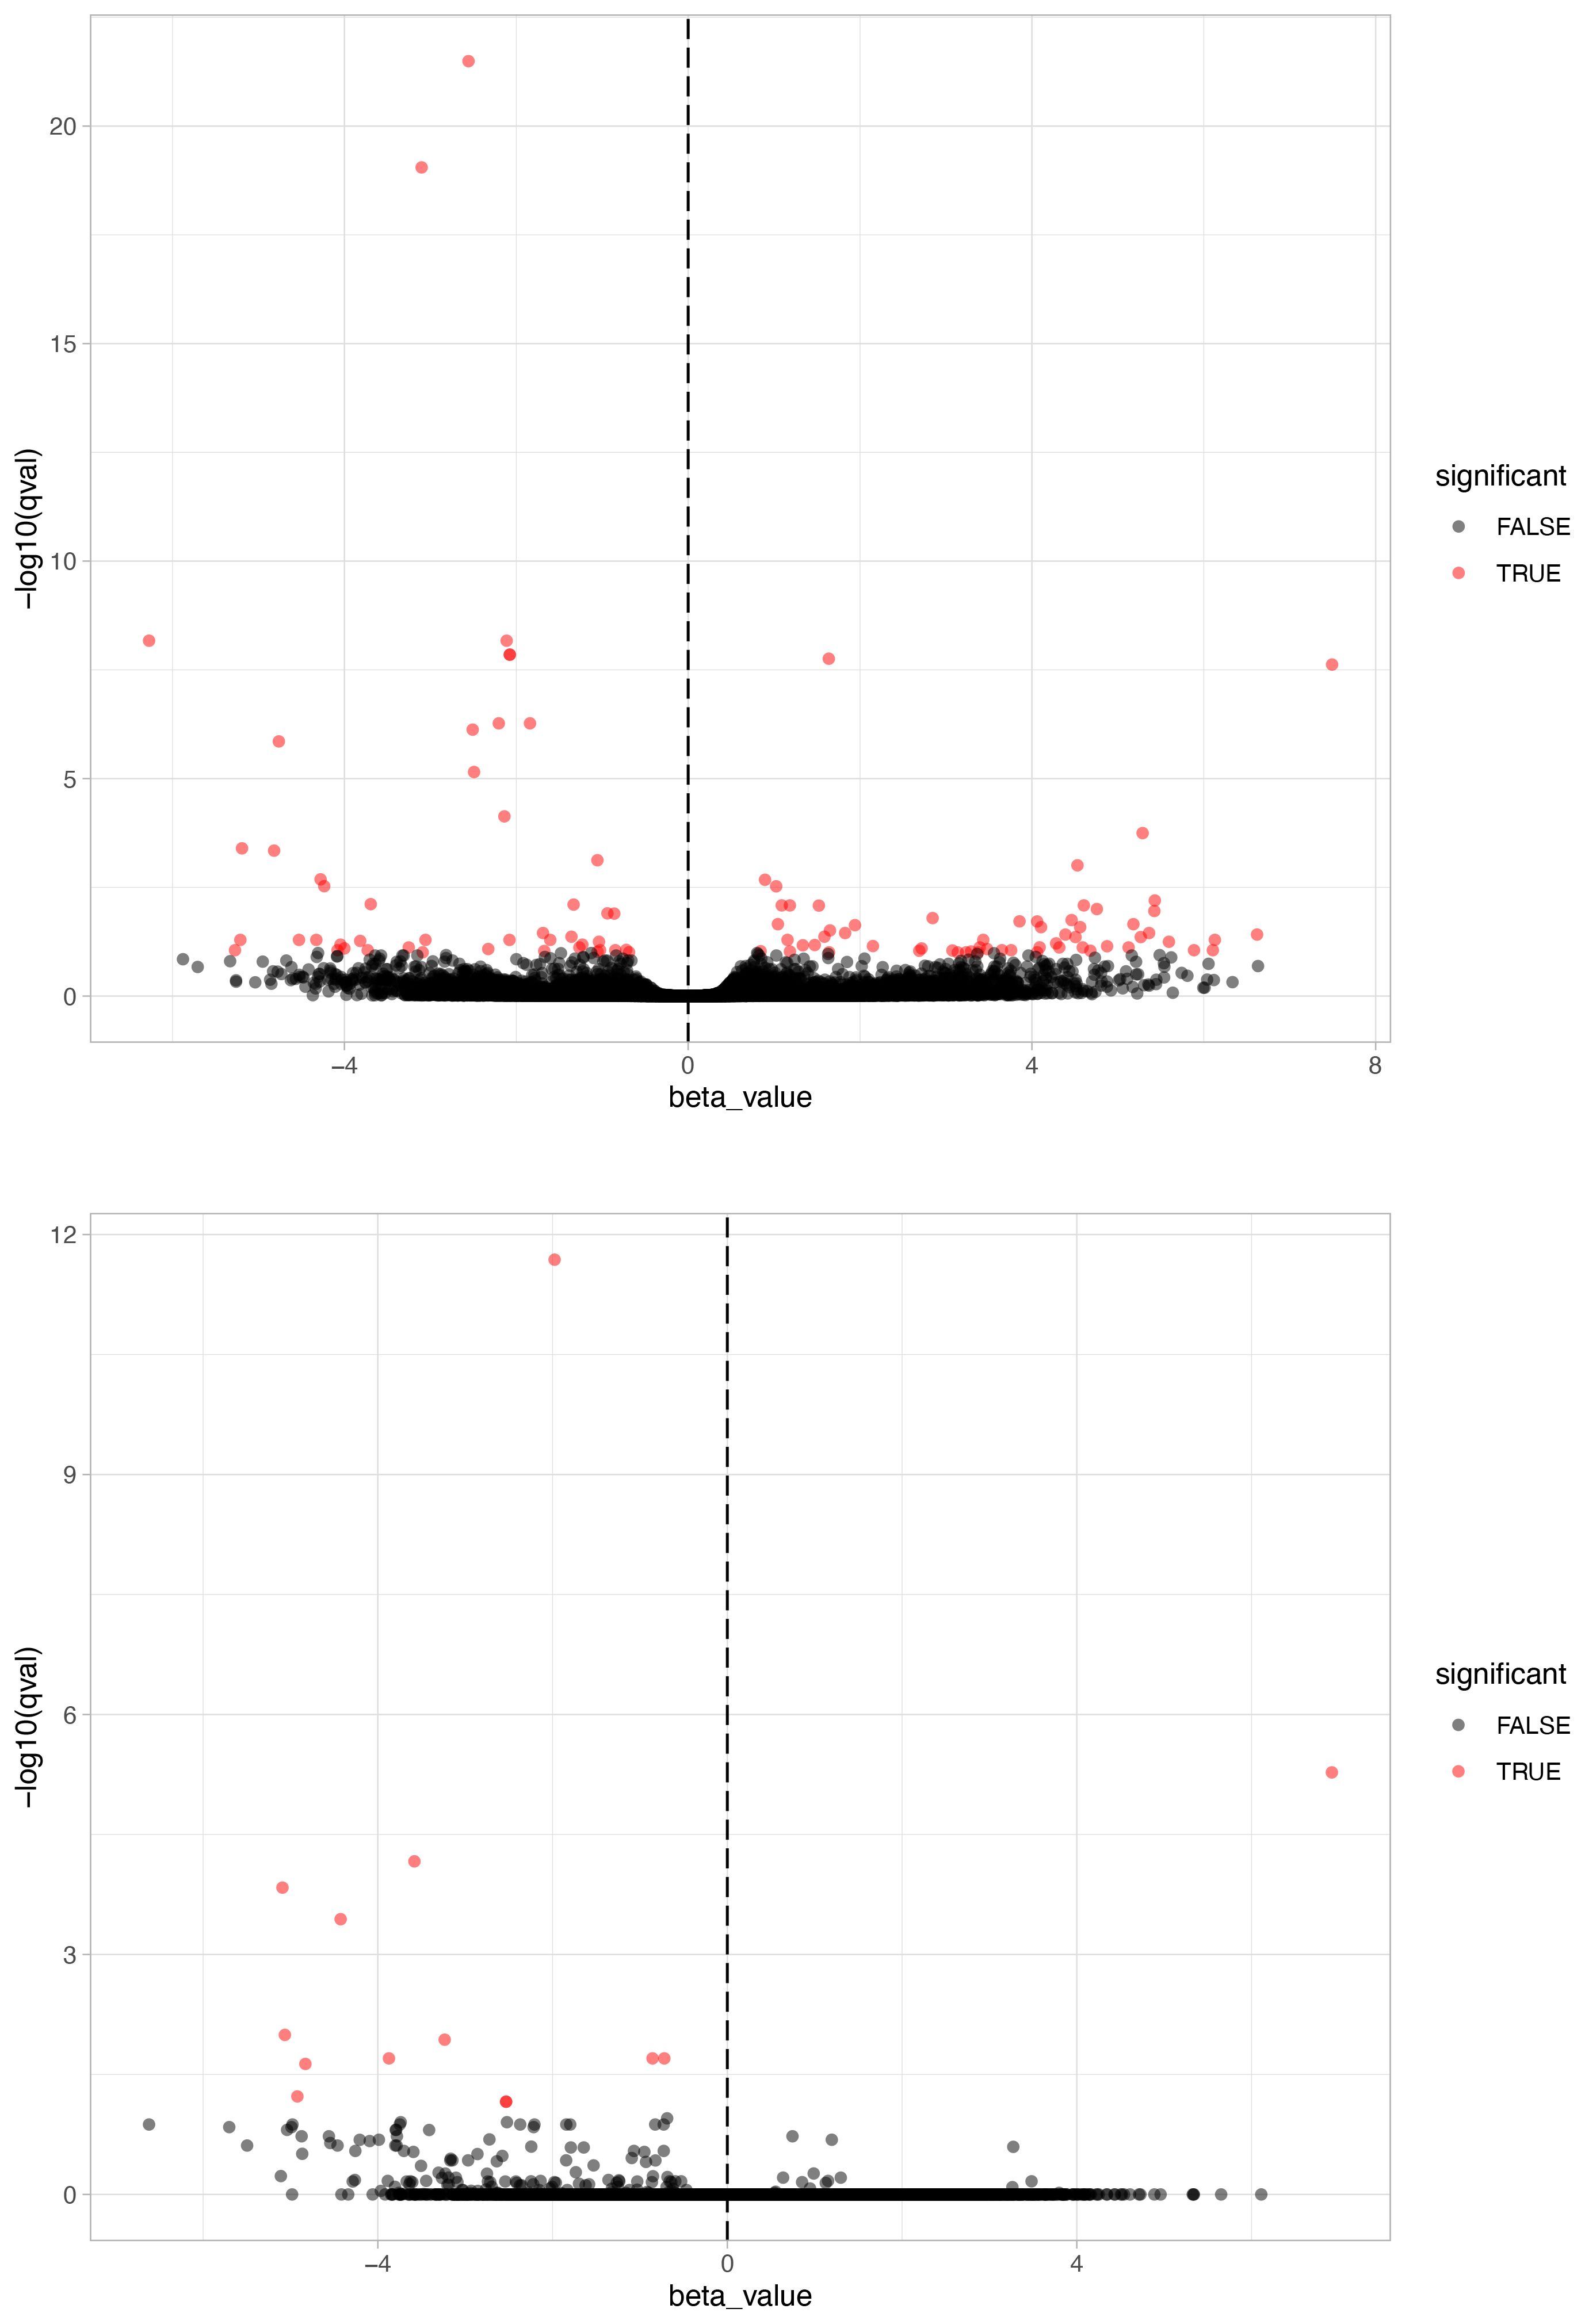
Figure 3 Gene expression profiles. A volcano plot showing transcripts expressed in black-capped chickadee (upper panel) and American goldfinch (lower panel) brains in both Kent and Boston populations. The x-axis represents the beta value, or biased estimate of natural log fold change between conditions, while the y-axis represents the -log10 of the q-value. Transcripts with a q–value <0.1 are shown in red.
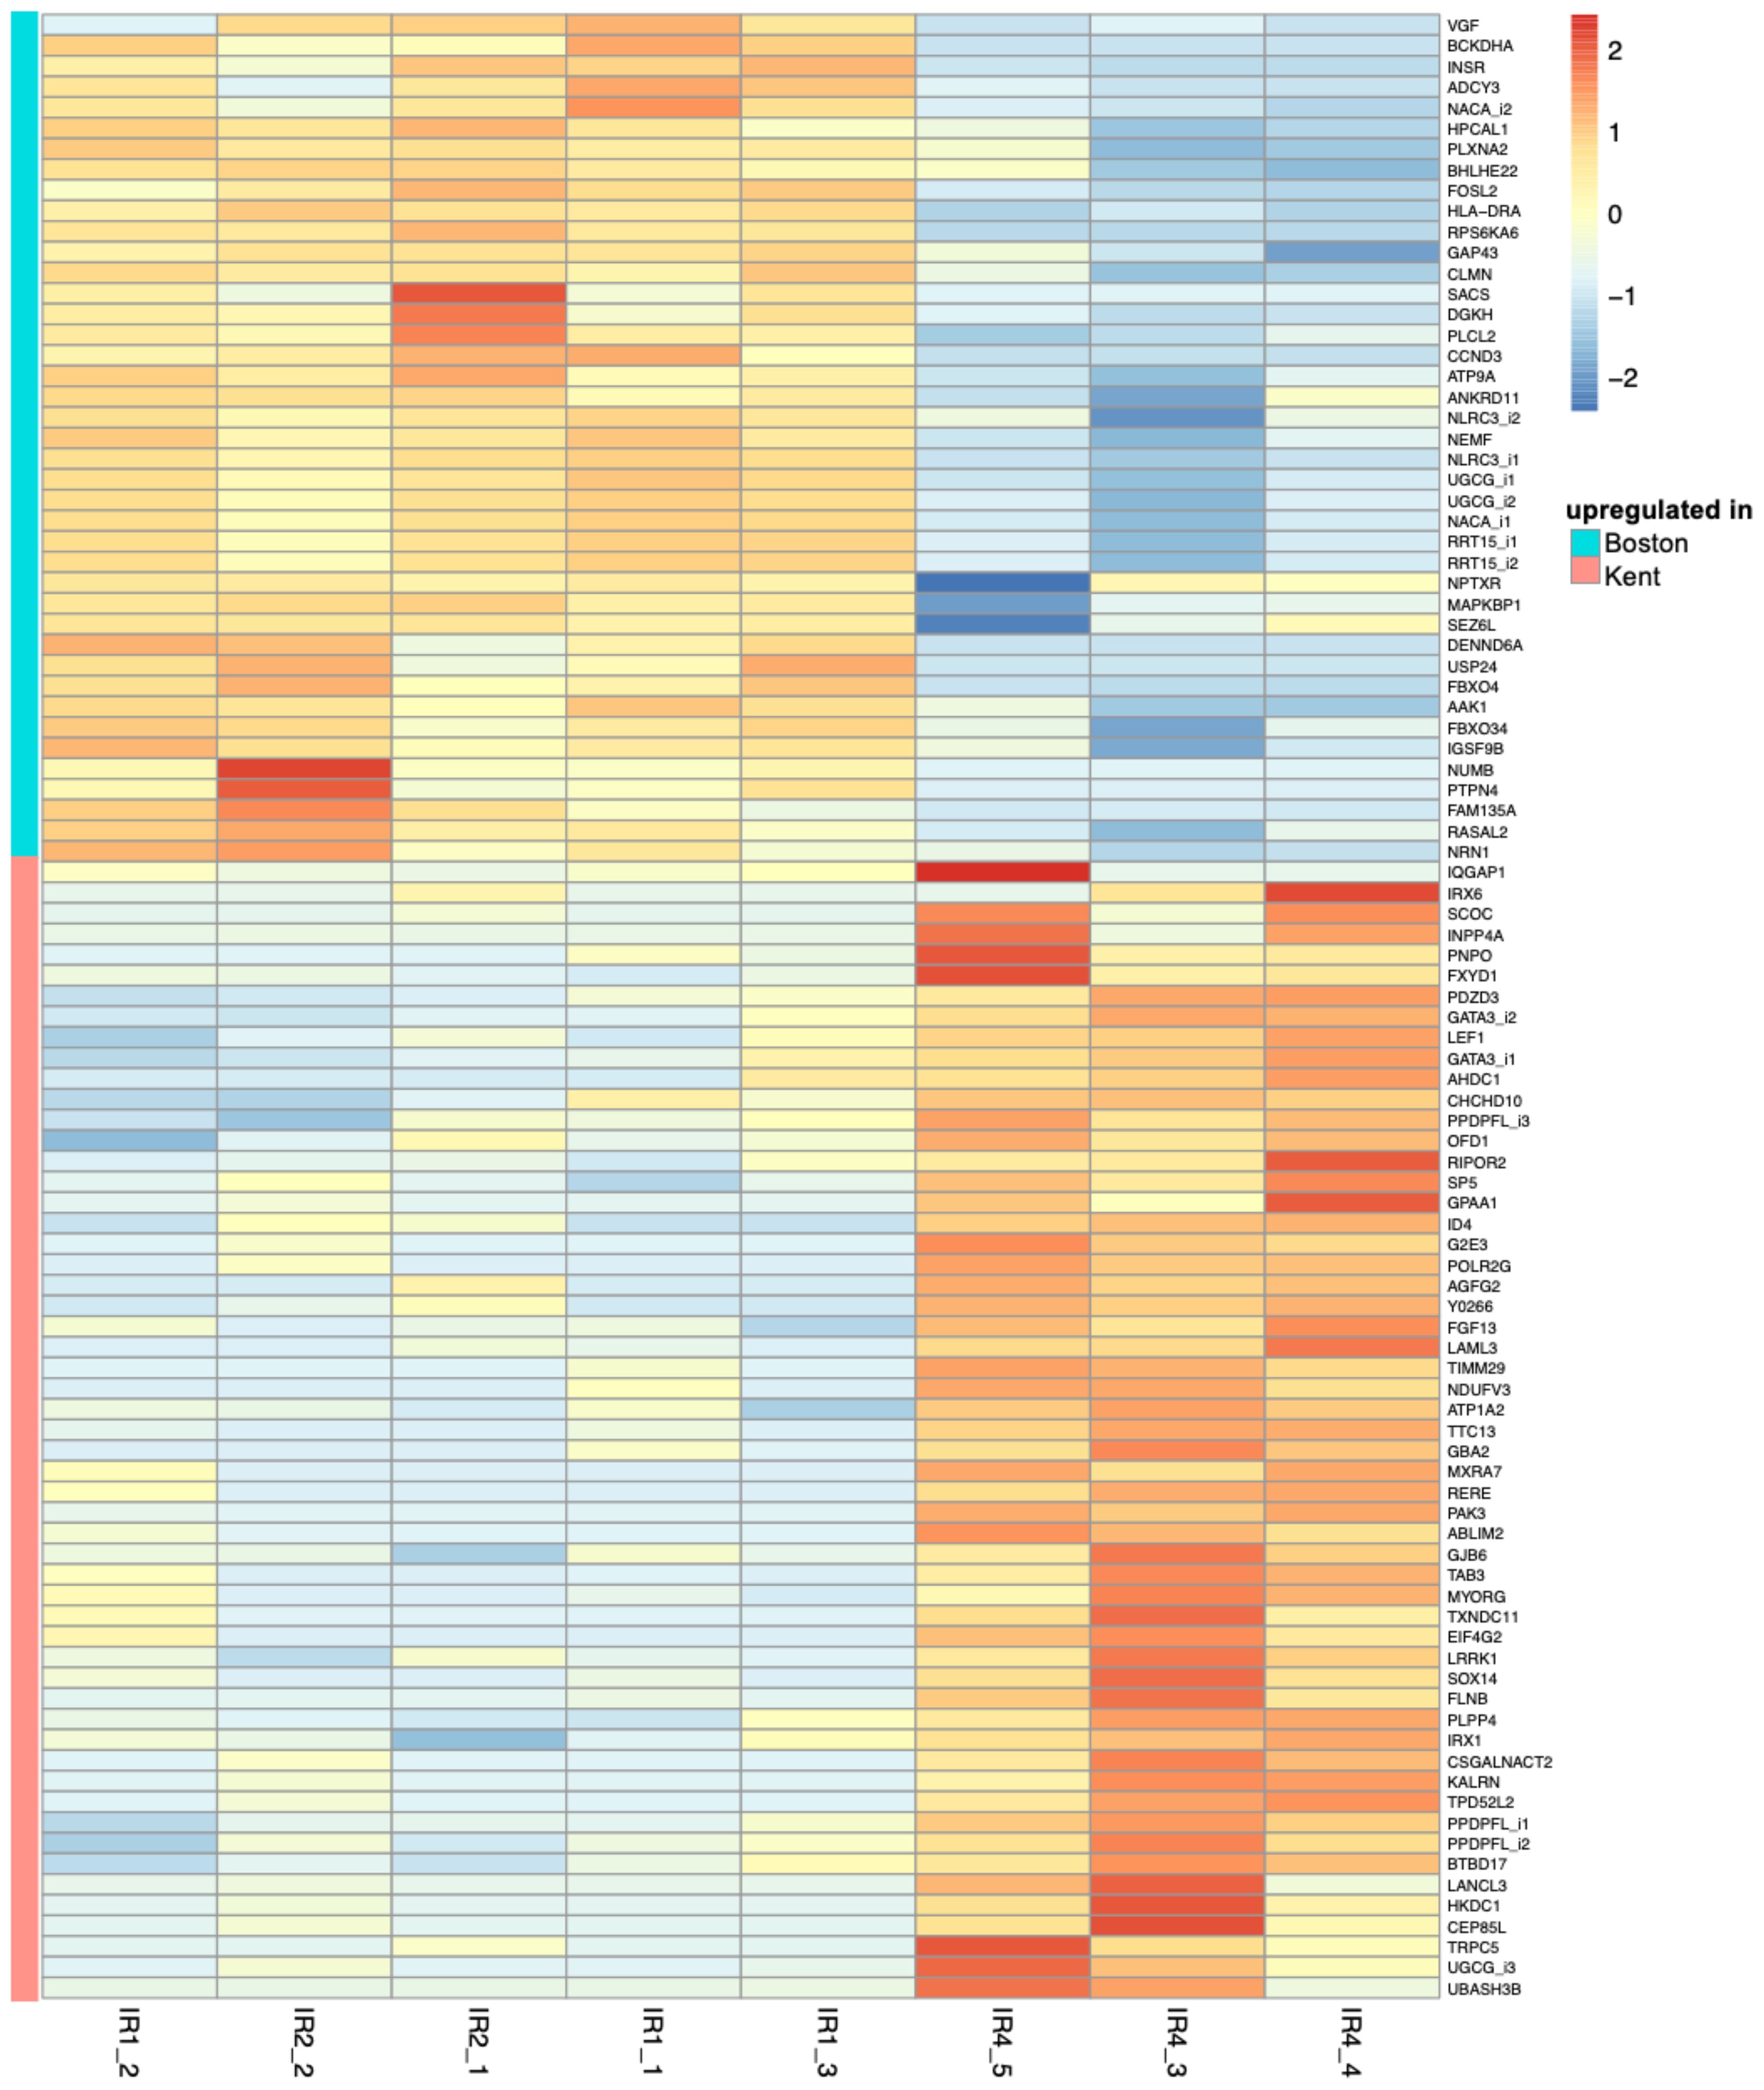
Figure 4 A heatmap of the log of the transcript per million values of all 96 differentially expressed transcripts in black-capped chickadee brains between Kent and Boston, scaled by row.
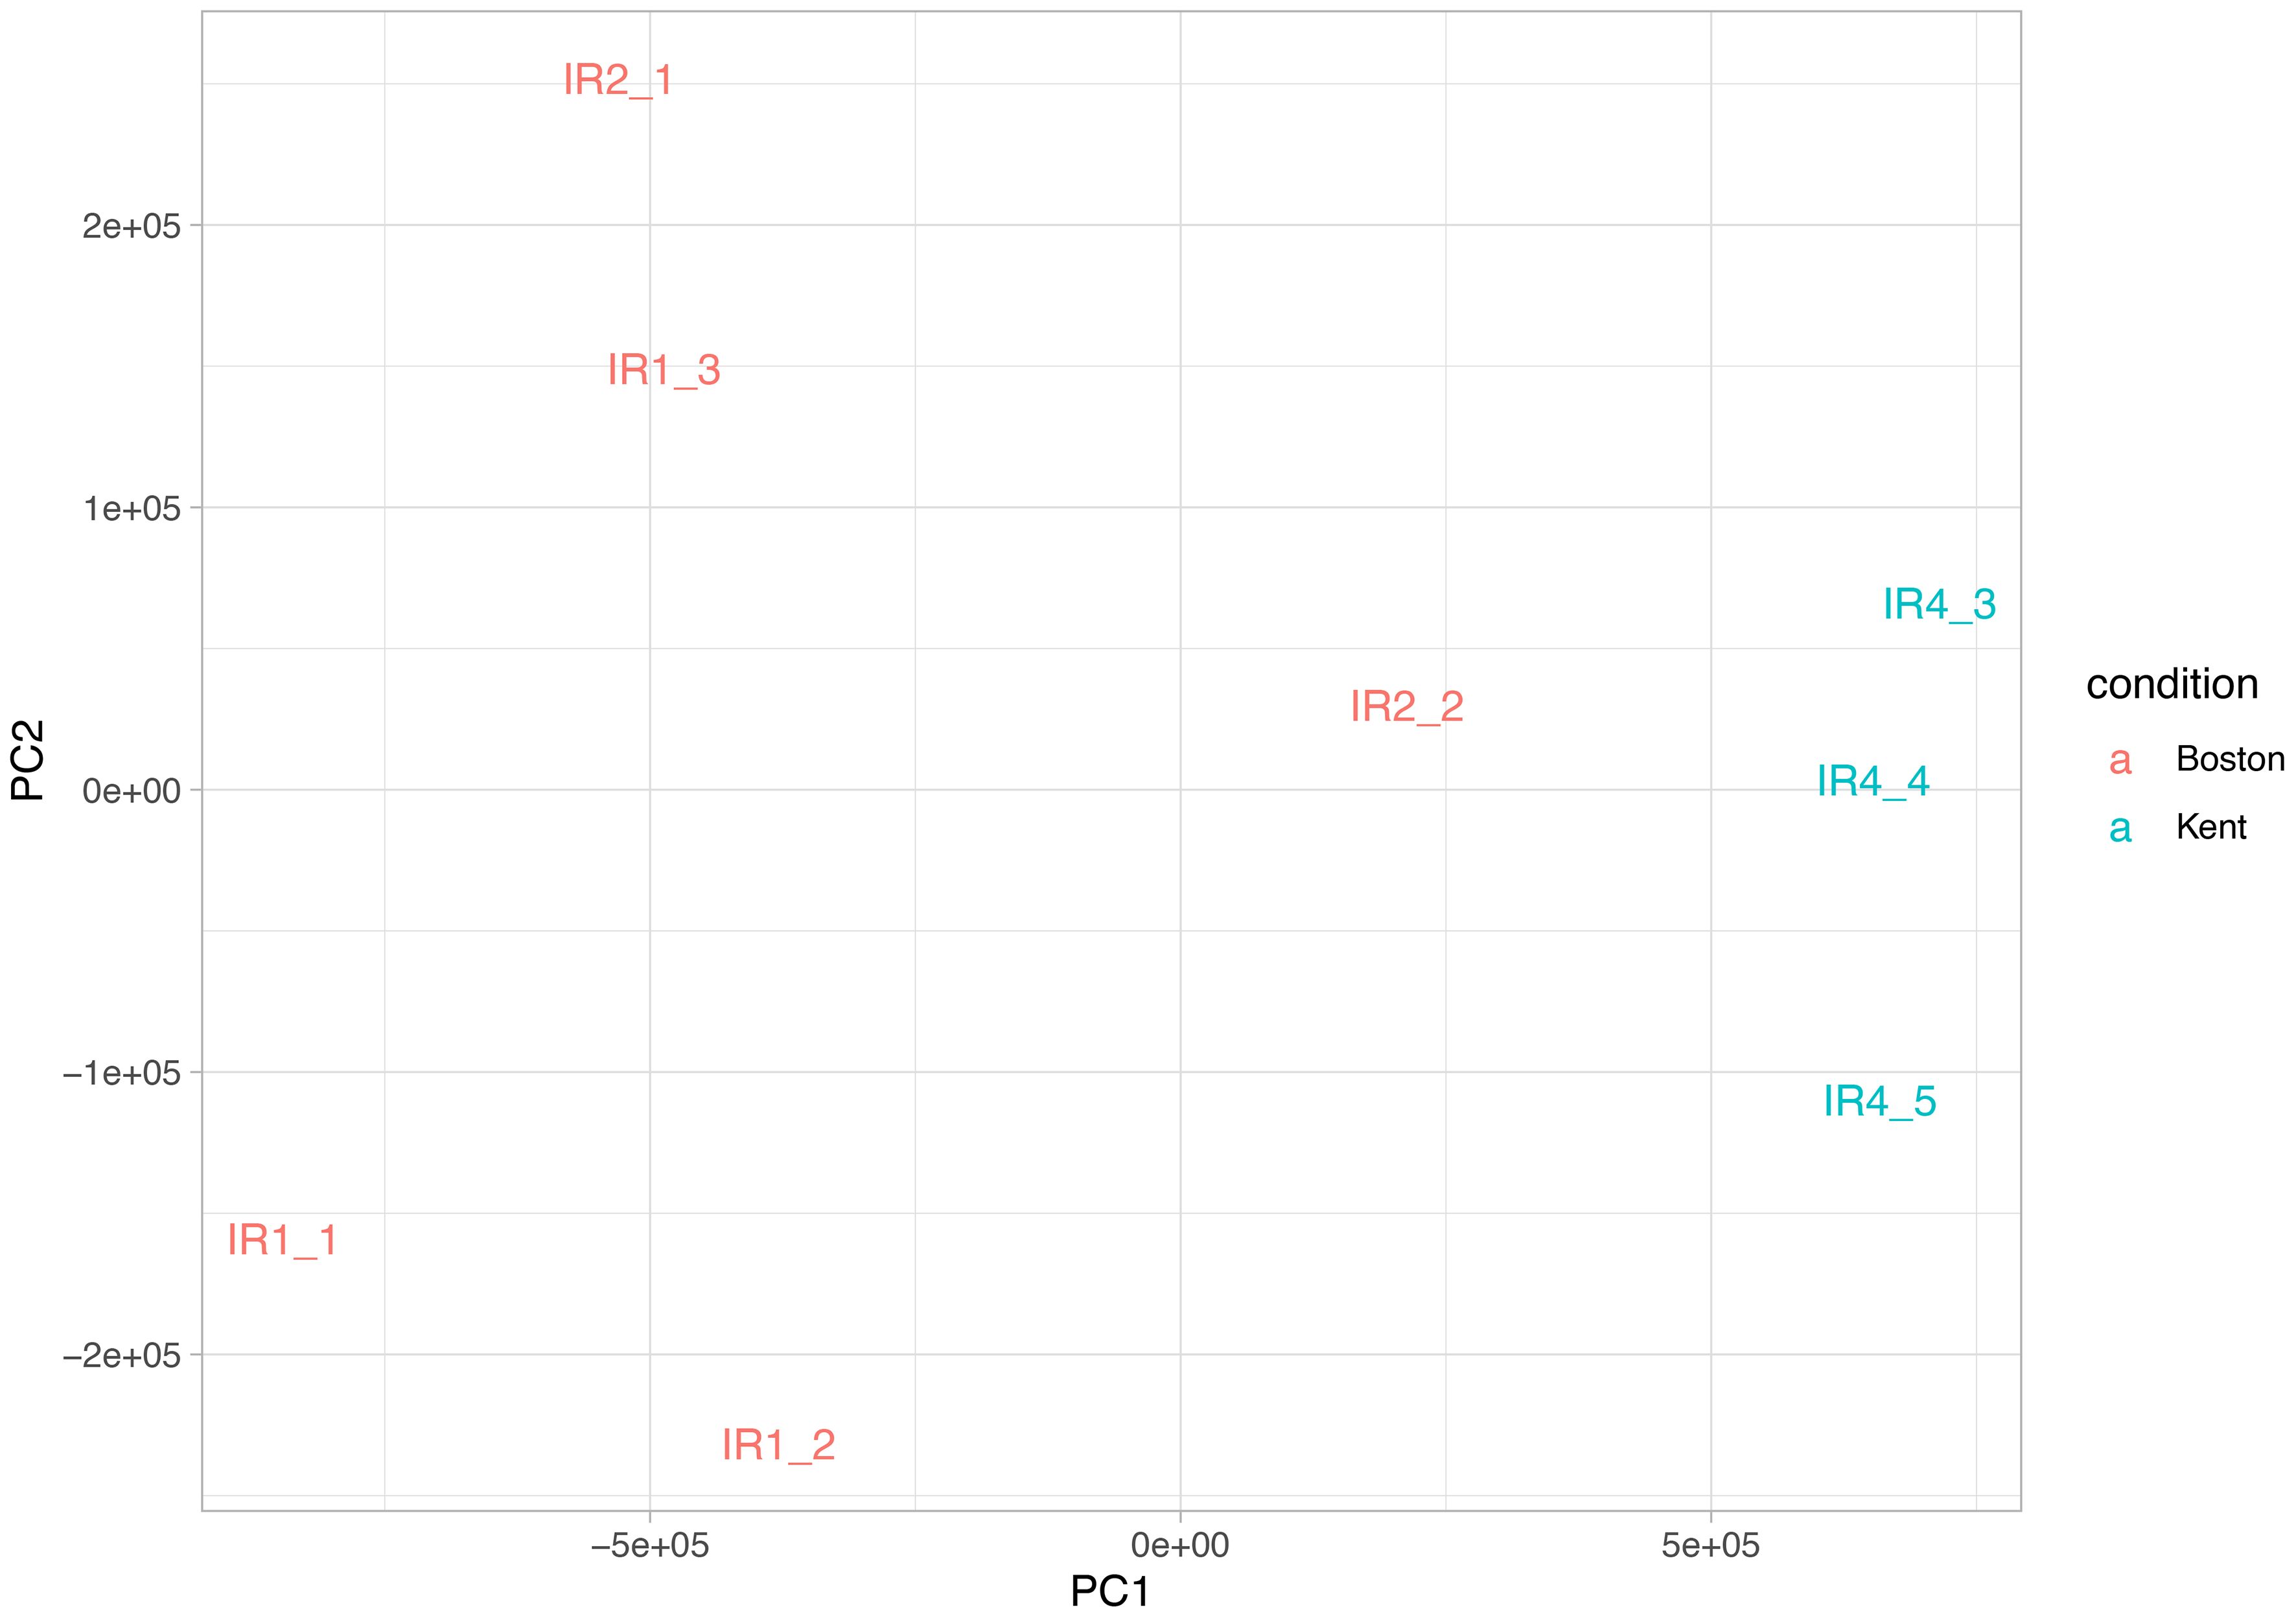
Figure 5 Principal component analysis of the estimated transcript abundance of all black-capped chickadee brain samples. PC1 explains 90.38% of the variance, while PC2 explains 5.89% of the variance.
Functional analysis of differentially expressed genes
The PANTHER v18.0 database was used to extract the gene family and protein class information for these DEGs in black-capped chickadees (Supplementary Table 4) and American goldfinches (Supplementary Table 5). We further carried out gene functional enrichment analysis of these DEGs. For the set of black-capped chickadee DEGs upregulated in the Kent population, STRING detected one enriched Gene Ontology (GO) term whereas g:Profiler detected functional enrichment in seven GO terms (Table 3). For the set of black-capped chickadee DEGs upregulated in Boston, STRING did not identify any enrichment in gene functions. g:Profiler, however, detected enrichment for one GO term (Supplementary Table 6). For AMGO, neither STRING nor g:Profiler identified any enrichment in GO terms among the DEGs.
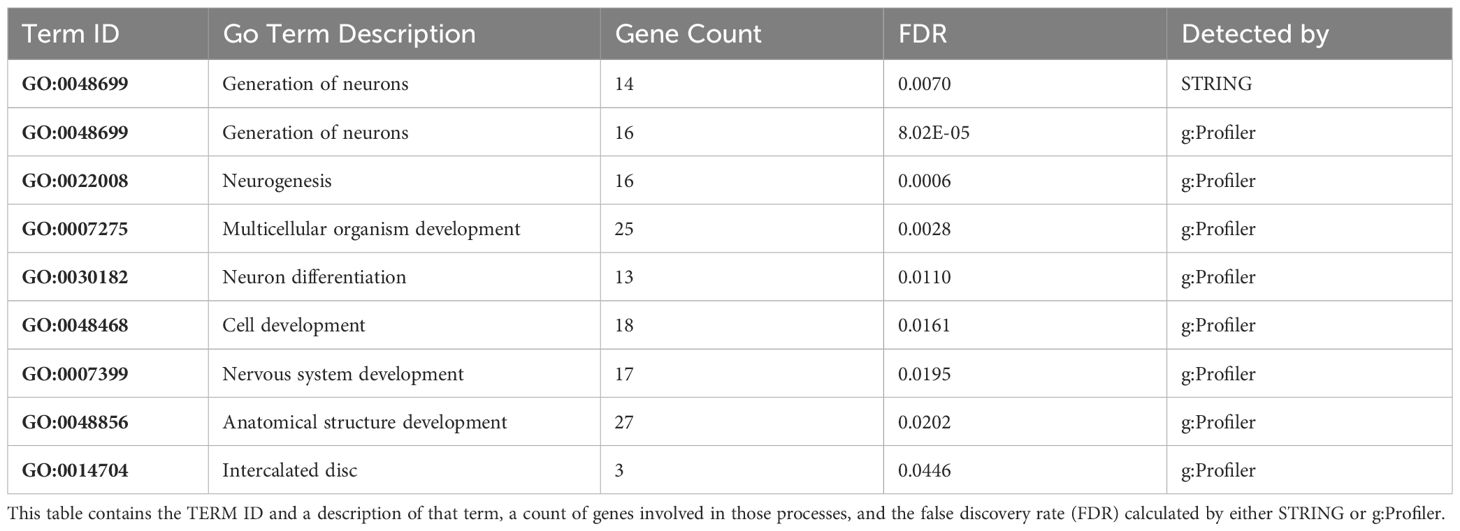
Table 3 Gene functions enriched in the black-capped chickadee DEGs upregulated in the Kent population and downregulated in the Boston population.
Aligning RNA-Seq reads to reference genomes and variant calling
On average 82.43% of black-capped chickadee (BCCH) RNAseq reads and 85.39% of American goldfinch (AMGO) reads across all samples were mapped to their respective reference genomes.
These alignments were further used to identify 1,538,703 sites that were polymorphic in at least one sample in BCCH. However, we only selected 433,210 high-quality biallelic SNPs in subsequent analyses using rigorous variant filtering criteria, as outlined in the methods. Using similar methods, we identified 535,179 high-quality biallelic SNPs that were polymorphic in AMGO.
Functional annotation of genetic variants
For black-capped chickadees, we identified 75,780 non-synonymous SNPs and 247,643 synonymous SNPs (N/S ~ 0.3). Out of 17,929 genes, 14,012 (78.2%) has N/S ratio of < 1. Similarly, for American goldfinch, we identified 44,732 non-synonymous SNPs and 113,893 synonymous SNPs (N/S ~ 0.39). Out of 16,025 genes, 10,874 (67.8%) has N/S ratio of < 1. We further analyzed the site frequency distribution of SNPs annotated as UTR, synonymous and non-synonymous (Supplementary Figure 5). The distribution showed a standard pattern for a randomly mating natural population, hence we believe this data was suitable for conducting population genetic diversity analysis.
Estimation of genetic diversity and divergence
In black-capped chickadees, the inbreeding coefficient (F) averaged 0.11 for the Kent population (0.057 – 0.211) and 0.10 for the Boston population (0.020 – 0.214). These values were normally distributed for Kent and Boston populations and were not significantly different from each other (p = 0.87) (Supplementary Table 7). Similarly, F scores for American goldfinches averaged 0.06 in the Kent population (0.035 – 0.084) and 0.10 (0.045 – 0.167) in the Boston population. These values were also normally distributed and not significantly different from each other (p = 0.13).
The average Weir and Cockerham FST estimates across all SNPs loci was ~ 0 between Kent and Boston populations in both species. We further selected SNPs with an FST > 0.8 as candidates that represented genomic regions showing significant genetic divergence between geographically distant populations. There were 115 SNPs with an FST > 0.8 in black-capped chickadees and 38 SNPs with an FST > 0.8 in American goldfinches. Of these SNPs, 89 fell within a 1kb region upstream or downstream of an annotated gene in black-capped chickadees and 21 fell within a 1kb region upstream or downstream of an annotated gene in American goldfinches.
Comparison between differentially expressed genes and highly divergent genetic variants
When comparing the list of genes identified as differentially expressed among geographically distinct populations in both species (Kent and Boston) and those possessing highly divergent candidate SNPs (FST > 0.8), no genes overlapped. However, we further used these two sets of genes to create a protein-protein interaction network using the STRING database. For black-capped chickadees, there were 174 nodes (proteins representing DEGs and highly divergent genes) and 75 edges (evidence of protein-protein interaction) (Figure 6). For American goldfinches, there were 28 nodes and only 1 edge (Supplementary Figure 4).
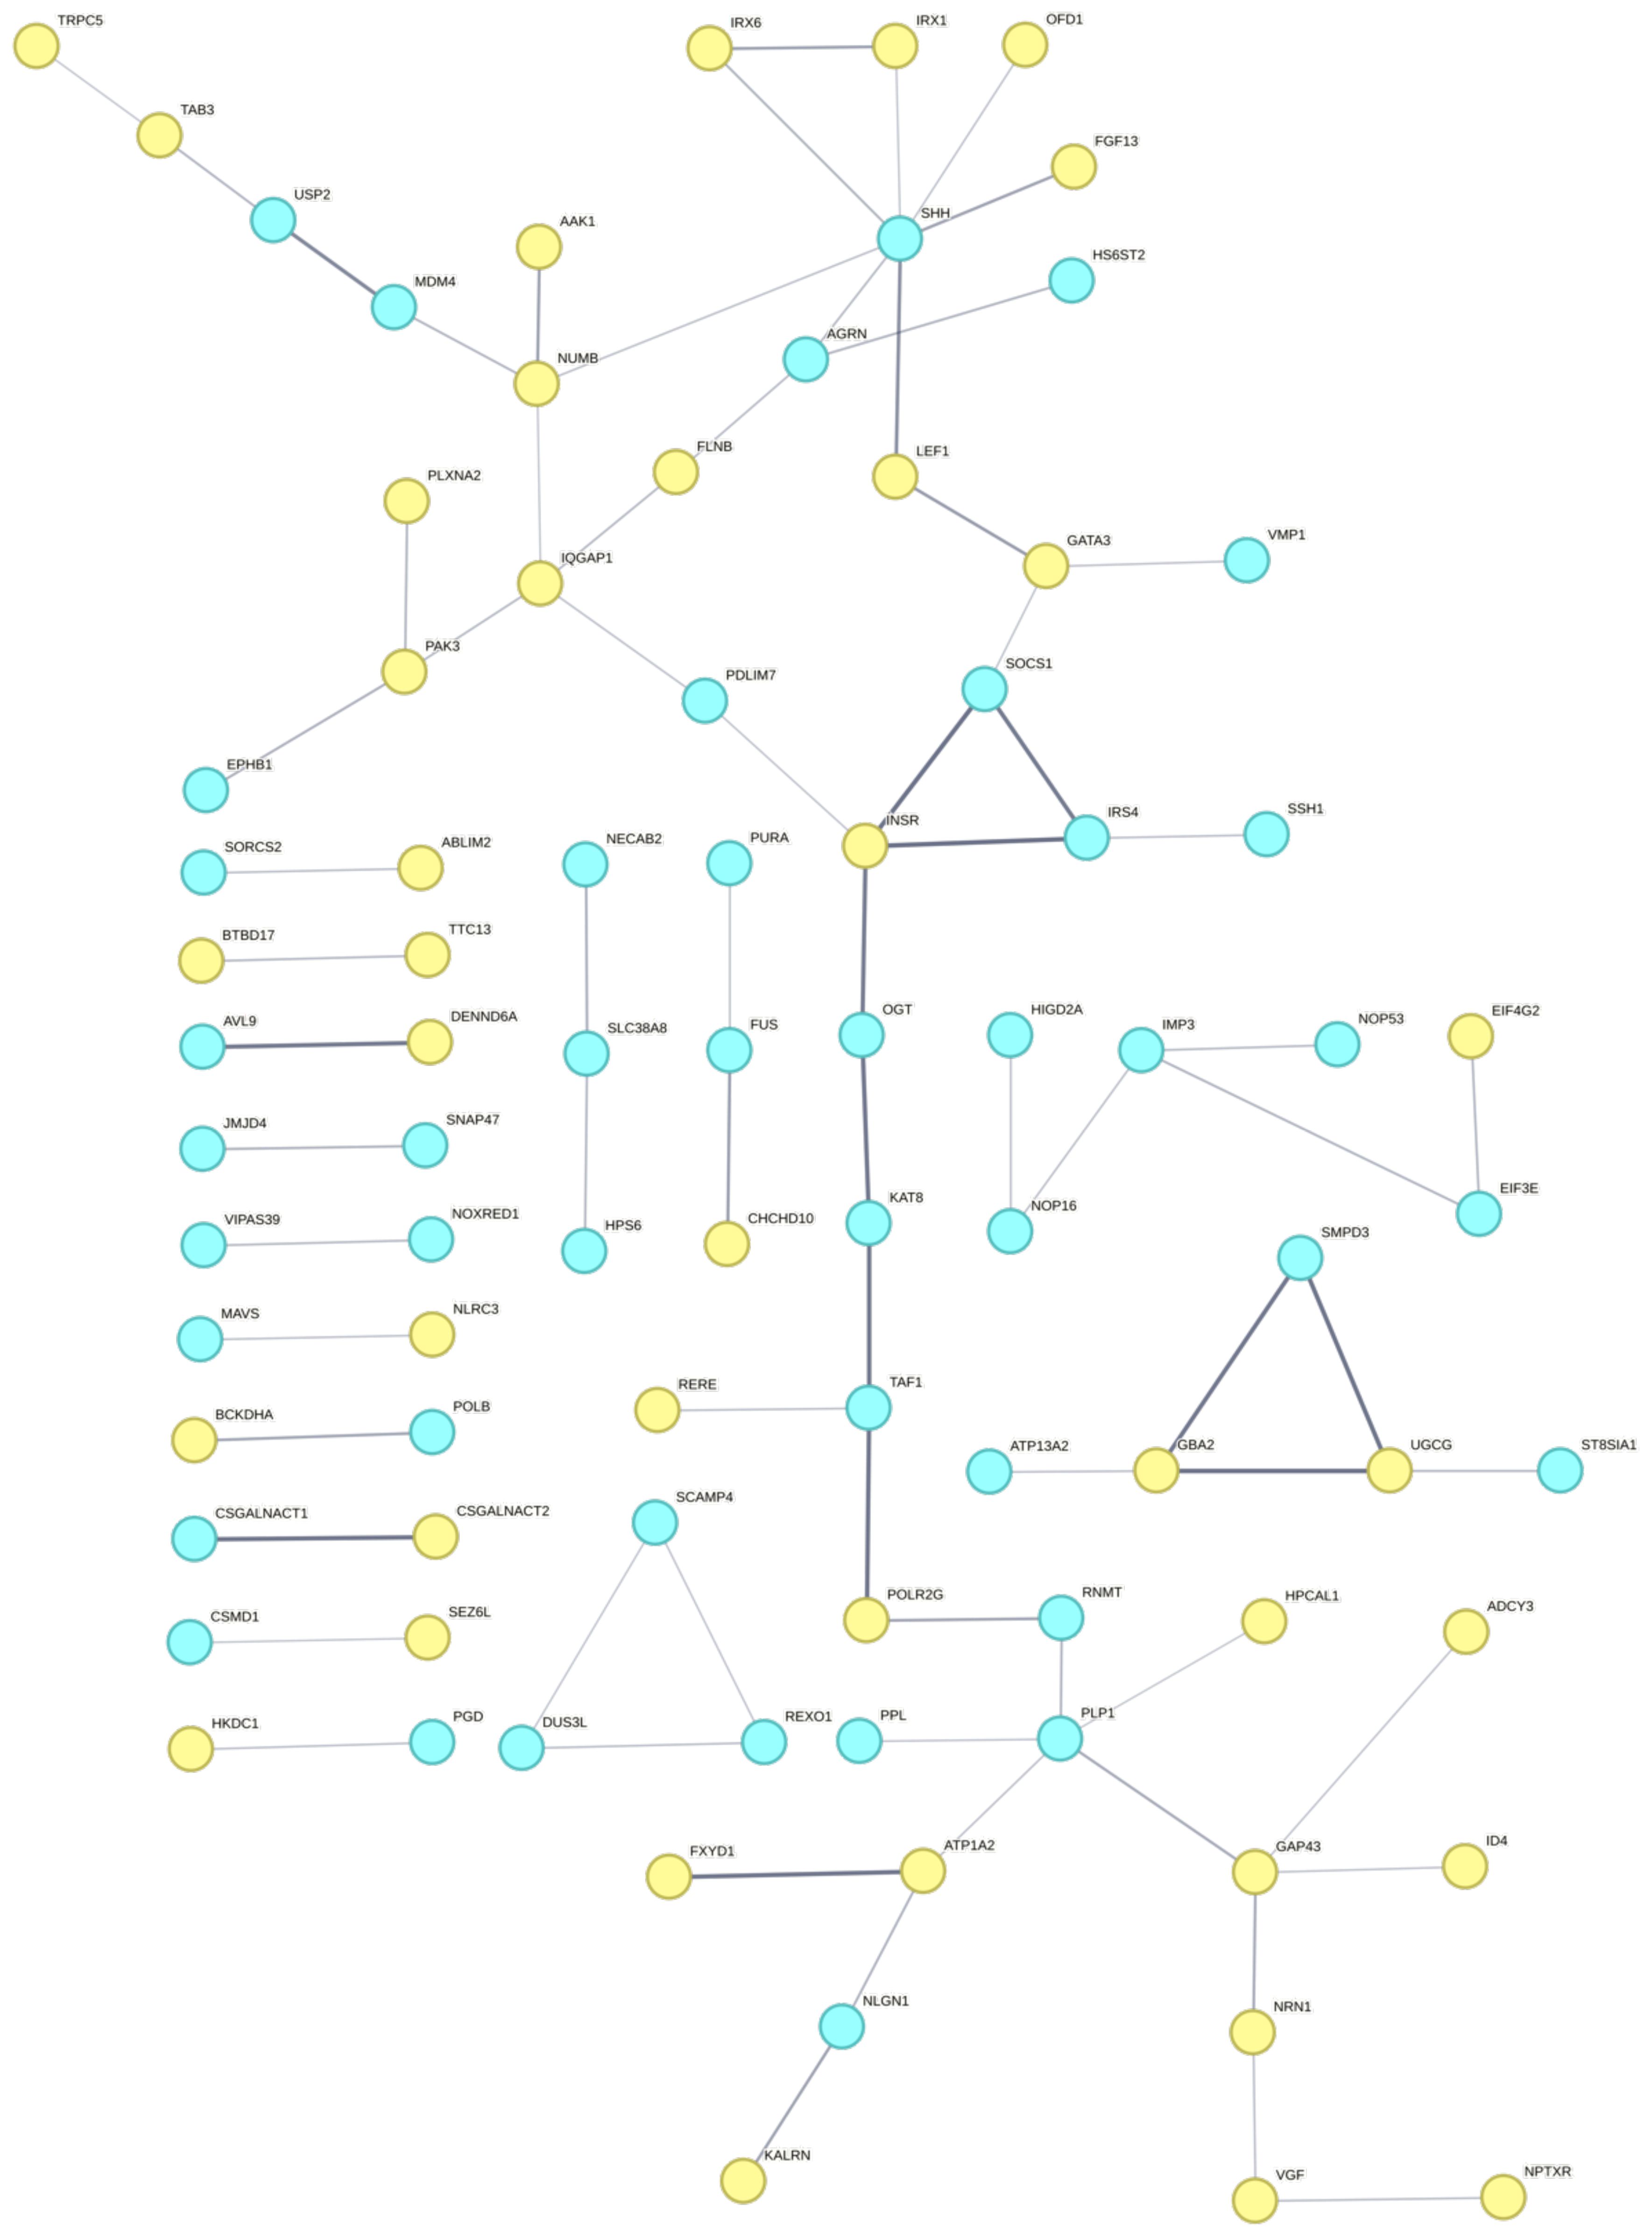
Figure 6 The STRING network of protein-protein interactions between differentially expressed genes (yellow) and genes overlapping highly divergent genetic variants (blue) in black-capped chickadee brains between Boston and Kent populations.
Discussion
Justification for the use of wild birds in this study
The use of wild birds may be necessary when studying species-specific behaviors, ecological interactions, or adaptations that cannot be adequately replicated using alternative models. Wild birds provide valuable insights into natural processes and behaviors that cannot be fully captured in laboratory settings or with alternative experimental approaches. Therefore, replacing wild birds with alternative models may not be feasible without compromising the scientific validity or relevance of the study. In this study, the number of wild birds sampled was minimized using appropriate statistical analysis techniques to ensure that meaningful conclusions can be drawn while minimizing the number of individuals required. Studying gene expression patterns associated with cognitive mechanisms associated with behavior or adaptation necessitated the analysis of brain tissues, and requirement of sacrificing a limited set of birds. This research question could not be answered using alternative methods or non-invasive sampling techniques. The usage of wild birds in this study strictly adhered to the principles of the 3Rs: Replacement, Reduction, and Refinement.
Quality of de-novo transcriptome assemblies
A high contig N50 statistic, over 95% of the original RNA-seq read pairs mapping back to the transcriptome assemblies in both species supported that the reference transcriptomes were constructed successfully. The transcriptome completeness assessment using BUSCO indicated some evidence of missing orthologs; however, this is explained by the fact that our assemblies are derived from only two tissues (brain and liver), and not all genes are expected to be expressed in every single tissue of an organism (Manni et al., 2021). BUSCO analysis also indicated a high degree of duplication, which can be explained due to the nature of the transcriptome that was assembled consisting of multiple isoforms of the same genes.
Differential gene expression analysis
The number of differentially expressed genes (DEGs) between the Kent and Boston populations was higher in black-capped chickadees compared to American goldfinches. Several factors could be contributing to this result. First, black-capped chickadees and American goldfinches might exhibit different levels of genetic diversity between their geographically separated populations. If black-capped chickadee populations have higher genetic divergence, it would lead to a higher number of DEGs, as this genetic variation may drive gene expression differences. They are also different species with distinct biological and ecological characteristics. The specific genes that drive differences between the two populations in both species may be functionally related to local adaptation, which may be more pronounced in one species than the other. These observations will require further investigation to understand the underlying biological mechanisms driving these differences between the two species.
In black-capped chickadees, among the list of DEGs, we identified functional enrichment for pathways related to nervous system development, such as generation of neurons, neurogenesis, neuron differentiation, neuron projection development and morphogenesis, neuroblast division, and axon development. Overall, the associated genes are known to be involved in both short-term synapse formation, adult brain maintenance, and embryonic and postnatal brain development. Interestingly, some of our DEGs have been identified in previous studies of brain variation in populations of related species of chickadees. Genes upregulated in Kent populations such as PAK3, KALRN, CEP85L, LEF1, FGF13, and GATA3 are known to be associated with cognitive ability in mountain chickadees (Poecile gambeli) (Branch et al., 2022). Similarly, genes upregulated in Boston populations such as NRN1 and CLMN are known to be associated with an improved cognitive phenotype (Branch et al., 2022). Another study by Pravosudov et al. (2013) investigating gene expression in the brain associated with environmental harshness in black-capped chickadees from Kansas and Alaska found a gene we identified to be upregulated in Boston, PLXNA2, to be upregulated in Kansas. However, just because we have identified some of the same genes, does not mean we can definitively say they are associated with environmentally driven variation in cognition or spatial learning and additional measurements of associated trait data in either population will be required in the future.
The DEGs we have identified may be associated with long-term genetic divergence (due to selection-mediated local adaptation or non-adaptive processes such as genetic drift) or plastic responses to short-term environmental differences between two locations. When assessing the environmental variables present in Kent and Boston, overall, they have a similar long-term climate, though they have a great degree of interannual variability. During the month before sampling, the climate in Kent was markedly harsher with greater snow cover and colder temperatures than in Boston. In species of birds that rely on food-caching to survive winter, the harsher an environment is, the greater that bird’s survival depends on accurate retrieval from caches, even short-term caches (Chancellor et al., 2011). The upregulation of genes associated with activity-dependent plasticity and spatial memory in birds that were exposed to colder temperatures and higher snow cover could be a result of this need for enhanced cognition to cope with challenges posed by harsh environmental conditions.
Beyond underlying genetic structure, it is also possible that early developmental conditions rather than environmental fluctuations in these bird’s adult life led to differences in gene expression patterns (Hoshooley et al., 2007). A comparative study examining the epigenetic profiles of these populations could provide valuable insight into the impact of short-term environmental fluctuations on gene expression. Such studies can help us understand the interplay between gene expression, epigenetics, and environmental factors in shaping the cognitive and behavioral traits of these populations. In addition, as food availability is a crucial factor influencing the stress levels of birds during winter, surveying the amount of supplemental feeding or general food availability in the sampling area will be an important consideration for informing and contextualizing future studies on the impact of environmental fluctuations on cognitive and behavioral traits in these birds.
Estimation of genetic diversity and divergence
By calculating transcriptome-wide patterns of heterozygosity, we assessed the genetic diversity within and between populations. Two-sample, unpaired t-tests showed that the inbreeding coefficient (F score) between the two black-capped chickadee populations and the two American goldfinch populations in Kent and Boston were not significantly different from each other. Across all individuals, the F value was relatively low. Overall, it seems there is not much inbreeding occurring within these populations as the overall number of homozygous sites is close to the expected number of homozygous sites. This shows there is sufficient standing genetic variation within both populations, indicating a large effective population size in both species. However, a larger sample size would be needed in future studies to get more comprehensive population-wide genetic estimates.
The mean Weir and Cockerham FST estimates that compared genetic divergence between populations were also low overall between Kent and Boston populations in both species. This low value of FST indicated there is relatively low genetic differentiation in the protein-coding regions between the two populations. A low FST value in protein-coding regions indicates sequence conservation and a lack of divergence in functionally important regions (transcribed genes). Genetic conservation of protein-coding regions often suggests that the genes perform vital functions, and any significant changes or mutations in these regions may have deleterious effects on the organism’s fitness (Tatarinova et al., 2016). Studying the whole genome, including non-coding regions under less evolutionary constraint, will provide a more comprehensive and accurate indication of overall genetic divergence between these populations.
Yet, despite a low mean FST estimate across all sites, there were still SNPs with high FST values indicating the fixation of different alleles between these populations. Between Boston and Kent populations, the American goldfinch brain transcriptome had 762 SNPs with an FST above 0.6, 252 with an FST above 0.7, 38 with an FST above 0.8, 9 with an FST above 0.9, and 1 with an FST = 1. The black-capped chickadee brain transcriptome had 1,057 SNPs with an FST above 0.6, 424 with an FST above 0.7, 115 with an FST above 0.8, and 14 with an FST above 0.9, all of which have an FST = 1. Similar to the results from the differential expression analysis conducted, it appears that black-capped chickadee populations from Kent and Boston are genetically more diverged compared to American goldfinches. While genetic differentiation among these geographically separated populations might arise from environmental stressors driving the selection of distinct alleles in each location, it could also result from demographic processes like genetic drift. Additional investigation such as direct assessments of the fitness of these individuals is required to ascertain whether these divergences in coding sequences are under selection or random genetic drift.
Comparison between differentially expressed genes and highly divergent genetic variants
Interestingly, none of the SNPs with a high FST between populations in both species were found in the vicinity of the genes identified to be differentially expressed in these populations. Because of this, we can reject the hypothesis that sequence variations occurring within the protein-coding regions of the differentially expressed genes are regulating changes in their gene expression levels. However, as RNA-Seq data only spans transcribed regions of the genome, our SNP dataset was not able to capture any mutations occurring in cis-regulatory elements such as promoters, enhancers, and silencers which lie in non-coding regions up and downstream of the target genes. Therefore, we cannot reject or accept the hypothesis that differential expression levels in these candidate genes are due to mutations in the cis-regulatory regions of the genome.
Although our findings revealed no common genes displaying genetic differentiation and alteration in their expression patterns between geographically distant populations, it remains possible that these two sets of genes could still interact through shared biological pathways, or even by functioning as trans-acting factors. By examining the protein-protein interaction networks between DEGs and the genes falling within a 1kb vicinity of the divergent SNPs (FST > 0.8) in black-capped chickadees, we identified possible trans-acting factors that may be regulating genes that were differentially expressed. We identified ten transcription factors (BHLHE22, FOSL2, GATA3, ID4, IRX1, IRX6, LEF1, NACA, SOX14, SP5) among the list of differentially expressed genes in black-capped chickadees. Seven were upregulated in Kent (GATA3, ID4, IRX1, IRX6, LEF1, SOX14, SP5) and three were upregulated in Boston (BHLHE22, FOSL2, NACA). These genes may function as trans-regulators of other DEGs. Though they did not have any divergent SNPs within their coding regions, they may still have sequence variation in a non-coding cis-regulatory region, that possibly influences the expression of their downstream target genes.
Three transcription factors (IRX1, IRX6, and LEF1) were found to have protein-protein interactions with one gene containing a divergent SNP, Sonic Hedgehog (SHH). In mammals, SHH plays a large role in both embryonic development and in regulating continual differentiation and proliferation of neuronal precursor cells in adult mammals (Lai et al., 2003; Banerjee et al., 2005). However, the role of SHH in adult neurogenesis in birds has yet to be confirmed. Besides the transcription factors, SHH shares an edge with two other DEGs, FGF13 and OFD1. Though SHH is not a transcription factor, it is a signaling molecule that can regulate other transcription factors (Sasai et al., 2019) and it may be involved in the trans-regulation of the DEGs we have identified.
We have also identified divergent SNPs in the vicinity of three additional transcription factors (TAF1, PURA, and ZF507). TAF1 is a TATA-box binding protein-associated factor, which plays an important role in transcription initiation. Within the brain, TAF1 plays an important role in embryonic neurodevelopmental processes, and mutations have been linked to intellectual disabilities (Grudmundsson et al., 2019). We have identified two DEGs (RERE and POLR2G) having protein-protein interactions with TAF1. Both RERE and POLR2G were upregulated in Kent, hence, sequence variation in the vicinity of TAF1 may lead this gene to have a trans-regulatory effect associated with the upregulation of RERE and POLR2G in Kent populations.
Overall, these results indicate that the genetic architecture underlying the differential gene expression patterns is likely regulatory rather than protein-coding genetic divergence. First, no differentially expressed genes had highly divergent SNPs in their coding regions. Also, some of the DEGs themselves are transcription factors that may play a role in the trans-regulation of other DEGs. Some of the genes within the vicinity of highly divergent SNPs are transcription factors or regulatory molecules that may play a role in the trans-regulation of target DEGs. Additionally, there may be cis-regulator mutations within regulatory regions upstream and downstream of the DEGs themselves. However, though we have identified putative genes that might be involved in the trans-regulation of gene expression, functional studies using gene knockouts would be required to determine the effect they are having in the avian brain. Additionally, in both species, beyond cis- or trans-regulatory control, the differences in gene expression could also be regulated by epigenetic modifications. Further experiments would need to be conducted, such as Whole Genome Bisulfite Sequencing, CHIP-sequencing, or ATAC-sequencing, to examine variation in epigenetic markers such as DNA methylation or histone modification, respectively, between the two populations that may be associated with regulation of gene transcription and subsequent expression levels in either population.
Conclusion
In this study, we were able to identify differentially expressed genes (DEGs) between geographically distant populations of two North American songbirds (black-capped chickadees and American goldfinches). Within the black-capped chickadees, many of these differentially expressed genes are known to be involved in neurogenesis and associated with cognitive traits. Some of the DEGs we have identified have been previously associated with cognitive and memory functions. Hence, these gene expression differences may be associated with food-caching and spatial memory that allow these birds to search for and retrieve stored food in colder periods as suggested by other studies.
We further attempted to explore the possible genetic underpinnings of these differences in gene expression between geographically distant populations. We did not find any significantly divergent single nucleotide polymorphisms (SNPs) within or near the coding regions of the DEGs in either species. Nevertheless, it’s important to note that the absence of such SNPs does not rule out the possibility of divergent cis-regulatory SNPs in non-coding regions linked to these DEGS. We did find potential trans-acting genes, including transcription factors that exhibited either differential expression or carried highly divergent SNPs. These genes may be the drivers of changes in gene expression that we observed between populations. Although we were able to characterize the gene expression differences and their possible underlying genetic mechanisms, we have yet to provide a definitive answer regarding whether the observed gene expression changes represent short-term or long-term responses. A comprehensive approach, utilizing a combination of laboratory experiments and field studies will be necessary for investigating how gene expression patterns vary between populations and across seasons.
Species with large distribution ranges are very good study systems to investigate the underlying genetic basis of gene expression differences occurring across populations residing in varying locations with varying degrees of climate. Observing a substantial degree of heterogeneity in the gene expression patterns during winter between two geographically separated populations of the same species highlights an important consideration for studies focused on seasonality. Specifically, these results suggest that genes highly expressed in one population may not exhibit uniform expression across the entire geographic range of the species. This emphasizes the need to account for and understand the local adaptations and variations in gene expression that can exist within a single species, particularly in response to seasonal and environmental factors.
Data availability statement
The datasets presented in this study can be found in online repositories. The names of the repository/repositories and accession number(s) can be found below: BioProject, PRJNA1074828.
Ethics statement
The animal study was approved by Institutional Animal Care and Use Committee (IACUC) at Kent State University. The study was conducted in accordance with the local legislation and institutional requirements.
Author contributions
IR: Formal analysis, Investigation, Methodology, Validation, Visualization, Writing – original draft. TT: Formal analysis, Methodology, Writing – review & editing. RL: Methodology, Writing – review & editing. SYWS: Methodology, Writing – review & editing. CP: Methodology, Writing – review & editing. SL: Conceptualization, Data curation, Formal analysis, Funding acquisition, Investigation, Methodology, Project administration, Resources, Software, Supervision, Validation, Visualization, Writing – original draft, Writing – review & editing. SS:
Funding
The author(s) declare financial support was received for the research, authorship, and/or publication of this article. This project received support from the Department of Biological Sciences at Kent State University to SL. IR was further supported by the Graduate Student Senate of Kent State University for expenses associated with sample collection and processing.
Acknowledgments
We appreciate the assistance provided by Prashant Ghimire and the entire team at the Lamichhaney Lab for their contributions to the field and laboratory work related to this project. Furthermore, we express our gratitude to Dr. Jonathan Schmitt, Dr. Kathrin Näpflin, Dr. Scott Edwards, and the rest of the members of Edwards Lab at Harvard University for their contributions in collecting samples from Boston.
Conflict of interest
The authors declare that the research was conducted in the absence of any commercial or financial relationships that could be construed as a potential conflict of interest.
The author(s) declared that they were an editorial board member of Frontiers, at the time of submission. This had no impact on the peer review process and the final decision.
Publisher’s note
All claims expressed in this article are solely those of the authors and do not necessarily represent those of their affiliated organizations, or those of the publisher, the editors and the reviewers. Any product that may be evaluated in this article, or claim that may be made by its manufacturer, is not guaranteed or endorsed by the publisher.
Supplementary material
The Supplementary Material for this article can be found online at: https://www.frontiersin.org/articles/10.3389/fbirs.2024.1382657/full#supplementary-material
References
Acasuso-Rivero C., Murren C. J., Schlichting C. D., Steiner U. K. (2019). Adaptive phenotypic plasticity for life-history and less fitness-related traits. Proc. R. Soc. B: Biol. Sci. 286, 20190653. doi: 10.1098/rspb.2019.0653
Albert F. W., Bloom J. S., Siegel J., Day L., Kruglyak L. (2018). Genetics of trans-regulatory variation in gene expression. eLife 7, e35471. doi: 10.7554/eLife.35471.062
Alvarez M., Schrey A. W., Richards C. L. (2015). Ten years of transcriptomics in wild populations: what have we learned about their ecology and evolution? Mol. Ecol. 24, 710–725. doi: 10.1111/mec.13055
Banerjee S. B., Rajendran R., Dias B. G., Ladiwala U., Tole S., Vaidya V. A. (2005). Recruitment of the Sonic hedgehog signalling cascade in electroconvulsive seizure-mediated regulation of adult rat hippocampal neurogenesis. Eur. J. Neurosci. 22, 1570–1580. doi: 10.1111/j.1460-9568.2005.04317.x
Barnea A., Pravosudov V. (2011). Birds as a model to study adult neurogenesis: bridging evolutionary, comparative and neuroethological approaches. Eur. J. Neurosci. 34, 884–907. doi: 10.1111/j.1460-9568.2011.07851.x
Branch C. L., Semenov G. A., Wagner D. N., Sonnenberg B. R., Pitera A. M., Bridge E. S., et al. (2022). The genetic basis of spatial cognitive variation in a food-caching bird. Curr. Biol. 32, 210–219.e4. doi: 10.1016/j.cub.2021.10.036
Bray N. L., Pimentel H., Melsted P., Pachter L. (2016). Near-optimal probabilistic RNA-seq quantification. Nat. Biotechnol. 34, 888. doi: 10.1038/nbt0816-888d
Brouard J. S., Schenkel F., Marete A., Bissonnette N. (2019). The GATK joint genotyping workflow is appropriate for calling variants in RNA-seq experiments. J. Anim. Sci. Biotechnol. 10, 44. doi: 10.1186/s40104-019-0359-0
Bryant D. M., Johnson K., DiTommaso T., Tickle T., Couger M. B., Payzin-Dogru D., et al. (2017). A tissue-mapped axolotl de novo transcriptome enables identification of limb regeneration factors. Cell Rep. 18, 762–776. doi: 10.1016/j.celrep.2016.12.063
Chancellor L. V., Roth T. C., LaDage L. D., Pravosudov V. V. (2011). The effect of environmental harshness on neurogenesis: a large-scale comparison. Dev. Neurobiol. 71, 246–252. doi: 10.1002/dneu.20847
Cingolani P., Platts A., Wang le L., Coon M., Nguyen T., Wang L., et al. (2012). A program for annotating and predicting the effects of single nucleotide polymorphisms, SnpEff: SNPs in the genome of drosophila melanogaster strain w1118; iso-2; iso-3. Fly (Austin). 6 (2), 80–92. doi: 10.4161/fly.19695
Danecek P., Auton A., Abecasis G., Albers C. A., Banks E., DePristo M. A., et al. (2011). The variant call format and VCFtools. Bioinformatics 27, 2156–2158. doi: 10.1093/bioinformatics/btr330
Desrochers A., Hannon S. J., Nordin K. E. (1988). Winter survival and territory acquisition in a northern population of black-capped chickadees. Auk 105, 727–736. doi: 10.1093/auk/105.4.727
Fraser H. B. (2013). Gene expression drives local adaptation in humans. Genome Res. 23, 1089–1096. doi: 10.1101/gr.152710.112
Fujiki K., Kano F., Shiota K., Murata M. (2009). Expression of the peroxisome proliferator activated receptor gamma gene is repressed by DNA methylation in visceral adipose tissue of mouse models of diabetes. BMC Biol. 7, 38. doi: 10.1186/1741-7007-7-38
Grabherr M. G., Haas B. J., Yassour M., Levin J. Z., Thompson D. A., Amit I., et al. (2011). Full-length transcriptome assembly from RNA-Seq data without a reference genome. Nat. Biotechnol. 29, 644–652. doi: 10.1038/nbt.1883
Grudmundsson S., Wilbe M., Filipek-Górniok B., Molin A. M., Ekvall S., Johansson J., et al. (2019). TAF1, associated with intellectual disability in humans, is essential for embryogenesis and regulates neurodevelopmental processes in zebrafish. Sci. Rep. 9, 10730. doi: 10.1038/s41598-019-46632-8
Grundberg E., Small K. S., Hedman Å.K., Nica A. C., Buil A., Keildson S., et al. (2012). Mapping cis- and trans-regulatory effects across multiple tissues in twins. Nat. Genet. 44, 1084–1089. doi: 10.1038/ng.2394
Haas B. J., Papanicolaou A., Yassour M., Grabherr M., Blood P. D., Bowden J., et al. (2013). De novo transcript sequence reconstruction from RNA-seq using the Trinity platform for reference generation and analysis. Nat. Protoc. 8, 1494–1512. doi: 10.1038/nprot.2013.084
Hawley A. T., Wetmore L. A. (2010). Identification of single nucleotide polymorphisms within exon 1 of the canine mu-opioid receptor gene. Vet. Anaesth. Analg. 37, 79–82. doi: 10.1111/j.1467-2995.2009.00506.x
Hoshooley J. S., Phillmore L. S., Sherry D. F., Macdougall-Shackleton S. A. (2007). Annual cycle of the black-capped chickadee: seasonality of food-storing and the hippocampus. Brain Behav. Evol. 69, 161–168. doi: 10.1159/000096984
Jacobs L. F. (1996). The economy of winter: phenotypic plasticity in behavior and brain structure. Biol. Bull. 191, 92–100. doi: 10.2307/1543068
Jehl F., Désert C., Klopp C., Brenet M., Rau A., Leroux S., et al. (2019). Chicken adaptive response to low energy diet: main role of the hypothalamic lipid metabolism revealed by a phenotypic and multi-tissue transcriptomic approach. BMC Genomics 20 (1), 1033. doi: 10.1186/s12864-019-6384-8
Justen H., Delmore K. E. (2022). The genetics of bird migration. Curr. Biol. 32, R1144–R1149. doi: 10.1016/j.cub.2022.07.008
Ketterson E. D., Nolan V. (1982). The role of migration and winter mortality in the life history of a temperate-zone migrant, the dark-eyed junco, as determined from demographic analyses of winter populations. Auk 99, 243–259. doi: 10.1093/auk/99.2.243
King M. C., Wilson A. C. (1975). Evolution at two levels in humans and chimpanzees. Science 188, 107–116. doi: 10.1126/science.1090005
Kriventseva E. V., Kuznetsov D., Tegenfeldt F., Manni M., Dias R., Simão F. A., et al. (2019). OrthoDB v10: sampling the diversity of animal, plant, fungal, protist, bacterial and viral genomes for evolutionary and functional annotations of orthologs. Nucleic Acids Res. 47, D807–D811. doi: 10.1093/nar/gky1053
Lai K., Kaspar B. K., Gage F. H., Schaffer D. V. (2003). Sonic hedgehog regulates adult neural progenitor proliferation in vitro and in vivo. Nat. Neurosci. 6, 21–27. doi: 10.1038/nn983
Langmead B., Trapnell C., Pop M., Salzberg S. L. (2009). Ultrafast and memory-efficient alignment of short DNA sequences to the human genome. Genome Biol. 10, R25. doi: 10.1186/gb-2009-10-3-r25
Liu L., Wang Z., Su Y., Wang T. (2021). Population transcriptomic sequencing reveals allopatric divergence and local adaptation in Pseudotaxus chienii (Taxaceae). BMC Genomics 22, 388. doi: 10.1186/s12864-021-07682-3
Lü A., Hu X., Chen H., Dong Y., Zhang Y., Wang X. (2011). Novel SNPs of the bovine PRLR gene associated with milk production traits. Biochem. Genet. 49, 177–189. doi: 10.1007/s10528-010-9397-1
Manni M., Berkeley M. R., Seppey M., Zdobnov E. M. (2021). BUSCO: assessing genomic data quality and beyond. Curr. Protoc. 1, e323. doi: 10.1002/cpz1.323
Marsh R. L., Dawson W. R. (1989). “Avian adjustments to cold,” in Advances in Comparative and Environmental Physiology, vol. 4 . Ed. Wang L. C. H. (Springer, Berlin, Heidelberg). doi: 10.1007/978-3-642-74078-7_6
Mi H., Muruganujan A., Casagrande J. T., Thomas P. D. (2013). Large-scale gene function analysis with the PANTHER classification system. Nat. Protoc. 8, 1551–1566. doi: 10.1038/nprot.2013.092
Nica A. C., Dermitzakis E. T. (2013). Expression quantitative trait loci: present and future. Philos. Trans. R. Soc. London. Ser. B Biol. Sci. 368, 20120362. doi: 10.1098/rstb.2012.0362
Oleksiak M. F., Churchill G. A., Crawford D. L. (2002). Variation in gene expression within and among natural populations. Nat. Genet. 32, 261–266. doi: 10.1038/ng983
Pauls S. U., Nowak C., Bálint M., Pfenninger M. (2013). The impact of global climate change on genetic diversity within populations and species. Mol. Ecol. 22, 925–946. doi: 10.1111/mec.12152
Pickrell J. K., Marioni J. C., Pai A. A., Degner J. F., Engelhardt B. E., Nkadori E., et al. (2010). Understanding mechanisms underlying human gene expression variation with RNA sequencing. Nature 464, 768–772. doi: 10.1038/nature08872
Pimentel H., Bray N. L., Puente S., Melsted P., Pachter L. (2017). Differential analysis of RNA-seq incorporating quantification uncertainty. Nat. Methods 14, 687–690. doi: 10.1038/nmeth.4324
Pravosudov V. V., Roth T. C., Forister M. L., Ladage L. D., Kramer R., Schilkey F., et al. (2013). Differential hippocampal gene expression is associated with climate-related natural variation in memory and the hippocampus in food-caching chickadees. Mol. Ecol. 22 (2), 397–408. doi: 10.1111/mec.12146
Sasai N., Toriyama M., Kondo T. (2019). Hedgehog signal and genetic disorders. Front. Genet. 10. doi: 10.3389/fgene.2019.01103
Sayers E. W., Bolton E. E., Brister J. R., Canese K., Chan J., Comeau D. C., et al. (2022). Database resources of the national center for biotechnology information. Nucleic Acids Res. 50 (D1), D20–D26. doi: 10.1093/nar/gkab1112
Segarra A. B., Domínguez-Vías G., Redondo J., Martínez-Cañamero M., Ramírez-Sánchez M., Prieto I. (2021). Hypothalamic renin-angiotensin system and lipid metabolism: effects of virgin olive oil versus butter in the diet. Nutrients 13, 480. doi: 10.3390/nu13020480
Stager M., Senner N. R., Tobalske B. W., Cheviron Z. A. (2020). Body temperature maintenance acclimates in a winter-tenacious songbird. J. Exp. Biol. 223, jeb221853. doi: 10.1242/jeb.221853
Stranger B. E., Nica A. C., Forrest M. S., Dimas A., Bird C. P., Beazley C., et al. (2007). Population genomics of human gene expression. Nat. Genet. 39 (10), 1217–1224. doi: 10.1038/ng2142
Szklarczyk D., Kirsch R., Koutrouli M., Nastou K., Mehryary F., Hachilif R., et al. (2023). The STRING database in 2023: protein-protein association networks and functional enrichment analyses for any sequenced genome of interest. Nucleic Acids Res. 51, D638–D646. doi: 10.1093/nar/gkac1000
Tatarinova T. V., Chekalin E., Nikolsky Y., Bruskin S., Chebotarov D., McNally K. L., et al. (2016). Nucleotide diversity analysis highlights functionally important genomic regions. Sci. Rep. 6, 35730. doi: 10.1038/srep35730
Thornton M. M., Shrestha R., Wei Y., Thornton P. E., Kao S., Wilson. B. E. (2020). Daymet: Daily Surface Weather Data on a 1-km Grid for North America, Version 4. ORNL DAAC (Tennessee, USA: Oak Ridge). doi: 10.3334/ORNLDAAC/1840
Urbański P., Kurył J. (2004). Two new SNPs within exon 1 of the porcine MYOD1 (MYF3) gene and their frequencies in chosen pig breeds and lines. J. Anim. Breed. Genet. 121, 204–208. doi: 10.1111/j.1439-0388.2004.00458.x
Wang Y., Zhao Y., Wang Y., Li Z., Guo B., Merilä J. (2020). Population transcriptomics reveals weak parallel genetic basis in repeated marine and freshwater divergence in nine-spined sticklebacks. Mol. Ecol. 29, 1642–1656. doi: 10.1111/mec.15435
Weir B. S., Cockerham C. C. (1984). Estimating F-statistics for the analysis of population structure. Evolution 38, 1358–1370. doi: 10.2307/2408641
Keywords: transcriptomics, gene expression, song bird, North America, adaptation
Citation: Ricchetti I, Taucher T, Loebick R, Sin SYW, Palacios C and Lamichhaney S (2024) Gene expression variation in geographically diverse populations of two North American songbird species. Front. Bird Sci. 3:1382657. doi: 10.3389/fbirs.2024.1382657
Received: 06 February 2024; Accepted: 21 March 2024;
Published: 08 April 2024.
Edited by:
Scott Rush, Mississippi State University, United StatesReviewed by:
Toni Gossmann, Bielefeld University, GermanyEmilia Grzędzicka, Polish Academy of Sciences, Poland
Copyright © 2024 Ricchetti, Taucher, Loebick, Sin, Palacios and Lamichhaney. This is an open-access article distributed under the terms of the Creative Commons Attribution License (CC BY). The use, distribution or reproduction in other forums is permitted, provided the original author(s) and the copyright owner(s) are credited and that the original publication in this journal is cited, in accordance with accepted academic practice. No use, distribution or reproduction is permitted which does not comply with these terms.
*Correspondence: Sangeet Lamichhaney, c2xhbWljaGhAa2VudC5lZHU=