 Nolan M. Clements
 W. Douglas Robinson
94% of researchers rate our articles as excellent or good
Learn more about the work of our research integrity team to safeguard the quality of each article we publish.
Find out more
ORIGINAL RESEARCH article
Front. Bird Sci., 27 February 2024
Sec. Bird Ecology and Behavior
Volume 3 - 2024 | https://doi.org/10.3389/fbirs.2024.1304026
This article is part of the Research TopicEditors' Showcase: Bird Ecology and BehaviorView all 6 articles
Populations of many North American bird species have declined throughout the past half century. The majority of studies quantifying these declines have analyzed counts of birds taken during spring and summer, not during the season of scarcity, winter. We re-surveyed seven large study plots in Douglas fir (Pseudotsuga menziesii) forests initially surveyed in winter during the late 1960s in the Oregon Coast Range, USA. We compared density estimates, observed species richness and vegetation structure within plots, and inspected aerial photography to describe changes in landscape-level landcover. To assess potential drivers of change, we reviewed historical climate data and explored patterns of abundance associated with forest age. Observed species richness was greater in the modern surveys. Abundances of four of the six most common bird species appeared to be similar to or slightly lower than 50 years ago as the historical point estimates usually fell within or above 95% confidence intervals generated from our analyses. We found no clear associations with changes in bird communities and forest structure, climate, or forest age. The historical data are unique in providing point estimates of abundance for the entire bird community on each study plot. Yet, some uncertainties in accuracy of the historic counting methods could still influence interpretation of multi-decadal changes in apparent abundance. We conclude that this Pacific Northwest bird community was relatively stable in its abundances of the most common forest-dwelling species and that largely the communities are still intact. Additional production of precisely repeatable surveys of winter bird communities are needed in all habitats to adequately characterize long-term population dynamics during the season of scarcity.
Many North American songbird populations have declined during the past half century (Rosenberg et al., 2019). Causes of the declines have been attributed to changes associated with climate and landcover characteristics (Sala et al., 2000; Newbold et al., 2015; Northrup et al., 2019; Rosenberg et al., 2019). However, most data used to track long-term changes in bird populations have focused on spring and summer breeding birds. Songbird population surveys are rarely focused on winter, the season of scarcity, despite the potential for harsh environmental conditions that may limit survival and therefore distribution and abundance throughout the year (Lepage and Francis, 2002; Saino et al., 2004; Robb et al., 2008; Morrison et al., 2013; Ciach and Fröhlich, 2017; Askeyev et al., 2018).
Winter is often the season when reduced abundance of food resources constrains energy intake for birds (Meehan et al., 2004). This seasonal resource scarcity amounts to increased mortality, especially among small songbirds (Jansson et al., 1981; Houston and McNamara, 1993). Among other foods, many bird species consume energy-rich seeds in the winter, such as those of coniferous trees and flowering plants; however, these seed crops can be highly variable in their availability and distribution (Summers, 1999). That variability often drives winter distributions and abundances of many bird species, especially granivorous species that spend winter at higher latitudes (Bock and Lepthien, 1976; Strong et al., 2015; Deshwal et al., 2021; Askeyev et al., 2023). In most temperate ecosystems, the variability and scarcity of food resources often coincide with harsher environmental conditions, such as colder temperatures, increased precipitation, and reduced amount of daylight, which all increase thermoregulatory energy requirements (Houston and McNamara, 1993; Leech and Crick, 2007). The characteristics of the season of scarcity culminate to make winter an especially complex pinch-point in avian lifecycles that is known to drive breeding season productivity and large-scale population fluctuations (Jansson et al., 1981; Houston and McNamara, 1993; Sherry and Holmes, 1996; Latimer and Zuckerberg, 2021).
Global climate change continues to influence environmental factors that contribute to the dynamic nature of winter bird communities (Rodenhouse et al., 2009). Warming climates, changing precipitation patterns, and altered phenology all impact the habitat suitability, resource availability, and caloric requirements of birds (Crick, 2004). This change in the energetic demands of birds is in turn driving change in winter bird distribution and survival (Princé and Zuckerberg, 2015; Lehikoinen et al., 2016). La Sorte and Thompson (2007) documented that the centers of wintering ranges of 254 North American bird species are moving northward at around 1 km per year. Additionally, the species composition of winter avian communities in North America is shifting toward species more tolerant of warm temperatures at a faster rate than expected (Princé and Zuckerberg, 2015; Lehikoinen et al., 2021).
Despite the dynamic and potentially rapidly changing nature of winter bird populations, relatively few studies have documented long-term changes in winter songbird abundance. Such surveys are important for understanding seasonal population fluctuation and mortality, shifts in migration timing, and determining the status of populations that breed farther north and are largely inaccessible to survey during the reproductive season (Dunn and Sauer, 1997; Hochachka et al., 1999; Lepage and Francis, 2002). In particular, surveys utilizing highly structured protocols are uncommon (Lepage and Francis, 2002; Lehikoinen et al., 2016). Several large-scale, long-term avian monitoring projects, such as the National Audubon Society’s Christmas Bird Count (CBC) and Cornell Lab of Ornithology’s Project FeederWatch, have documented winter bird abundance across North America using citizen science-based approaches. However, despite their extensive spatial coverage and large sample sizes, the semi-structured methodologies and variation in observer skill levels may constrain reliable conclusions to broad patterns and general trends (Butcher et al., 1990; Dunn et al., 2005; Stuble et al., 2021; Saunders et al., 2022).
The few studies that have used structured counting methods to evaluate long-term changes in abundances of multiple species in winter bird communities have found various results. In Finland, increased abundance of winter waterbirds was likely related to climate change factors, whereas decreases in forest birds and increases in urban birds were attributed to anthropogenic changes in land use (Fraixedas et al., 2015). Askeyev et al. (2018) also utilized a long-term dataset on winter bird communities in western Russia to understand changes in abundance. Unlike studies in western Europe, they found a significant increase in the abundance of 10 forest bird species over 50 years, which they hypothesized was linked to warmer winter temperatures. Similar long-term population-level studies of winter bird communities are scarce in North America.
While continuous long-term datasets are ideal for answering certain questions about change in bird populations, they do not exist for most biogeographic regions. One alternative is to compare historical short-term data with modern re-surveys, providing snapshots of potential changes in bird abundance (Tingley, 2017). Historical datasets vary widely in the quality of data preserved and the associated details on methodology utilized. Data that allow sufficient replication of surveys in the same sites as original surveys and that provide density estimates or raw data are the most amenable to comparisons with modern re-surveys.
Stanley Anderson counted birds and measured forest plant communities in seven large plots from 1968 through 1970 within the Douglas fir (Pseudotsuga menziesii) dominated forests of the Coast Range Mountain foothills, near Corvallis, Oregon, USA, to investigate seasonal changes in the diversity and ecological structure of local avifauna (Anderson, 1970, 1972). His thesis included plot locations, summaries of vegetation characteristics and a point estimate of density for each bird species in each plot; no confidence intervals or other statistical measures of error were reported and the original data have been lost (Anderson, 1970, 1972). His study, to our knowledge, is the oldest survey of Pacific Northwest winter forest bird communities with density estimates.
Given the paucity of similar data, we repeated his surveys in 2021 and 2022 with the objective of characterizing differences in winter bird populations by comparing past and present observed species richness and estimates of density. We aligned our bird survey efforts with Anderson’s to facilitate comparisons of avian densities. We also utilized modern counting methods and preserved extensive metadata on specific survey locations to facilitate future re-surveys (Clements and Robinson, 2022). To address potential explanations for differences in bird densities, we compared modern and historical vegetation structure, assessed differences in orthographic imagery of each plot from the 1970s and 2020, and evaluated relationships between approximate forest age and bird abundance.
Anderson non-randomly selected 10 forested study plots (quarter sections, 64.7 ha) in Oregon State University’s McDonald-Dunn Research Forest and the Woods Creek Watershed portion of the Siuslaw National Forest in Benton County, Oregon, USA (230 to 625 m ASL) (Figure 1) (Anderson, 1970, 1972). Anderson’s plots were named based on the U.S. Public Land Survey System information (township, range, section and quarter section); however, he did not describe specifically which areas within the quarter sections were surveyed. Coordinates of the quarter sections are preserved in Clements and Robinson (2022). We selected Anderson’s seven conifer-dominated plots (named plots 3-9) to re-survey; the remaining three plots were excluded from our surveys because they had been substantially altered by forest harvest practices. Plots in the McDonald-Dunn Research Forest (MDRF) (plots 3, 4, 5 and 8) are dominated by Douglas fir and big leaf maple (Acer macrophyllum). Frequency of timber harvest in the MDRF has been relatively high in the 50 years since Anderson’s work resulting in a mosaic of forest ages varying from recent clearcuts and replanting to old growth stands (Figure 2). Plots 6, 7, and 9, in the Woods Creek Watershed (WCW), are composed of relatively even-aged Douglas fir, with small patches of western hemlock (Tsuga heterophylla). The WCW plots have been relatively undisturbed since Anderson’s work; however, nearby stands have been harvested (Figure 3).
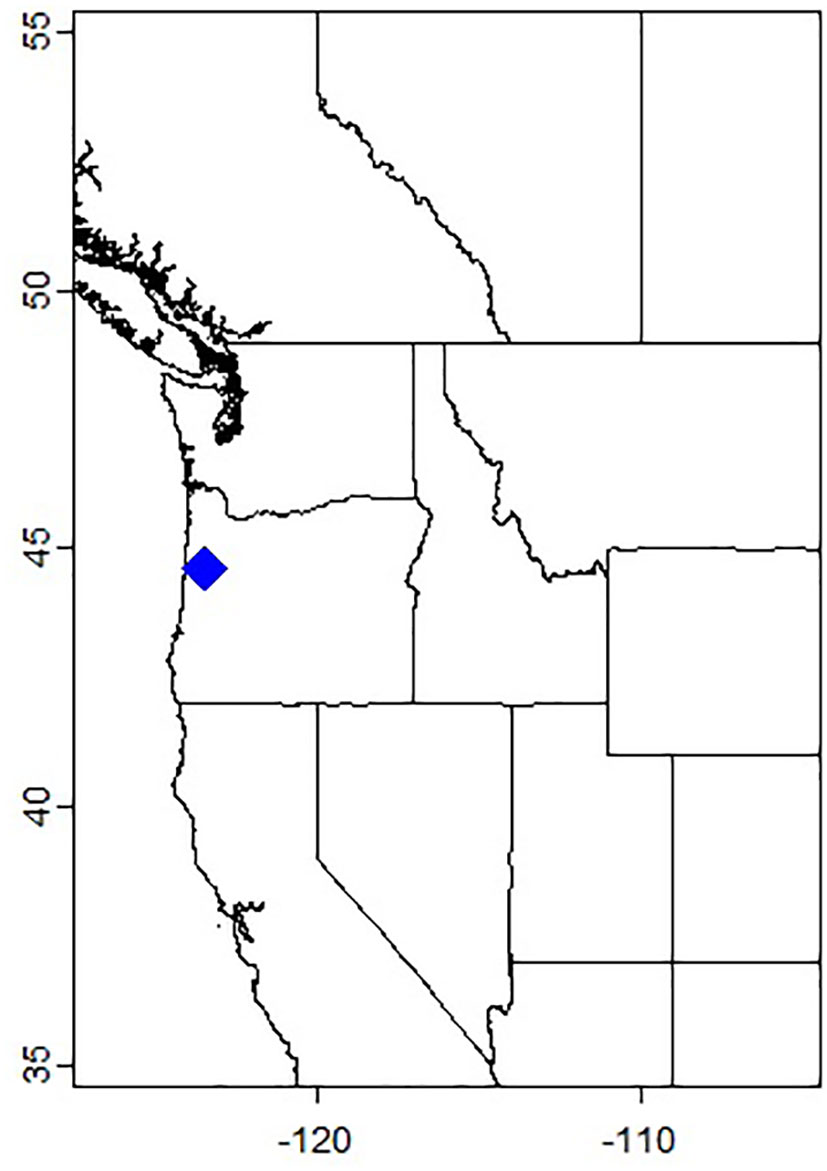
Figure 1 Line map of the Pacific Northwest, USA. Blue diamond indicates the study sites in a larger geographic context. Map is oriented north-south. Horizontal and vertical axes units are in decimal degrees coordinates.
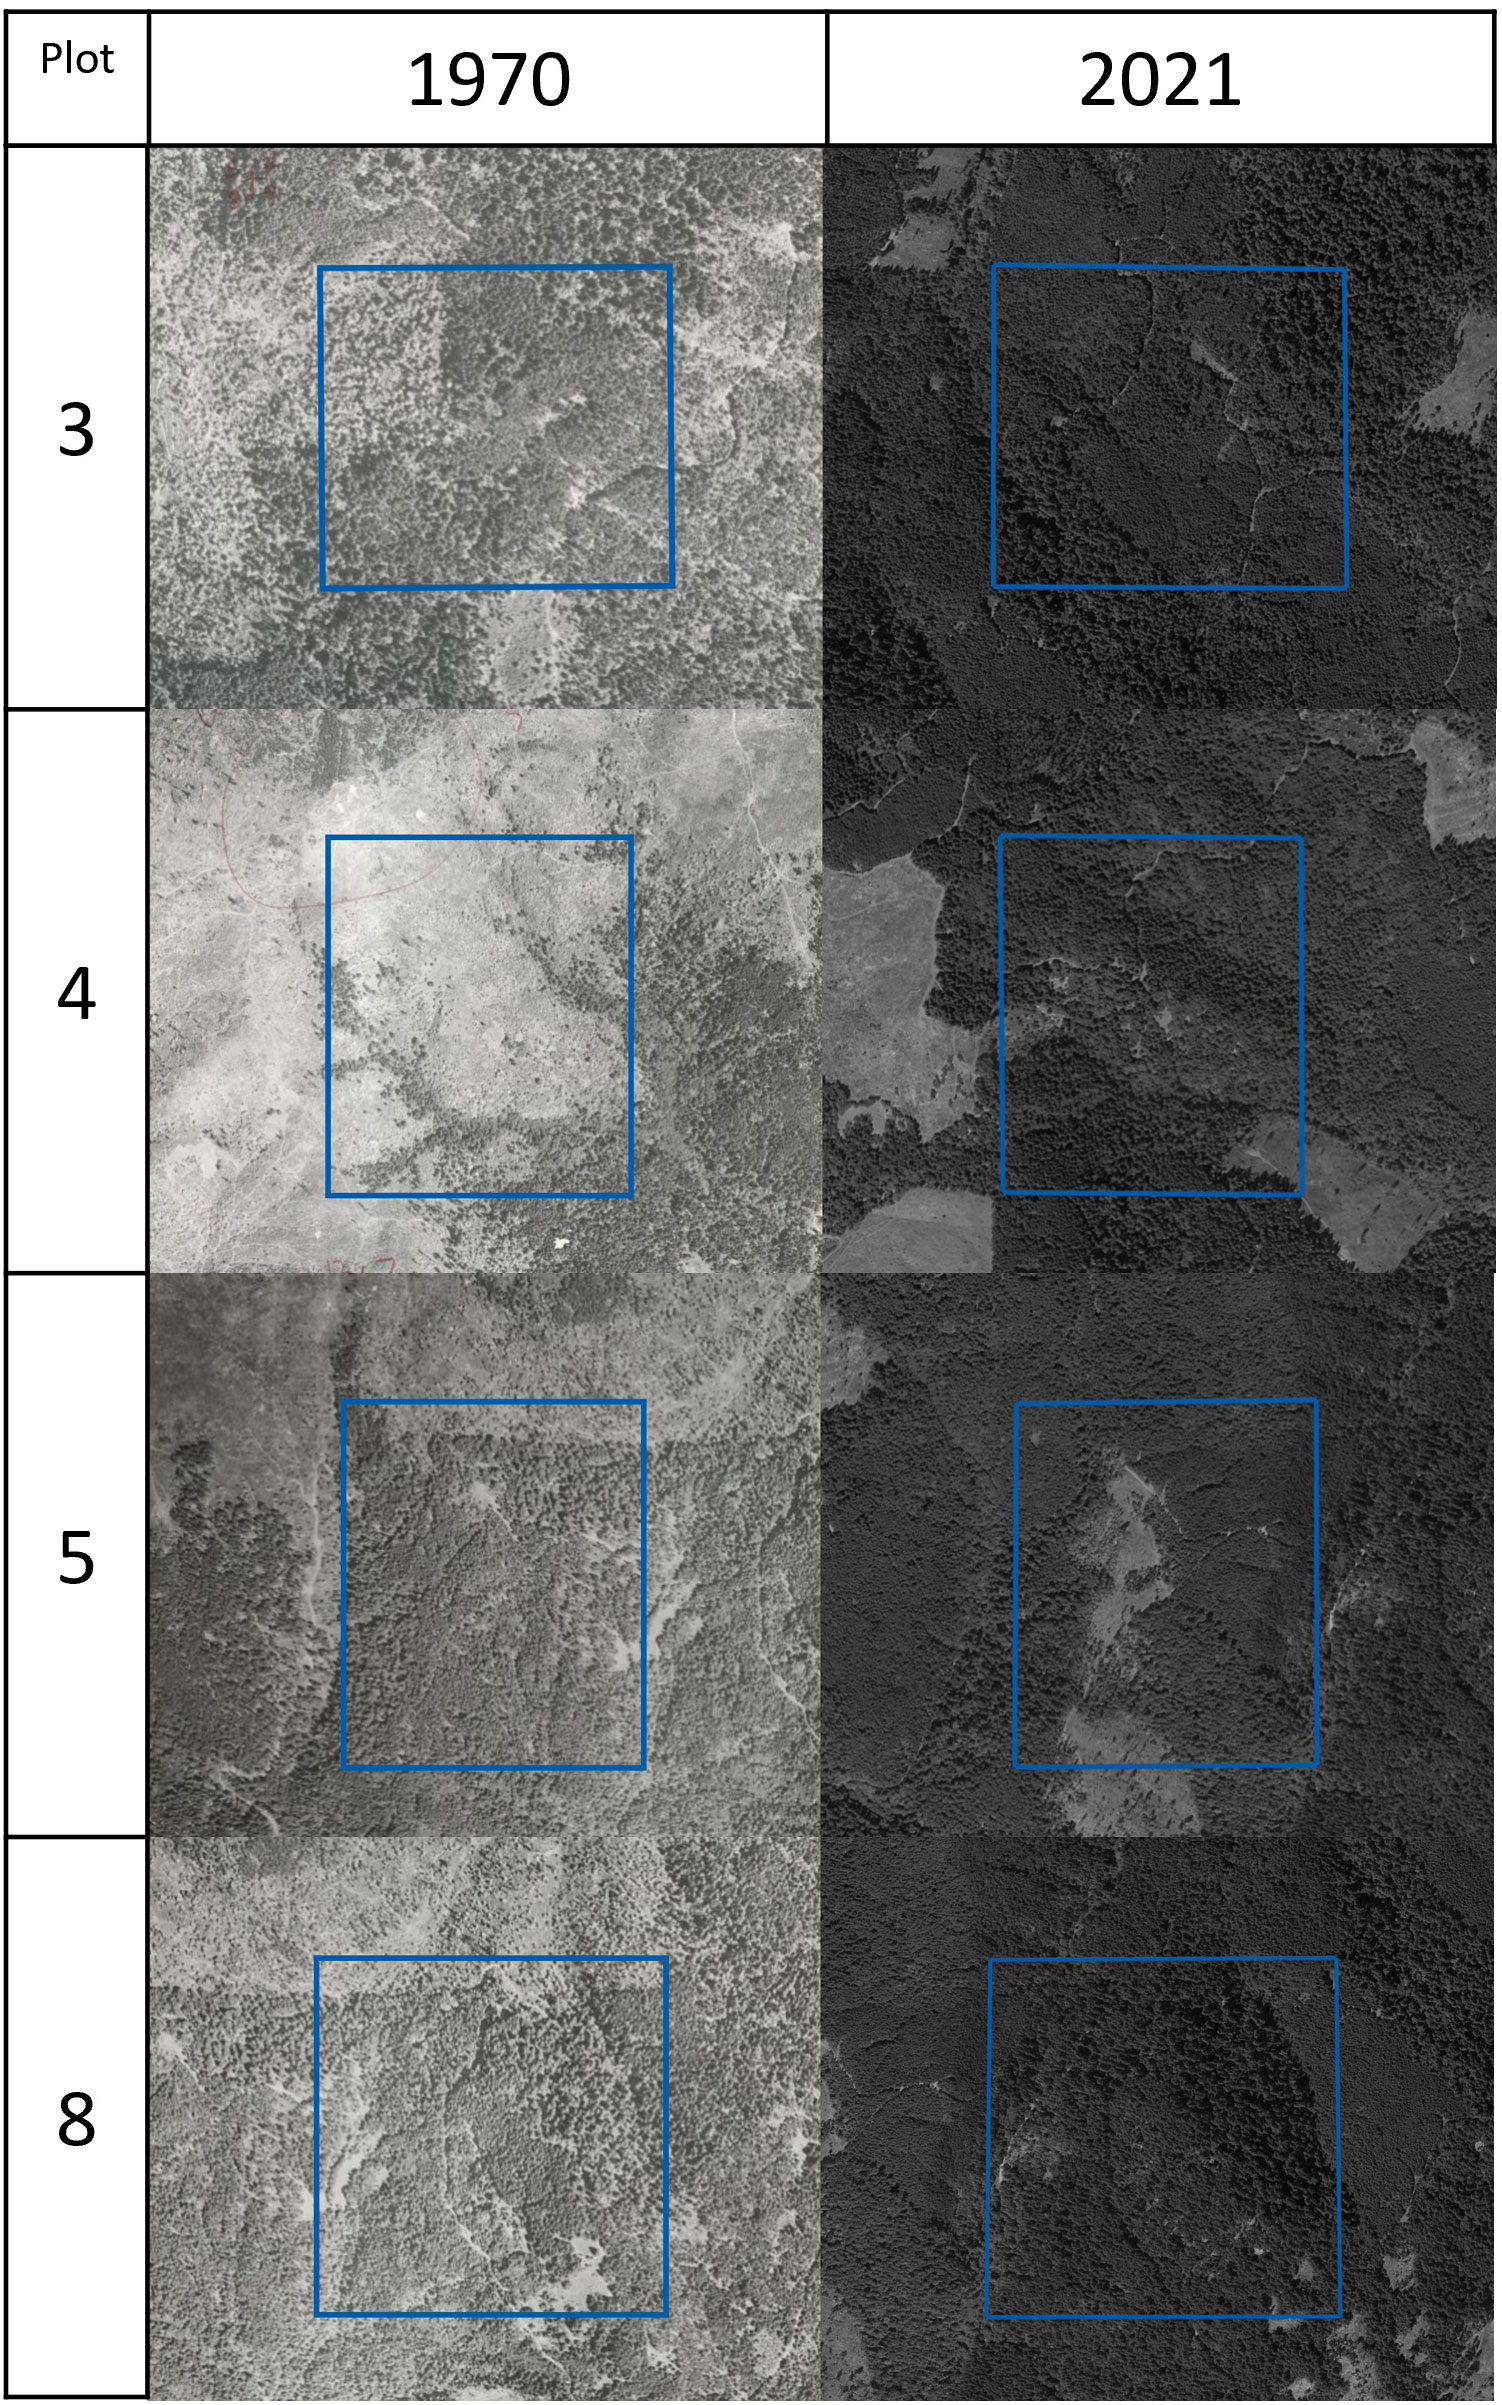
Figure 2 Comparison of orthographic imagery of the McDonald-Dunn Research Forest plots, Oregon USA. 1970 imagery was acquired from Oregon State University Special Collections and Archives Research Center and 2021 imagery was taken from Google Earth. Images are oriented north-south.
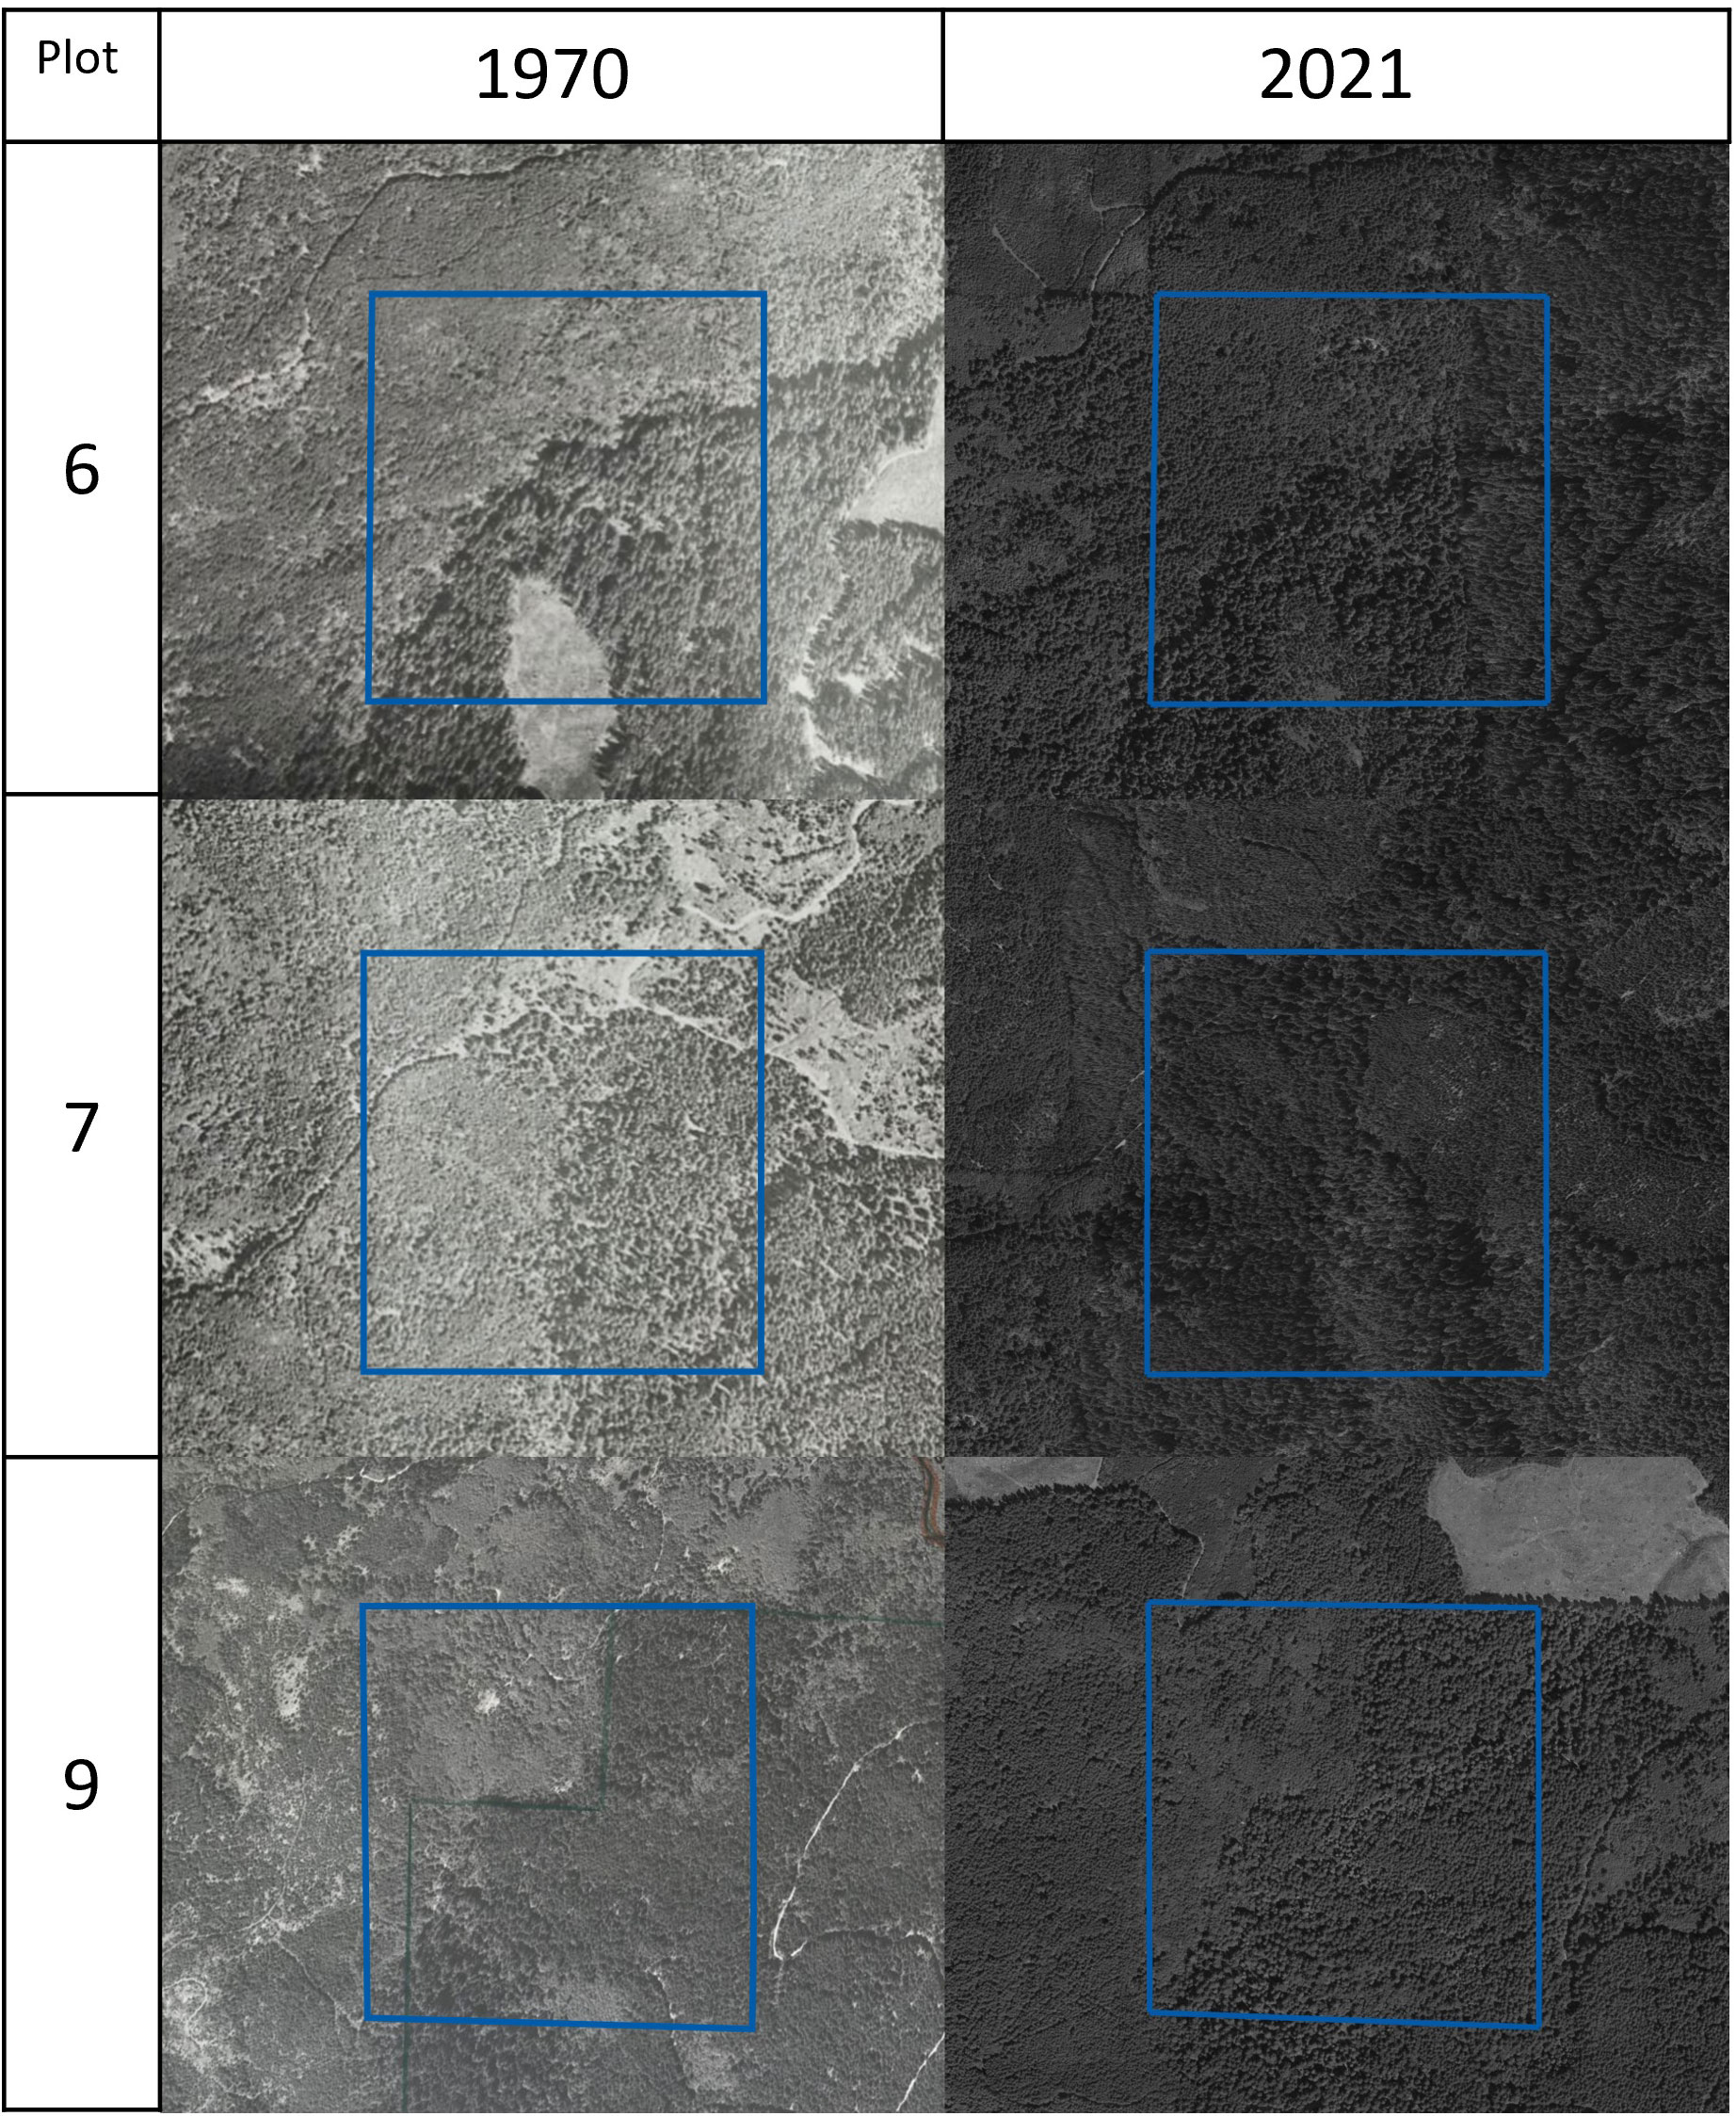
Figure 3 Comparison of orthographic imagery of the Woods Creek Watershed plots, Oregon USA. 1970 imagery was acquired from Oregon State University Special Collections and Archives Research Center (plots 6 and 7) and University of Oregon Library (plot 9), and 2021 imagery was taken from Google Earth. Images are oriented north-south.
The exact locations within quarter sections of sites surveyed for birds were unclear in Anderson’s thesis, but most quarter sections were composed of consistent forest cover and type, as determined from aerial photos (Figures 2, 3). Therefore, we conducted our surveys within the quarter sections and assumed, because we were surveying the same habitats, that our density estimates would be reliably comparable to Anderson’s. In two cases (plots 6 and 7), access was reduced because of COVID-19-related regulations so some counts we conducted were outside of the quarter sections but within 250 m of quarter-section boundaries and in the same habitats. We categorized our survey locations as “In” or “Out” of quarter sections so we could assess potential differences in bird estimates (Clements and Robinson, 2022). We compared mean number of each species observed during surveys conducted in an out of plots and found no consistent differences in bird detections or habitat qualities, so we combined all counts for all analyses (Supplementary Table 1).
Anderson counted birds using four different methods (strip census, strip map, point quarter, and sample count methods), but stated that the sample count method produced the most accurate density estimates, which were consistent with his estimates from information combining all other techniques used (Anderson, 1970, 1972). The sample count method involved conducting ten 10-minute stationary point counts spaced approximately 95 m apart along an “irregular” transect. We assumed that “irregular” referred to a transect with a non-straight vector but are unsure if transects followed roads and trails or simply transected forest. The forest understory in Anderson’s plots is characterized by dense vegetation and steep terrain; conditions that if traveled through would disturb birds and potentially reduce the number of individuals counted, so we speculate that his irregular routes followed logging roads and trails to minimize disturbance and maximize efficiency. At each survey point, Anderson recorded all birds seen within 18 m, and if a bird was heard he attempted to visually observe it. He counted birds starting one hour after sunrise at least once per week between November 2 and March 1, 1968-1970, on days with good weather.
To maximize our chances of reliably comparing our results with Anderson’s, we also used stationary (point) counts that were spaced about 100 m apart along roads and trails and were 10 min in duration. During each count we recorded each bird that was detected, the distance to it (checked with laser rangefinder), the cardinal direction of its initial detection, and detection type (singing, calling, visual, flyover, drumming). If a bird was heard within about 20 m but was not seen, an effort was made to visually locate that individual; thus, we repeated Anderson’s methods as closely as possible. At the same time, we used modern counting methods with unlimited radius count areas and estimated distances to individual birds; when birds were seen we verified distances with a laser rangefinder (Clements and Robinson, 2022). All species we encountered were primarily detected by their sounds and are routinely detectable within 50 m. Counts were conducted from dawn to noon on days with minimal rain or wind. Each plot was surveyed twice each year (2021 and 2022), usually once by each skilled observer (except for plot 3 and 4 which were surveyed twice by the same observer in 2021), resulting in a minimum of 22 counts per plot per season.
Anderson reported trees per acre, average canopy cover, height class distribution, shrub density and qualitative descriptions of vegetation in each plot. Anderson implemented a transect sampling method outlined in Cottam and Curtis (1956) to sample habitat structure. We followed a similar sampling scheme and implemented methods described by James and Shugart (1970) to produce the same metrics more efficiently. We spaced vegetation plots at intervals of about 100 m along the same roads and trails where we surveyed birds. The center of each circular plot of 12-m radius was located 15 to 20 m perpendicular to the trail or road. We surveyed vegetation structure at 70 locations (n=10/plot). We identified the species and diameter at breast height category of each tree, measured maximum canopy height, and counted the number of shrubs over 1 m tall in a 2-meter-wide swath along north-south and east-west transects through the diameter of the plot. We also visually compared orthographic aerial photographs from 1970 to satellite imagery from 2021 to characterize broad, landscape-level habitat changes.
To explore potential relationships between bird abundance and forest stand age differences across the two eras, we first delineated all stands of different ages in each plot in ARCGIS Pro 3.1 (ESRI, 2023). Most of the forest within our plots has been harvested within the past 200 years, so we identified stand ages based on four categories: recent (<3 years) clearcuts, early successional (4-15 years), middle-aged (16-40 years), and older stands (>40 years). Stand age categories were designated based on visual inspection of satellite imagery from 2021 and comparing those images with orthographic imagery from the 1970s. We verified stand age assignments in the MDRF by inspecting a harvest date map provided by Oregon State University’s Forest Research Group. We then identified the stand in which each point count was located and assigned each point to an age category. We compared the mean numbers of each of the six most commonly encountered species detected during our surveys in each age category with paired t-tests.
The historical survey results were presented only as whole number point estimates of density (birds/40.5 ha) for each species in each plot. Anderson did not report densities for each winter of his two years separately, so we combined our two years for comparisons as well. Anderson’s density values were all multiples of 11, which we determined meant that he surveyed 7.3 ha per plot. We aligned our data to facilitate comparisons with Anderson’s results by directly comparing our estimated densities within 18-m radius counts, averaged for each plot, with Anderson’s estimates calculated from his 18-m radius counts. Modern studies utilize much larger radii because of concerns that birds move away from observers; therefore such small radii could lead to biased density estimates. Given that we also wanted to facilitate future comparisons with our current surveys, we also estimated densities by truncating our unlimited radius data to 50-m radius survey areas and calculating mean density/40.5 ha. For both the 18-m and 50-m radii, we used data from at least 11 stationary counts per plot. We generated estimates of means and the 95% confidence intervals of means by bootstrapping count data from each plot 50 times. Confidence intervals were generated for only the six most frequently occurring species because intervals generated from rarer encounters were unrealistically large.
Additionally, we generated a third set of density estimates using a distance sampling model to account for imperfect detection (Buckland et al., 2001; Royle et al., 2004). The model was implemented in program Distance 7.5 (Thomas et al., 2010). We selected detection function, adjustment parameters, and distance intervals for the five most common species based on a combination of Akaike information criterion (Burnham and Anderson, 2002) and chi-squared, Cramer-von Mises, and Kolmogorov-Smirnov goodness of fit tests. Density estimates for the remaining species were not generated using this method owing to insufficient numbers of detections. We then scaled model density output to individuals per 40.5 ha.
We conducted 287 stationary counts between January and March of 2021 and 2022, recording 216 individuals of 21 species within 18 m and 1460 individuals of 32 species within 50 m (Table 1). WCW plots had fewer species (22) and generally lower estimates of densities than MDRF plots (29 species) (Tables 1, 2). Five species were observed in all plots at least once: Chestnut-backed Chickadee (Poecile rufescens), Golden-crowned Kinglet (Regulus satrapa), Red-breasted Nuthatch (Sitta canadensis), Brown Creeper (Certhia americana), and Pacific Wren (Troglodytes pacificus). Dark-eyed Junco (Junco hyemalis) and Hutton’s Vireo (Vireo huttoni) were encountered within 50 m in 6 of 7 plots.
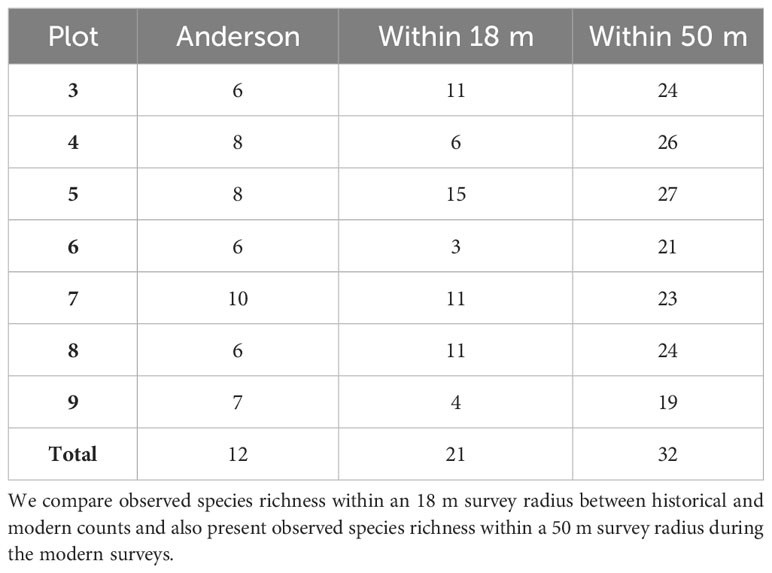
Table 1 Number of species observed by plot during Anderson’s and our surveys.
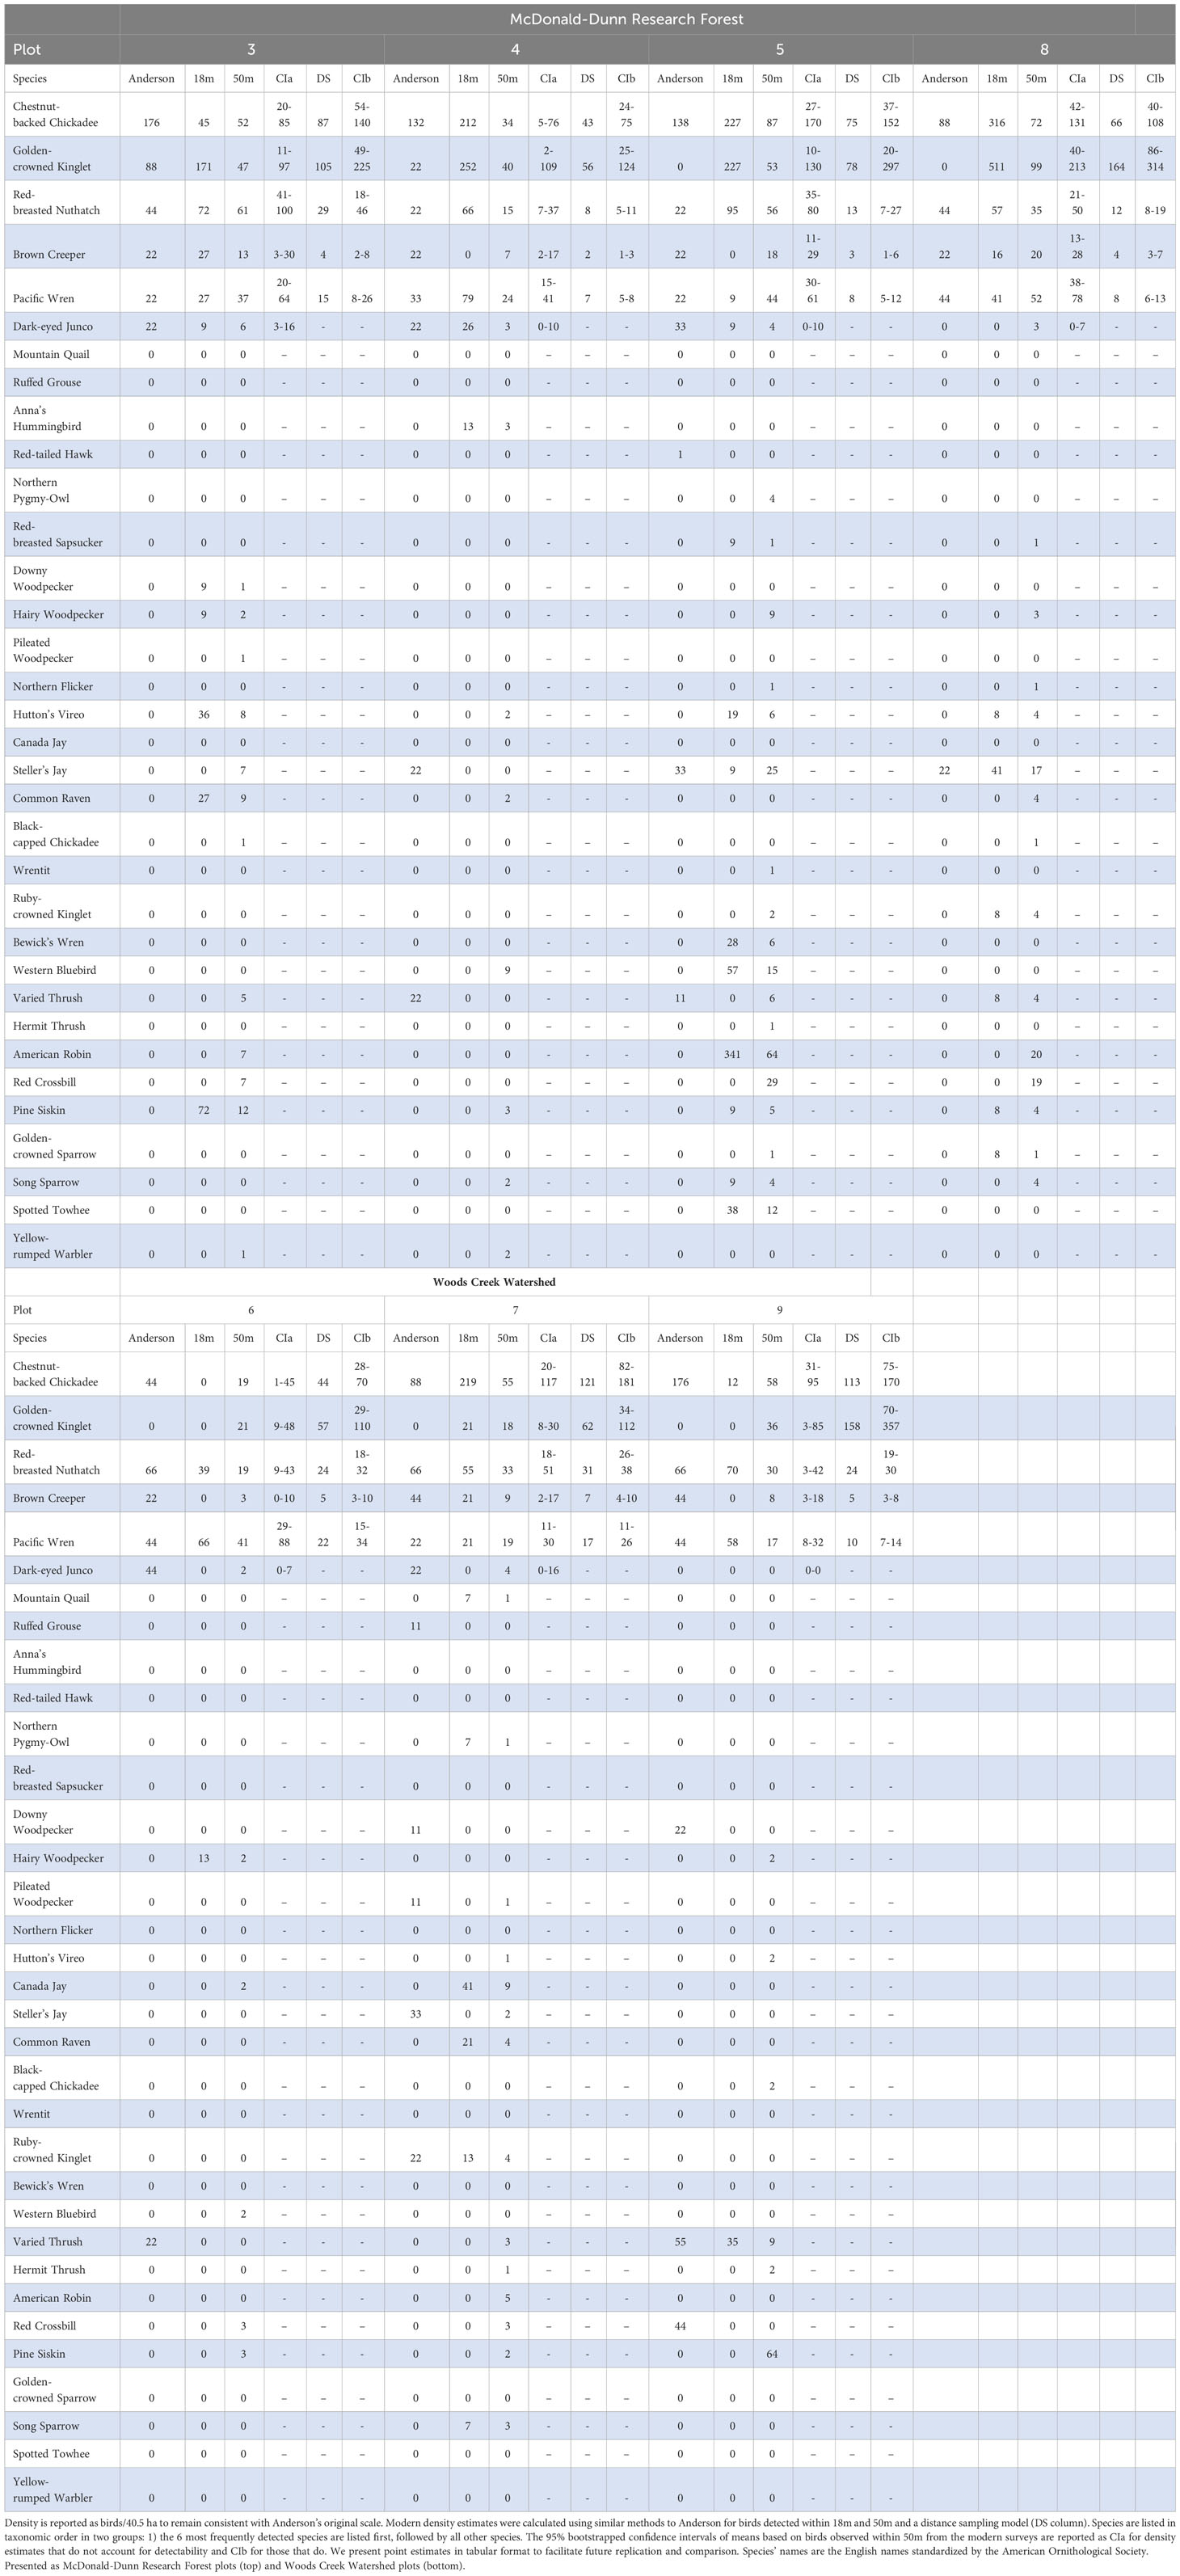
Table 2 Estimated densities for all species detected during Anderson’s and our modern surveys.
Observed species richness within 18 m during our surveys was greater in plots 3, 5, 7, and 8, and lower in plots 4, 6, and 9 than what Anderson reported (Table 1). In WCW (plots 6, 7, and 9 combined) we recorded 14 species within 18 m, two more than what Anderson observed; similarly, we recorded 22 species in MDRF plots (plots 3, 4, 5, and 8 combined), 13 more than Anderson’s total (Table 1). Hairy Woodpecker (Dryobates villosus), Hutton’s Vireo, Pine Siskin (Spinus pinus), and Song Sparrow (Melospiza melodia) were not detected by Anderson but were present in at least four of seven plots in our surveys. Anderson recorded two species that we did not detect: Red-tailed Hawk (Buteo jamaicensis) and Ruffed Grouse (Bonasa umbellus).
Density estimates based on birds encountered within 18 m were variable across species and location, presenting no consistent patterns when compared with Anderson’s estimates. Based on this estimation method, Chestnut-backed Chickadee decreased in three plots (3, 6, and 9) and increased in four plots (4, 5, 7, and 8); Golden-crowned Kinglet increased in five plots (3, 4, 5, 7, and 8), but were not detected by us or Anderson within 18 m in two plots (6 and 9); Red-breasted Nuthatches decreased in two plots (6 and 7) and increased in five plots (3, 4, 5, 8, and 9); Brown Creeper decreased in six plots (4, 5, 6, 7, 8, and 9) and increased in one (3); Pacific Wren decreased in three plots (5, 7, and 8) and increased in four (3, 4, 6, and 9); and Dark-eyed Junco decreased in four plots (3, 5, 6, and 7), increased in one plot (4), and were not detected by us or Anderson within 18 m in two plots (8, and 9).
In general, our density estimation method that did not account for imperfect detection produced similar or slightly lower density estimates than those Anderson reported for Chestnut-backed Chickadee, Brown Creeper, Red-breasted Nuthatch, and Dark-eyed Junco based on birds observed within 50 m (Table 2). Chestnut-backed Chickadee and Brown Creeper density estimates were lower than Anderson’s in all plots, and Anderson’s estimates were above the upper confidence interval limit in three plots for Chestnut-backed Chickadees (3, 4, and 9) and four plots for Brown Creeper (4, 6, 7, and 9). Our density estimates for Red-breasted Nuthatch were lower than Anderson’s in five plots (4, 6, 7, 8, and 9), and his estimates fell above the upper confidence interval limit in three plots (6, 7, and 9). Pacific Wren density estimates were lower than Anderson’s in four plots (4, 6, 7, and 9), but in six of seven plots Anderson’s Pacific Wren density estimates were within the confidence interval; his estimate in plot 5 was below the confidence interval. Dark-eyed Juncos were consistently present in low densities in Anderson’s and our surveys. Anderson’s density estimates for Dark-eyed Junco were higher than ours and above the upper confidence interval limit in five plots (3, 4, 5, 6, and 7). We observed substantially more Golden-crowned Kinglets than Anderson. We detected them within 50 m in all plots, and within 18 m in all but two plots (6 and 9). Anderson detected Golden-crowned Kinglets only in plots 3 and 4, in which his density estimates were higher and lower, respectively, than our density estimates, and within our confidence intervals for both. Our density estimates were lower for Steller’s Jay (Cyanocitta stelleri) and Varied Thrush (Ixoreus naevius) and higher for Hutton’s Vireo (Vireo huttoni) than Anderson’s estimates; however, those species had comparatively few observations in Anderson’s and our surveys, reducing the reliability of estimates and comparisons.
In comparison to Anderson’s density estimates, the distance-sampling-derived density estimates for our modern surveys were consistently lower across all five species in WCW plots (except for Golden-crowned Kinglet, which increased in all plots) but more variable in MDRF plots. Of these estimates, seven were lower than and one was the same as Anderson’s for Chestnut-backed Chickadee, all were higher for Golden-crowned Kinglet, all were lower for Red-breasted Nuthatch, Brown Creeper, and Pacific Wren (Table 2). Similarly, Anderson’s estimates were outside the distance-sampling-derived 95% confidence intervals in six plots for Chestnut-backed Chickadee (3, 4, 5, 7, 8, and 9), in all plots for Golden-crowned Kinglet (above in 3; below in 4, 5, 6, 7, 8, and 9), in five plots for Red-breasted Nuthatch (above in 3, 6, 7, and 9; below in plot 5), in three plots for Brown Creeper (above in 6, 7, and 9), and in five plots for Pacific Wren (above in 3, 6, 7, 8, and 9).
We found few consistent patterns of change in density by comparing the point estimates and confidence intervals of our three analytical approaches with each other and to those presented by Anderson. When estimates (including Anderson’s) for each focal species were pooled by plot, standard deviations were large, such that in only a small number of cases did error bars of Anderson’s and our multiple approaches not overlap (Figure 4). Overall, density estimates based on our resurvey data were more frequently lower than Anderson’s estimates in WCW than in MDRF. Similarly, our estimates for Brown Creeper and Golden-crowned Kinglets were generally lower and higher, respectively, than Anderson’s, although overlaps of 95% confidence intervals were typical (Figure 4).
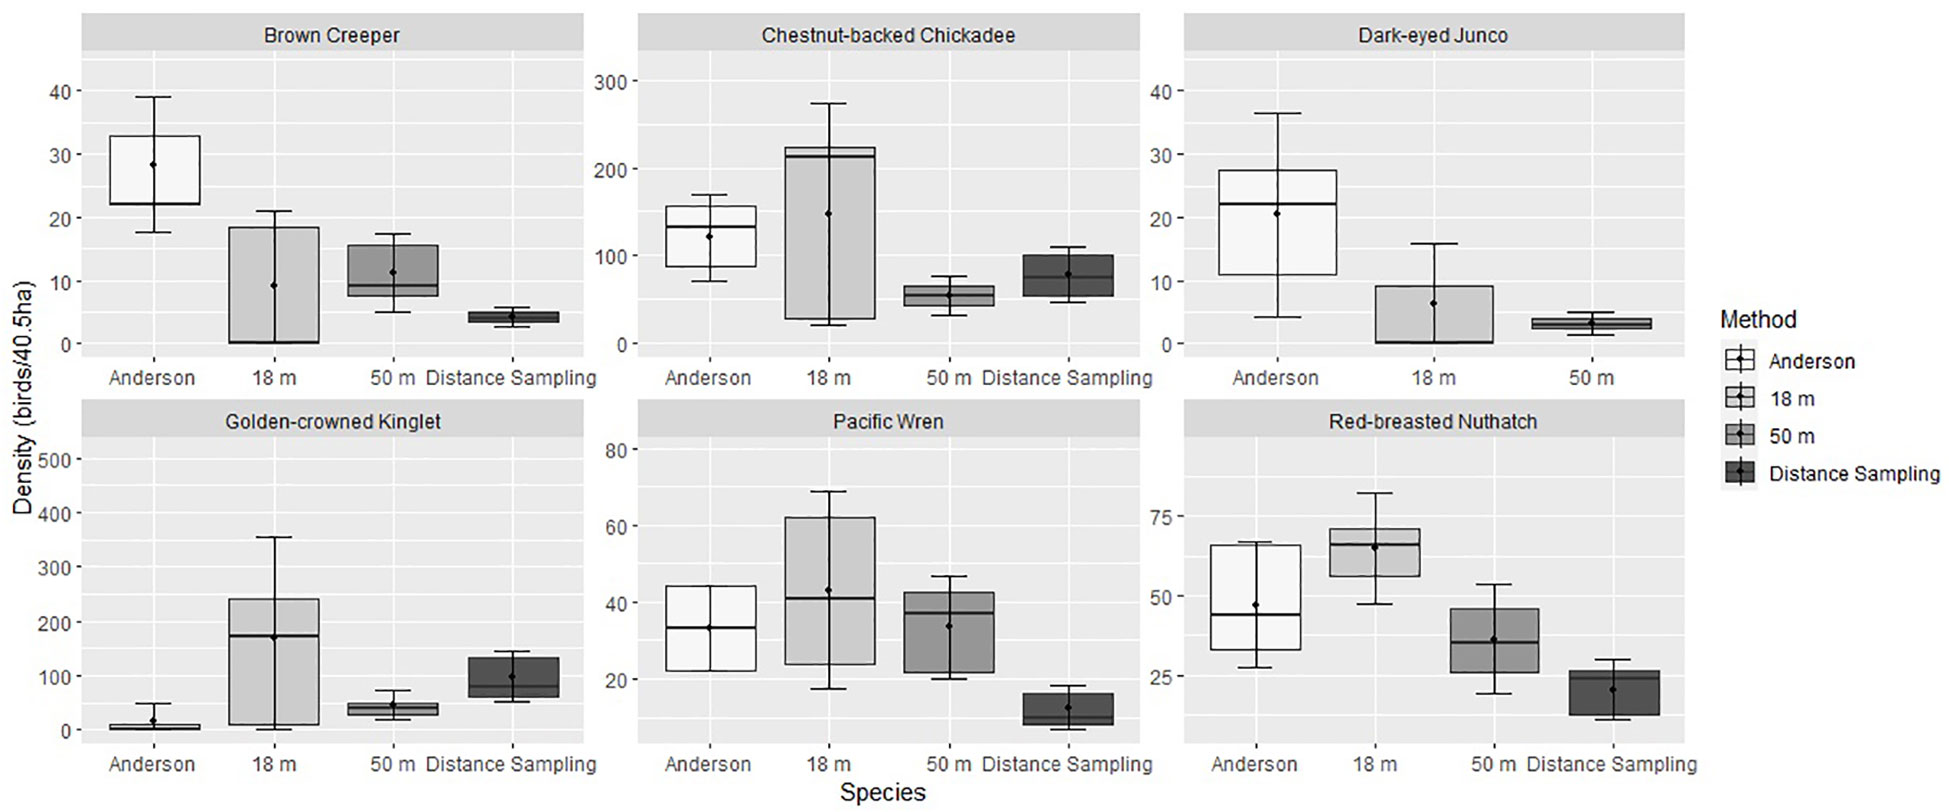
Figure 4 Comparison of density estimates (individuals/40.5 ha) for each of the six most common species. Categories labeled 18 m, 50 m, and Distance Sampling present density estimates derived using three methods (unadjusted estimates based on birds observed within 18 and 50 m, and estimates adjusted for imperfect detection using distance sampling models (Buckland et al., 2001)) based on data collected in 2021-2022. Data were pooled across plots and treated as sample replicates to produce standard deviations. Distance sampling is not reported for Dark-eyed Junco owing to insufficient number of detections.
We observed variable amounts of landscape forest cover change based on comparisons of orthographic photographs from 1970 to satellite imagery from 2021. In general, plots within WCW had relatively consistent forest cover and exhibited relatively little stand replacement or anthropogenic alteration (Figure 2). A small clearcut (approximately 10% of total area) was present in plot 6 just prior to 1970 when the photograph was taken. Similarly, harvest occurred in the northeast corner of plot 7 just prior to 1970 (less than 5% of total area) and again sometime between 1970 and 2021 in the western portion of the plot (approximately 25% of total area). We saw no evidence of timber harvest activity within plot 9 in the last 50 years. In contrast, the high frequency of timber harvest within MDRF in the last 50 years drove notable changes in forest structure and age, which resulted in a diverse matrix of forest types (Figure 3). Forest cover substantially increased between 1970 and 2021 in all MDRF plots (Figure 3). The plots had a relatively large amount (greater than 25% of total area) of timber harvest activity prior to when the 1970 photographs were taken. The most notable changes occurred in plot 4 where approximately 70% of the plot was clearcut. Based on Anderson’s measurements of vegetation structure and bird community assemblages, we assume he had finished his surveys before this harvest was completed. A shelter-wood cut in plot 5 sometime between 2010 and 2015 removed less than 10% of forest cover and exposed a small stand of Oregon white oak (Quercus garryana). Similarly, a small portion (less than 10%) in the center of plot 3 was clearcut in early 2021, which is not depicted in our satellite imagery.
Change in vegetation structure generally mirrored that seen in broad-scale landscape patterns of forest cover. We found lower densities of shrubs in all plots (Table 3). In plots 3, 5, 7, and 8, lower shrub densities correlated with an increase in the density of live trees, suggesting that natural canopy closure led to shade-related shrub exclusion; however, in plots 4, 6, and 9 both live tree and shrub density declined. Because there was little or no timber harvest activity in plots 6 and 9, declining shrub cover might be attributed to forest succession. Tree height class distribution was relatively consistent between 1970 and 2021 in all plots, except for plot 5 in which there was a decrease in the percentage of trees greater than 18 m and an increase in trees less than 18 m (Table 4).
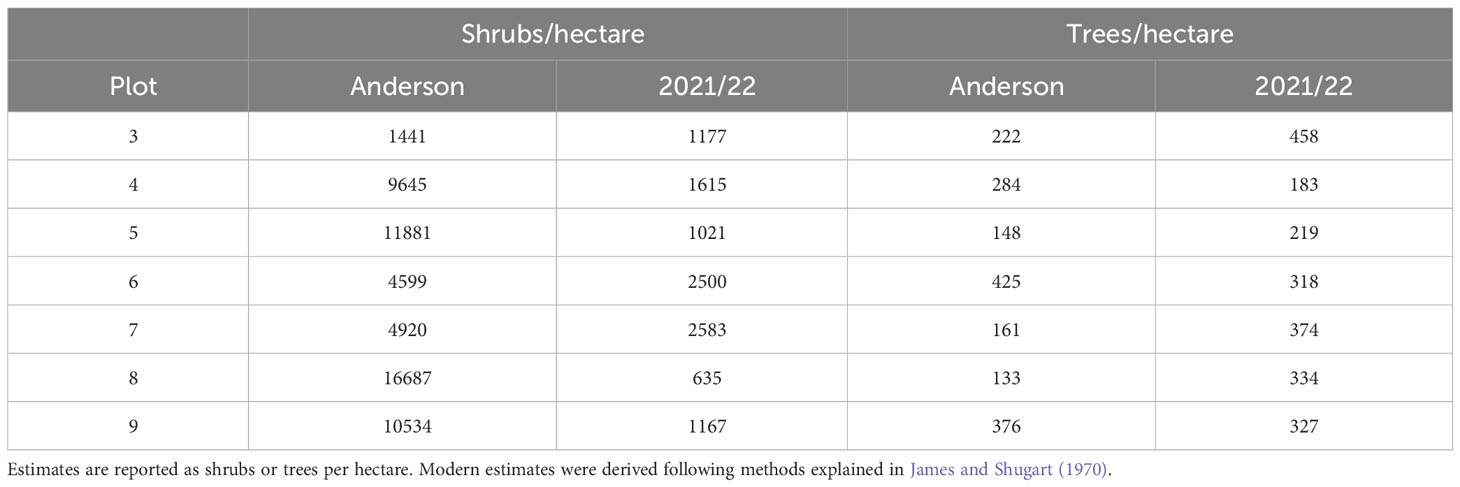
Table 3 Comparison by plot of shrub and tree density from Anderson’s historical and our modern surveys.
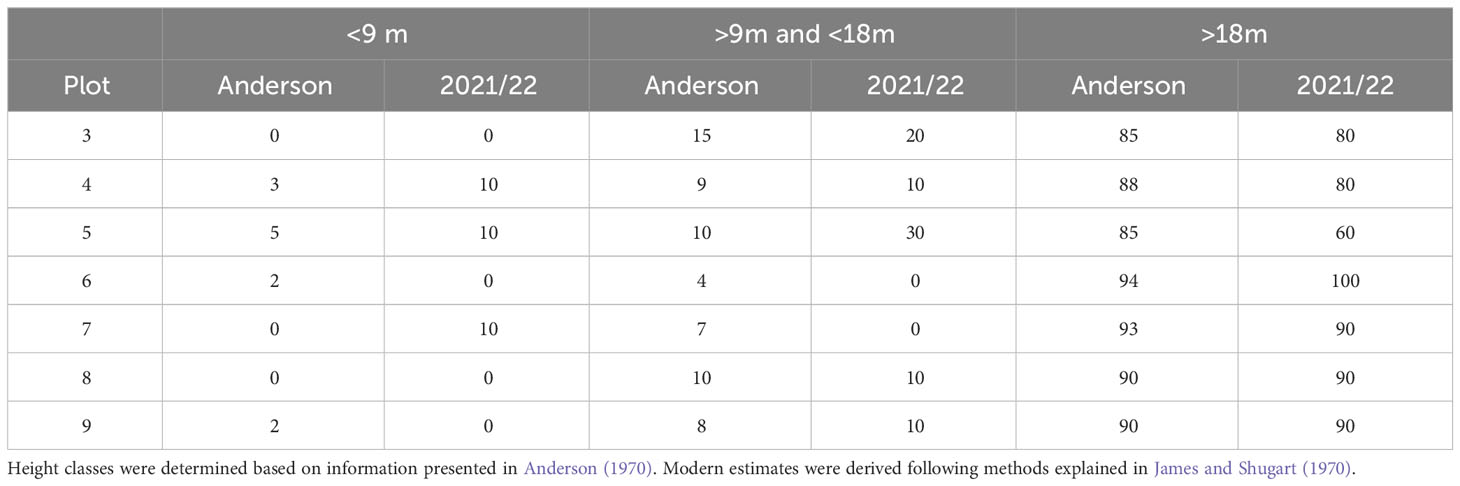
Table 4 Comparison by plot of the percentage of trees in each height class from Anderson’s historical and our modern surveys.
The majority of bird surveys were conducted in middle-aged forests (n=148), followed by older forests (n=88), early successional forests (n=39), and recent clearcuts (n=12). Using paired t-tests we found abundances of Chestnut-backed Chickadee, Golden-crowned Kinglet, and Brown Creeper were similar across the four forest age categories (all p>0.05). Red-breasted Nuthatch and Pacific Wren had higher abundances in clearcuts and early seral forest than in middle-aged and older forests (all p<0.025). Dark-eyed Juncos were most abundant in clearcuts and occurred relatively infrequently in early seral, middle-aged, and older stands (all p<0.025) (Table 5).
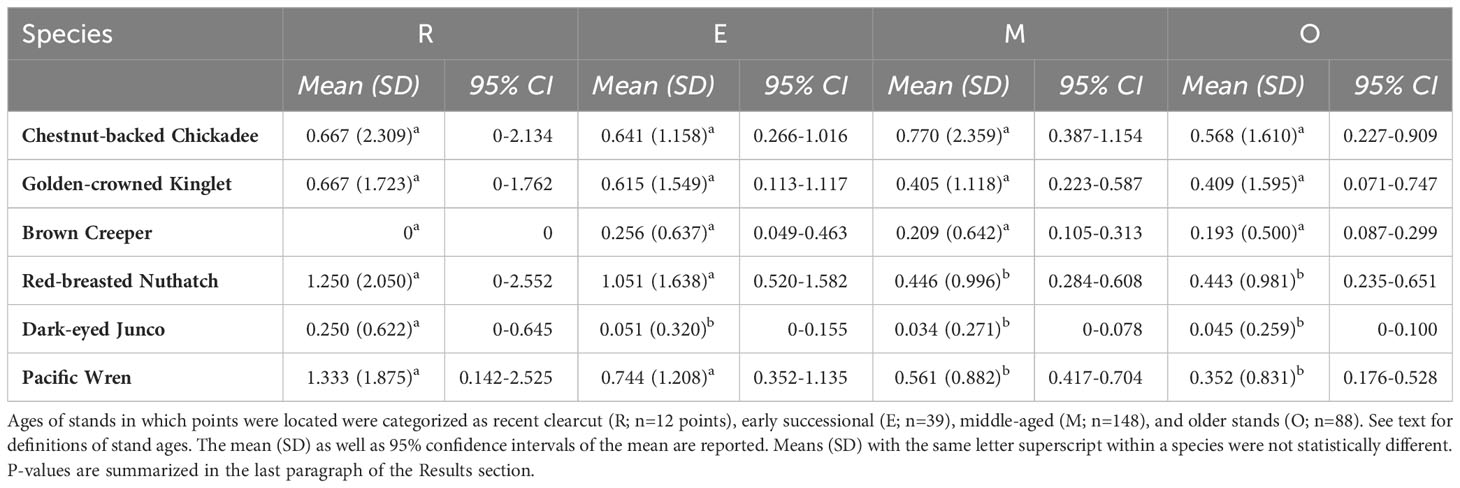
Table 5 Comparison of numbers of birds per point (50-m radius, 10-min duration) as a function of stand age in the Anderson bird plots using paired t-tests.
We found forest bird densities during winter in our Pacific Northwest forests to be similar to estimates from 50 years ago. To our knowledge, this is the first study to document long-term changes of wintering forest birds in the Pacific Northwest using highly structured methods. Our snapshot comparison of Anderson’s original plot-level estimates with our distance-sampling-derived abundance estimates indicated that, of the six most abundant species, one declined, four were similar, and one increased. We investigated changes in vegetation structure and landscape-level patterns of forest cover, which were largely driven by forest harvesting practices and post-harvest forest maturation, as possible drivers of variation in bird densities but found no clear relationships or patterns. Here and in Clements and Robinson (2022), we also preserve extensive details on our methodology and present our results in tabular format to facilitate future resurvey efforts.
Use of historical data to facilitate comparisons of past and present bird communities can be fraught with complications, and is sometimes likened to comparing apples with oranges (Tingley, 2017). Incomplete descriptions of protocols and use of methods widely implemented historically but recently determined to produce problematic estimates can constrain the value of historical datasets. Implementing a hybrid of new and old survey methods during re-survey efforts can at least identify large changes in bird densities across time (Robinson, 1999; Igl and Johnson, 2005; Tingley and Beissinger, 2009; Curtis and Robinson, 2015). The biggest challenge we faced was interpreting Anderson’s vague descriptions of his analytical and field methods. In addition to aligning our methodologies, we also implemented modern techniques (expanded fixed-radius and distance-sampling-derived estimates) to maximize reliability of our comparisons and facilitate future re-surveys but acknowledge the possibility that differences in methodological approaches could influence our conclusions. Therefore, we interpret changes in bird densities and vegetation structure conservatively by addressing large differences observed within plots.
The majority of density estimates based on birds encountered within 18 m were higher in MDRF plots and lower in WCW plots than Anderson’s reported values. While our 18-m radius estimates are products of methodologies that most accurately mimic Anderson’s, some exceed maximum expected densities. For example, density estimates of Golden-crowned Kinglets and Chestnut-backed Chickadees are two to five times greater than expected in Douglas fir woodland (Mahon et al., 2007; Dahlsten et al., 2020; Swanson et al., 2020). Furthermore, many species were entirely missed within 18-m but were regularly encountered within 50 m (e.g., absence of Chestnut-backed Chickadee, Golden-crowned Kinglet, and Brown Creeper in plot 6 during modern surveys). Such sampling biases as a result of small-radius counts are one reason for the development of distance sampling and fixed-radius point counts with 50 m or larger radii that generate more accurate density estimates (Buckland et al., 2001). Although Anderson’s results focused on 18-m radius density estimates, the range of values in his results are more biologically realistic with maximum densities (e.g., Chestnut-backed Chickadees) not exceeding values reported in the literature. Without benefit of additional survey information preserved in his publications to improve our interpretations, we compared our results with his to identify large differences in densities between the two studies, similar to previous efforts that considered major differences in density estimates between historical and modern surveys to have a higher probability of correctly identifying biologically realistic differences (Robinson, 2001).
Models that adjust for imperfect detection are becoming increasingly prevalent in ornithology. We implemented a distance-sampling model to generate density estimates that account for variation in detectability and compared the adjusted estimates with those that do not account for detectability (50-m and 18-m radius modern surveys) and Anderson’s original point estimates. Generally, density estimates based on birds observed within 50 m and produced using distance sampling methods yielded similar results: both showed consistent decreased abundance of Chestnut-backed Chickadee, Red-breasted Nuthatch, and Brown Creeper, and increased abundance of Golden-crowned Kinglet in comparison to Anderson’s 1970 estimates. Trends were consistent across plots, however confidence intervals widely overlapped. We suggest the range of density estimates and confidence intervals indicate relatively minor change in abundances of four of the six most common forest-dwelling bird species over the past 50 years.
We observed higher densities of Golden-crowned Kinglets, a species that typically forages high in the canopy and could have been under-detected during Anderson’s surveys. However, Chestnut-backed Chickadees and Red-breasted Nuthatches also forage in the canopy, often in the same flocks as kinglets, and Anderson detected those species in abundance. Furthermore, kinglets and chickadees are typically included in the same foraging guilds, gleaning small arthropods from foliage (Dahlsten et al., 2020; Swanson et al., 2020), but their density trends are opposite. Winter populations of Golden-crowned Kinglets are known to vary substantially from year to year (Swanson et al., 2020), so it is possible that populations were temporarily suppressed when Anderson conducted his surveys. Several hard freeze events occurred during the winter of 1968-1969 which may have resulted in increased Golden-crowned Kinglet mortality during or prior to Anderson’s surveys (Menne et al., 2012). Anderson did not report his density estimates for specific dates or even each year of surveys, so we cannot confirm if these cold temperatures coincided with a decrease in Golden-crowned Kinglet numbers.
While trends derived from CBC data must be interpreted cautiously, inspecting single year counts may be useful in deducing local abundance of single species. The 1969 Corvallis CBC (centered at 44.507087, -123.269541), the closest count to our study sites, recorded one of its lowest number of Golden-crowned Kinglets per party hour in its 60 years of activity (National Audubon Society, 2020). However, the 2021 Corvallis CBC also recorded a similarly low number of Golden-crowned Kinglets per party hour. Because the 1969 and 2021 CBC data are similar, one might expect surveys during those time periods to yield similar density estimates, but we found higher densities than Anderson. CBC data from the Corvallis Count in the number of Golden-crowned Kinglets per party hour shows a non-significant trend, as is also the case with our other five focal species (National Audubon Society, 2020). Although causes for the general observed absence of kinglets across all but two of Anderson’s plots 50 years ago remain unknown, we observed consistent numbers across both years of our surveys and found them to be one of the most common wintering species.
The observed abundance trends of Chestnut-backed Chickadee, Red-breasted Nuthatch, Brown Creeper, Pacific Wren and Dark-eyed Junco are generally paralleled by Oregon-specific trends determined using United States Geological Survey Breeding Bird Survey (BBS) data; however, BBS data do not mirror our observed increase in Golden-crowned Kinglet (Sauer et al., 2020). In fact, trends based on BBS data suggest that of our six focal species Golden-crowned Kinglets have experienced the steepest declines across Oregon. While BBS trends are based on data from a large area gathered during spring and summer and do not necessarily provide insight into local-level trends during winter, they allow for a unique comparison of our top species because all but the kinglet are year-round residents. Although kinglets do breed in our study region, they normally nest at elevations higher than our study plots.
This study is apparently the first to document changes in forest bird communities during winter across time periods separated by multiple decades from the Pacific Northwest of North America and, aside from general patterns revealed by national-scale analyses from the CBC and Project FeederWatch, is one of the few studies of multi-decadal change from anywhere in temperate North America. The most detailed winter studies are from Scandinavia and western Russia. Fraixedas et al. (2015) observed significant declines in Finland forest birds which they attributed to changes in land-use. We did not observe declines of similar magnitude to those found by Fraixedas et al. (2015), who reported declines in forest bird populations of approximately 50% from 1959–2012. Askeyev et al. (2018) reported contrary results from the Republic of Tatarstan, in western Russia. They found significant increases in winter forest bird populations, which they attributed to decreased thermoregulatory requirements as a result of milder, warmer winters related to climate change. Their focal species were in the same families as ours (Paridae, Certhiidae, Sittidae, and Regulidae). While the density trends reported in Askeyev et al. (2018) are statistically significant across the temporal span of the study, estimates were highly variable between years which may be evidence of the natural dynamism of winter bird communities. Furthermore, the variation observed in the results of the Scandinavian and Russian studies may be indicative of the large number of environmental variables that interact and contribute to the highly dynamic nature of winter bird communities.
The climate of western Oregon is relatively mild, and the region has experienced comparatively little change in temperature and precipitation. Unlike Fraixedas et al. (2015) and Askeyev et al. (2018), who reported temperature increases of 2.50 and 2.13 degrees Celsius, respectively, over the temporal span of their data, average temperature has remained relatively stable in the vicinity of our plots over the past 50 years (Menne et al., 2012). Similarly, average winter precipitation has only slightly decreased (Menne et al., 2012). Temperature and precipitation heavily influence avian food availability and thermoregulatory energetic requirements, and often are factors that limit survival and distribution during winter (Crick, 2004; Princé and Zuckerberg, 2015; Lehikoinen et al., 2016). Because there have not been notable changes in local climate over the past 50 years, we suggest that changes in winter forest bird density and species composition of western Oregon are not directly linked to local climate change.
Visual inspection of orthographic imagery indicated forest cover increased and that forests generally matured across plots, despite somewhat frequent timber harvest activities, particularly in the MDRF plots. We found more frequent declines in density and observed species richness in plots where a lack of obvious anthropogenic disturbance since 1970 allowed forests to mature to the middle stages of succession. Forest bird density and richness are known to follow a bimodal pattern throughout forest maturation in which density and richness peak in early seral stages, recede during middle seral stages, and experience a smaller peak in late seral stages (Keller et al., 2003). Simon et al. (2002) and Ellis and Betts (2011) both documented instances of increased avian density and species richness as a result of anthropogenically created early seral forests. This evidence suggests that forest maturation may be a driver of declines in bird abundance within our study area, however, despite this precedent of bolstered abundance associated with younger forests, we found no consistent patterns of reduced bird abundance in middle-aged or older forests across our six focal species. Of the six focal species, three showed no difference in their abundance across forest age (Chestnut-backed Chickadee, Brown Creeper, and Golden-crowned Kinglet), two were more abundant in recent clearcuts and early seral forests (Pacific Wren and Red-breasted Nuthatch), and one was most abundant in recent clearcuts (Dark-eyed Junco). Minimal correlations between abundance of our six focal species and forests of different successional stages suggests that forest maturation was likely not a primary driver of changes in bird density as compared with Anderson’s observations. While Fraixedas et al. (2015) hypothesized changes in the abundances of some bird guilds were driven by patterns of land use, we suggest anthropogenic changes in forest structure likely had few long-term effects on the winter populations of songbirds in our study area. These findings perhaps reflect that avian abundance and community assemblages are naturally highly dynamic and further support similar conclusions made by other studies that have used historical data (Curtis et al., 2016). Further detailed study on the extent of variation from year to year in the abundance and species composition of winter bird communities may shed more light on population intra- and interannual trends.
The lack of well-structured surveys that seek to quantify winter bird communities is somewhat perplexing. Understanding the complex dynamics of winter bird populations is important for the conservation and management of migratory and resident species alike, and yet, while this has been identified and acknowledged by others over the past 20 years (Lepage and Francis, 2002; Lehikoinen et al., 2016), few studies have sought to conduct rigorous surveys of winter landbird populations. Some potential explanations for this lack of data likely include: 1) Vocalization rates and activity levels are often reduced during winter, which makes detection of birds and therefore accurate estimation of abundances more challenging; 2) Weather, such as rain, snow and wind, may be more frequent in winter, which can reduce bird activity and also impair observer abilities; and 3) Winter conditions, such as snow, ice, and subfreezing temperatures can make field work uncomfortable and even dangerous. However, we believe that the somewhat challenging nature of surveying winter bird communities does not entirely explain the absence of such studies. Winter bird communities, characterized in the northern hemisphere by generally low species diversity, may be less appealing and exciting to many observers, resulting in biases toward surveying spring and fall migration and the summer breeding months when the overall abundance and diversity of birds is greater.
The inconsistencies among findings of the few studies, including this one, that have investigated winter bird communities likely reflect the exceptional natural dynamism and variability that occurs during the season of scarcity. Without continuous long-term bird-survey data and measurement of winter food resources, among other ecological factors, it is challenging to determine specifically how variability in winter conditions influence bird populations and the reliability of estimated trends. Nonetheless, we connected two snapshots in time documenting winter forest bird densities in the Pacific Northwest. We argue that historical data, despite their shortcomings, are incredibly valuable for revealing possible changes in avian communities. They allow novel comparisons of avian distribution, populations, or abundance across large temporal scales in geographical areas that may lack other long-term surveys. In our case, Stanley Anderson’s 50-year-old dataset provided a unique opportunity to investigate dynamics of winter forest bird communities. The challenges of utilizing historical data further support the need for establishing better modern benchmark surveys with highly repeatable methods (e.g. Robinson and Curtis, 2020; Robinson et al., 2020) for counting winter birds. We encourage future exploration and examination of historical avian datasets.
The datasets presented in this study can be found in online repositories. The names of the repository/repositories and accession number(s) can be found below: https://datadryad.org/stash/dataset/doi:10.5061/dryad.rxwdbrvc8.
Ethical approval was not required for the study involving animals in accordance with the local legislation and institutional requirements because we did not directly interact with any wild birds during the research, as this was an observation study.
NC: Conceptualization, Formal analysis, Investigation, Writing – original draft, Writing – review & editing. WR: Conceptualization, Formal analysis, Funding acquisition, Investigation, Writing – original draft, Writing – review & editing.
The author(s) declare that no financial support was received for the research, authorship, and/or publication of this article. This research was supported by the Bob and Phyllis Mace Professorship to WR.
We thank Brent Klumph and Steve Fitzgerald of Oregon State University College of Forestry for permission to access the McDonald-Dunn Research Forest. Similarly, we thank Starker Forests, Inc., for permitting us to conduct surveys on their property adjacent to the Siuslaw National Forest. Thank you to Rachel Lilley with the Oregon State University Special Collections and Archives Research Center and Kathy Stroud with the University of Oregon Library for facilitating access to historic aerial photography.
The authors declare that the research was conducted in the absence of any commercial or financial relationships that could be construed as a potential conflict of interest.
The author(s) declared that they were an editorial board member of Frontiers, at the time of submission. This had no impact on the peer review process and the final decision.
All claims expressed in this article are solely those of the authors and do not necessarily represent those of their affiliated organizations, or those of the publisher, the editors and the reviewers. Any product that may be evaluated in this article, or claim that may be made by its manufacturer, is not guaranteed or endorsed by the publisher.
The Supplementary Material for this article can be found online at: https://www.frontiersin.org/articles/10.3389/fbirs.2024.1304026/full#supplementary-material
Anderson S. H. (1970). Ecological relationships of birds in forest of Western Oregon. Oregon State University. Doctoral Thesis. 529.
Anderson S. H. (1972). Seasonal variations in forest birds of Western Oregon. Northwest Sci. 46, 194–206.
Askeyev A., Askeyev O., Askeyev I., Sparks T. (2023). The role of climate change and food supply on winter populations of seed-eating birds. Eur. J. Ecol. 9, 58–69. doi: 10.17161/eurojecol.v9i1.18436
Askeyev O., Askeyev A., Askeyev I. (2018). Recent climate change has increased forest winter bird densities in East Europe. Ecol. Res. 33, 445–456. doi: 10.1007/s11284-018-1566-4
Bock C. E., Lepthien L. W. (1976). Synchronous eruptions of boreal seed-eating birds. Am. Nat. 110, 559–571. doi: 10.1086/283091
Buckland S. T., Anderson D. R., Burnham K. P., Laake J. L., Borchers D. L., Thomas L. (2001). Introduction to Distance Sample: Estimating abundance of biological populations (New York, USA: Oxford University Press).
Burnham K. P., Anderson D. R. (2002). Model selection and multimodel inference: a practical information-theoretic approach. 2nd ed (New York: Springer).
Butcher G. S., Fuller M. R., McAllister L. S., Geissler P. H. (1990). An evaluation of the Christmas bird count for monitoring population trends of selected species. Wildl. Soc Bull. 1973-2006 18, 129–134.
Ciach M., Fröhlich A. (2017). Habitat type, food resources, noise and light pollution explain the species composition, abundance and stability of a winter bird assemblage in an urban environment. Urban Ecosyst. 20, 547–559. doi: 10.1007/s11252-016-0613-6
Clements N., Robinson W. (2022). A re-survey in 2019-2021 of winter bird communities in the Oregon Coast Range, USA, initially surveyed in 1968-1970. Biodivers. Data J. 10, e91511. doi: 10.3897/BDJ.10.e91511
Cottam G., Curtis J. T. (1956). The use of distance measures in phytosociological sampling. Ecology 37, 451–460. doi: 10.2307/1930167
Crick H. Q. P. (2004). The impact of climate change on birds. Ibis 146, 48–56. doi: 10.1111/j.1474-919X.2004.00327.x
Curtis J. R., Robinson W. D. (2015). Sixty years of change in avian communities of the Pacific Northwest. PeerJ 3, e1152. doi: 10.7717/peerj.1152
Curtis J. R., Robinson W. D., McCune B. (2016). Time trumps habitat in the dynamics of an avian community. Ecosphere 7, e01575. doi: 10.1002/ecs2.1575
Dahlsten D. L., Brennan L. A., McCallum D. A., Gaunt S. L. (2020). Chestnut-backed Chickadee (Poecile rufescens), version 1.0. Birds World. doi: 10.2173/bow.chbchi.01
Deshwal A., Panwar P., Neal J. C., Young M. A. (2021). Using long-term citizen science data to understand distribution and habitat use of an irruptive species. Ecol. Inform. 64, 101377. doi: 10.1016/j.ecoinf.2021.101377
Dunn E. H., Francis C. M., Blancher P. J., Drennan S. R., Howe M. A., Lepage D., et al. (2005). Enhancing the scientific value of the Christmas bird count. Auk 122, 338–346. doi: 10.1093/auk/122.1.338
Dunn E. H., Sauer J. R. (1997). Monitoring Canadian bird populations with winter counts. In: Monitoring bird populations: The Canadian experience (Ottawa, Ontario: Canadian Wildlife Service). Available online at: https://pubs.er.usgs.gov/publication/5210887 (Accessed January 17, 2023).
Ellis T. M., Betts M. G. (2011). Bird abundance and diversity across a hardwood gradient within early seral plantation forest. For. Ecol. Manage. 261, 1372–1381. doi: 10.1016/j.foreco.2011.01.018
Fraixedas S., Lehikoinen A., Lindén A. (2015). Impacts of climate and land-use change on wintering bird populations in Finland. J. Avian Biol. 46, 63–72. doi: 10.1111/jav.00441
Hochachka W. M., Wells J. V., Rosenberg K. V., Tessaglia-Hymes D. L. (1999). Irruptive migration of common redpolls. Condor 101, 195–204. doi: 10.2307/1369983
Houston A. I., McNamara J. M. (1993). A theoretical investigation of the fat reserves and mortality levels of small birds in winter. Ornis Scand. Scand. J. Ornithol. 24, 205–219. doi: 10.2307/3676736
Igl L. D., Johnson D. H. (2005). A retrospective perspective: evaluating population changes by repeating historic bird surveys. USDA For. Serv. Gen. Tech Rep. PSW-GTR-191, 817–830.
James F. C., Shugart H. H. (1970). A quantitative method of habitat description. Audubon Field Notes 24, 727–736.
Jansson C., Ekman J., von Brömssen A. (1981). Winter mortality and food supply in tits parus spp. Oikos 37, 313–322. doi: 10.2307/3544122
Keller J. K., Richmond M. E., Smith C. R. (2003). An explanation of patterns of breeding bird species richness and density following clearcutting in northeastern USA forests. For. Ecol. Manage. 174, 541–564. doi: 10.1016/S0378-1127(02)00074-9
La Sorte F. A., Thompson III, F. R. (2007). Poleward shifts in winter ranges of North American Birds. Ecology 88, 1803–1812. doi: 10.1890/06-1072.1
Latimer C. E., Zuckerberg B. (2021). Habitat loss and thermal tolerances influence the sensitivity of resident bird populations to winter weather at regional scales. J. Anim. Ecol. 90, 317–329. doi: 10.1111/1365-2656.13332
Leech D. I., Crick H. Q. P. (2007). Influence of climate change on the abundance, distribution and phenology of woodland bird species in temperate regions. Ibis 149, 128–145. doi: 10.1111/j.1474-919X.2007.00729.x
Lehikoinen A., Foppen R. P. B., Heldbjerg H., Lindström Å., van Manen W., Piirainen S., et al. (2016). Large-scale climatic drivers of regional winter bird population trends. Divers. Distrib. 22, 1163–1173. doi: 10.1111/ddi.12480
Lehikoinen A., Lindström Å., Santangeli A., Sirkiä P. M., Brotons L., Devictor V., et al. (2021). Wintering bird communities are tracking climate change faster than breeding communities. J. Anim. Ecol. 90, 1085–1095. doi: 10.1111/1365-2656.13433
Lepage D., Francis C. M. (2002). Do feeder counts reliably indicate bird population changes? 21 years of winter bird counts in Ontario, Canada. Condor 104, 255–270. doi: 10.1093/condor/104.2.255
Mahon C. L., Martin K., Steventon J. D. (2007). Habitat attributes and chestnut-backed chickadee nest site selection in uncut and partial-cut forests. Can. J. For. Res. 37, 1272–1285. doi: 10.1139/X06-324
Meehan T. D., Jetz W., Brown J. H. (2004). Energetic determinants of abundance in winter landbird communities. Ecol. Lett. 7, 532–537. doi: 10.1111/j.1461-0248.2004.00611.x
Menne M. J., Durre I., Vose R. S., Gleason B. E., Houston T. G. (2012). An overview of the global historical climatology network-daily database. J. Atmos. Ocean. Technol. 29, 897–910. doi: 10.1175/JTECH-D-11-00103.1
Morrison C. A., Robinson R. A., Clark J. A., Risely K., Gill J. A. (2013). Recent population declines in Afro-Palaearctic migratory birds: the influence of breeding and non-breeding seasons. Divers. Distrib. 19, 1051–1058. doi: 10.1111/ddi.12084
National Audubon Society. (2020). The Christmas Bird Count Historical Results (Audubon). Available online at: https://www.audubon.org/conservation/science/christmas-bird-count/christmas-bird-count-bibliography (Accessed January 19, 2023).
Newbold T., Hudson L. N., Hill S. L. L., Contu S., Lysenko I., Senior R. A., et al. (2015). Global effects of land use on local terrestrial biodiversity. Nature 520, 45–50. doi: 10.1038/nature14324
Northrup J. M., Rivers J. W., Yang Z., Betts M. G. (2019). Synergistic effects of climate and land-use change influence broad-scale avian population declines. Glob. Change Biol. 25, 1561–1575. doi: 10.1111/gcb.14571
Princé K., Zuckerberg B. (2015). Climate change in our backyards: the reshuffling of North America’s winter bird communities. Glob. Change Biol. 21, 572–585. doi: 10.1111/gcb.12740
Robb G. N., McDonald R. A., Chamberlain D. E., Reynolds S. J., Harrison T. J. E., Bearhop S. (2008). Winter feeding of birds increases productivity in the subsequent breeding season. Biol. Lett. 4, 220–223. doi: 10.1098/rsbl.2007.0622
Robinson W. D. (1999). Long-term changes in the avifauna of Barro Colorado Island, Panama, a tropical forest isolate. Conserv. Biol. 13, 85–97. doi: 10.1046/j.1523-1739.1999.97492.x
Robinson W. D. (2001). Changes in abundance of birds in a Neotropical forest fragment over 25 years: a review. Anim. Biodivers. Conserv. 24, 51–65.
Robinson W. D., Curtis J. R. (2020). Creating benchmark measurements of tropical forest bird communities in large plots. Condor 122, 1–15. doi: 10.1093/condor/duaa015
Robinson W. D., Hallman T. A., Curtis J. R. (2020). Benchmarking the avian diversity of oregon in an era of rapid change. Northwest. Nat. 101, 180–193. doi: 10.1898/1051-1733-101.3.180
Rodenhouse N. L., Christenson L. M., Parry D., Green L. E. (2009). Climate change effects on native fauna of northeastern forests. Can. J. For. Res. 39, 249–263. doi: 10.1139/X08-160
Rosenberg K. V., Dokter A. M., Blancher P. J., Sauer J. R., Smith A. C., Smith P. A., et al. (2019). Decline of the North American avifauna. Science 366, 120–124. doi: 10.1126/science.aaw1313
Royle J. A., Dawson D. K., Bates S. (2004). Modeling abundance effects in distance sampling. Ecology 85, 1591–1597. doi: 10.1890/03-3127
Saino N., Szép T., Ambrosini R., Romano M., Møller A. P. (2004). Ecological conditions during winter affect sexual selection and breeding in a migratory bird. Proc. R. Soc Lond. B Biol. Sci. 271, 681–686. doi: 10.1098/rspb.2003.2656
Sala O. E., Stuart Chapin F., Armesto J. J., Berlow E., Bloomfield J., Rodolfo D., et al. (2000). Global biodiversity scenarios for the year 2100. Science 287, 1770–1774. doi: 10.1126/science.287.5459.1770
Sauer J. R., Link W. A., Hines J. E. (2020). The North American breeding bird survey. Anal. Results, 1966–2019. doi: 10.5066/P96A7675
Saunders S. P., Meehan T. D., Michel N. L., Bateman B. L., DeLuca W., Deppe J. L., et al. (2022). Unraveling a century of global change impacts on winter bird distributions in the eastern United States. Glob. Change Biol. 28, 2221–2235. doi: 10.1111/gcb.16063
Sherry T. W., Holmes R. T. (1996). Winter habitat quality, population limitation, and conservation of neotropical-nearctic migrant birds. Ecology 77, 36–48. doi: 10.2307/2265652
Simon N. P., Schwab F. E., Otto R. D. (2002). Songbird abundance in clear-cut and burned stands: a comparison of natural disturbance and forest management. Can. J. For. Res. 32, 1343–1350. doi: 10.1139/x02-057
Strong C., Zuckerberg B., Betancourt J. L., Koenig W. D. (2015). Climatic dipoles drive two principal modes of North American boreal bird irruption. Proc. Natl. Acad. Sci. 112, E2795–E2802. doi: 10.1073/pnas.1418414112
Stuble K. L., Bewick S., Fisher M., Forister M. L., Harrison S. P., Shapiro A. M., et al. (2021). The promise and the perils of resurveying to understand global change impacts. Ecol. Monogr. 91, e01435. doi: 10.1002/ecm.1435
Summers R. W. (1999). Numerical responses by crossbills Loxia spp. to annual fluctuations in cone crops. Ornis Fenn. 76, 141–144.
Swanson D. L., Ingold J. L., Galati R. (2020). Golden-crowned Kinglet (Regulus satrapa), version 1.0. Birds World. doi: 10.2173/bow.gockin.01
Thomas L., Buckland S. T., Rexstad E., Laake J. L., Strindberg S., Hedley S. L., et al. (2010). Distance software: design and analysis of distance sampling surveys for estimating population size. J. Appl. Ecol. 47, 5–14. doi: 10.1111/j.1365-2664.2009.01737.x
Tingley M. W. (2017). “Turning Oranges into Apples: Using detectability correction and bias heuristics to compare imperfectly repeated observations,” in In Stepping in the Same River Twice: Replication in Biological Research (New Haven, Connecticut, USA: Yale University Press), 215–233.
Keywords: avian community change, winter bird communities, historical biodiversity data, biodiversity benchmarks, long-term change in bird abundance, Pacific Northwest
Citation: Clements NM and Robinson WD (2024) A comparison of two snapshot studies half a century apart suggests stability in a Pacific Northwest winter forest bird community. Front. Bird Sci. 3:1304026. doi: 10.3389/fbirs.2024.1304026
Received: 28 September 2023; Accepted: 02 February 2024;
Published: 27 February 2024.
Edited by:
Ana Rainho, University of Lisbon, PortugalReviewed by:
Jesús Domínguez, University of Santiago de Compostela, SpainCopyright © 2024 Clements and Robinson. This is an open-access article distributed under the terms of the Creative Commons Attribution License (CC BY). The use, distribution or reproduction in other forums is permitted, provided the original author(s) and the copyright owner(s) are credited and that the original publication in this journal is cited, in accordance with accepted academic practice. No use, distribution or reproduction is permitted which does not comply with these terms.
*Correspondence: Nolan M. Clements, bm9sYW4uY2xlbWVudHNAb3JlZ29uc3RhdGUuZWR1
Disclaimer: All claims expressed in this article are solely those of the authors and do not necessarily represent those of their affiliated organizations, or those of the publisher, the editors and the reviewers. Any product that may be evaluated in this article or claim that may be made by its manufacturer is not guaranteed or endorsed by the publisher.
Research integrity at Frontiers
Learn more about the work of our research integrity team to safeguard the quality of each article we publish.