 Ether Dharmesh
 Samuel Stealey1†
 Mary Alice Salazar
 Silviya Petrova Zustiak
95% of researchers rate our articles as excellent or good
Learn more about the work of our research integrity team to safeguard the quality of each article we publish.
Find out more
ORIGINAL RESEARCH article
Front. Biomater. Sci. , 18 April 2023
Sec. Delivery Systems and Controlled Release
Volume 2 - 2023 | https://doi.org/10.3389/fbiom.2023.1157554
This article is part of the Research Topic Women in Biomaterials Science 2022 View all 7 articles
Introduction: Hydrogel microspheres are an attractive option for drug delivery applications due to their ease of injection and potential for tunable controlled delivery. However, their utility is limited due to high initial burst release and rapid overall release, which is especially pronounced for small molecules or small size microspheres. We and others have shown that the addition of two-dimensional nanosilicate (NS) particles to hydrogels can significantly prolong release kinetics from hydrogels while minimizing burst release.
Materials and Methods: Here we explored whether NS could modulate release kinetics of small molecules from small size injectable microspheres. Polyethylene glycol (PEG)-based hydrogel microspheres were fabricated via polymer/salt aqueous two-phase separation (ATPS), which is facile, high yield, and scalable, without the need for organic solvents or oils.
Results and Discussion: Importantly, NS and acridine orange (AO), a model cationic small molecule, were shown to phase separate into the PEG-rich phase, allowing for successful encapsulation within hydrogel microspheres. The fabricated microspheres were stable, similar in size to red blood cells, and easily injectable. The effect of various fabrication parameters, including the addition of NS and AO, on microsphere size and polydispersity were explored. Release of AO was significantly slowed from PEG-NS microspheres compared to PEG-only microspheres and correlated with NS concentration. Two additional small molecules, the chemotherapeutic doxorubicin (positive charge), and the model small molecule Brilliant Blue FCF (negative charge), were shown to exhibit prolonged release, underscoring the broad utility of the system. The dependence of release kinetics on encapsulated NS concentration allows for tunable and prolonged release of small molecules from an injectable hydrogel delivery device.
Hydrogels are widely used for drug delivery applications due to their potential for controlling release kinetics, localizing release, and reducing the need for frequent dosing, while preserving the bioactivity of encapsulated therapeutics (Wen et al., 2015). Hydrogel microspheres are especially desirable for drug delivery applications due to their injectability and potential for systemic release (Mandal et al., 2020; Zhao et al., 2021). Polyethylene glycol (PEG) hydrogels are especially well-suited for drug delivery because they are bioinert, biocompatible, and could be made biodegradable with highly tunable degradation kinetics (Zustiak et al., 2012). However, a significant drawback to hydrogel-mediated release is a high initial burst release of the drug, which disrupts sustained release kinetics and poses a toxicity risk due to the release of large quantities of drugs in a short time (Yoo and Won, 2020). This phenomenon is especially pronounced in small size hydrogels (<500 μm) due to the high surface to volume ratio and in the release of small molecules, which can rapidly diffuse out of the hydrogel (Li and Mooney, 2016a). This poses a serious challenge to achieving sustained release of small molecules from injectable hydrogel microspheres.
The addition of two-dimensional layered nanosilicate Laponite XLG (NS) particles to hydrogels has been shown to achieve sustained release of small molecules (Khachani et al., 2022). The high surface area, biocompatibility and biodegradability of NS particles makes them a suitable addition to PEG hydrogels (Tomás et al., 2018). Small molecules are electrostatically adsorbed to the negatively charged faces or positively charged edges of the disc-shaped NS particles, slowing release up to 1000-fold compared to no NS hydrogels (Jansson et al., 2020; Stealey et al., 2021; Stealey et al., 2022). While the effect of NS particles on slowing release of small molecules has been studied in macroscale hydrogels by us and others (Samimi Gharaie et al., 2018; Stealey et al., 2022), microscale hydrogels present an even greater challenge due to small distances required for drug diffusion out of the hydrogel microparticles.
Hydrogel microspheres can be fabricated using many established methods. Mechanical methods of forming hydrogel microspheres include microfluidics and micromolding, which offer greater control over microsphere size but may lack scalability (Zhao et al., 2021). Alternatively, solution-phase methods allow for scalability of hydrogel microsphere production, but may lead to greater polydispersity (King et al., 2011). Solution-phase methods can be classified based on the phase locations of the monomer and the initiator during polymerization. Precipitation polymerization occurs when the monomer and initiator are initially in the same phase, but phase separation occurs due to the insolubility of the formed polymer in the original phase, resulting in the formation of microparticles (Flake et al., 2011).
Aqueous two-phase separation (ATPS), which relies on the immiscibility of a polymer/polymer or polymer/salt mixture, has been widely employed for protein extraction and, more recently, to fabricate PEG-based hydrogel microspheres (Annunziata et al., 2002; Elbert, 2011; Flake et al., 2011; Mytnyk et al., 2017; Mastiani et al., 2019). ATPS is an attractive fabrication method because it allows for quick and facile fabrication of a large number of spheres with sizes of just a few microns in diameter. The smaller sizes are advantageous for injectability in a variety of administration sites and allow for higher packing densities compared to larger microspheres, which theoretically could result in higher drug loading per injection volume. Furthermore, ATPS does not require the use of oil or organic solvents, negating the need for surfactants or extra washing steps that may be toxic or hinder molecule release (Zhang et al., 2022). The ATPS method is also very versatile as demonstrated by Nicols et al. (2009) who modulated gelation kinetics and crosslink density to control microsphere size and swelling. However, the effect of incorporation of nanomaterials on hydrogel microsphere size, polydispersity, properties, and drug release profiles remains unexplored.
In this study, ATPS was used to fabricate PEG-NS nanocomposite hydrogel microspheres capable of sustaining release of small molecules. The effect of various fabrication parameters, as well as the incorporation of NS within hydrogels, was explored to observe the resultant effect on microsphere size and polydispersity, both factors that could affect release kinetics. Mechanical testing revealed the injectability of the microsphere solutions, while bulk release studies demonstrated significantly prolonged release compared to PEG-only hydrogel microspheres. Thus, these PEG-NS nanocomposite microspheres show great potential for an injectable hydrogel microsphere delivery device.
4-arm PEG-Acrylate (4-arm PEG-Ac; 10 kDa) and PEG-dithiol (PEG-diSH; 3.4 kDa) were purchased from Laysan Bio Inc. (Arab, AL, United States). Acridine Orange, triethanolamine (TEA), and doxorubicin were obtained from Millipore Sigma (Saint Louis, MO, United States). Nanosilicate particles (Laponite XLG, abbreviated here as NS) were obtained from BYK Additives (Wesel, Germany). Sodium sulfate and Brilliante Blue FCF were obtained from Sigma-Aldrich (Saint Louis, MO, United States). Barium iodide and potassium bromide (KBr) were procured from ThermoFisher Scientific (Saint Louis, MO, United States).
Stock solutions of 20% w/v 4-arm PEG-Acrylate (4-arm PEG-Ac) and 20% w/v PEG-diSH were prepared by dissolving PEG powder in 1X phosphate buffered saline (PBS). For a 500 μL total reaction volume, 29.8 μL of 20% w/v 4-arm PEG-Ac and 20.2 μL of 20% w/v PEG-diSH were mixed to crosslink via a Michael-type addition reaction for a given amount of time, deemed the “pre-reaction time” for a final concentration of 2% w/v in PEG, unless otherwise noted. Next, 300 uL of 1X PBS was added to the mixture allowing for significant dilution, effectively halting the pre-reaction between 4-arm PEG-Ac and PEG-diSH. For PEG-NS nanocomposite microspheres, NS powder was dispersed in DI water and probe sonicated for 30 s using a Sonic Dismembrator 100 (Fisher Scientific, Hampton, NH) in a 1 s on/1 s off pattern. NS stock solution was then added to the PEG precursor solution for final NS concentrations ranging from 0.01 μg/mL to 1,000 μg/mL. The solution was moved to a 37°C incubator and 150 μL of 1.25 M sodium sulfate solution was added without agitating the PEG-NS mixture. The solution was removed from the incubator after 45 min, and 1,000 μL of fresh 1X PBS was added to dilute the sodium sulfate and allow for microsphere dispersion. The microspheres were further dispersed by vigorous pipetting, and the solution was centrifuged for 30 s at ×2000 g to sediment the microspheres. The supernatant was removed, and the microspheres were resuspended in PBS to a final volume of 1.5 mL. The solution was then probe sonicated for 30 s in a 1 s on/1 s off pattern to disperse microsphere aggregates.
Similar procedure was used for the fabrication of PEG-NS-AO microspheres, with the following modifications. Following addition of PEG precursor solutions and specified NS concentration, AO (final concentration 0.004 mM) was added to the reaction volume immediately prior to addition of Na2SO4. Following phase separation, microspheres were buffer exchanged and sonicated as described above.
To determine whether all PEG polymer was incorporated in the hydrogel microspheres, sodium dodecyl sulfate polyacrylamide gel electrophoresis (SDS-PAGE) was utilized. Following microsphere formation with 0, 1, or 1,000 μg/mL NS, 1,000 μL of fresh ×1 PBS was added to each microcentrifuge tube containing the 500 μL of microsphere suspension, and the solution was gently mixed to disperse hydrogel microspheres. Microcentrifuge tubes were then centrifuged (60 s at ×2000 g) and supernatant was decanted and collected for analysis. Standards of 0.67% w/v, 0.33% w/v, 0.1% w/v, 0.05% w/v and 0% PEG (equimolar ratio of 4-arm PEG-Ac: PEG-diSH in PBS), as well as a 100 μg/mL NS negative control were also prepared. Samples were diluted with 65 μL of sodium dodecyl sulfate for every 35 μL of sample. Lanes were loaded with 5 μL of each standard or sample. SDS-PAGE was performed at a voltage of 200 V on a 4%–12% gradient Bis-Tris gel for 40 min in an XCell SureLock cell (Thermo Fisher Scientific) powered by a PowerPac Basic power supply (Bio-Rad). Gels were stained with barium iodide for PEG (Ghassemi et al., 2021).
Microspheres were imaged using an inverted microscope (Zeiss Axiovert 200, Thornwood, NY) with a ×20 or a ×40 objective. Microsphere diameters were measured using ImageJ software (Schneider et al., 2012) and % coefficient of variance (% CV) was calculated using the following formula:
At least 200 microspheres from each sample were measured to ensure accurate representations of microsphere size and polydispersity.
To prepare samples for Fourier-transform infrared spectroscopy (FT-IR) analysis, PEG-only, PEG-NS, PEG-AO, and PEG-NS-AO microspheres were fabricated with a final NS concentration of 100 μg/mL and final AO concentration of 0.004 mM. The prepared samples were centrifuged (×2000 g for 30 s), the supernatant was removed, and the sedimented microspheres were lyophilized (Lyophilizer, VirTris Sentry 2.0, Warminster, PA). Lyophilized microspheres were then mixed with potassium bromide (KBr) powder in a 10:1 w/w ratio and pelletized. Pellets were then used to confirm phase separation of the NS particles and AO into the PEG-rich phase using FT-IR (Shimadzu FTIR-8400S, Tokyo, Japan). Spectra were plotted and analyzed for peaks indicative of PEG, AO, or NS.
Fluorescent microscopy was also utilized to confirm phase separation of AO in the PEG microspheres. PEG microspheres containing 0.1 mM AO were imaged using inverted fluorescence microscope (Zeiss Axiovert 200, Thornwood, NY) with a ×40 objective. Note the higher concentration of AO used here to ensure microspheres were visible and imageable.
Microsphere gelation time was evaluated by observing the time at which stable microspheres were formed for each group. PEG and PEG-NS precursor solutions in 0.375 M Na2SO4 salt solution (2% w/v in PEG) were prepared and incubated at 37°C for a specified amount of time, with measurements taken every 3 min for up to 60 min. Following the indicated incubation time, the microcentrifuge tube was removed and imaged. Droplet formation, as indicated by opacity of the solution, was noted and buffer exchange into PBS was performed as described above. Following buffer exchange, solutions were again centrifuged, and pellet formation was noted, indicative of stable microsphere formation. To further confirm stable microsphere formation, 30 μL aliquots of each re-resuspended solution were imaged using an inverted microscope to observe microspheres. This process was repeated with PEG groups at varying temperatures (4C, 25, 37, or 60°C) to observe the effect of temperature on gelation time.
The viscosity of the PEG and PEG-NS precursor solutions was measured as a function of shear rate using an AR2000 ex Rheometer (TA Instruments, New Castle, DE, United States) at 37°C with a gap of 400 μm and a 20 mm parallel plate geometry (Supplementary Figure S1). The precursor solutions were pipetted onto the rheometer Peltier plate, and viscosity was measured at shear rates of 0.01–100 s−1 at a constant strain of 2%. The flow consistency index, K, and the flow behavior index, n, were calculated using the Ostwald-de Waele relationship (where η represents the measured viscosity (Pa·s) and γ represents the shear rate (s-1) (Wilson et al., 2017):
To determine if the shear stresses encountered during injection, a peak-hold shear recovery test was used (Deo et al., 2022). Following buffer exchange and sonication, microspheres slurry solutions with 0, 1, or 100 μg/mL NS were pipetted onto the Peltier plate and the gap was lowered to 400 μm and the solution was allowed to equilibrate for 1 min. A multi-step peak-hold test was performed in the following sequence: 50 s of shear rate 0.01 s-1, 10 s of shear rate 1,000 s-1 to simulate shear stresses encountered during extrusion from a syringe, and 60 s of shear rate 0.01 s-1. Separately, aliquots of microsphere solutions were imaged prior to and immediately following extrusion through a 27 G hypodermic needle tip (Exelint, Redondo Beach, CA) using phase contrast microscope to visualize any negatively impacted hydrogel microsphere structure.
Swelling of the microspheres was measured prior to buffer exchange, after buffer exchange, and after sonication and characterized by measuring microsphere diameters as described above.
Bulk release studies were performed with AO as the model small molecule. PEG (2% w/v in PEG) and PEG-NS microspheres (2% w/v in PEG and 0–1,000 μg/mL in NS) were prepared as described above, with AO (final concentration of 0.004 mM) added immediately prior to addition of Na2SO4. After incubating for 45 min, 1,000 μL of 1X PBS was added to the microcentrifuge tubes and the phase-separated microspheres were dispersed via gentle pipetting. The microspheres were then centrifuged (×2000 g for 30 s) and the supernatant was removed and stored for PEG recovery and encapsulation efficiency calculations. The microspheres were then resuspended in 1.5 mL of fresh ×1 PBS, marking the beginning of the release test.
At specified time points, the microspheres were centrifuged (2000 x g for 30 s) and 200 μL aliquots of the supernatant were removed from each tube and analyzed immediately. Fresh ×1 PBS (200 μL) was added to maintain a sink volume of 1,500 μL. AO concentration for each releasate sample was determined by measuring the fluorescence of the collected samples at excitation/emission wavelengths of 500/540 nm, respectively, using a SpectraMax i3 plate reader (Molecular Devices, San Jose, CA, United States).
The total mass of released AO at each time point was calculated using a mass balance:
where Mi represents AO concentration at time i, Minf represents AO concentration at infinite time, Mi/Minf represents the fractional release, Ci represents the AO concentration in the releasate at time i, V represents the total volume of the release solution, and Vs represents the releasate sample volume.
For short release times, the effective diffusion coefficient was calculated using a modified form of Fick’s Law (Ritger and Peppas, 1987):
where D is the diffusion coefficient and a is the radius of the microsphere.
To demonstrate the effect of release buffer salinity on release kinetics, 0.004 mM AO was loaded into either hydrogel microspheres containing 0 μg/mL NS (PEG-only) or 100 μg/mL NS using the procedure described above. Instead of PBS, 100 mg/mL NaCl solution was used as the release buffer for both samples. AO concentration was again measured via fluorescence, where the decrease in AO fluorescence due to higher solution salinity was accounted for, as previously described (Khachani et al., 2022).
Two additional small molecules with varying size and charge were also utilized to demonstrate the robustness of this nanocomposite delivery device (Table 1). Doxorubicin (DOX), a clinically relevant chemotherapeutic, and Brilliant Blue FCF (BB) were loaded into hydrogel microspheres containing 0 μg/mL NS (PEG-only) or 100 μg/mL NS (PEG-NS) using the procedure described above. Concentration of DOX was measured via fluorescence using the excitation and emission wavelengths described in Table 1. BB concentration was measured using absorption at 570 nm. To negate effects of PEG or NS on absorption of releasate samples, additional “blank” groups containing 0 μg/mL NS (PEG-only) or 100 μg/mL NS (PEG-NS) with no BB were fabricated an analyzed. BB concentrations at each time point were calculated by subtracting respective absorbance of blank groups from BB-containing samples.
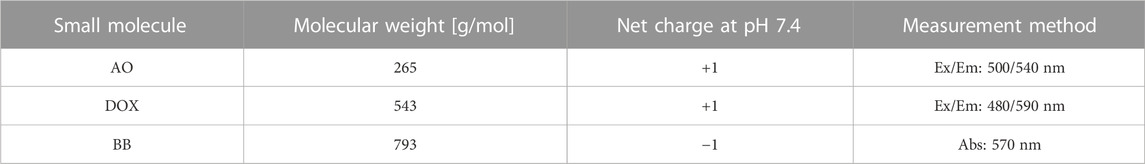
TABLE 1. Properties of small molecules used for bulk release studies. molecular weight, net charge, and excitation/emission wavelengths for acridine orange (AO), doxorubicin (DOX), and Brilliant Blue FCF (BB). Ex/Em refers to excitation and emission wavelengths of fluorescence measurements, while Abs refers to absorption measurement at indicated wavelength.
The results of experiments are the mean values ± standard deviation of at least three separate experiments. For all microsphere size data, measurements consisted of at least 200 measurements of individual microspheres from four separate batches. For all experiments, comparisons between two groups were performed with student’s t-tests and were considered statistically significant when p < 0.05. Comparisons between multiple groups were performed with single-factor analysis of variance (ANOVA) followed by Tukey’s post hoc test and were considered statistically significant when p < 0.05. All statistics were performed with GraphPad Prism software (Version 6.0, San Diego, CA).
PEG microspheres were successfully fabricated via aqueous two-phase separation (ATPS, Figure 1). Above a given temperature and kosmotropic salt concentration (Supplementary Figure S2), the polymer phase becomes more immiscible within the aqueous solvent, forming a polymer-rich phase. The droplets of this polymer-rich phase are unstable following buffer exchange into a solution below the cloud point. However, when polymer macromer and crosslinker phase separate together into these polymer-rich droplets, gelation occurs, forming stable hydrogel microspheres. Here, two-dimensional nanosilicate particles (NS) were phase separated into the PEG-rich phase and subsequently encapsulated within the hydrogel microspheres to allow for sustained release of AO, a cationic model small molecule.
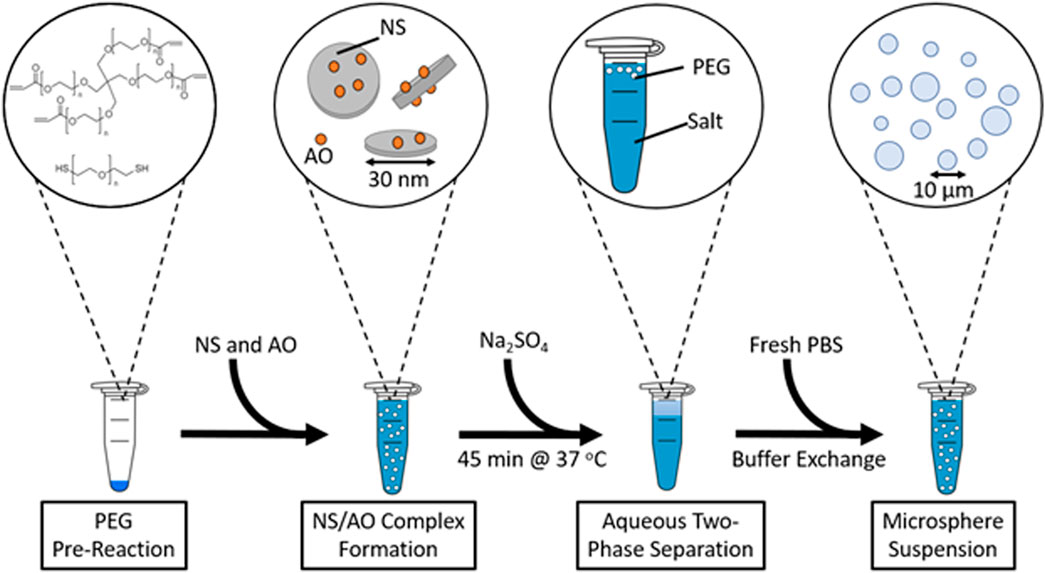
FIGURE 1. Schematic depicting the fabrication of PEG and PEG-NS-AO microspheres by aqueous two-phase separation.
Salt concentration can play a critical role in determining phase separation kinetics and microsphere size (Supplementary Figure S3). At salt concentrations below the cloud point, such as 0.125 M for this system, at a given temperature, no phase separation occurs, and no microspheres are formed. At higher salt concentrations, the salt phase becomes denser than the PEG-rich phase, rising to the top of the reaction volume. When this buoyancy occurs rapidly and before gelation occurs, PEG-rich phase droplets can coalesce to form larger microspheres, as can be observed in the 0.875 M Na2SO4 group. To ensure minimal coalescence and polydispersity, a Na2SO4 concentration of 0.375 M was used for all future experiments.
A critical step of the fabrication process is the buffer exchange into a more physiologically compatible solvent. Microspheres were easily exchanged into 1X PBS by centrifuging microspheres and decanting the supernatant that contained diluted Na2SO4. Microspheres were shown to swell significantly following this buffer exchange (Supplementary Figure S4). Even after re-suspension in PBS, microspheres exhibited aggregation that was not easily separated via pipetting or use of Tween 80 surfactant (data not shown). As such, microsphere suspension solutions were sonicated, effectively breaking up microsphere aggregates, thereby resulting in individual hydrogel microspheres.
The effects of PEG concentration, pre-reaction time, incubation temperature and pH on microsphere diameter and polydispersity were studied to optimize microsphere fabrication conditions to achieve microspheres <10 μm and minimize polydispersity (Figure 2). For all experiments we used 2% w/v PEG, 5 min pre-reaction time, 37°C, and pH 7.4, unless otherwise noted.
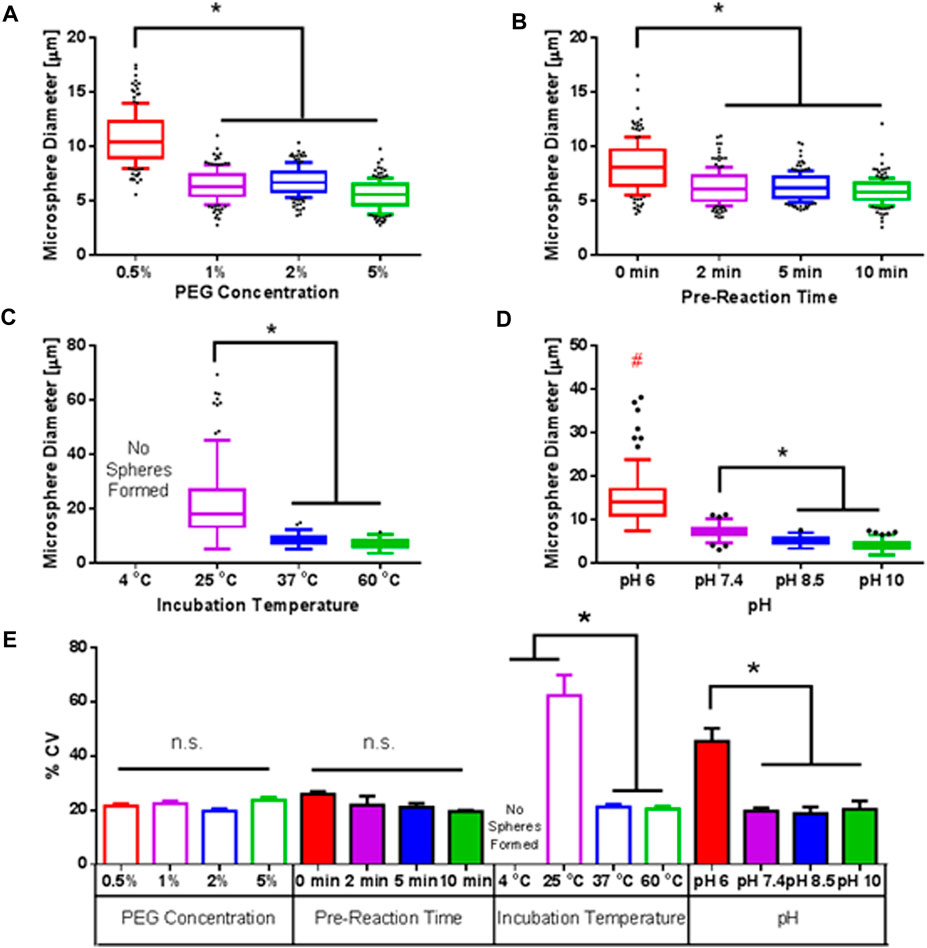
FIGURE 2. Parametric Optimization of Fabrication Conditions. Effect of pH (A), pre-reaction time (B), incubation temperature (C), and pH (D) on microsphere diameter and polydispersity. For each condition, we used 2% w/v PEG, 5 min pre-reaction time, 37°C, and pH 7.4, unless noted otherwise. Data represents >200 microspheres for each condition. (E) Calculated % coefficient of variance (% CV) for each measured group. * indicates statistically significant difference (n = 3, p < 0.5).
First, final PEG concentration was varied between 0.5% w/v to 5% w/v (Figure 2A). It was expected that increasing PEG concentration would decrease microsphere size due to higher local concentrations of PEG, allowing for gelation to proceed more rapidly, thereby preventing droplet coalescence. As expected, 0.5% w/v PEG resulted in microspheres with diameters of ∼10 μm and ∼6 μm at a PEG concentration of 5% w/v. No significant effect on polydispersity, as measured by percent coefficient of variance (% CV) was detected, with % CV values of ∼20% for all groups.
Similarly, an increase in pre-reaction time between 4-arm PEG-Ac and PEG-diSH was expected to decrease microsphere diameter as solutions would be near the “gel-point”, minimizing the time needed for PEG droplets to gel and form stable microsphere, thereby lessening coalescence of droplets (Figure 2B). This was shown to be the case as microsphere size decreased from ∼8 μm with no pre-reaction to ∼6 μm with a pre-reaction time of 10 min. However, pre-reaction times above 10 min resulted in premature gelation of solutions prior to phase separation and were therefore not considered. No significant difference in polydispersity was observed, though a trend was noted that increasing pre-reaction time decreased polydispersity.
Next, reaction temperature was explored (Figure 2C). As expected, no phase separation or microsphere formation were observed at 4°C, which fell below the cloud point (Supplementary Figure S2). As temperature was increased, microsphere size significantly decreased. At 25°C, a number of large spheres (>50 μm) were observed. The lower temperature led to slower phase separation and slower gelation kinetics, allowing for coalescence of PEG droplets. At 37°C and 60°C, phase separation and gelation were more efficient, leading to significantly smaller sizes (∼50% decrease) and polydispersity (∼66% decrease) than the 25°C group.
Lastly, solution pH was modulated to alter the gelation kinetics. At more basic pH, the thiol groups of PEG-diSH become more reduced, leading to faster reaction with acrylate groups of 4-arm PEG-Ac. Similar to the 25°C group, a wide spread of microsphere diameters were observed at slightly acidic pH of 6.5 At mildly basic pH 7.4, microsphere diameters were significantly smaller, and polydispersity decreased compared to the pH 6.5 group. At more basic pH 8.5 and pH 10, microsphere diameters decreased to averages of ∼6 μm and ∼5 μm, respectively, due to even faster gelation kinetics.
Overall, across conditions a positive correlation between microsphere diameter and polydispersity was observed, where conditions with larger diameters exhibited higher % CV (Supplementary Figure S5). This can be attributed to the interplay between phase separation and gelation, where faster gelling conditions decrease the amount of time possible for coalescence, thereby resulting in both small microsphere diameters and lower polydispersity.
For all future experiments, 37°C and pH 7.4 were used to provide mild conditions that were unlikely to denature or degrade encapsulated drugs while still providing small microsphere size and minimal polydispersity. A pre-reaction time of 5 min was used to reduce polydispersity without causing premature gelation. Lastly, a PEG concentration of 2% w/v was utilized to provide relatively higher PEG concentrations to slow small molecule release.
Another consideration of utilizing ATPS to fabricate these nanocomposite microspheres is the efficiency of the Michael-type addition reaction. Ideally, a high efficiency of conversion of PEG macromer and crosslinker (4-arm PEG-Ac and PEG-diSH, respectively) to a fully gelled mesh network is desirable to achieve high yield of microspheres. To determine the efficiency of the phase separation, PEG-poor salt phase following phase separation and dilution of Na2SO4 was collected and analyzed for the presence of PEG. As seen in Supplementary Figure S6, PEG was found in the PEG poor-phase, indicating that not all polymer was incorporated into the microspheres. Little difference was observed between samples with varying NS concentrations, indicating that NS did not affect phase separation efficiency. The high amount of smearing observed for sample groups compared to control groups (unreacted PEG) can be attributed to the reaction between 4-arm PEG-Ac and PEG-diSH and subsequent chain growth. The NS only (no PEG) negative control also reveals that NS did not affect staining and interfere with data analysis.
In this study, NS was incorporated into PEG hydrogel microspheres to control release of a model small molecule, AO. To confirm NS and AO were present in the PEG-rich phase and successfully encapsulated within the hydrogel microspheres, Fourier transform infrared spectroscopy (FTIR) was utilized (Figure 3A). Microspheres containing only PEG (PEG-only), PEG +100 μg/mL NS (PEG-NS), PEG + 0.004 mM AO (PEG-AO), and PEG +100 μg/mL NS + 0.004 mM AO (PEG-NS-AO) were lyophilized and analyzed. Peaks indicative of PEG were present in each of the four samples as expected. Specifically, the peak at 1,051 cm-1 that represents C-O stretching and the peak at 1,453 cm-1 indicative of C-H bending were observed in each sample. The small peak at 1,633 cm-1 in the PEG only group, which represents the C=C bond present within the acrylate end groups of 4-arm PEG-Ac, indicates that not all acrylate end groups were reacted with thiol groups.
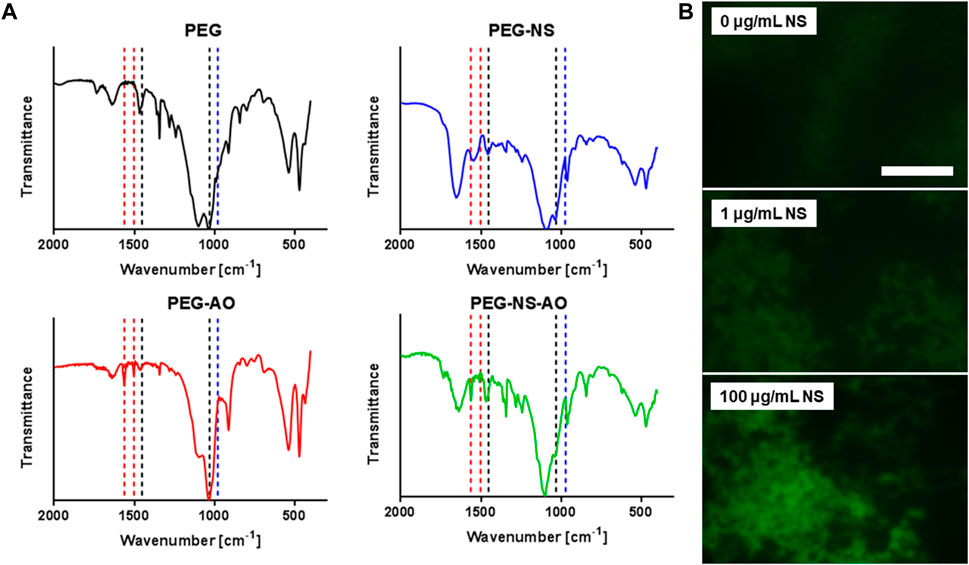
FIGURE 3. Confirmation of NS and AO Hydrogel Microsphere Encapsulation. (A) FTIR spectra of microspheres containing PEG-only, PEG-NS, PEG-AO, and PEG-NS-AO. Black drop lines indicate peaks representative of PEG, blue drop lines represent peaks indicative of NS, and red drop lines are for peaks typical of AO. (B) Fluorescent images of PEG microspheres containing 0.1 mM AO and 0, 1, or 100 μg/mL NS following buffer exchange and sonication. Scale bar = 50 μm.
The peak at 991 cm-1, indicative of Si-O stretching of NS, was present in the PEG-NS and PEG-NS-AO samples but absent in PEG-only and PEG-AO samples, as expected. This result confirmed that NS phase separated into the PEG-rich phase and was encapsulated within the hydrogel microspheres. Other peaks typical of NS, including at 472 cm-1 and 534 cm-1, representative of Si-O-Mg and Si-O-Al, were convoluted with PEG peaks and could not be used for analysis. Peaks indicative of AO were present in the PEG-AO and PEG-NS-AO samples, including at 1,563 cm-1 and 1,503 cm-1, representative of skeletal vibrations of the phenyl ring of AO and the σCN stretching of AO, respectively. Similar to NS, other peaks typically indicative of AO were convoluted by PEG and NS peaks.
Fluorescent imaging was also used to confirm NS and AO were successfully encapsulated within PEG microspheres (Figure 3B). To ensure imageability, AO concentration was increased to 0.1 mM in the initial solution. In microspheres containing 0 μg/mL NS (PEG-only) and 1 μg/mL NS, microspheres were only faintly visible due to lower encapsulation efficiency. The “unbound” AO was also visible following centrifugation of microspheres, as evidenced by an orange color in the supernatant (Supplementary Figure S7). Conversely, in the 100 μg/mL NS group, microspheres were clearly visible against a mostly dark background, confirming the majority of AO had been successfully encapsulated. The supernatant of the 100 μg/mL NS also remained clear, further corroborating the fluorescent imaging results. The dependence of this fluorescence on NS concentration further confirms NS and AO were incorporated into the microspheres.
The effect of NS concentration of microsphere size and polydispersity was investigated via phase contrast microscopy (Figure 4). As NS concentration increased, so too did microsphere diameter, ranging from 8.8 μm at an NS concentration of 0 μg/mL to 11.8 μm at 1,000 μg/mL NS, representing a 34% increase. Microspheres were significantly larger than PEG-only microspheres at NS concentrations greater than 1 μg/mL. Microscope images also revealed increased microsphere clumping and aggregation at NS concentrations greater than 100 μg/mL (Figure 4C). Microsphere polydispersity did not exhibit a statistically significant dependence on NS concentration, though polydispersity did trend upwards as NS concentration increased. Note that further addition of AO to the PEG-NS microspheres did not affect microsphere diameter or polydispersity (Supplementary Figure S8). While microsphere diameter increased with increasing NS concentration for PEG-NS-AO, microsphere diameter and polydispersity were statistically insignificantly different from PEG-NS groups at comparable NS concentrations.
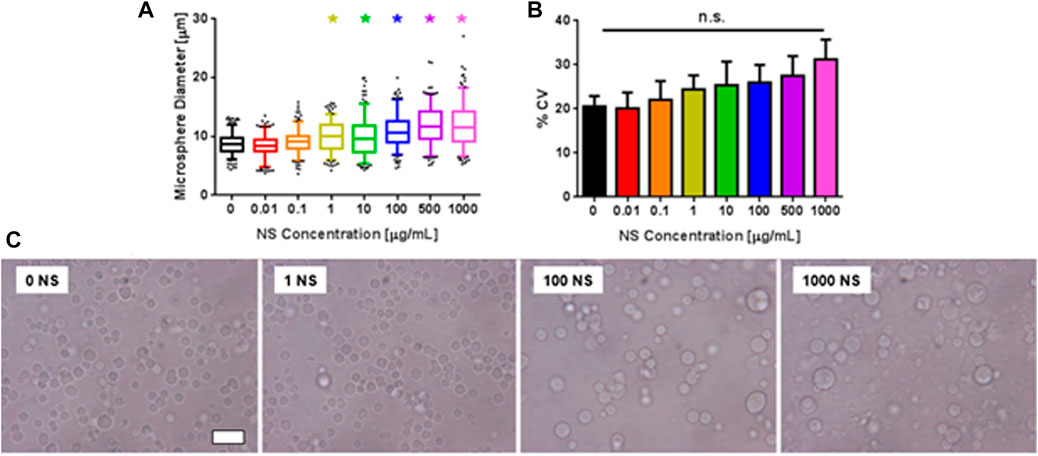
FIGURE 4. Effect of NS concentration on PEG microsphere size. (A) Microsphere diameter as a function of NS concentration. * indicates statistically significant difference from 0 μg/mL NS group (n = 3, p < 0.5). (B) % CV of microsphere diameter as a function of NS concentration. (C) Phase contrast microscope images of microspheres at various NS concentrations. Scale bar represents 20 μm.
To characterize whether NS addition affected microsphere gelation time or mechanical properties, PEG-NS solutions were prepared at three NS concentrations, namely, 0 μg/mL, 1 μg/mL, and 100 μg/mL, and gelation time was evaluated by measuring the time after which stable microspheres were formed (Figures 5A, B). This testing revealed the presence of NS did not significantly alter the gelation time, though gelation time did trend downward. PEG droplet formation was observed as early as 20 min, but upon buffer exchange almost no spheres were visible, indicating gelation had not yet occurred. For all conditions, stable gelation occurred at about 30 min. As can be seen in Supplementary Figure S9, temperature had a significant effect on gelation time, with increased temperature leading to shorter gelation time. Gelation was twice as fast at 60°C compared to 25°C. As expected, no gelation was observed in the absence of Na2SO4 or PEG-diSH, as no stable microspheres were observed following buffer exchange (results not shown). The results seen here corroborate the 45 min allotted for phase separation as gelation was assumed complete with no significant increase observed in the number of spheres after 40 min at 37°C.
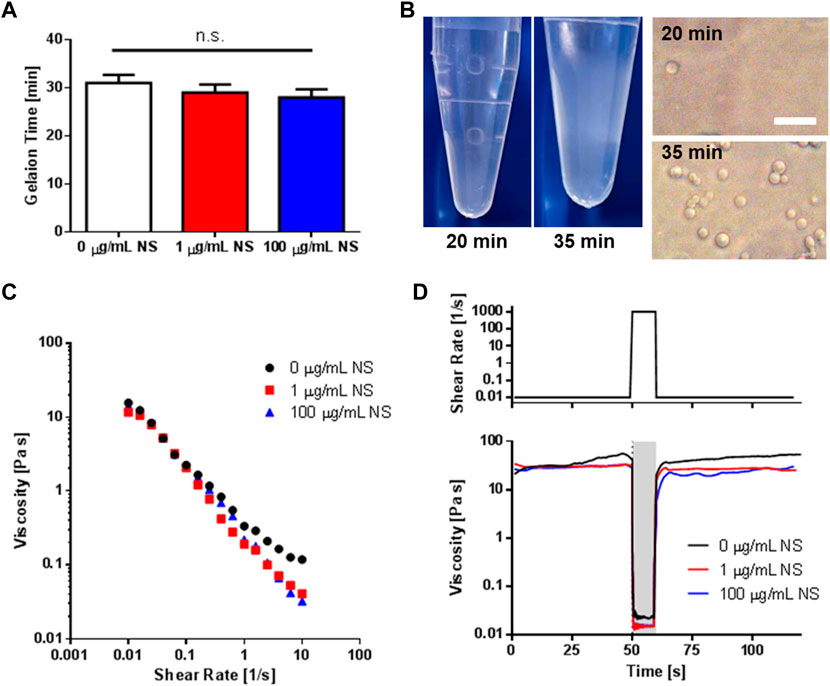
FIGURE 5. Gelation Time and Injectability of PEG-NS Microspheres. (A) Gelation time of microspheres as a function of NS concentration as determined from imaging as shown in (B). (B) Representative macro and microscopy images showing the presence of PEG-rich droplets prior to gelation (20 min) and following gelation (35 min) for 100 μg/mL NS samples. Images of were taken following buffer exchange into PBS. Scale bar represents 20 μm. (C) Shear-thinning behavior of microspheres in the absence and presence of NS. (D) A representative rheological simulation of shear stresses encountered during extrusion from an insulin needle. A period of low shear rate was followed by 10 s of high shear rate (simulating extrusion), which was then followed by another period of low shear rate. Microspheres fabricated with 0, 1, or 100 μg/mL NS regained their initial viscosities, indicating hydrogel structure was not adversely impacted.
All microsphere suspension solutions exhibited shear-thinning behavior, with NS containing groups showing significantly lower flow index values of n, representing a higher degree of shear-thinning than PEG-only microspheres (Figure 5C, Supplementary Table S1).
Hydrogel microspheres offer a unique opportunity for delivery via injection. However, microspheres must maintain their structure after experiencing the high shear environment during extrusion through a syringe needle. Here, rheology was used to simulate the shear stresses encountered during extrusion (Figure 5D, Supplementary Figure S10). An initial period of 50 s at low shear (0.01 s-1) was followed by 10 s of high shear (1,000 s-1), which was then followed by an additional 60 s of low shear (0.01 s-1). Both PEG-only and PEG-NS hydrogel microspheres exhibited recovery of pre-high stress shear viscosities, indicating the hydrogel structure remained intact. Additionally, microscopy images qualitatively revealed no difference in microsphere morphology or size following extrusion through a hypodermic needle, further showing the injectability of the fabricated hydrogel microspheres.
AO was encapsulated within PEG-NS microspheres to characterize the effect of NS concentration on small molecule release from PEG microspheres. Here, AO was used as the model cationic small molecule because its innate fluorescence allowed for facile detection and measurement of concentration in the releasate.
First, AO encapsulation efficiency of microspheres as a function of NS concentration was determined by measuring AO concentration in the supernatant following Na2SO4 dilution and centrifugation of microspheres (Figure 6A). For the PEG-only condition, AO encapsulation efficiency was 35%. As NS concentration increased, the encapsulation efficiency of AO increased significantly to 98% at 1,000 μg/mL NS. Encapsulation efficiency was significantly higher than the 0 μg/mL NS control group at NS concentrations higher than 1 μg/mL. This suggests that the addition of NS particles to PEG microspheres allows adsorption of small molecules to NS particles, thereby retaining AO within the microspheres.
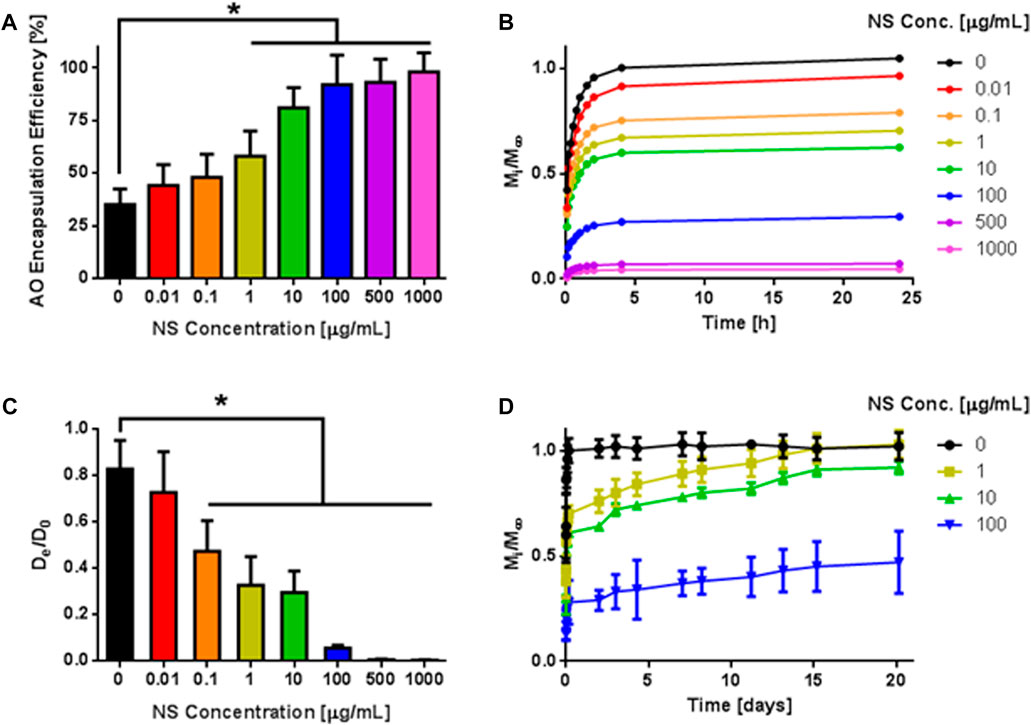
FIGURE 6. Release of AO from PEG-NS Microspheres. (A) Encapsulation efficiency of AO following hydrogel microsphere fabrication. * indicates statistically significant difference from 0 μg/mL NS group (n = 4, p < 0.05). (B) Fractional release profiles of AO from microspheres containing varying concentration of NS over short release times. Error bars are omitted here to improve clarity of graph (n = 4). (C) Calculated diffusivities based on Eq. 4 and data from (B) * indicates statistically significant difference from 0 μg/mL NS group (n = 4, p < 0.05). (D) Fractional release profiles of AO from microspheres containing varying concentration of NS over long release times.
The release of AO from PEG microspheres containing 0–1,000 μg/mL NS was evaluated for short release times (Figure 6B). In PEG-only (0 μg/mL NS) microspheres, AO release was rapid, and a high initial burst release was observed as expected, with more than 90% of AO molecules released after 2 h. Conversely, AO release was significantly reduced from PEG-NS microspheres. As NS concentration increased, the initial burst release of AO was further controlled, with 63%, 25%, and 4% of AO released within 2 h for NS concentrations of 1, 100 and 1,000 μg/mL, respectively.
The effective diffusion coefficients of the microspheres for each condition were determined with a modified Fick’s Law (Eq. 3; Figure 6C). In the absence of NS, PEG-only microspheres exhibited a normalized diffusivity of 0.82, equating to an 18% reduction in diffusivity compared to diffusivity in water. PEG-NS microspheres with at least 0.1 μg/mL NS showed significantly reduced diffusivities compared to the 0 μg/mL NS group, with normalized diffusivities of 0.32, 0.05, and 0.004 for the 1, 100, and 1,000 μg/mL NS groups, respectively. These decreases represent 2.5-fold 16-fold, and 200-fold decreases from the 0 μg/mL, respectively. This suggests that the addition of NS to PEG microspheres significantly limits the diffusion of AO molecules out of the microspheres, revealing an efficient mechanism for sustained small molecule release.
AO release was also followed up to 20 days for various NS concentrations, and the same trend was observed where an increase in NS concentration resulted in reduced initial burst release and slower release of AO over time (Figure 6D). After 20 days, 100% of AO was released from the 1 μg/mL NS group and 92% AO was released from the 10 μg/mL NS microspheres and 47% of AO was released from 1,000 μg/mL NS.
To demonstrate the reversibility of NS-AO interactions, AO was released from 0 μg/mL NS and 100 μg/mL NS microspheres in a high salt concentration (100 mg/mL NaCl) release buffer (Supplementary Figure S11). The release buffer salinity did not affect the release kinetics from the 0 μg/mL (PEG-only) group, with all AO being released within 24 h. However, for the PEG-NS (100 μg/mL NS) group, the higher salt concentration led to 2.4-fold faster release of AO than at the lower NaCl concentration. This release kinetics were also observed in the change in effective diffusion coefficient, which was significantly higher at the higher NaCl concentration for the PEG-NS samples.
To further validate the robustness of this PEG-NS microsphere delivery device, two other small molecules with varying charge were released from microspheres containing either 0 μg/mL NS or 100 μg/mL NS (Figure 7). These two small molecules were the chemotherapeutic doxorubicin (DOX), which is positively charged at pH 7.4, and another model small molecule, Brilliant Blue (BB) which exhibits a negative charge at physiological pH (Table 1).
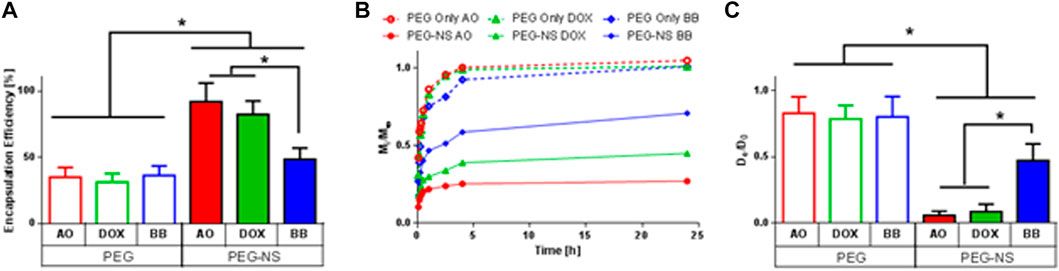
FIGURE 7. Effect of Small Molecule Charge on Encapsulation Efficiency and Release Kinetics. (A) Encapsulation efficiency of AO, DOX, or BB following hydrogel microsphere fabrication. * indicates statistically significant difference between groups (n = 4, p < 0.05). (B) Fractional release profiles of AO, DOX or BB from microspheres containing 0 μg/mL NS (PEG) or 100 μg/mL NS (PEG-NS) over short release times. Error bars are omitted here to improve clarity of graph (n = 4). (C) Calculated diffusivities based on Eq. 4 and data from (B) * indicates statistically significant difference between groups (n = 4, p < 0.05).
No significant change in encapsulation efficiency was observed for PEG-only (0 μg/mL NS) microspheres between AO, DOX, and BB (Figure 7A). Encapsulation efficiency was significantly higher for all PEG-NS samples compared to PEG-only microspheres. However, encapsulation efficiency was significantly lower for BB in PEG-NS microspheres (48%) than for AO (92%) or DOX (82%) for PEG-NS samples.
Similarly, all three small molecules were rapidly released from PEG-only microspheres, with over 90% of the encapsulated small molecule released within 4 h (Figures 7B, C). For PEG-NS microspheres, release was contingent on small molecule charge, with negatively charged BB being released faster than cationic AO or DOX. DOX demonstrated a 2-fold increase in diffusivity while BB showed a 10-fold increase in diffusivity compared to AO from PEG-NS microspheres.
Nanocomposite hydrogel microspheres with diameters of ∼10 μm were successfully fabricated via aqueous two-phase separation (ATPS), a method that allowed for quick, facile fabrication of a large number of microspheres in a short time. By incorporating two-dimensional nanosilicate particles within these microspheres, sustained release of small molecules with varying charge was made possible.
The ATPS fabrication method employed here involves mixing PEG macromers with an aqueous sodium sulfate solution and allowing for a thermally induced phase separation to occur, resulting in the formation of PEG microspheres (Nichols et al., 2009). Above a certain temperature, PEG undergoes nucleation or spinodal decomposition to phase separate into PEG-rich domains. This temperature is denoted by the cloud point, which represents the binodal line (Supplementary Figure S2) (Bae et al., 1991). The PEG-rich domains grow through coalescence caused by Brownian collision and subsequent merging of domains or by mass transfer from smaller to larger PEG-rich domains through diffusion, known as Ostwald ripening (Lifshitz and Slyozov, 1961; Friedlander and Wang, 1966).
PEG is widely used for both polymer/polymer and polymer/salt phase separation to extract large particles such as proteins or viruses (Glyk et al., 2015). Proteins can partition into a singular phase allowing for quick and scalable purification or enrichment (Asenjo and Andrews, 2011). In addition to macromolecules, small molecules may also be extracted via ATPS into the PEG-rich phase (Esmanhoto and Kilikian, 2004). While ATPS has been exploited for extraction of proteins in downstream processing applications, it also lends itself to applications in drug delivery. PEG can be easily crosslinked via chemical crosslinkers to form stable hydrogels with tunable swelling and degradation properties (Zustiak and Leach, 2010). Therefore, therapeutics may be easily encapsulated within hydrogel microspheres in a one-step fabrication method.
Here, polymer/salt ATPS was selected to fabricate PEG microspheres because it allows for rapid, scalable, and high yield production of microspheres. The simple process does not require special instrumentation and is easily accessible for any lab, regardless of personnel training level. The fabricated microspheres (∼10 μm) are smaller than what can typically be achieved via other fabrication methods such as microfluidics and electrospraying (20–1,000 μm and 50–1,000 μm, respectively) while still exhibiting relatively low polydispersity (Jain et al., 2015; Chen et al., 2021). The polydispersity of these ATPS-fabricated microspheres is not as low as other methods such as microfluidics (<5% CV), but still offers the potential for microspheres that are much smaller than typically fabricated with microfluidics and have diameters that vary by only a few microns (Sheth et al., 2021; Zhao et al., 2021). Therefore, the polydispersity of ∼20% was deemed acceptable for this study.
Interestingly, the measured polydispersity of this system was higher than that of some other PEG-based ATPS fabrication methods that utilized PEG-diacrylate with a photoinitiator (∼4% CV) (Flake et al., 2011). This could be attributed to the faster gelation kinetics of photo-initiated gelation compared to the Michael-type addition utilized here. The microspheres fabricated here did show lower polydispersity compared to ATPS-fabricated PEG-vinyl sulfone/PEG-amine microspheres (∼45% CV) (Nichols et al., 2009). Thus, the molecular weight of PEG macromer and crosslinker, as well as crosslinking chemistry, can have a significant impact on microsphere size and polydispersity.
Another benefit of ATPS is that it does not require the use of oil or other organic solvents that require additional washing steps and can require surfactants that have potential to cause toxicity. These extra washing steps lead to undesired elution of encapsulated drugs, leading to inefficient drug loading (Andre et al., 2010). Residual oil on microspheres could also lead to inflammation (Liang et al., 2003). Therefore, the entirely water-based ATPS fabrication offers advantages over other microsphere fabrication methods.
Hydrogel microspheres offer great potential due to their injectability and potential for systemic release applications, as compared to slab hydrogels that must be implanted. However, the utility of hydrogel microspheres as drug delivery devices is severely hampered by rapid release kinetics, especially for small molecules (Li and Mooney, 2016b). These small molecules, which are much smaller than the effective mesh size of the hydrogel, can easily diffuse out of the hydrogel matrix and into the surrounding environment (Mathias et al., 2010). The relatively small size of the hydrogel microspheres provides for short diffusion distances leading to much faster release than from larger hydrogel geometries. For example, a 30 μL hydrogel microsphere solution would have a surface area to volume ratio over one million times larger than that of a 30 μL slab hydrogel.
This study also demonstrated the effect of various ATPS parameters on microsphere size and polydispersity. As can be seen in Figure 2, incubation temperature had the most profound effect on microsphere sizing. This can be attributed to both affecting the phase separation speed (Supplementary Figure S2) and the gelation kinetics. At temperatures below the cloud point, phase separation did not occur, and no microspheres were formed, as PEG would not gel at such low (2% w/v) concentration. As temperature and thermal energy increased, PEG gelation proceeded more quickly, limiting coalescence and Ostwald ripening of PEG droplets to form larger microspheres (Nichols et al., 2009). This increasing of gelation kinetics was observed via gelation time measurements (Supplementary Figure S9).
For the other parameters studied, factors that led to the system reaching the “gel point” faster resulted in smaller and less polydisperse microspheres (Supplementary Table S2). More basic pH led to faster reaction kinetics between the thiols of PEG-diSH and acylate moieties of 4-arm PEG-Ac, leading to pH 10 showing the smallest microspheres (Zustiak and Leach, 2010). When PEG concentration was increased, more reactive groups were present within the reaction volume, increasing the effective reaction rate and leading to faster gelation. Similarly, when PEG was allowed to pre-react, polymer chain lengthening occurred prior to phase separation, allowing for gelation to occur rapidly following phase separation. These results are consistent with the literature, where faster gelation decreased microsphere diameters (Nichols et al., 2009).
Our results here indicate that not all PEG added to the system was converted to stable hydrogel structures (Supplementary Figure S6). However, this was to be expected as a relatively low concentration of Na2SO4 was utilized for this study. Therefore, phase separation was not as profound or efficient as was observed for higher salt concentrations, leading to more PEG to be found in the PEG-poor Na2SO4 phase. Similar studies have also revealed that not all PEG is found within the fabricated microspheres (Flake et al., 2011). PEG reaction efficiency was sacrificed here to minimize microsphere polydispersity, which was shown to decrease with lower Na2SO4 concentrations. Furthermore, while PEG conversion efficiency was not maximized, a substantial number of microspheres were fabricated (∼109 microspheres per mL).
ATPS-fabricated hydrogel microspheres have been previously used for delivery of proteins and growth factors through direct covalent attachment to PEG and though specific binding to the heparin-decorated PEG (Roam et al., 2010; Roam et al., 2014; Roam et al., 2015). Encapsulated proteins were released up to 12 days and maintained their bioactivity during release (Roam et al., 2014; Roam et al., 2015). These macromolecules could be loaded into the microspheres during temperature-induced phase separation or following microsphere buffer exchange and diffusion of macromolecules into the microspheres (Roam et al., 2014). Loading drug post-buffer exchange prevents thermal degradation or denaturation of encapsulated drug during the microsphere fabrication process. However, formation of microspheres at physiologic temperature, such as performed in this study, allows for simplified fabrication process and, potentially, higher loading efficiency.
Our lab and others have demonstrated the usefulness of incorporating two-dimensional nanosilicate clays such as Laponite (NS) into hydrophilic hydrogels to prolong release of both small molecules and proteins, including cationic, neutral, and anionic species (Howell et al., 2018; Cross et al., 2019; Stealey et al., 2021; Khachani et al., 2022; Stealey et al., 2022). Acridine Orange (AO) was used here as a model cationic small molecule. The positively charged nature of AO allowed for the slowest release kinetics to demonstrate the utility of this system due to interaction with the negatively charged faces of NS particles (Lv et al., 2011). Importantly, FT-IR revealed both NS and AO phase separated into the PEG-rich phase during ATPS, allowing for facile encapsulation of both NS and AO (Figure 3).
Hydrogel microspheres must demonstrate the ability to be easily injected and maintain their fidelity following the high shear stresses involved with the injection (Scott et al., 2011). Furthermore, these red blood cell-sized hydrogel microspheres must withstand high shear environments within the vasculature were they to be injected intravenously (Chertok et al., 2013). As expected, our PEG-NS microspheres demonstrated similar size and morphology following extrusion from a hypodermic needle (Supplementary Figure S10) (Henise et al., 2020). Additionally, PEG-NS microspheres exhibited more profound shear-thinning behavior than did PEG-only microspheres, further confirming the successful encapsulation of NS and utility as compressible microspheres (Sheikhi et al., 2018). Therefore, these PEG-NS microspheres are suitable for delivery via injection (Appel et al., 2015).
For the rheological measurements performed here, the sample was treated as a “viscous fluid” and measurements were not inferred to give details about a bulk hydrogel of the same composition. For shear-thinning and injectability measurements, the measured viscosities were indicative of the microsphere slurry solution, which is more representative of the expected results during injection, as opposed to the properties of a bulk hydrogel.
AO was added to initial solutions (prior to microsphere formation) at a concentration of 0.004 mM, representing 2 μg AO per reaction volume. For PEG-only microspheres, only 35% of AO (0.7 μg) was encapsulated within the microspheres following washing (Figure 6A). This can be attributed to AO only showing some encapsulation into the microspheres and being able to rapidly diffuse in and out of the microspheres. For microspheres with 0.1 μg/mL NS, 44% (0.88 μg) of AO was successfully encapsulated, while at the highest NS concentration of 1,000 μg/mL, 98% (1.96 μg) was encapsulated. Based on the dependence of AO encapsulation efficiency on NS concentration, the increase in encapsulation efficiency can be attributed to increased adsorption onto NS particles, which were subsequently encapsulated within the PEG hydrogel microspheres.
AO was released from PEG-only microspheres via simple diffusion. The small diameter of AO (<1 nm) is significantly smaller than the effective mesh size of the hydrogel microsphere (5–15 nm), allowing for AO and other small molecules to easily diffuse out of the microspheres via Brownian motion (Peppas et al., 1999; Zustiak et al., 2010). On the other hand, release of AO from PEG-NS microspheres could be attributed to a combination of desorption of AO from NS particles and NS particle degradation. In the reverse process of cationic exchange in which AO was intercalated and adsorbed to the NS, cations in the release buffer may dislodge AO molecules, freeing the AO to diffuse out of the hydrogel and be released. Higher release buffer salt concentrations were shown to increase release kinetics, as more cations were present to desorb AO, further implicating AO desorption as one of release mechanisms at play in this delivery device (Supplementary Figure S11). Similar studies have shown changing release buffer pH also affects release kinetics due to a similar desorption of small molecules from NS (Gonçalves et al., 2014a; Khachani et al., 2022). Additionally, NS particles naturally degrade into non-cytotoxic components within 30–50 days (Gaharwar et al., 2019). Once NS particles have degraded, AO is no longer held within the hydrogel matrix and can easily diffuse out into the local environment. Here, release was only followed to 20 days, so degradation of NS particles was likely not the main mechanism of AO release but could be expected to play a larger role for release times nearing the typical degradation time of NS (30–50 days). Crucially, release of AO could be tuned based on NS concentration, allowing for a “plug-and-play” type delivery device, in which release kinetics can be easily modulated by rational design (Khachani et al., 2022).
Two additional small molecules with varying size and charge were also loaded into PEG-only and PEG-NS microspheres to demonstrate the robustness of this nanocomposite delivery device (Figure 7). Cationic AO and DOX, and anionic BB all showed slower release profiles in PEG-NS microspheres compared to microspheres without NS. The prolonged release kinetics could be attributed to small molecule interactions with NS, either through intercalation via cationic exchange or surface adsorption onto the negatively charged faces or positively charged edges of NS particles (Jiang et al., 2022; Khachani et al., 2022). These interactions also serve to explain the variation in encapsulation efficiency observed for the small molecules in PEG-NS microspheres. Cationic AO could be adsorbed or intercalated onto or into NS particles, thereby allowing for a relatively high amount of loading (Adeyemo et al., 2017). DOX exhibits a positive charge at physiologic pH due to the protonation of an amino group, which could also interact with the negatively charged NS surface (Heger et al., 2013; Gonçalves et al., 2014b). Conversely, BB was limited to interactions with the edge of NS particles, a relatively small surface area to interact with compared to NS particle faces. Non-etheless, these results indicate that these PEG-NS microspheres may be used with a variety of small molecule drugs and therapeutics, as DOX has been previously shown to maintain its bioactivity following adsorption onto NS particles (Gonçalves et al., 2014a; Gonçalves et al., 2014b; Jiang et al., 2019).
The incorporation of NS into these PEG hydrogel microspheres represents an exciting Frontier to enhance the utility of hydrogel microspheres for drug delivery applications that would otherwise be hindered by rapid release of encapsulated therapeutics. Microspheres are desirable for delivery applications due to their ease of injection, targeting ability, and scalability (Vigata et al., 2020; Yawalkar et al., 2022). NS has only recently been explored for biomedical applications, including delivery (Cross et al., 2019; Gaharwar et al., 2019; Davis et al., 2021). The facile incorporation of NS into the polymer matrix and enhancement of microsphere mechanical properties enables a unique and versatile delivery platform for localized release (Zhang et al., 2020). By combining the benefits of microspheres with the sustained release provided by NS, this design offers a robust plug-and-play type delivery device that can be easily tuned and used for a variety of small molecules. Such nanocomposite hydrogel systems fabricated via ATPS have been previously unexplored to our knowledge. Future work will seek to improve microsphere polydispersity and determine the in vivo distribution of these red-blood cell sized hydrogel microspheres following injection. Cytotoxicity and blood clotting evaluation will be essential to ensure NS particles do not impart adverse side effects. Additionally, encapsulation and subsequent release of macromolecules such as proteins and enzymes may be explored.
Nanocomposite hydrogel microspheres containing two-dimensional nanosilicate particles were successfully fabricated via ATPS, representing an enhanced delivery device with improved mechanical and release properties. These microspheres were shown to be compressible and injectable with diameters of ∼10 μm and % CV of ∼20%. Microsphere diameter could be varied by altering fabrication parameters such as reaction temperature or pH, as well as polymer pre-reaction time or concentration. NS was shown to phase separate into the PEG-rich domain and was subsequently encapsulated within the fabricated microspheres, without adversely affecting microsphere polydispersity. Release of a model cationic small molecule could be modulated by varying NS concentration, demonstrating significantly prolonged release compared to PEG-only microspheres. Furthermore, small molecules of varying net charge all demonstrated sustained released from PEG-NS microspheres, highlighting device robustness. Thus, this delivery platform offers an exciting opportunity to combine the benefits of hydrogel microsphere delivery devices with the incorporation of nanomaterial’s, offering enhanced delivery kinetics and device tunability.
The raw data supporting the conclusion of this article will be made available by the authors, without undue reservation.
SS, MS, ED, and SZ contributed to the conception and design of the study. ED and SS performed all experiments. ED, SS, DE, and SZ wrote sections of the manuscript. All author contributed to the manuscript revision, read, and approved the submitted version.
This work was partially provided by seed funding provided to SZ by the Institute for Drug and Bio therapeutic Innovation at Saint Louis University. Funding was also partially provided by a graduate assistantship awarded to SS by the School of Science and Engineering, Saint Louis University, and by a SURGE fellowship provided to ED by Saint Louis University.
The authors would like to acknowledge Samuel Ruesing and Damon Osbourn for their technical assistance with SDS-PAGE and FT-IR, respectively.
The authors declare that the research was conducted in the absence of any commercial or financial relationships that could be construed as a potential conflict of interest.
All claims expressed in this article are solely those of the authors and do not necessarily represent those of their affiliated organizations, or those of the publisher, the editors and the reviewers. Any product that may be evaluated in this article, or claim that may be made by its manufacturer, is not guaranteed or endorsed by the publisher.
The Supplementary Material for this article can be found online at: https://www.frontiersin.org/articles/10.3389/fbiom.2023.1157554/full#supplementary-material
Adeyemo, A. A., Adeoye, I. O., and Bello, O. S. (2017). Adsorption of dyes using different types of clay: A review. Appl. Water Sci. 7 (2), 543–568. doi:10.1007/s13201-015-0322-y
Andre, R. S., Zaniquelli, M., Baratti, M. O., and Jorge, R. A. (2010). Drug release from microspheres and nanospheres of poly(lactide-co-glycolide) without sphere separation from the release medium. J. Braz. Chem. Soc. 21 (2), 214.
Annunziata, O., Asherie, N., Lomakin, A., Pande, J., Ogun, O., and Benedek, G. B. (2002). Effect of polyethylene glycol on the liquid–liquid phase transition in aqueous protein solutions. Proc. Natl. Acad. Sci. 99 (22), 14165–14170. doi:10.1073/pnas.212507199
Appel, E. A., Tibbitt, M. W., Webber, M. J., Mattix, B. A., Veiseh, O., and Langer, R. (2015). Self-assembled hydrogels utilizing polymer–nanoparticle interactions. Nat. Commun. 6 (1), 6295. doi:10.1038/ncomms7295
Asenjo, J. A., and Andrews, B. A. (2011). Aqueous two-phase systems for protein separation: A perspective. J. Chromatogr. A 1218 (49), 8826–8835. doi:10.1016/j.chroma.2011.06.051
Bae, Y. C., Lambert, S. M., Soane, D. S., and Prausnitz, J. M. (1991). Cloud-point curves of polymer solutions from thermooptical measurements. Macromolecules 24 (15), 4403–4407. doi:10.1021/ma00015a024
Chen, Z., Lv, Z., Zhang, Z., Weitz, D. A., Zhang, H., Zhang, Y., et al. (2021). Advanced microfluidic devices for fabricating multi-structural hydrogel microsphere. Exploration 1 (3), 20210036. doi:10.1002/exp.20210036
Chertok, B., Webber, M. J., Succi, M. D., and Langer, R. (2013). Drug delivery interfaces in the 21st century: From science fiction ideas to viable technologies. Mol. Pharm. 10 (10), 3531–3543. doi:10.1021/mp4003283
Cross, L. M., Carrow, J. K., Ding, X., Singh, K. A., and Gaharwar, A. K. (2019). Sustained and prolonged delivery of protein therapeutics from two-dimensional nanosilicates. ACS Appl. Mater Interfaces 11 (7), 6741–6750. doi:10.1021/acsami.8b17733
Davis, R., Urbanowski, R. A., and Gaharwar, A. K. (2021). 2D layered nanomaterials for therapeutics delivery. Curr. Opin. Biomed. Eng. 20, 100319. doi:10.1016/j.cobme.2021.100319
Deo, K. A., Jaiswal, M. K., Abasi, S., Lokhande, G., Bhunia, S., Nguyen, T.-U., et al. (2022). Nanoengineered ink for designing 3D printable flexible bioelectronics. ACS Nano 16 (6), 8798–8811. doi:10.1021/acsnano.1c09386
Elbert, D. L. (2011). Liquid–liquid two-phase systems for the production of porous hydrogels and hydrogel microspheres for biomedical applications: A tutorial review. Acta Biomater. 7 (1), 31–56. doi:10.1016/j.actbio.2010.07.028
Esmanhoto, E., and Kilikian, B. V. (2004). ATPS applied to extraction of small molecules - polycetides - and simultaneous clarification of culture media with filamentous microorganisms. J. Chromatogr. B Anal. Technol. Biomed. Life Sci. 807 (1), 139–143. doi:10.1016/j.jchromb.2004.05.016
Flake, M. M., Nguyen, P. K., Scott, R. A., Vandiver, L. R., Willits, R. K., and Elbert, D. L. (2011). Poly(ethylene glycol) microparticles produced by precipitation polymerization in aqueous solution. Biomacromolecules 12 (3), 844–850. doi:10.1021/bm1011695
Friedlander, S. K., and Wang, C. S. (1966). The self-preserving particle size distribution for coagulation by brownian motion. J. Colloid Interface Sci. 22 (2), 126–132. doi:10.1016/0021-9797(66)90073-7
Gaharwar, A. K., Cross, L. M., Peak, C. W., Gold, K., Carrow, J. K., Brokesh, A., et al. (2019). 2D nanoclay for biomedical applications: Regenerative medicine, therapeutic delivery, and additive manufacturing. Adv. Mater. 31 (23), 1900332. doi:10.1002/adma.201900332
Ghassemi, Z., Ruesing, S., Leach, J. B., and Zustiak, S. P. (2021). Stability of proteins encapsulated in Michael-type addition polyethylene glycol hydrogels. Biotechnol. Bioeng. 118 (12), 4840–4853. doi:10.1002/bit.27949
Glyk, A., Scheper, T., and Beutel, S. (2015). PEG–salt aqueous two-phase systems: An attractive and versatile liquid–liquid extraction technology for the downstream processing of proteins and enzymes. Appl. Microbiol. Biotechnol. 99 (16), 6599–6616. doi:10.1007/s00253-015-6779-7
Gonçalves, M., Figueira, P., Maciel, D., Rodrigues, J., Qu, X., Liu, C., et al. (2014). pH-sensitive Laponite®/doxorubicin/alginate nanohybrids with improved anticancer efficacy. Acta Biomater. 10 (1), 300–307. doi:10.1016/j.actbio.2013.09.013
Gonçalves, M., Figueira, P., Maciel, D., Rodrigues, J., Shi, X., Tomás, H., et al. (2014). Antitumor efficacy of doxorubicin-loaded laponite/alginate hybrid hydrogels. Macromol. Biosci. 14 (1), 110–120. doi:10.1002/mabi.201300241
Heger, Z., Cernei, N., Kudr, J., Gumulec, J., Blazkova, I., Zitka, O., et al. (2013). A novel insight into the cardiotoxicity of antineoplastic drug doxorubicin. Int. J. Mol. Sci. 14 (11), 21629–21646. doi:10.3390/ijms141121629
Henise, J., Yao, B., Hearn, B. R., Schneider, E. L., Ashley, G. W., and Santi, D. V. (2020). High-throughput, aseptic production of injectable Tetra-PEG hydrogel microspheres for delivery of releasable covalently bound drugs. Eng. Rep. 2 (8), e12213. doi:10.1002/eng2.12213
Howell, D. W., Peak, C. W., Bayless, K. J., and Gaharwar, A. K. (2018). 2D nanosilicates loaded with proangiogenic factors stimulate endothelial sprouting. Adv. Biosyst. 2 (7), 1800092. doi:10.1002/adbi.201800092
Jain, E., Scott, K. M., Zustiak, S. P., and Sell, S. A. (2015). Fabrication of polyethylene glycol-based hydrogel microspheres through electrospraying. Macromol. Mater. Eng. 300 (8), 823–835. doi:10.1002/mame.201500058
Jansson, M., Belić, D., Forsman, J., and Skepö, M. (2020). Nanoplatelet interactions in the presence of multivalent ions: The effect of overcharging and stability. J. Colloid Interface Sci. 579, 573–581. doi:10.1016/j.jcis.2020.06.045
Jiang, T., Chen, G., Shi, X., and Guo, R. (2019). Hyaluronic acid-decorated Laponite(®) nanocomposites for targeted anticancer drug delivery. Polym. (Basel) 11 (1), 137. doi:10.3390/polym11010137
Jiang, W.-T., Tsai, Y., Wang, X., Tangen, H. J., Baker, J., Allen, L., et al. (2022). Sorption of acridine orange on non-swelling and swelling clay minerals. Crystals 12 (1), 118. doi:10.3390/cryst12010118
Khachani, M., Stealey, S., Dharmesh, E., Kader, M. S., Buckner, S. W., Jelliss, P. A., et al. (2022). Silicate clay-hydrogel nanoscale composites for sustained delivery of small molecules. ACS Appl. Nano Mater. 5, 18940–18954. doi:10.1021/acsanm.2c04721
King, W. J., Toepke, M. W., and Murphy, W. L. (2011). Facile formation of dynamic hydrogel microspheres for triggered growth factor delivery. Acta Biomater. 7 (3), 975–985. doi:10.1016/j.actbio.2010.10.026
Li, J., and Mooney, D. J. (2016). Designing hydrogels for controlled drug delivery. Nat. Rev. Mater. 1 (12), 16071. doi:10.1038/natrevmats.2016.71
Li, J., and Mooney, D. J. (2016). Designing hydrogels for controlled drug delivery. Nat. Rev. Mater 1 (12), 16071. doi:10.1038/natrevmats.2016.71
Liang, H.-C., Chang, W.-H., Lin, K.-J., and Sung, H.-W. (2003). Genipin-crosslinked gelatin microspheres as a drug carrier for intramuscular administration: In vitro and in vivo studies. J. Biomed. Mater. Res. Part A 65A (2), 271–282. doi:10.1002/jbm.a.10476
Lifshitz, I. M., and Slyozov, V. V. (1961). The kinetics of precipitation from supersaturated solid solutions. J. Phys. Chem. Solids 19 (1), 35–50. doi:10.1016/0022-3697(61)90054-3
Lv, G., Li, Z., Jiang, W.-T., Chang, P.-H., Jean, J.-S., and Lin, K.-H. (2011). Mechanism of acridine orange removal from water by low-charge swelling clays. Chem. Eng. J. 174 (2), 603–611. doi:10.1016/j.cej.2011.09.070
Mandal, A., Clegg, J. R., Anselmo, A. C., and Mitragotri, S. (2020). Hydrogels in the clinic. Bioeng. Transl. Med. 5 (2), e10158. doi:10.1002/btm2.10158
Mastiani, M., Firoozi, N., Petrozzi, N., Seo, S., and Kim, M. (2019). Polymer-salt aqueous two-phase system (ATPS) micro-droplets for cell encapsulation. Sci. Rep. 9 (1), 15561. doi:10.1038/s41598-019-51958-4
Mathias, E. V., Aponte, J., Kornfield, J. A., and Ba, Y. (2010). Properties of small molecular drug loading and diffusion in a fluorinated PEG hydrogel studied by 1H molecular diffusion NMR and 19F spin diffusion NMR. Colloid Polym. Sci. 288 (18), 1655–1663. doi:10.1007/s00396-010-2304-9
Mytnyk, S., Ziemecka, I., Olive, A. G. L., van der Meer, J. W. M., Totlani, K. A., Oldenhof, S., et al. (2017). Microcapsules with a permeable hydrogel shell and an aqueous core continuously produced in a 3D microdevice by all-aqueous microfluidics. RSC Adv. 7 (19), 11331–11337. doi:10.1039/c7ra00452d
Nichols, M. D., Scott, E. A., and Elbert, D. L. (2009). Factors affecting size and swelling of poly(ethylene glycol) microspheres formed in aqueous sodium sulfate solutions without surfactants. Biomaterials 30 (29), 5283–5291. doi:10.1016/j.biomaterials.2009.06.032
Peppas, N. A., Keys, K. B., Torres-Lugo, M., and Lowman, A. M. (1999). Poly(ethylene glycol)-containing hydrogels in drug delivery. J. Control. Release 62 (1), 81–87. doi:10.1016/s0168-3659(99)00027-9
Ritger, P. L., and Peppas, N. A. (1987). A simple equation for description of solute release I. Fickian and non-fickian release from non-swellable devices in the form of slabs, spheres, cylinders or discs. J. Control. Release 5, 23–36. doi:10.1016/0168-3659(87)90034-4
Roam, J. L., Nguyen, P. K., and Elbert, D. L. (2014). Controlled release and gradient formation of human glial-cell derived neurotrophic factor from heparinated poly(ethylene glycol) microsphere-based scaffolds. Biomaterials 35 (24), 6473–6481. doi:10.1016/j.biomaterials.2014.04.027
Roam, J. L., Xu, H., Nguyen, P. K., and Elbert, D. L. (2010). The formation of protein concentration gradients mediated by density differences of poly(ethylene glycol) microspheres. Biomaterials 31 (33), 8642–8650. doi:10.1016/j.biomaterials.2010.07.085
Roam, J. L., Yan, Y., Nguyen, P. K., Kinstlinger, I. S., Leuchter, M. K., Hunter, D. A., et al. (2015). A modular, plasmin-sensitive, clickable poly(ethylene glycol)-heparin-laminin microsphere system for establishing growth factor gradients in nerve guidance conduits. Biomaterials 72, 112–124. doi:10.1016/j.biomaterials.2015.08.054
Samimi Gharaie, S., Dabiri, S. M., and Akbari, M. (2018). Smart shear-thinning hydrogels as injectable drug delivery systems. Polymers 10, 1317. doi:10.3390/polym10121317
Schneider, C. A., Rasband, W. S., and Eliceiri, K. W. (2012). NIH image to ImageJ: 25 years of image analysis. Nat. Methods 9 (7), 671–675. doi:10.1038/nmeth.2089
Scott, R., and Kuntz Willits, R. (2011). “16 - future applications of injectable biomaterials: The use of microgels as modular injectable scaffolds,” in Injectable biomaterials. Editor B. Vernon (Sawston, Cambridge: Woodhead Publishing), 375–398.
Sheikhi, A., Afewerki, S., Oklu, R., Gaharwar, A. K., and Khademhosseini, A. (2018). Effect of ionic strength on shear-thinning nanoclay–polymer composite hydrogels. Biomaterials Sci. 6 (8), 2073–2083. doi:10.1039/c8bm00469b
Sheth, S., Stealey, S., Morgan, N. Y., and Zustiak, S. P. (2021). Microfluidic chip device for in situ mixing and fabrication of hydrogel microspheres via michael-type addition. Langmuir 37 (40), 11793–11803. doi:10.1021/acs.langmuir.1c01739
Stealey, S., Khachani, M., and Zustiak, S. P. (2022). Adsorption and sustained delivery of small molecules from nanosilicate hydrogel composites. Pharmaceuticals 15 (1), 56. doi:10.3390/ph15010056
Stealey, S. T., Gaharwar, A. K., Pozzi, N., and Zustiak, S. P. (2021). Development of nanosilicate–hydrogel composites for sustained delivery of charged biopharmaceutics. ACS Appl. Mater. Interfaces 13 (24), 27880–27894. doi:10.1021/acsami.1c05576
Tomás, H., Alves, C. S., Rodrigues, J., and Laponite®, (2018). A key nanoplatform for biomedical applications? Nanomedicine Nanotechnol. Biol. Med. 14 (7), 2407–2420. doi:10.1016/j.nano.2017.04.016
Vigata, M., Meinert, C., Hutmacher, D. W., and Bock, N. (2020). Hydrogels as drug delivery systems: A review of current characterization and evaluation techniques. Pharmaceutics 12 (12), 1188. doi:10.3390/pharmaceutics12121188
Wen, H., Jung, H., and Li, X. (2015). Drug delivery approaches in addressing clinical pharmacology-related issues: Opportunities and challenges. AAPS J. 17 (6), 1327–1340. doi:10.1208/s12248-015-9814-9
Wilson, S. A., Cross, L. M., Peak, C. W., and Gaharwar, A. K. (2017). Shear-thinning and thermo-reversible nanoengineered inks for 3D bioprinting. ACS Appl. Mater. Interfaces 9 (50), 43449–43458. doi:10.1021/acsami.7b13602
Yawalkar, A. N., Pawar, M. A., and Vavia, P. R. (2022). Microspheres for targeted drug delivery- A review on recent applications. J. Drug Deliv. Sci. Technol. 75, 103659. doi:10.1016/j.jddst.2022.103659
Yoo, J., and Won, Y.-Y. (2020). Phenomenology of the initial burst release of drugs from PLGA microparticles. ACS Biomaterials Sci. Eng. 6 (11), 6053–6062. doi:10.1021/acsbiomaterials.0c01228
Zhang, R., Xie, L., Wu, H., Yang, T., Zhang, Q., Tian, Y., et al. (2020). Alginate/laponite hydrogel microspheres co-encapsulating dental pulp stem cells and VEGF for endodontic regeneration. Acta Biomater. 113, 305–316. doi:10.1016/j.actbio.2020.07.012
Zhang, T., Zhang, H., Zhou, W., Jiang, K., Liu, C., Wang, R., et al. (2022). One-step generation and purification of cell-encapsulated hydrogel microsphere with an easily assembled microfluidic device. Front. Bioeng. Biotechnol. 9, 816089. doi:10.3389/fbioe.2021.816089
Zhao, Z., Wang, Z., Li, G., Cai, Z., Wu, J., Wang, L., et al. (2021). Injectable microfluidic hydrogel microspheres for cell and drug delivery. Adv. Funct. Mater. 31 (31), 2103339. doi:10.1002/adfm.202103339
Zustiak, S. P., Boukari, H., and Leach, J. B. (2010). Solute diffusion and interactions in cross-linked poly(ethylene glycol) hydrogels studied by Fluorescence Correlation Spectroscopy. Soft Matter 6 (15), 3609. doi:10.1039/c0sm00111b
Zustiak, S. P., and Leach, J. B. (2010). Hydrolytically degradable poly(ethylene glycol) hydrogel scaffolds with tunable degradation and mechanical properties. Biomacromolecules 11 (5), 1348–1357. doi:10.1021/bm100137q
Keywords: hydrogel, aqueous two-phase separation, drug delivery, laponite, nanosilicate
Citation: Dharmesh E, Stealey S, Salazar MA, Elbert D and Zustiak SP (2023) Nanosilicate-hydrogel microspheres formed by aqueous two-phase separation for sustained release of small molecules. Front. Front. Biomater. Sci. 2:1157554. doi: 10.3389/fbiom.2023.1157554
Received: 02 February 2023; Accepted: 21 March 2023;
Published: 18 April 2023.
Edited by:
Qun Wang, Iowa State University, United StatesReviewed by:
Ana Mora Boza, Georgia Institute of Technology, United StatesCopyright © 2023 Dharmesh, Stealey, Salazar, Elbert and Zustiak. This is an open-access article distributed under the terms of the Creative Commons Attribution License (CC BY). The use, distribution or reproduction in other forums is permitted, provided the original author(s) and the copyright owner(s) are credited and that the original publication in this journal is cited, in accordance with accepted academic practice. No use, distribution or reproduction is permitted which does not comply with these terms.
*Correspondence: Silviya Petrova Zustiak, c2lsdml5YS56dXN0aWFrQHNsdS5lZHU=
†These authors share first authorship
Disclaimer: All claims expressed in this article are solely those of the authors and do not necessarily represent those of their affiliated organizations, or those of the publisher, the editors and the reviewers. Any product that may be evaluated in this article or claim that may be made by its manufacturer is not guaranteed or endorsed by the publisher.
Research integrity at Frontiers
Learn more about the work of our research integrity team to safeguard the quality of each article we publish.