- 1School of Public Health and Preventative Medicine, Monash University, Melbourne, VIC, Australia
- 2Cardio-Respiratory Engineering and Technology Laboratory, Department of Mechanical and Aerospace Engineering, Monash University, Melbourne, VIC, Australia
- 3Department of Cardiology – Alfred Health, Melbourne, VIC, Australia
- 4Centre for Biomedical Technologies, Queensland University of Technology, Brisbane, QLD, Australia
- 5Cardiology and Therapeutics Division, Baker Heart and Diabetes Institute, Melbourne, VIC, Australia
- 6School of Medicine, Monash University, Melbourne, VIC, Australia
An aging population and an increasing incidence of cardiovascular risk factors form the basis for a global rising prevalence of valvular heart disease (VHD). Research to further our understanding of the pathophysiology of VHD is often confined to the clinical setting. However, in recent years, sophisticated computational models of the cardiovascular system have been increasingly used to investigate a variety of VHD states. Computational modelling provides new opportunities to gain insights into pathophysiological processes that may otherwise be difficult, or even impossible, to attain in human or animal studies. Simulations of co-existing cardiac pathologies, such as heart failure, atrial fibrillation, and mixed valvular disease, have unveiled new insights that can inform clinical research and practice. More recently, advancements have been made in using models for making patient-specific diagnostic predictions. This review showcases valuable insights gained from computational studies on VHD and their clinical implications.
1 Introduction
Valvular heart disease (VHD) is an is an evolving epidemic of an aging population, affecting more the 10% of individuals over the age of 75 (Nkomo et al., 2006). Despite substantial therapeutic advances, it remains a major cause of morbidity and mortality (d'Arcy et al., 2011). Aging, improved cardiovascular survival, and increasing incidence of risk factors such as hypertension, diabetes, and chronic kidney disease, are key drivers for the rising global prevalence of VHD (Coffey et al., 2021). Clinical outcomes are poor when VHD is complicated by other cardiac pathologies, such as adverse cardiac remodelling leading to heart failure or atrial fibrillation (Baumgartner et al., 2017; Alassar et al., 2013; Samaras et al., 2021). As such, early detection and optimizing treatment strategies for patients is paramount.
Investigating the haemodynamic mechanisms of VHD has traditionally been confined to select clinical or animal studies. Studying valvulopathy in the clinical setting has its inherent challenges, including the limited ability to measure or manipulate variables, the need for invasive cardiac measurements, natural physiological intra-patient variability (for example, heart rate or blood pressure) and interpatient heterogeneity due to biological differences (such as age, height, and weight). Furthermore, changing disease patterns, such as mixed and multivalvular pathology, and co-existing cardiac pathology such as heart failure further complicate diagnostic evaluation and clinical decision-making.
With the increasing prevalence of VHD and the continuous evolution of treatment options, gaining a deeper understanding of its pathophysiology and natural progression has never been more crucial. For this reason, expanding the armament of research methods to investigate VHD is essential. Computational models of the cardiovascular system are powerful tools to further our understanding of cardiovascular physiology and disease processes and how they may relate to novel therapies (see Figure 1). Such models allow for the creation of detailed virtual representations of cardiovascular structures and functions, which can be manipulated to simulate various physiological states and conditions (Formaggia et al., 2009). This capability provides the means to unveil key mechanistic insights underlying cardiovascular diseases and offers a platform for testing potential therapeutic interventions in a controlled and reproducible manner. Furthermore, computational models overcome the limitations posed by the invasive nature of certain clinical measurements and the inherent variability among patients. By enabling the simulation of a wide range of scenarios and conditions, these models enhance our ability to predict disease progression and treatment outcomes, ultimately informing the development of more effective and targeted therapeutic strategies.
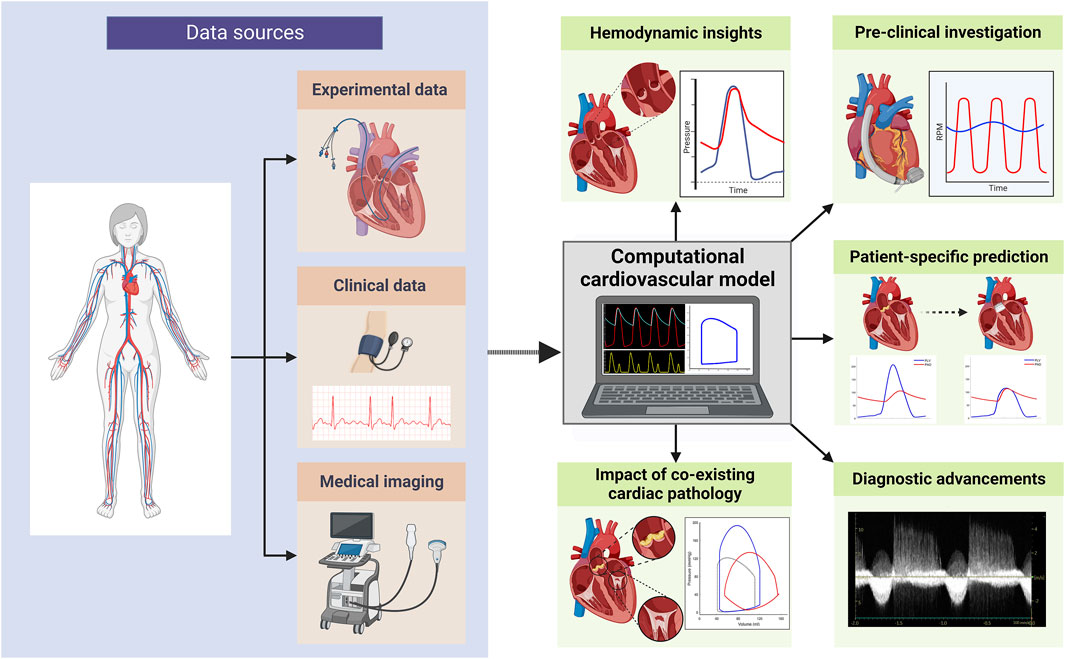
Figure 1. Overview of computational cardiovascular modelling applications in valvular heart disease research (created with BioRender.com).
In the simulation of VHD, a comprehensive understanding of the effects of valvular pathology on global cardiovascular haemodynamics within a closed-loop model of the cardiovascular system model can only be achieved through the application of lumped parameter computational modelling (LPM). This method allows for the integration of complex cardiovascular dynamics, including the interactions between the heart chambers, valves, and vasculature. By doing so, it provides a detailed representation of key haemodynamic parameters, including pressure, flow, and volume, within a simplified yet robust framework. This approach offers invaluable insights into the haemodynamic effects of valvular dysfunction, facilitating the prediction of disease progression and assessing potential therapeutic interventions. Furthermore, LPM bridges the gap between clinical observations and theoretical predictions, thereby improving our capacity to diagnose, manage, and treat VHD more effectively.
In this narrative review, we aim to introduce non-experts to the innovative field of computational cardiovascular modelling and its emerging role in VHD research. By elucidating the fundamental principles and showcasing illustrative examples, our goal is to foster a broader appreciation and understanding of computational modelling of VHD. In doing so, we aim to highlight the exciting possibilities and practical applications that computational cardiovascular modelling presents, thereby inspiring further interest and engagement from a diverse audience.
2 Concepts in cardiovascular modelling
2.1 Mathematical modelling
Mathematical models describe a real-world process in mathematical terms typically through a set of variables and equations. These models are the cornerstone for fields such as physics and engineering, describing natural phenomena such as energy transfer, electromagnetism, and gravity. Physiology, in contrast, is less easily reduced to mathematical equations. This is primarily due to the complexity and variability of biological processes which makes them inherently non-linear, multi-disciplinary, and multi-scaled (Pathmanathan and Gray, 2018). Nevertheless, the use of modelling has led to great advancements in the understanding of cardiovascular physiology and the practice of cardiology. Indeed, many of these are based on well-established physics-based models and principles, having been either directly applied or adapted for use in a biological context. Some notable examples include Hagen–Poiseuille’s law for understanding the relationship between pressure, fluidic resistance, and flow rate, and the Bernoulli principle for describing the pressure drop occurring with increased velocity of blood flow (Formaggia et al., 2009; Hopkins et al., 1991; Sagawa et al., 1973).
Mathematical models of cardiac chamber contractility, transvalvular flow, and flow through vascular compartments have been developed and sequentially integrated to form a closed-loop model of the cardiovascular system (see Figure 2) (Sagawa et al., 1973; Chung et al., 1997; Ursino et al., 1994; Morris et al., 2016). This system-based modelling approach allows for a multitude of physiological and haemodynamic processes, and their interdependencies, to be simultaneously represented. With this approach, the simulation of a variety of disease states is possible. These complex multi-compartment cardiovascular models typically require computer-based methods to execute the model and generate results, such is the reason they are also referred to as computational models.
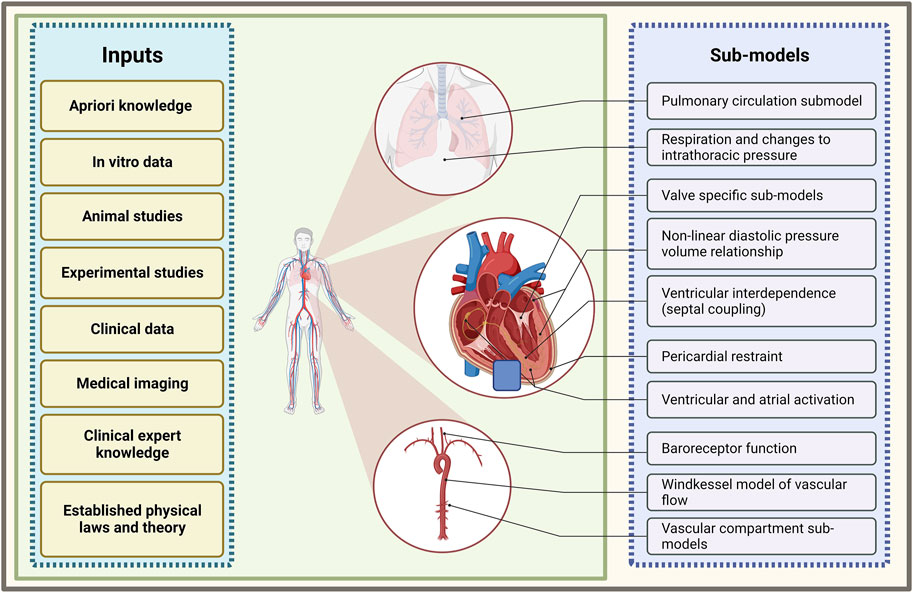
Figure 2. Summary of sub-model components of a closed-loop cardiovascular system model and the inputs which inform their development. Illustration of frequently used models of various cardiovascular processes that are combined to form a multi-compartmental model of a closed-loop cardiovascular system (created with BioRender.com).
2.2 Reduced-dimensional modelling
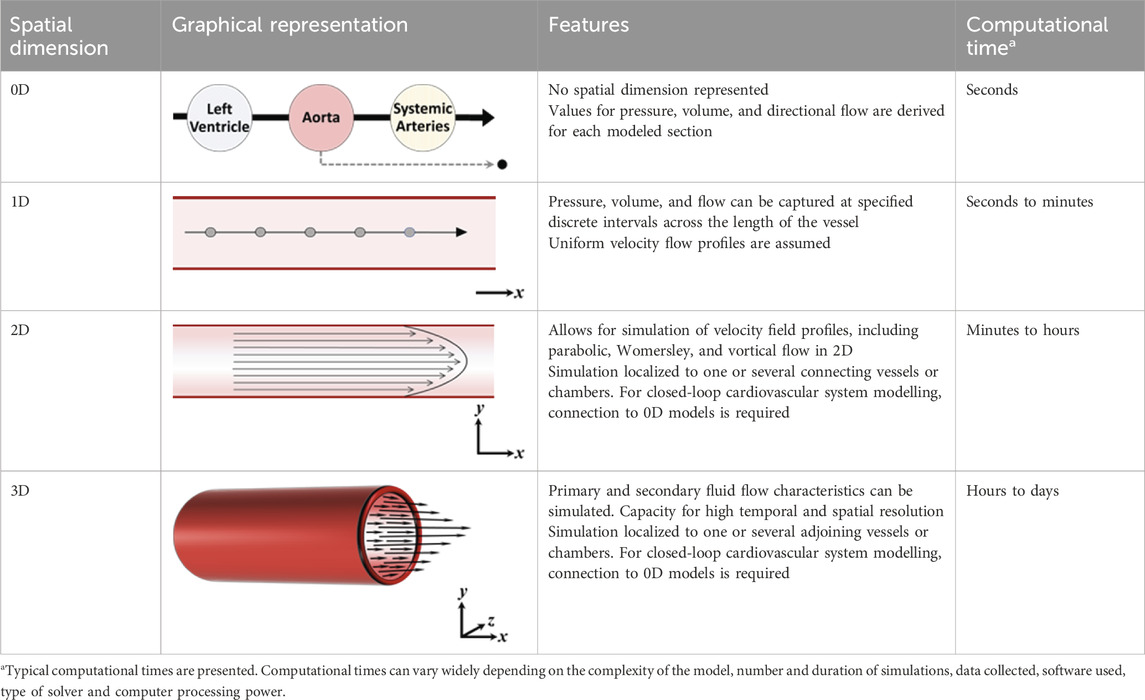
In order to effectively model the whole heart and cardiovascular system in unison, each component needs to be simplified with respect to its temporal and spatial representation. The spatial dimensionality of cardiovascular models varies depending on their intended use and application, ranging from zero-dimensional (0D) to three-dimensional (3D) (see Table 1) (Morris et al., 2016). Three-dimensional models, such as those used in computational fluid dynamics, can reveal intricate local fluid flow patterns, such as flow vortices within the left ventricle. Conversely, reduced-dimensional models eliminate spatial dimensionality entirely (0D) or represent one (1D) or two spatial planes (2D). Depending on the model’s purpose, this reduction can translate to decreased computational time without sacrificing accuracy. In reduced-dimensional models, the mathematical representation of cardiovascular components is often lumped together and is known as lumped-parameter modelling - for example, the segments of the aorta may be collectively represented as one whole compartment.
The Windkessel model, first described by German Physiologist Otto Frank in 1899 (Frank, 1899), is the most commonly used LPM model to simulate the flow of blood in a vessel or heart chamber. Over the years, improvements to the Windkessel model have led to more accurate representations of physiological pressure and flow waveforms. In the original two-element Windkessel model, resistance and compliance are used simulate flow through a vessel. This evolved to the three-element Windkessel, where an additional resistance value was included to model the impedance imposed by the vessel itself. The effect of inertia to blood flow was accounted for in a four-element model. Finally, the five-element model splits compliance into two components separated by an inertance, to create a more realistic representation of the effect of vessel impedance and compliance (Toy et al., 1985) (see Figure 3).

Figure 3. (A) Classic two-element Windkessel model; (B) three-element Windkessel model; (C) four-element Windkessel model and (D) five-element Windkessel model. R is peripheral resistance, ZC is characteristic impedance, L is inertance, C is arterial compliance and C1 + C2 = arterial compliance in the five-element model. (Figure adapted from Zhou et al. (2019)).
LPMs forming a closed loop model of the cardiovascular system are typically represented by an electrical or hydraulic circuit schematic (Figure 4). The flow of blood is pressure-driven between compartments, where a compartment comprises of elements of resistance, compliance and inertance to blood flow. Flow in and out of the compartments are a function of parameters, primarily pressure and volume, of the adjacent or connecting compartments or chambers. Ventricular and atrial contraction are the drivers that advances the flow of blood through the circuit; time-varying elastance functions (Sagawa et al., 1973; Defares et al., 1963) are most commonly implemented to recreate ventricular and atrial contraction. As the model becomes more advanced, additional components and functions that account for heart chamber interactions, pericardial influence, and neuro-auto-regulatory mechanisms, such as the baroreflex, and the interaction with the respiratory system may be included.
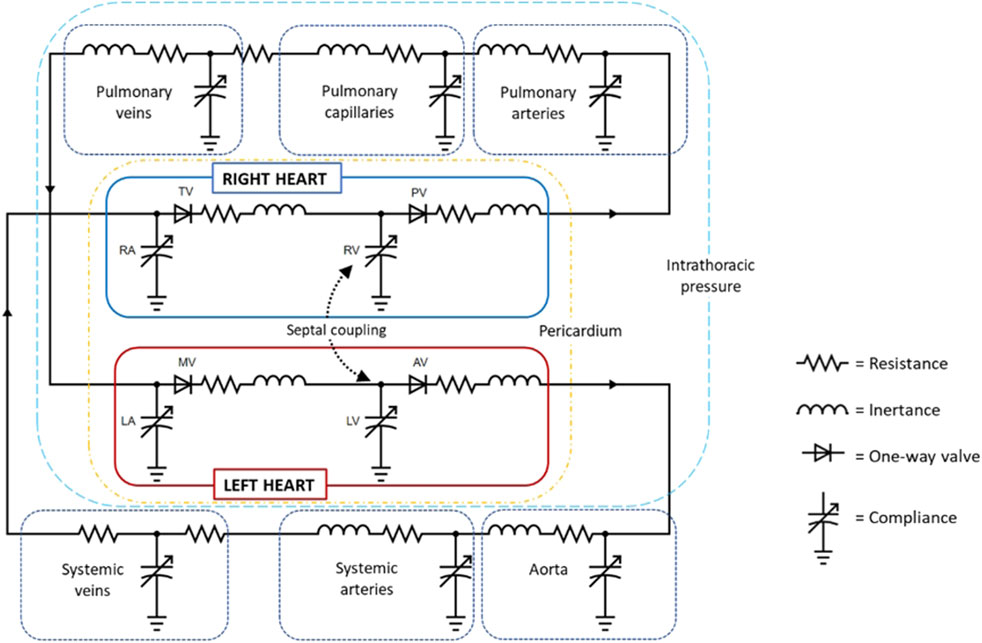
Figure 4. Circuit diagram of a closed-loop cardiovascular system model (created with circuit-diagram.org). Abbreviations: AV, aortic valve; LA, left atrium; LV, left ventricle; MV, mitral valve; PV, pulmonary valve; RA, right atrium; RV, right ventricle; TV, tricuspid valve.
2.3 Current approaches to modelling heart valves and valvular disease
Accurate modelling of heart valves and valvular diseases is crucial for understanding and predicting the heart’s haemodynamic behavior. Approaches to modelling heart valves is varied in the literature and will largely depend on the intended purpose of the cardiovascular model. This section describes the current reduced-dimensional approaches in modelling heart valves and valvulopathy, focusing on common mathematical representations to describe pressure-driven flow.
The most common mathematical representation of a heart valve is by a unidirectional flow function, commonly expressed as a diode connected to a compliance element. Forward flow occurs as a function of the pressure differential between the two adjoining compartments and a resistance value assigned to the valve. In the open state, a normal healthy valve imposes minimal or no resistance to forward transvalvular flow, so parameters for resistance are typically very low, for example, 0.01 mmHg/L/minute (Frank and Hoppensteadt, 2002), or may be absent altogether. The diode representation of the heart valve is one of an ideal valve, where pressure differential mediated opening and closure of the valve is instantaneous. Thus, the valve exists in only two states, fully open or fully closed. As a consequence, pressure, and flow wave-form morphologies will often contain abrupt or non-smooth transitions, particularly at the point of valve opening and closure.
Valve models that are created based on the principle of the conservation of mass and energy, allow for the simulation of non-linear resistance, and provide an accurate portrayal of the relationship between orifice area and pressure gradient. In a 1985 study, Donovan modeled the aortic valve with non-linear resistance, in which flow through the valve was a function of the density of the fluid, an ascribed discharge coefficient, the diameter of the opening orifice, and the volumetric flow rate (Donovan and Sauer, 1985). In the past 20 years, advancements have been made in modelling the dynamic nature of valve opening and closure. A model incorporating a dynamic mitral valve opening area was developed by Szabó et al. (Szabo et al., 2004). In their study, a linear second-order differential equation described valve area opening as a function of changes to pressure and flow where viscous and inertial forces are represented as constants. The authors demonstrated physiologically accurate transmitral flow waveforms for a normal valve and a mechanical prosthetic valve. Korakianitis and Shi described a dynamic valve model based on differential equations incorporating the effect of pressure, flow, and friction on the opening and closing of valve leaflets (Korakianitis and Shi, 2006a; Korakianitis and Shi, 2006b). Valve orifice area is determined by leaflet angular displacement, represented by a cosine function, which is dependent on the pressure exerted on the leaflets. The frictional effects imposed by the leaflet on blood flow are assumed to be proportional to the leaflet’s angular velocity. Herein, the modelling of valvular stenosis can be performed by limiting the maximal opening angle of the leaflets. Likewise, regurgitation can be modeled by increasing the minimum valve closing angle, thereby leaving clearance for flow reversal during diastole (Korakianitis and Shi, 2006a). However, a study that used this approach to simulate valvulopathy according to disease grading (Scarsoglio et al., 2016), produced haemodynamics measures that varied in their agreement with the severity ranges indicated by clinical guidelines. In aortic stenosis (AS), the transvalvular mean pressure gradient is a standard measure of grading severity, primarily determined by the aortic valve area and transvalvular flow rate. Typically, a mean pressure gradient of less than 20 mmHg indicates mild AS, 20–40 mmHg indicates moderate AS, and greater than 40 mmHg indicates severe AS (Baumgartner et al., 2009). In this study, increasing AS severity was achieved through creating valve areas of 2.0 cm2 (mild), 1.2 cm2 (moderate), and 0.9 cm2 (severe), which yielded mean pressure gradient gradients of 26, 54, and 87 mmHg, respectively. These values are higher than what would be expected clinically for these valve areas. Conversely, the simulation of mitral stenosis (MS) produced MPGs that aligned well with clinical guidelines. However, in the simulation of mitral regurgitation (MR), modeled regurgitant orifice areas for mild and moderate MR resulted in regurgitant volumes of 34 and 64 mL, respectively, which corresponds to moderate and severe MR according to clinical guidelines (Lancellotti et al., 2010).
Recently, the simulation of valvulopathy has been performed using an object-oriented modelling approach (Šeman et al., 2023). Here, the modelling of physical systems in an in silico environment is achieved using equation-based elements and mathematical operations that represent a physical component (The MathWorks, 2022). These components are usually presented as a graphical or textual icon and can be connected to each other to form the system under design (Kulhánek et al., 2014). Modelling-based environments such as Modelica (Ježek et al., 2017; Moza et al., 2017) and Simscape-Matlab (de Canete et al., 2013; King et al., 2018; Rosalia et al., 2021; King et al., 2019) have been previously used to model a closed-loop cardiovascular system. In the Simscape environment, component valves comprise of mathematical equations based on the continuity of mass and energy that describe valve function and the pressure and flow dynamics of fluid through the valve (King et al., 2019; The MathWorks Inc, 2020). Within these environments, a vast range of physical properties of components can be specified, including the dimensions of compliant pipes, opening and regurgitant orifice areas for valves, and fluid viscosity and density (The MathWorks Inc, 2020).
3 Modelling-based research in valvular heart disease
Computational modelling has enormous potential to significantly advance the understanding, diagnosis, and treatment of VHD. A key strength of cardiovascular modelling research is the ability to investigate specific conditions with great controllability and reproducibility, including the acquisition of precise data for a wide variety of parameters. This allows for tailored simulation of clinical scenarios and precise quantitation of the effects of variables of interest.
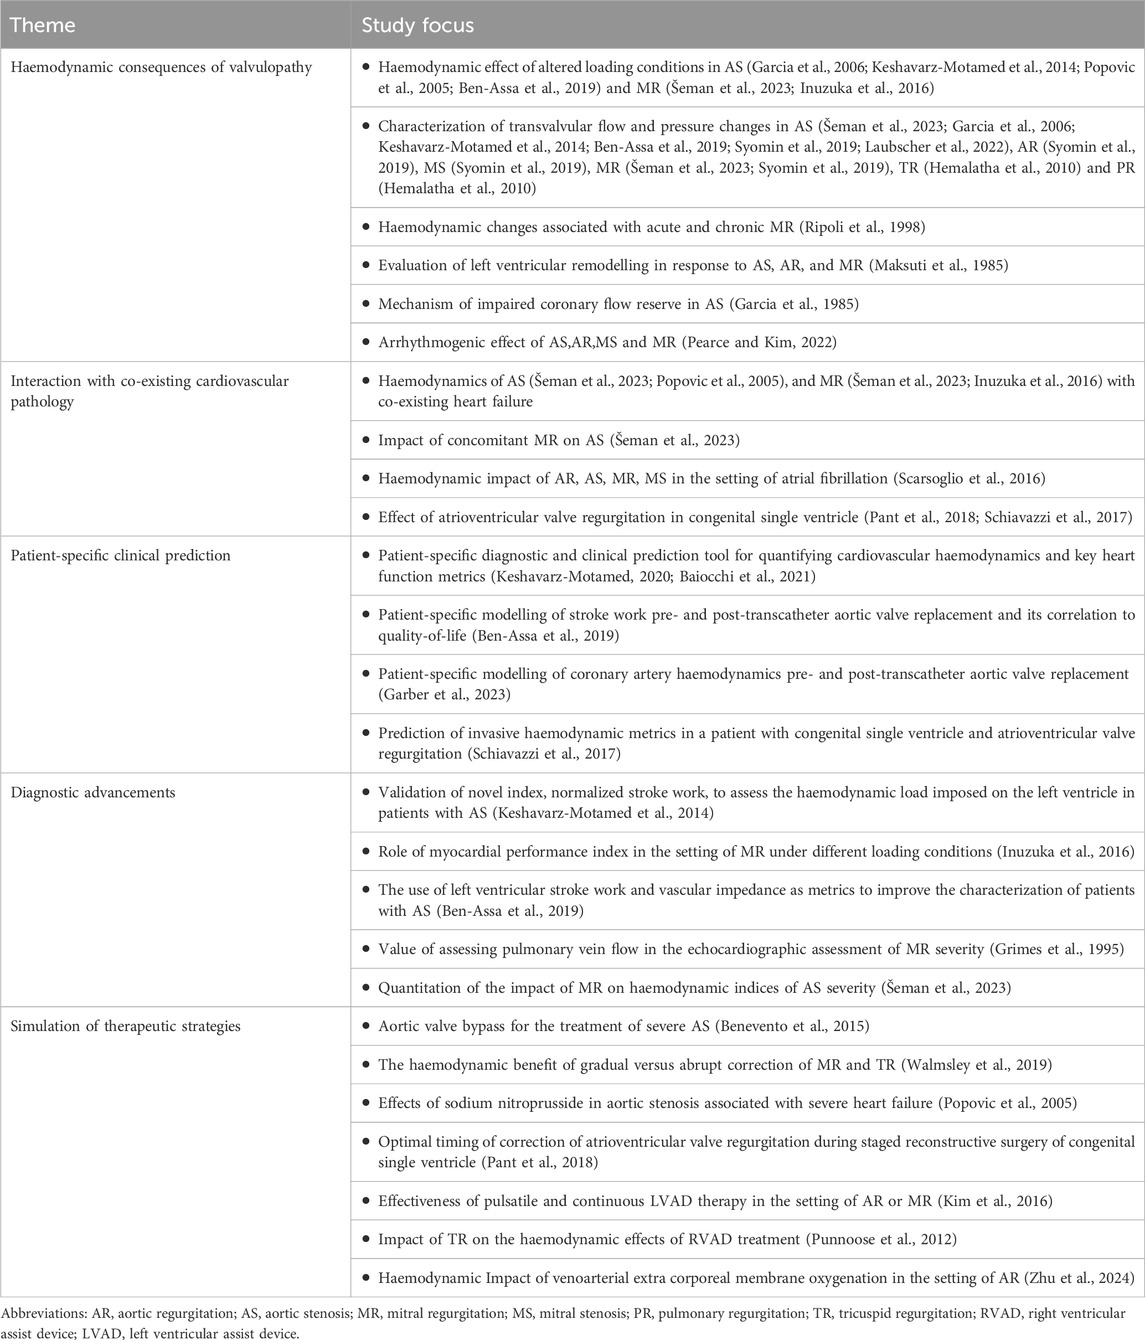
This section of the review showcases studies that utilized lumped-parameter computational models of the cardiovascular system to unveil clinical insights into VHD. High-dimensional modelling studies, including structural finite element analysis, computational fluid dynamics, and fluid–structure interaction, will not be discussed and have been previously outlined elsewhere (Toma et al., 2022). A summary of key modelling-based VHD studies is presented in Table 2.
3.1 Haemodynamic insights into the progression of valvular heart disease
VHD is inherently progressive in nature. Valvular stenosis or regurgitation disrupts normal haemodynamics, resulting in increased cardiac pressures and workload. Over time, this can lead to ventricular dysfunction, and the development of symptoms such as shortness of breath, fatigue, chest pain, and syncope. These symptoms significantly impact quality of life and often indicate the necessity for medical or surgical intervention for the alleviation of symptoms and prevention of further deterioration.
Understanding the variables that underpin disease progression is crucial for assessing the severity and potential outcomes of VHD. In silico experimentation using cardiovascular models allows for the investigation of VHD under highly controlled and repeatable conditions. With this approach, the continuum of valvular stenosis and regurgitation can be simulated, and a wide array of haemodynamics can be measured with high precision.
In a study by Garcia and colleagues (Garcia et al., 2006), AS with increasing severity was simulated using a LPM, and the relationship between aortic valve area and left ventricular (LV) stroke work was quantified. In their study, LV stroke work was shown to remain relatively stable in the ranges of mild and moderately severe AS. As the aortic valve area reduced below <1.0 cm2, small decreases in effective orifice area induced drastic increases in LV stroke work. Indeed, this orifice area corresponds to the approximate turning point in which patients experience the onset of symptoms and mortality risk rises significantly (Mehrotra et al., 2018). In the same study, the authors showed increasing grades of hypertension resulted in a quasi-linear increase in LV stroke work (Garcia et al., 2006). As such, hypertension was highlighted as a potentially important contributor to the discordance commonly seen between patients’ imaging derived AS severity, their onset of symptoms, and the extent of symptoms.
The presence of impaired coronary flow reserve in patients with severe AS is associated with an increased risk of myocardial ischemia symptoms, LV dysfunction, and sudden death. (Michail et al., 2018). To investigate the complex interplay between coronary flow reserve and AS, a sophisticated LPM of the cardiovascular system that incorporated coronary inflow was employed to simulate progressive AS (Garcia et al., 1985). Simulated coronary flow waveforms were found to be comparable to those reported in the literature for healthy valves and AS. The results revealed a discernible correlation between the progressive AS severity and a decrease in coronary flow reserve. At valve areas of 1.0 cm2 and below coronary flow reserve decreased markedly. For example, compared to no AS with a valve area of 4.0 cm2, valve areas of 1.0 cm2 and 0.5 cm2 were associated with approximate 25 and 50 percent reductions in coronary flow reserve, respectively. The reductions in coronary flow reserve were explained in large part by i) a decrease in coronary perfusion pressure leading to reduced myocardial supply, ii) decreased diastolic duration, and iii) increased myocardial metabolic demand associated with increased LV workload. Given the adverse outcomes associated with a very low coronary flow reserve, the authors expressed that their findings provide some support in favor of raising the level of indication for aortic valve replacement in asymptomatic cases of very severe AS (Vmax ≥ 5 m/s or mean transaortic pressure gradient ≥60 mmHg), which at the time of publication was a class 2b indication (Bonow et al., 2008), and has since increased to a class 2a indication (Otto et al., 2020).
3.2 Impact of co-existing cardiovascular disease
In patients with VHD, the presence of co-existing cardiac diseases, such as heart failure or atrial fibrillation are frequently found. Despite extensive study, pathophysiologic interactions between valvulopathy and co-existing cardiac disease remain incompletely defined. Modelling-based studies enable the investigation of the contributory role of additional cardiac pathologies in the continuum of specific valvulopathy, and vice versa, thus facilitating a more comprehensive understanding of the complex interplay of the key factors at play.
Mixed and multiple valvular diseases are also a frequent occurrence in clinical practice, however, there are limited studies investigating the adverse haemodynamics of such states and its implications on clinical outcomes. The impact of concomitant MR on AS haemodynamics was investigated using a LPM and echocardiographic data from a large cohort of patients with AS (Šeman et al., 2023). Figure 5 shows simulated LV and aortic pressure waveforms and for progressively worsening MR (mild, moderate, and severe) in the setting of severe AS with an aortic valve area 1.0 cm2. For severe AS, simulations showed that compared to isolated AS, the presence of mild, moderate, and severe MR was associated with transaortic mean pressure gradient reductions of 10%, 29%, and 40%, respectively. These results when then used to calculate an adjusted mean pressure gradient in a cohort of 1427 patients with severe AS, based on MR severity. The authors found that co-existing MR, even if mild, was a significant contributor to echocardiographic discordance between aortic valve area and mean pressure gradient. And of patients with low-gradient AS and concomitant MR, half would reclassify as high-gradient AS based on their adjusted-mean pressure gradient. The authors highlighted the risk of underestimating AS severity in patient with concomitant MR and discussed the potential benefits of an adjusted mean pressure gradient, based on careful MR quantitation. This approach could be especially important for patients demonstrating echocardiographic discordance or borderline severe AS, as it may provide a more accurate assessment of the true AS severity in the presence of confounding MR.
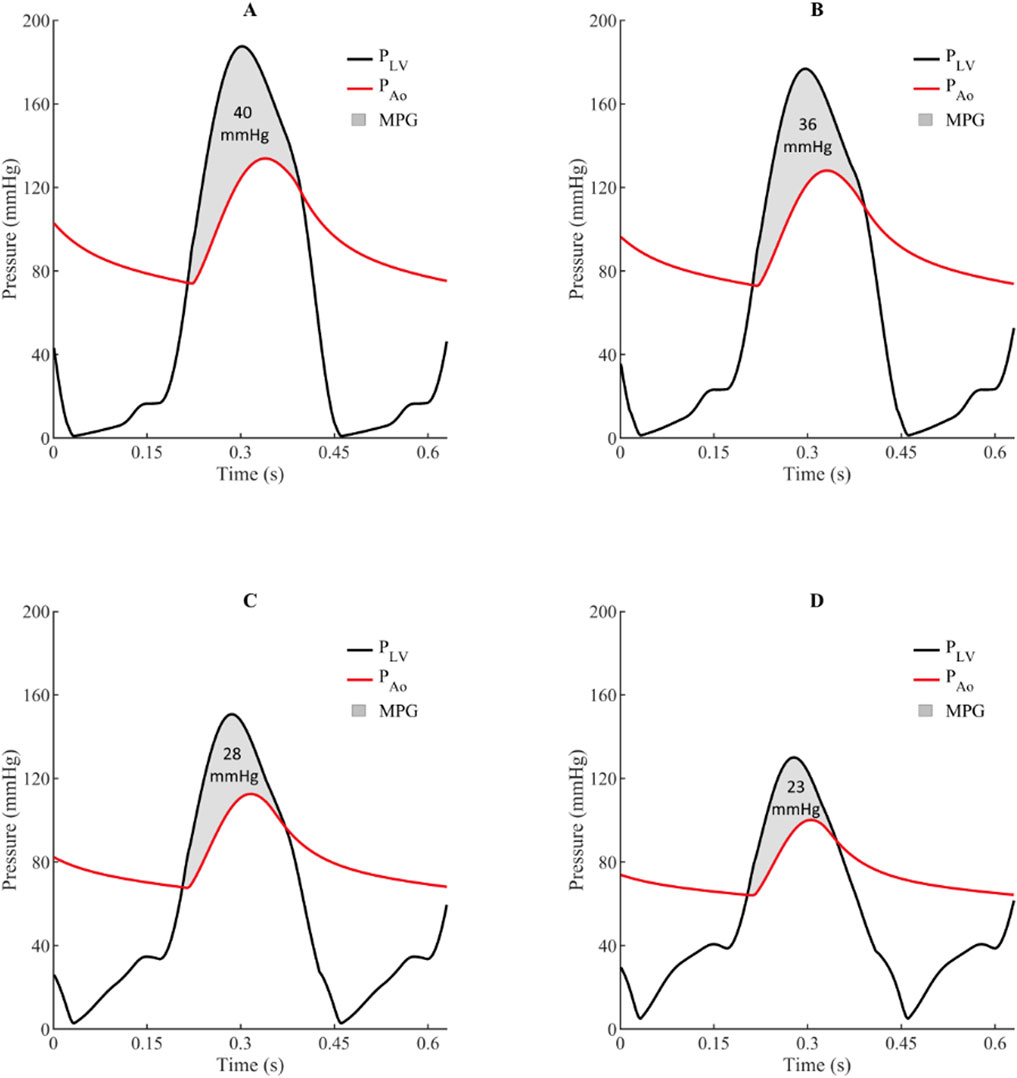
Figure 5. Simulated impact of concomitant mitral regurgitation on left ventricle and aortic pressures waves and mean pressure gradient for aortic stenosis (aortic valve area = 1.0 cm2).21 (A) = Isolated aortic stenosis, (B) = Aortic stenosis with mild mitral regurgitation, (C) = Aortic stenosis with moderate mitral regurgitation, and (D) = Aortic stenosis with severe mitral regurgitation. MPG indicates transaortic mean pressure gradient; PAo, aortic pressure; and PLV, left ventricular pressure.
3.3 Improved diagnostic evaluation
Mathematical modelling has recently made inroads as tool for optimizing the diagnostic evaluation of VHD. An example of such a study is the paper by Keshavarz-Motamed et al., which introduced a new metric for evaluating AS severity ‘normalized stroke work’ (Keshavarz-Motamed et al., 2014), This index is calculated by dividing the estimated LV stroke work by the stroke volume and represents the global haemodynamic load faced by the LV to eject a unit volume of blood (see Figure 6). In the study, a LPM was informed by patient-specific data from cardiac imaging to estimate their normalized stroke work. The authors found normalized stroke work to be highly correlative to effective orifice area and largely independent from variations in flow rate. The authors highlighted the potential diagnostic and prognostic value of this novel index if added to current standard indices of AS severity, for the evaluation of low-flow AS states, where the determination of severity is challenging.
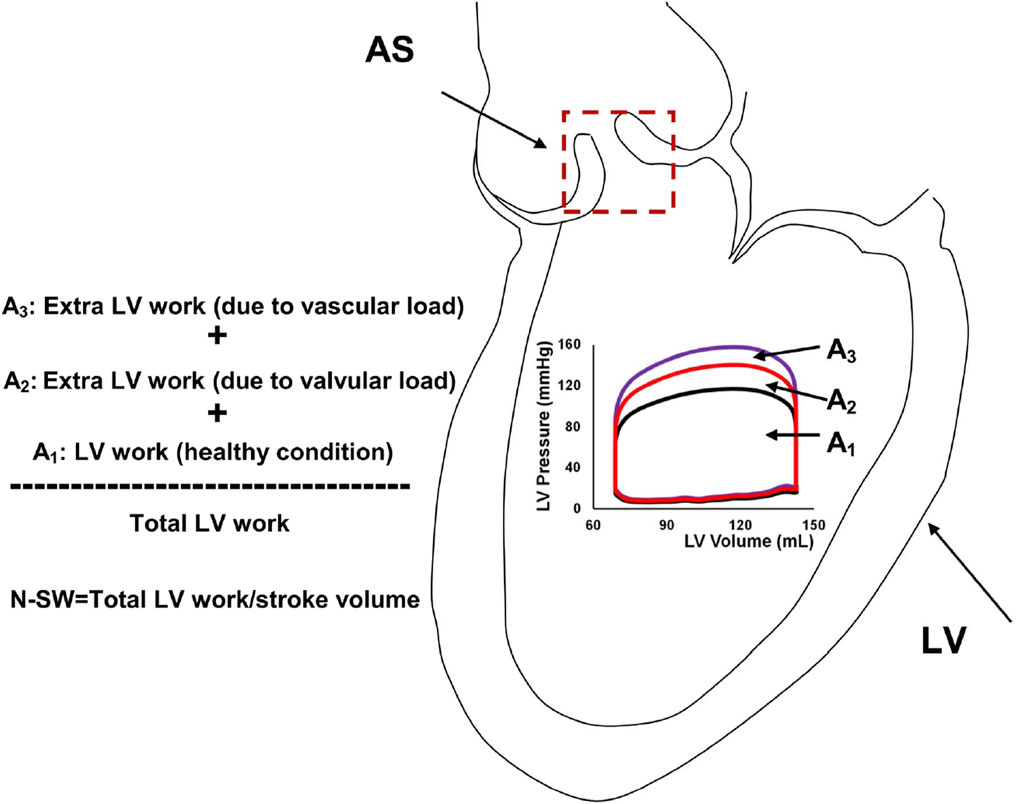
Figure 6. Schematic of left ventricular stroke work and normalized-stroke work in aortic stenosis. AS, aortic stenosis, LV, left ventricle; N-SW, normalized-stroke work. (Figure taken from Keshavarz-Motamed et al. (2014)).
Inuzuka and colleagues modeled the effect of heart failure and MR on the myocardial performance index (MPI) (Inuzuka et al., 2016). Also known as the Tei index, the MPI is a doppler-derived measure for global ventricular function which is calculated using isovolumic and ejection times. In the simulated progression of heart failure and MR, the authors showed paradoxical improvements in the MPI with worsening disease. The combination of volume overload, reduced arterial compliance, and restricted LV filling, led to a marked overestimation of LV performance, despite reduced LV contractility and elevated end-diastolic pressure. The authors highlighted due consideration of these haemodynamic confounders when using the MPI as a measure of cardiac function in clinical assessment.
3.4 Education and training
Over the last 2 decades, there has been a gradual emergence of cardiovascular modelling tools for educational purposes. These models, which have strong foundations in demonstrating normal physiological processes to users, have evolved to simulate a variety of different cardiac pathologies, including VHD. Cardiovascular models such as Harvi-Online (Burkhoff and Schleicher), CircAdapt (Arts et al., 2005), and CVSim (Heldt et al., 2010) have emerged that allow users to simulate a variety of different cardiac pathologies, including VHD, and visualize an array of cardiovascular haemodynamics in real time. These educational tools provide an interactive platform for learning the key principles of cardiovascular physiology and pathophysiology, which may be limited to acquire in other media, such as textbooks. For students, educators, and clinicians to take full advantage of these tools in the future, it is important to make them easily accessible and user-friendly.
3.5 Pre-clinical investigation and hypothesis generation
Cardiovascular modelling has been used to study the complex behavior of the cardiovascular system under different conditions and interventions, which would otherwise be very challenging or prohibitive to perform on animals or humans. Additionally, modelling can help clinical researchers design more efficient and effective experimental protocols, and to identify the most crucial variables to investigate. The role of novel surgical techniques and exploring strategies for optimally delivering mechanical circulatory support to patients with VHD are just some of the areas being explored with modelling approaches.
For patients with severe AS in whom valve replacement is contraindicated, the use of aortic valve bypass is previously proposed surgical procedure surgical procedure for the relief of left ventricular outflow tract obstruction (Gammie et al., 2008). An effective double outlet ventricle is created, whereby the LV outflow conduit is connected to the descending aorta (Figure 7). In simulations of severe AS, aortic valve bypass resulted in significant reductions in LV stroke work, transvalvular pressure gradient, and LV end-diastolic pressures (Benevento et al., 2015). These results indicate aortic valve bypass to be a potentially viable solution for patients with severe AS and who are contraindicated to both surgical or transcatheter aortic valve replacement.
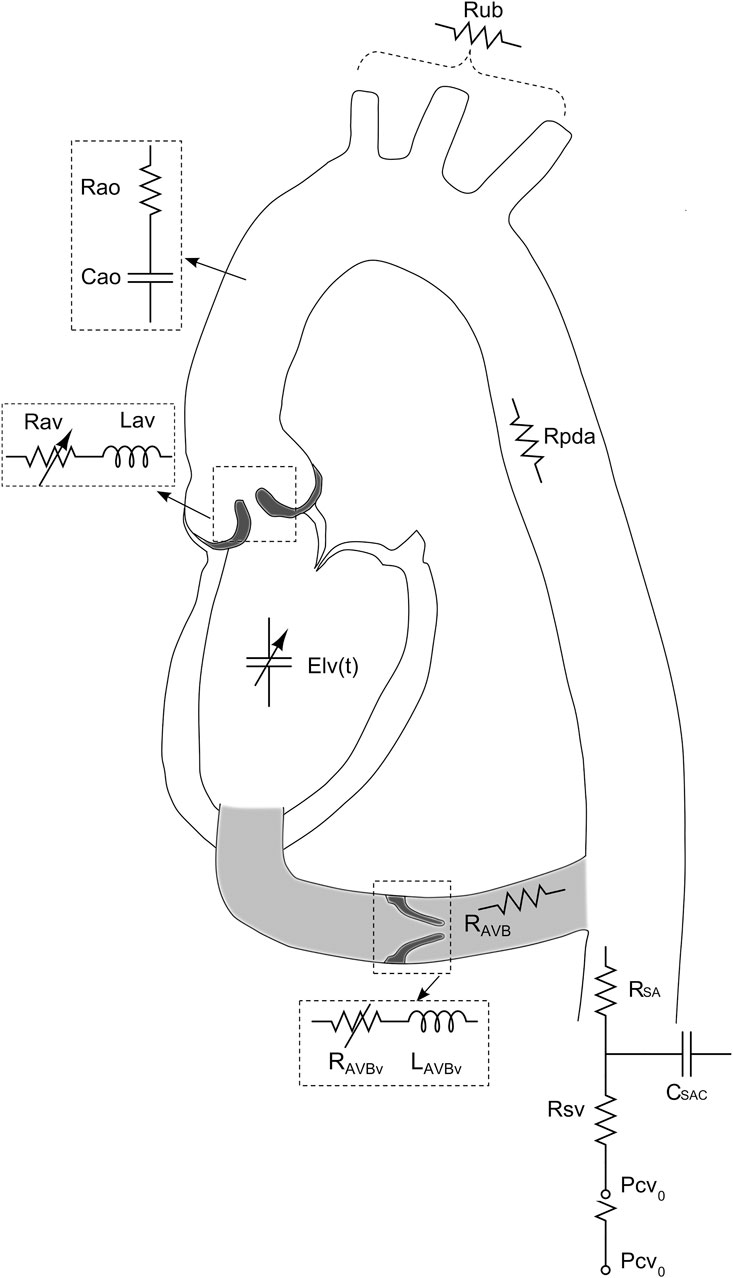
Figure 7. Schematic representation of the lumped parameter model used to simulate left-sided heart in presence of aortic stenosis and/or left ventricular-aortic conduit. (Figure adapted from Benevento et al. (2015)).
Deterioration of LV function post mitral valve surgery for chronic MR is a common complication that portends worse clinical outcomes (Quintana et al., 2014). Walmsley et al. hypothesized that the abrupt change to ventricular loading conditions following valve replacement is a key contributor to postoperative ventricular dysfunction (Walmsley et al., 2019). To investigate this hypothesis, the authors used a cardiovascular model to compare the effects of abrupt and gradual correction of mitral and tricuspid regurgitation on cardiac function. Results showed that simulated surgical correction of tricuspid regurgitation (TR) and MR resulted in a sudden spike of ventricular stress that could exacerbate post-operative myocardial depression. On the other hand, no spike was observed in the simulation of gradual correction of TR and MR. The authors proposed a potential future role for strategies that gradually correct valve regurgitation, to reduce ventricular overload and facilitate gradual reverse remodelling.
The impact of aortic and mitral valve regurgitation on the pumping efficacy of a left ventricular assist device (VAD) with the pulsatile or continuous flow was the subject of a simulation study by Kim and colleagues (Kim et al., 2016). The authors found that pulsatile VAD treatment delivered the highest pumping efficacy in cases of MR compared to continuous flow, owing to a greater overall afterload reduction achieved through pulsatile treatment. Additionally, even with the development of MR during VAD treatment, mean arterial blood pressure and cardiac output remained constant, regardless of the MR severity. Meanwhile, for severe AR, improvements in cardiac output and mechanical load reduction were only marginal for both pulsatile and continuous LVAD treatment. In a similar study, potential implications of TR on the efficacy of a right-sided VAD was investigated (Punnoose et al., 2012). The authors showed the presence of TR did not significantly affect VAD performance, nor did the VAD significantly impact the severity of TR. Interestingly, the authors noted that in the case of severe pulmonary hypertension and where the VAD draws blood from the right atrium, significant TR may be advantageous; this configuration increases the potential for the right ventricle to retain some native pulsatility, reducing flow stagnation and clot development.
3.6 Precision medicine and patient-specific prediction
There is a growing interest in developing patient-specific models of cardiovascular disease that can be used to improve diagnosis and tailor treatment strategies for individuals. Already, such clinical tools are beginning to emerge (Keshavarz-Motamed et al., 2014; Keshavarz-Motamed, 2020). Keshavarz-Motamed adapted a previously studied lumped parameter model for the basis for an innovative imaged-based patient-specific diagnostic, monitoring, and predictive tool (called C3VI-CMF) (Keshavarz-Motamed, 2020). The model included valvular updates to facilitate additional valve pathologies, including mitral valve disease, thus allowing for the simulation of mixed valvular disease. The C3VI-CMF tool was validated against cardiac catheterization data from a cohort of patients with complex valvular disease. The tool uses a selection of key parameters obtained from the patient’s echocardiogram to inform the model, which generates accurate predictions of heart function metrics, such as for patients pre- and post-valvular intervention. Figure 8 illustrates the use of the C3VI in a patient pre and post transcatheter aortic valve replacement (TAVR). In the future, such precision medicine tools could allow for simulating the patient-specific effects of different combinations of drug therapies, the timing and type of surgical strategy, and the response to mechanical circulatory support. Additionally, in patients with early or late disease, predictions for long-term progression without treatment could be predicted.
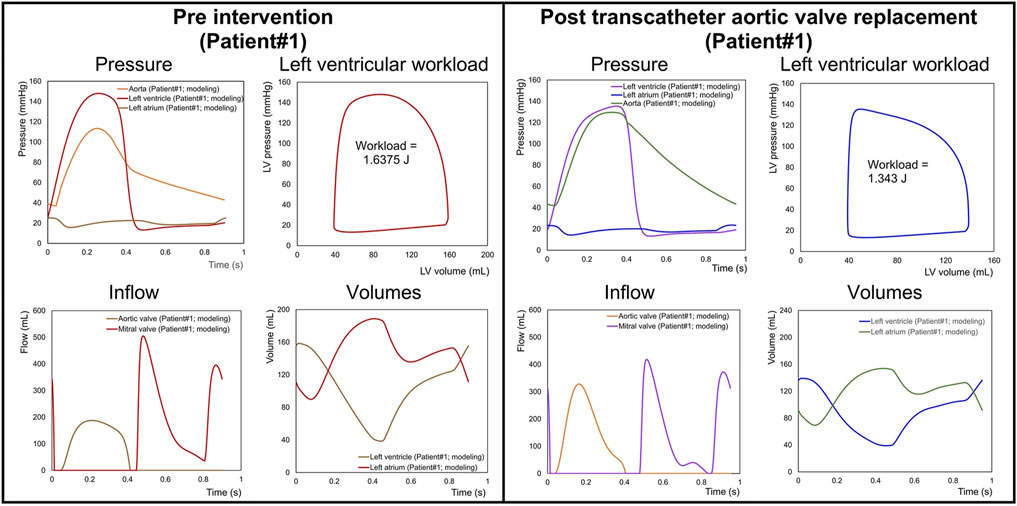
Figure 8. Predicted haemodynamics in a C3VI patient from baseline to 90 days post-transcatheter aortic valve replacement (TAVR). Pre-TAVR: severe aortic stenosis (effective orifice area (EOA) = 0.5 cm2); mild aortic regurgitation (AR); moderate to severe mitral regurgitation (MR); moderate to severe concentric hypertrophy; LV ejection fraction, 50%; arterial pressures, 115/40 mmHg; forward LV stroke volume, 54 mL. Post-TAVR: aortic valve (EOA = 1.6 cm2); mild to moderate AR; moderate to severe MR; hypertension, moderate to severe concentric hypertrophy; LV ejection fraction, 60%, arterial pressures, 140/45 mmHg; forward LV stroke volume, 53 mL. (Figure adapted from Keshavarz-Motamed (2020)).
4 Limitations of modelling-based research of valvular heart disease
Mathematical models are simplified representations of complex processes, and as such, there are inherent limitations in their attempt to capture all the complexities of reality. Models of the cardiovascular system and cardiac pathology are limited by the experimental or clinical data, which are used to parameterize the equations that describe the processes being studied. Models are typically developed with parameters informed by literature data, population averages, and animal studies, to first create a healthy generic cardiovascular state (Garber et al., 2021). For the simulation of cardiac pathology, the model is then adapted and calibrated based on obtainable data, which is often limited. As an example, estimating the compliances and resistances in vessels is challenging in both clinical settings and animal experiments (Shimizu et al., 2018). This challenge is only compounded by the need to estimate these values for specific cardiac disease states. As a result, it is often necessary to make certain assumptions about these values at the beginning of the simulation, and then calibrate them to physiologically appropriate values for the disease state modeled. Typically, an archetypal representation of a specific disease or physiological state is sought. In this regard, the model is not meant to capture the vastness of individual variations in normal physiology nor the heterogeneity of pathological states. Despite this, patient-specific modelling approaches have been developed, in which a patient’s individual clinical and imaging data are used to inform model parameterization and patient-specific simulation results are generated (Keshavarz-Motamed, 2020; Garber et al., 2021).
Every modelling-based study has its own specific limitations, which are often closely related to the validity of the model being used. Validity is defined as the extent to which a model fulfils the intended objectives for which it was formulated (Leaning et al., 2016). Thus, the impact of any model deficiencies, on the validity of the model and the simulation results are dependent on the model’s intended purpose and context of use (Pathmanathan and Gray, 2018). Among modeling-based VHD studies reviewed, the approaches to validating specific valvulopathy have varied. These include qualitative or quantitative comparisons of pressure or flow waveforms from clinical or literature data (Keshavarz-Motamed et al., 2014; Benevento et al., 2015; Hemalatha et al., 2010), or by comparing to key echocardiographic indices for a specific valvulopathy according to severity ranges outlined in clinical guidelines (Šeman et al., 2023; Punnoose et al., 2012; Mynard et al., 2012; Fresiello et al., 2015). The methods for cardiovascular model validation differ significantly and have been discussed in detail elsewhere (Pathmanathan and Gray, 2018; Leaning et al., 2016).
5 Future directions
As computational cardiovascular modelling continues to advance in tandem with increasing computational capabilities, simulation-based tools are set to become indispensable in both research and clinical practice. To fully harness their potential, it is imperative to foster interdisciplinary collaboration, thereby enhancing the availability and accessibility of these tools.
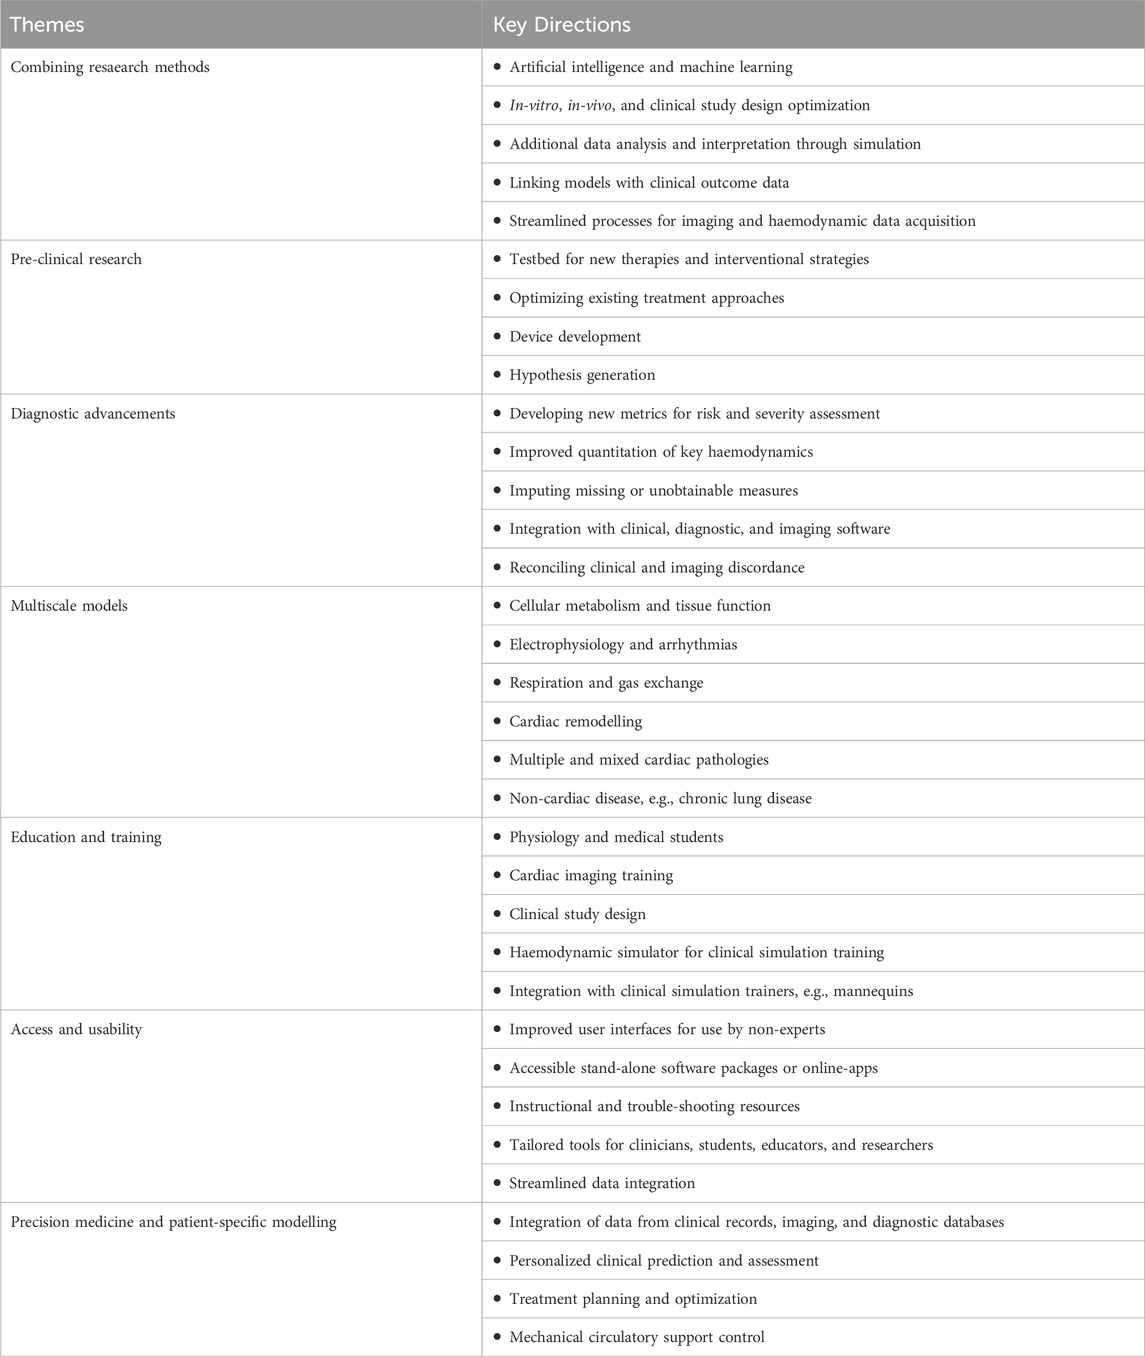
Key areas in cardiovascular modelling that are poised to make significant advancements are shown in Table 3. These advancements, driven by technological innovations and interdisciplinary research, promise to significantly improve our ability to model complex disease phenotypes and make patient-specific predictions. By integrating computational modelling with other research methodologies—such as in vitro experiments, in vivo studies, and clinical data—researchers can achieve a more comprehensive and nuanced understanding of disease progression. This multifaceted approach is crucial for unveiling mechanistic insights and developing effective personalized or precision medicine strategies.
The progression of cardiovascular disease is complex and involves interactions at multiple scales, from molecular and cellular processes to organ system interactions. Multiscale modelling involves integrating multiple different mathematical models allowing for the representation of multiple different phenomena across different measurable domains of time, space, and/or function (Walpole et al., 2013). Currently, there is a vast and promising scope for the expansion of multiscale models of VHD. At the cellular and tissue level, multiscale cardiovascular models allow for the simulation of the chronic cardiac remodelling changes that occur in response to worsening valvulopathy (Arts et al., 2005; Li et al., 1997; Maksuti et al., 1985). Significant progress has already been made to couple complex cardiac electrophysiological models with a lumped-parameter model for closed-loop cardiovascular simulation (Heldt et al., 2010; Regazzoni et al., 2022). This coupling forms the foundation for more comprehensive investigations into arrhythmias, conduction disorders, and pacing therapies. Indeed, multiscale models have value in the simulation of multiple and mixed disease states, where progression is driven by multiple interdependent factors.
There have been increasing efforts in clinical research to better examine the clinical heterogeneity within patient disease groups and identify subgroups of patients who share similar characteristics. For clinicians assessing patients with multiple cardiac pathologies, it is inherently difficult to discern the relative pathological consequences of a valvulopathy, over an arrhythmia, such as atrial fibrillation, and/or heart failure with reduced or preserved ejection fraction (Scarsoglio et al., 2016). This has implications for monitoring disease progression or response to therapy to any one pathology, in particular for patients deemed to be borderline indicated for valve replacement strategies. Indeed, it is not uncommon that such co-morbid patients to fail to derive symptomatic or mortality benefits from valvular intervention (Puri et al., 2016). The lack of benefit in these patients highlights the need for more personalized approaches that consider the interplay of multiple disease processes. Modelling provides the opportunity to quantify the contributory effect of coexisting diseases (both cardiac and non-cardiac) on symptom manifestation, disease progression, and response to therapy. Translated to the patient’s bedside, such knowledge can allow clinicians to make more informed decisions on treatment strategies and prognosis.
6 Conclusion
Computational modelling of the cardiovascular system has emerged as a powerful tool that allows detailed examination into the pathophysiology of VHD allowing for consolidation of existing knowledge and highlighting of knowledge gaps. Models facilitate hypothesis generation and allow for the exploration of novel ideas in the pre-clinical context. More recently, advancements have been made to link models to patient-specific data, to gain mechanistic insights and clinical predictions tailored to an individual patient. Ultimately, such patient-specific modelling approaches could be used in the clinical setting as an adjunct for patient diagnostic evaluation, prognostication, and the tailoring of treatment strategies. To date, the contribution of VHD modelling research has been predominantly in the realm of basic science. Opportunities for clinical translation are vast and are likely to be realized in the near future.
Author contributions
MŠ: Conceptualization, Data curation, Investigation, Methodology, Visualization, Writing–original draft, Writing–review and editing. AS: Conceptualization, Methodology, Visualization, Writing–original draft, Writing–review and editing. DK: Conceptualization, Resources, Supervision, Writing–original draft, Writing–review and editing. SG: Conceptualization, Methodology, Resources, Supervision, Writing–original draft, Writing–review and editing. DS: Conceptualization, Methodology, Resources, Supervision, Writing–original draft, Writing–review and editing.
Funding
The author(s) declare that financial support was received for the research, authorship, and/or publication of this article. This work is supported by the Monash Institute of Medical Engineering (MIME – 2020-17) and Monash University, Melbourne, Australia. Associate Professor Stub is funded by a National Heart Foundation (NHF) fellowship (101908), and a Australian National Health and Medical Research Council (NHMRC) fellowship (2017609), and Associate Professor Gregory is funded by a NHMRC Fellowship (2016995) and a NHF Fellowship (106675). Professor Kaye is the recipient of an NHMRC Investigator Grant.
Conflict of interest
The authors declare that the research was conducted in the absence of any commercial or financial relationships that could be construed as a potential conflict of interest.
Publisher’s note
All claims expressed in this article are solely those of the authors and do not necessarily represent those of their affiliated organizations, or those of the publisher, the editors and the reviewers. Any product that may be evaluated in this article, or claim that may be made by its manufacturer, is not guaranteed or endorsed by the publisher.
Abbreviations
AS, Aortic stenosis; AR, Aortic regurgitation; LPM, Lumped parameter model; LV, Left ventricle; MR, Mitral regurgitation; MS, Mitral stenosis; PR, Pulmonary regurgitation; TR, Tricuspid regurgitation; VAD, Ventricular assist device; VHD, Valvular heart disease.
References
Alassar, A., Roy, D., Valencia, O., Brecker, S., and Jahangiri, M. (2013). Survival, predictive factors, and causes of mortality following transcatheter aortic valve implantation. Innovations 8 (5), 359–363. doi:10.1097/imi.0000000000000024
Arts, T., Delhaas, T., Bovendeerd, P., Verbeek, X., and Prinzen, F. W. (2005). Adaptation to mechanical load determines shape and properties of heart and circulation: the CircAdapt model. Am. J. Physiol. Heart Circ. Physiol. 288 (4), H1943–H1954. doi:10.1152/ajpheart.00444.2004
Baiocchi, M., Barsoum, S., Khodaei, S., de la Torre Hernandez, J. M., Valentino, S. E., Dunford, E. C., et al. (2021). Effects of choice of medical imaging modalities on a non-invasive diagnostic and monitoring computational framework for patients with complex valvular, vascular, and ventricular diseases who undergo transcatheter aortic valve replacement. Front. Bioeng. Biotechnol. 9, 643453. doi:10.3389/fbioe.2021.643453
Baumgartner, H., Falk, V., Bax, J. J., De Bonis, M., Hamm, C., Holm, P. J., et al. (2017). 2017 ESC/EACTS Guidelines for the management of valvular heart disease. Eur. Heart J. 38 (36), 2739–2791. doi:10.1093/eurheartj/ehx391
Baumgartner, H., Hung, J., Bermejo, J., Chambers, J. B., Evangelista, A., Griffin, B. P., et al. (2009). Echocardiographic assessment of valve stenosis: EAE/ASE recommendations for clinical practice. Eur. J. Echocardiogr. 10 (1), 1–23. doi:10.1016/j.echo.2008.11.029
Ben-Assa, E., Brown, J., Keshavarz-Motamed, Z., de la Torre Hernandez, J. M., Leiden, B., Olender, M., et al. (2019). Ventricular stroke work and vascular impedance refine the characterization of patients with aortic stenosis. Sci. Transl. Med. 11 (509), eaaw0181. doi:10.1126/scitranslmed.aaw0181
Benevento, E., Djebbari, A., Keshavarz-Motamed, Z., Cecere, R., and Kadem, L. (2015). Hemodynamic changes following aortic valve bypass: a mathematical approach. PLoS One 10 (4), e0123000. doi:10.1371/journal.pone.0123000
Bonow, R. O., Carabello, B. A., Chatterjee, K., de Leon, A. C., Faxon, D. P., Freed, M. D., et al. (2008). 2008 focused update incorporated into the ACC/AHA 2006 guidelines for the management of patients with valvular heart disease: a report of the American college of cardiology/American heart association task force on practice guidelines (writing committee to revise the 1998 guidelines for the management of patients with valvular heart disease): endorsed by the society of cardiovascular anesthesiologists, society for cardiovascular angiography and interventions, and society of thoracic surgeons. Circulation 118 (15), e523–e661. doi:10.1161/circulationaha.108.190748
Burkhoff, D. D. M., and Schleicher, T. Harvi-online. Available at: https://harvi.online.
Chung, D. C., Niranjan, S. C., Clark, J. W., Bidani, A., Johnston, W. E., Zwischenberger, J. B., et al. (1997). A dynamic model of ventricular interaction and pericardial influence. Am. J. physiology 272 (6 Pt 2), H2942–H2962. doi:10.1152/ajpheart.1997.272.6.h2942
Coffey, S., Roberts-Thomson, R., Brown, A., Carapetis, J., Chen, M., Enriquez-Sarano, M., et al. (2021). Global epidemiology of valvular heart disease. Nat. Rev. Cardiol. 18 (12), 853–864. doi:10.1038/s41569-021-00570-z
d'Arcy, J. L., Prendergast, B. D., Chambers, J. B., Ray, S. G., and Bridgewater, B. (2011). Valvular heart disease: the next cardiac epidemic. Heart 97 (2), 91–93. doi:10.1136/hrt.2010.205096
de Canete, J. F., del Saz-Orozco, P., Moreno-Boza, D., and Duran-Venegas, E. (2013). Object-oriented modeling and simulation of the closed loop cardiovascular system by using SIMSCAPE. Comput. Biol. Med. 43 (4), 323–333. doi:10.1016/j.compbiomed.2013.01.007
Defares, J. G., Osborn, J. J., and Hara, H. H. (1963). Theoretical synthesis of the cardiovascular system. Study I: the controlled system. Acta physiologica Pharmacol. Neerl. 12, 189–265.
Donovan, F. M. (1985). “Procedure for the design of a digital computer model of the air driven diaphragm artificial heart,” in Biomedical engineering IV. Editor B. W. Sauer (Pergamon), 59–62.
Formaggia, L., Quarteroni, A., and Veneziani, A. (2009). Cardiovascular Mathematics: Modeling and Simulation of the Circulatory System. Milano: Springer-Verlag.
Frank, C., and Hoppensteadt, C. S. P. (2002). Modeling and Simulation in Medicine and the Life Sciences. New York, NY: Springer. doi:10.1007/978-0-387-21571-6
Fresiello, L., Ferrari, G., Di Molfetta, A., Zielinski, K., Tzallas, A., Jacobs, S., et al. (2015). A cardiovascular simulator tailored for training and clinical uses. J. Biomed. Inf. 57, 100–112. doi:10.1016/j.jbi.2015.07.004
Gammie, J. S., Krowsoski, L. S., Brown, J. M., Odonkor, P. N., Young, C. A., Santos, M. J., et al. (2008). Aortic valve bypass surgery: midterm clinical outcomes in a high-risk aortic stenosis population. Circulation 118 (14), 1460–1466. doi:10.1161/circulationaha.108.790030
Garber, L., Khodaei, S., and Keshavarz-Motamed, Z. (2021). The critical role of lumped parameter models in patient-specific cardiovascular simulations. Archives Comput. Methods Eng. 29 (5), 2977–3000. doi:10.1007/s11831-021-09685-5
Garber, L., Khodaei, S., Maftoon, N., and Keshavarz-Motamed, Z. (2023). Impact of TAVR on coronary artery hemodynamics using clinical measurements and image-based patient-specific in silico modeling. Sci. Rep. 13 (1), 8948. doi:10.1038/s41598-023-31987-w
Garcia, D., Camici, P. G., Durand, L. G., Rajappan, K., Gaillard, E., Rimoldi, O. E., et al. (1985)2009). Impairment of coronary flow reserve in aortic stenosis. J. Appl. Physiol. 106 (1), 113–121. doi:10.1152/japplphysiol.00049.2008
Garcia, D., and Durand, L.-G. (2006). “Aortic stenosis and systemic hypertension, modeling of,” in Wiley encyclopedia of biomedical engineering. Editor M. Akay (New York: Wiley).
Grimes, R. Y., Levine, R. A., Walker, P. G., and Yoganathan, A. P. (1995). Dynamics of systolic pulmonary venous flow in mitral regurgitation: mathematical modeling of the pulmonary venous system and atrium. J. Am. Soc. Echocardiogr. 8 (5 Pt 1), 631–642. doi:10.1016/s0894-7317(05)80376-1
Heldt, T., Mukkamala, R., Moody, G. B., and Mark, R. G. (2010). CVSim: an open-source cardiovascular simulator for teaching and research. Open Pacing Electrophysiol. Ther. J. 3, 45–54.
Hemalatha, K., Manivannan, M., and Thanikachalam, S. (2010). “Numerical simulation of cardiac valve flow velocity patterns in normal and abnormal conditions,” 2010 international conference on communication control and computing technologies.
Hopkins, R. W., Young, T., Poiseuille, J. L. M., and Simeone, F. A. (1991). Presidential address: energy, poise, and resilience[mdash ]daniel Bernoulli, thomas young, J. L. M. Poiseuille, and F. A. Simeone. J. Vasc. Surg. 13 (6), 777–784. doi:10.1067/mva.1991.27926
Inuzuka, R., Kuwata, S., Kurishima, C., Liang, F., Sughimoto, K., and Senzaki, H. (2016). Influence of cardiac function and loading conditions on the myocardial performance index - theoretical analysis based on a mathematical model. Circulation J. official J. Jpn. Circulation Soc. 80 (1), 148–156. doi:10.1253/circj.cj-15-0598
Ježek, F., Kulhánek, T., Kalecký, K., and Kofránek, J. (2017). Lumped models of the cardiovascular system of various complexity. Biocybern. Biomed. Eng. 37 (4), 666–678. doi:10.1016/j.bbe.2017.08.001
Keshavarz-Motamed, Z. (2020). A diagnostic, monitoring, and predictive tool for patients with complex valvular, vascular and ventricular diseases. Sci. Rep. 10 (1), 6905. doi:10.1038/s41598-020-63728-8
Keshavarz-Motamed, Z., Garcia, J., Gaillard, E., Capoulade, R., Le Ven, F., Cloutier, G., et al. (2014). Non-invasive determination of left ventricular workload in patients with aortic stenosis using magnetic resonance imaging and Doppler echocardiography. PLoS One 9 (1), e86793. doi:10.1371/journal.pone.0086793
Kim, Y. S., Kim, E. H., Kim, H. G., Shim, E. B., Song, K. S., and Lim, K. M. (2016). Mathematical analysis of the effects of valvular regurgitation on the pumping efficacy of continuous and pulsatile left ventricular assist devices. Integr. Med. Res. 5 (1), 22–29. doi:10.1016/j.imr.2016.01.001
King, J. M., Bergeron, C. A., and Taylor, C. E. (2018). Development of an adaptive pulmonary simulator for in vitro analysis of patient populations and patient-specific data. Comput. methods programs Biomed. 161, 93–102. doi:10.1016/j.cmpb.2018.04.007
King, J. M., Bergeron, C. A., and Taylor, C. E. (2019). Finite state machine implementation for left ventricle modeling and control. Biomed. Eng. online 18 (1), 10. doi:10.1186/s12938-019-0628-3
Korakianitis, T., and Shi, Y. (2006a). Numerical simulation of cardiovascular dynamics with healthy and diseased heart valves. J. biomechanics 39 (11), 1964–1982. doi:10.1016/j.jbiomech.2005.06.016
Korakianitis, T., and Shi, Y. (2006b). A concentrated parameter model for the human cardiovascular system including heart valve dynamics and atrioventricular interaction. Med. Eng. and Phys. 28 (7), 613–628. doi:10.1016/j.medengphy.2005.10.004
Kulhánek, T., Tribula, M., Kofránek, J., and Mateják, M. (2014). Simple models of the cardiovascular system for educational and research purposes. MEFANET J. 2 (2), 56–63.
Lancellotti, P., Moura, L., Pierard, L. A., Agricola, E., Popescu, B. A., Tribouilloy, C., et al. (2010). European Association of Echocardiography recommendations for the assessment of valvular regurgitation. Part 2: mitral and tricuspid regurgitation (native valve disease). Eur. J. Echocardiogr. 11 (4), 307–332. doi:10.1093/ejechocard/jeq031
Laubscher, R., van der Merwe, J., Liebenberg, J., and Herbst, P. (2022). Dynamic simulation of aortic valve stenosis using a lumped parameter cardiovascular system model with flow regime dependent valve pressure loss characteristics. Med. Eng. and Phys. 106, 103838. doi:10.1016/j.medengphy.2022.103838
Leaning, M. S., Pullen, H. E., Carson, E. R., Al-Dahan, M., Rajkumar, N., and Finkelstein, L. (2016). Modelling a complex biological system: the human cardiovascular system — 2. Model validation, reduction and development. Trans. Inst. Meas. Control 5 (2), 87–98. doi:10.1177/014233128300500203
Li, J. K., Zhu, J. Y., and Nanna, M. (1997). Computer modeling of the effects of aortic valve stenosis and arterial system afterload on left ventricular hypertrophy. Comput. Biol. Med. 27 (6), 477–485. doi:10.1016/s0010-4825(97)00027-9
Maksuti, E., Westerhof, B. E., Ugander, M., Donker, D. W., Carlsson, M., and Broome, M. (1985)2019). Cardiac remodeling in aortic and mitral valve disease: a simulation study with clinical validation. J. Appl. Physiol. 126 (5), 1377–1389. doi:10.1152/japplphysiol.00791.2018
Mehrotra, P., Jansen, K., Tan, T. C., Flynn, A., and Hung, J. W. (2018). Clinical features and prognosis of patients with isolated severe aortic stenosis and valve area less than 1.0 cm(2). Heart 104 (3), 222–229. doi:10.1136/heartjnl-2016-310729
Michail, M., Davies, J. E., Cameron, J. D., Parker, K. H., and Brown, A. J. (2018). Pathophysiological coronary and microcirculatory flow alterations in aortic stenosis. Nat. Rev. Cardiol. 15 (7), 420–431. doi:10.1038/s41569-018-0011-2
Morris, P. D., Narracott, A., von Tengg-Kobligk, H., Silva Soto, D. A., Hsiao, S., Lungu, A., et al. (2016). Computational fluid dynamics modelling in cardiovascular medicine. Heart 102 (1), 18–28. doi:10.1136/heartjnl-2015-308044
Moza, A., Gesenhues, J., Autschbach, R., Abel, D., Rossaint, R., Schmitz-Rode, T., et al. (2017). Parametrization of an in-silico circulatory simulation by clinical datasets - towards prediction of ventricular function following assist device implantation. Biomed. Tech. Biomed. Eng. 62 (2), 123–130. doi:10.1515/bmt-2016-0078
Mynard, J. P., Davidson, M. R., Penny, D. J., and Smolich, J. J. (2012). A simple, versatile valve model for use in lumped parameter and one-dimensional cardiovascular models. Int. J. Numer. methods Biomed. Eng. 28 (6-7), 626–641. doi:10.1002/cnm.1466
Nkomo, V. T., Gardin, J. M., Skelton, T. N., Gottdiener, J. S., Scott, C. G., and Enriquez-Sarano, M. (2006). Burden of valvular heart diseases: a population-based study. Lancet London, Engl. 368 (9540), 1005–1011. doi:10.1016/s0140-6736(06)69208-8
Otto, C. M., Nishimura, R. A., Bonow, R. O., Carabello, B. A., Erwin, J. P., Gentile, F., et al. (2020). 2020 ACC/AHA guideline for the management of patients with valvular heart disease: a report of the American college of cardiology/American heart association joint committee on clinical practice guidelines. Circulation 143 (5), e72–e227. doi:10.1161/cir.0000000000000923
Pant, S., Corsini, C., Baker, C., Hsia, T. Y., Pennati, G., and Vignon-Clementel, I. E. (2018). A lumped parameter model to study atrioventricular valve regurgitation in stage 1 and changes across stage 2 surgery in single ventricle patients. IEEE Trans. Biomed. Eng. 65 (11), 2450–2458. doi:10.1109/tbme.2018.2797999
Pathmanathan, P., and Gray, R. A. (2018). Validation and trustworthiness of multiscale models of cardiac electrophysiology. Front. Physiol. 9, 106. doi:10.3389/fphys.2018.00106
Pearce, N., and Kim, E. J. (2022). An investigation of left ventricular valve disorders and the mechano-electric feedback using a synergistic lumped parameter cardiovascular numerical model. Bioeng. Basel, Switz. 9 (9), 454. doi:10.3390/bioengineering9090454
Popovic, Z. B., Khot, U. N., Novaro, G. M., Casas, F., Greenberg, N. L., Garcia, M. J., et al. (2005). Effects of sodium nitroprusside in aortic stenosis associated with severe heart failure: pressure-volume loop analysis using a numerical model. Am. J. Physiol. Heart Circ. Physiol. 288 (1), H416–H423. doi:10.1152/ajpheart.00615.2004
Punnoose, L., Burkhoff, D., Rich, S., and Horn, E. M. (2012). Right ventricular assist device in end-stage pulmonary arterial hypertension: insights from a computational model of the cardiovascular system. Prog. Cardiovasc Dis. 55 (2), 234–243.e2. doi:10.1016/j.pcad.2012.07.008
Puri, R., Iung, B., Cohen, D. J., and Rodes-Cabau, J. (2016). TAVI or No TAVI: identifying patients unlikely to benefit from transcatheter aortic valve implantation. Eur. Heart J. 37 (28), 2217–2225. doi:10.1093/eurheartj/ehv756
Quintana, E., Suri, R. M., Thalji, N. M., Daly, R. C., Dearani, J. A., Burkhart, H. M., et al. (2014). Left ventricular dysfunction after mitral valve repair--the fallacy of normal preoperative myocardial function. J. Thorac. Cardiovasc. Surg. 148 (6), 2752–2762. doi:10.1016/j.jtcvs.2014.07.029
Regazzoni, F., Salvador, M., Africa, P. C., Fedele, M., Dedè, L., and Quarteroni, A. (2022). A cardiac electromechanical model coupled with a lumped-parameter model for closed-loop blood circulation. J. Comput. Phys. 457, 111083. doi:10.1016/j.jcp.2022.111083
Ripoli, A., Belardinelli, A., Ferrazzi, P., Franchi, D., Palagi, G., and Bedini, R. (1998). Mitral valve regurgitation and systolic performance: a model approach. Comput. Cardiol. 25, 13–16. doi:10.1109/CIC.1998.731780
Rosalia, L., Ozturk, C., Van Story, D., Horvath, M. A., and Roche, E. T. (2021). Object-oriented lumped-parameter modeling of the cardiovascular system for physiological and pathophysiological conditions. Adv. Theory Simulations 4 (3). doi:10.1002/adts.202000216
Sagawa, K. (1973). “Comparative models of overall circulatory mechanics,” in Advances in biomedical engineering. Editors J. H. U. Brown, and J. F. Dickson (Academic Press), 1–95.
Samaras, A., Vrana, E., Kartas, A., Moysidis, D. V., Papazoglou, A. S., Doundoulakis, I., et al. (2021). Prognostic implications of valvular heart disease in patients with non-valvular atrial fibrillation. BMC Cardiovasc Disord. 21 (1), 453. doi:10.1186/s12872-021-02264-3
Scarsoglio, S., Saglietto, A., Gaita, F., Ridolfi, L., and Anselmino, M. (2016). Computational fluid dynamics modelling of left valvular heart diseases during atrial fibrillation. PeerJ 4, e2240. doi:10.7717/peerj.2240
Schiavazzi, D. E., Baretta, A., Pennati, G., Hsia, T. Y., and Marsden, A. L. (2017). Patient-specific parameter estimation in single-ventricle lumped circulation models under uncertainty. Int. J. Numer. methods Biomed. Eng. 33 (3). doi:10.1002/cnm.2799
Šeman, M., Stephens, A. F., Walton, A., Duffy, S. J., McGiffin, D., Nanayakkara, S., et al. (2023). Impact of concomitant mitral regurgitation on the hemodynamic indicators of aortic stenosis. J. Am. Heart Assoc. 12 (4), e025648. doi:10.1161/jaha.122.025648
Shimizu, S., Une, D., Kawada, T., Hayama, Y., Kamiya, A., Shishido, T., et al. (2018). Lumped parameter model for hemodynamic simulation of congenital heart diseases. J. physiological Sci. JPS 68 (2), 103–111. doi:10.1007/s12576-017-0585-1
Syomin, F. A., Zberia, M. V., and Tsaturyan, A. K. (2019). Multiscale simulation of the effects of atrioventricular block and valve diseases on heart performance. Int. J. Numer. methods Biomed. Eng. 35 (7), e3216. doi:10.1002/cnm.3216
Szabo, G., Soans, D., Graf, A., C, J. B., Waite, L., and Hagl, S. (2004). A new computer model of mitral valve hemodynamics during ventricular filling. Eur. J. cardio-thoracic Surg. official J. Eur. Assoc. Cardio-thoracic Surg. 26 (2), 239–247. doi:10.1016/j.ejcts.2004.03.018
The MathWorks, I. (2022). Basic principles of modeling physical networks 2022. Available at: https://au.mathworks.com/help/simscape/ug/basic-principles-of-modeling-physical-networks.html (Accessed December 10, 2022).
The MathWorks Inc (2020). Simscape™ Fluids™ user's guide (R2020a). Natick, Massachusetts: The MathWorks Inc.
Toma, M., Singh-Gryzbon, S., Frankini, E., Wei, Z. A., and Yoganathan, A. P. (2022). Clinical impact of computational heart valve models. Mater. (Basel) 15 (9), 3302. doi:10.3390/ma15093302
Toy, S. M., Melbin, J., and Noordergraaf, A. (1985). Reduced models of arterial systems. IEEE Trans. Biomed. Eng. 32 (2), 174–176. doi:10.1109/tbme.1985.325439
Ursino, M., Antonucci, M., and Belardinelli, E. (1994). Role of active changes in venous capacity by the carotid baroreflex: analysis with a mathematical model. Am. J. physiology 267 (6 Pt 2), H2531–H2546. doi:10.1152/ajpheart.1994.267.6.h2531
Walmsley, J., Squara, P., Wolfhard, U., Cornelussen, R., and Lumens, J. (2019). Impact of abrupt versus gradual correction of mitral and tricuspid regurgitation: a modelling study. EuroIntervention J. Eur. Collab. Work. Group Interventional Cardiol. Eur. Soc. Cardiol. 15 (10), 902–911. doi:10.4244/eij-d-19-00598
Walpole, J., Papin, J. A., and Peirce, S. M. (2013). Multiscale computational models of complex biological systems. Annu. Rev. Biomed. Eng. 15, 137–154. doi:10.1146/annurev-bioeng-071811-150104
Zhou, S., Xu, L., Hao, L., Xiao, H., Yao, Y., Qi, L., et al. (2019). A review on low-dimensional physics-based models of systemic arteries: application to estimation of central aortic pressure. Biomed. Eng. online 18 (1), 41. doi:10.1186/s12938-019-0660-3
Keywords: cardiovascular model, mathematical model, lumped parameter, aortic stenosis, mitral regurgitation
Citation: Šeman M, Stephens AF, Kaye DM, Gregory SD and Stub D (2024) Computational modelling of valvular heart disease: haemodynamic insights and clinical implications. Front. Bioeng. Biotechnol. 12:1462542. doi: 10.3389/fbioe.2024.1462542
Received: 10 July 2024; Accepted: 25 October 2024;
Published: 12 November 2024.
Edited by:
Yonghui Qiao, Northwestern Polytechnical University, ChinaReviewed by:
Xuelan Zhang, University of Science and Technology Beijing, ChinaZhiqing Zhang, Guangxi University of Science and Technology, China
Su Wang, Northwestern Polytechnical University, China, in collaboration with reviewer ZZ
Copyright © 2024 Šeman, Stephens, Kaye, Gregory and Stub. This is an open-access article distributed under the terms of the Creative Commons Attribution License (CC BY). The use, distribution or reproduction in other forums is permitted, provided the original author(s) and the copyright owner(s) are credited and that the original publication in this journal is cited, in accordance with accepted academic practice. No use, distribution or reproduction is permitted which does not comply with these terms.
*Correspondence: Michael Šeman, bWljaGFlbC5zZW1hbkBtb25hc2guZWR1
†These authors have contributed equally to this work and share last authorship
 Michael Šeman
 Andrew F. Stephens2,4
 David M. Kaye