- 1Institute of Particle Technology, Technische Universität Braunschweig, Braunschweig, Germany
- 2Institute of Microtechnology, Technische Universität Braunschweig, Braunschweig, Germany
- 3Center of Pharmaceutical Engineering, Technische Universität Braunschweig, Braunschweig, Germany
Filamentous microorganisms exhibit a complex macro-morphology constituted of branched and cross-linked hyphae. Fully resolved mechanical models of such mycelial compounds rely heavily on accurate input data for mechanical properties of individual hyphae. Due to their irregular shape and high adaptability to environmental factors, the measurement of these intrinsic properties remains challenging. To overcome previous shortcomings of microfluidic bending tests, a novel system for the precise measurement of the individual bending stiffness of fungal hyphae is presented in this study. Utilizing two-photon polymerization, microfluidic molds were fabricated with a multi-material approach, enabling the creation of 3D cell traps for spore immobilization. Unlike previous works applying the methodology of microfluidic bending tests, the hyphae were deflected in the vertical center of the microfluidic channel, eliminating the adverse influence of nearby walls on measurements. This lead to a significant increase in measurement yield compared to the conventional design. The accuracy and reproducibility of bending tests was ensured through validation of the measurement flow using micro-particle image velocimetry. Our results revealed that the bending stiffness of hyphae of Aspergillus niger is approximately three to four times higher than that reported for Candida albicans hyphae. At the same time, the derived longitudinal Young’s Modulus of the hyphal cell wall yields a comparable value for both organisms. The methodology established in this study provides a powerful tool for studying the effects of cultivation conditions on the intrinsic mechanical properties of single hyphae. Applying the results to resolved numerical models of mycelial compounds promises to shed light on their response to hydrodynamic stresses in biotechnological cultivation, which influences their expressed macro-morphology and in turn, product yields.
1 Introduction
Filamentous microorganisms are highly relevant to the biotechnological industry, as they can produce a broad range of substances such as organic acids, pharmaceutical substances or enzymes (Meyer et al., 2016). When grown in submerged culture, their developed macro-morphology profoundly influences their productivity (Nielsen et al., 1995; Grimm et al., 2005; Wucherpfennig et al., 2011; Krull et al., 2013), where the morphology can range from loosely dispersed mycelium up to dense agglomerates known as pellets (Walisko et al., 2015; Böl et al., 2021). Which morphology is desirable to maximize product yield varies between different strains and depends on the desired product (Pazouki and Panda, 2000; Grimm et al., 2005; Wucherpfennig et al., 2010). Therefore, a good understanding of the parameters that influence the expressed growth morphology is crucial for targeted process optimization by morphology engineering. The hydrodynamic conditions inside the reactor volume are an important factor influencing macro-morphology (Serrano-Carreón et al., 2015; Waldherr et al., 2023). If the power input in a bioreactor is too high, the latter can lead to cell damage and thus reduced productivity (Toma et al., 1991; El-Enshasy et al., 2006). On the other hand, if the agitation and aeration is too low, inhomogeneous mixing can lead to insufficient oxygen supply, which is why studies have been carried out to link hydrodynamic stress to resulting morphology and thus productivity (Lin et al., 2010; Waldherr et al., 2023). In the case of filamentous microorganisms, agitation leads to relative velocity between mycelial compounds (e.g., pellets) and liquid media, resulting in shear and normal forces acting on the hyphae (Ayazi Shamlou et al., 1994). Therefore, an accurate knowledge of their intrinsic mechanical properties is key for the accurate modelling of the mechanical response of more complex hyphal networks to such stresses. Consequently, the aim of this work is to mechanically characterize the hyphae of a representative strain of the filamentous fungus Aspergillus niger, which is highly relevant and widely used in white biotechnology (Cairns et al., 2018).
One established approach to measure the mechanical properties of single hyphae is atomic force microscopy (AFM) based force spectroscopy, which is also often applied to more regularly shaped cells, such as yeast or micro algae (Arfsten et al., 2010; Günther, 2015). It allows very local probing of the elasticity of the cell wall and has been applied to derive hyphal cell wall stiffness (Ma et al., 2005; Zhao et al., 2005; Zheng et al., 2017). Utilizing this high spatial resolution, Ma et al., 2005 showed that the stiffness of the cell wall of Aspergillus nidulans hyphae shows a harsh gradient, decreasing towards the hyphal tip. However, the very local character of AFM can also be disadvantageous, as the probed elasticity can depend strongly on the indentation location, complicating the extraction of intrinsic mechanical properties (Arfsten et al., 2010). Moreover, varying the measurement parameters, especially the AFM tip geometry, can lead to considerably large variations in measured elasticity (Wu et al., 2018).
An alternative approach to avoid the implications of local probing are global measurement methods, in which the entire cell is subjected to mechanical stress to infer its mechanical properties. Stocks and Thomas (2001) used this approach in a tensile test setup to measure the tensile strength and Young’s modulus of single hyphae of the filamentous bacterium Saccharopolyspora erythraea (Stocks and Thomas, 2001). While this method allows determination of the tensile strength, it requires a high degree of manual interaction with the hypha for precise positioning and immobilization, resulting in low throughput and not being feasible for in situ application. In single cell compression tests, whole cells are compressed by a nanoindenter equipped with a flat punch (Arfsten et al., 2009; Overbeck et al., 2015; 2023). Accounting for the cell deformation, the yielded stiffness can be used to estimate the elasticity of the cell wall. However, applying this methodology to hyphae is not straight forward because of their irregular shape. Instead of mechanically stressing the entire hypha, Chevalier et al. precisely punctured the cell wall of A. nidulans hyphae via photoablation, resulting in the release of turgor pressure and thus a relaxation of the cell wall. Using a previously determined turgor pressure, they measured a gradient in cell wall Young’s Modulus that increased with distance from the hyphal tip (Chevalier et al., 2023).
While the aforementioned methods do enable the measurement of the hyphal cell wall’s elasticity in some way, they require a high degree of manual interaction with the specimen and thus suffer from low throughput. A non-invasive method to globally measure the hyphal cell wall’s elasticity, which also has the potential for high parallelization is a microfluidic bending test (Nezhad et al., 2013; Amir et al., 2014; Caspi, 2014; Couttenier et al., 2022). This methodology uses flow-induced forces inside a microfluidic channel to deflect filamentous cells oriented perpendicular to the flow direction. It can be implemented quasi in situ during an ongoing cultivation. Nezhad et al. (2013) published the first demonstration of measuring the Young’s Modulus of the primary cell wall of Camellia japonica pollen tubes using this method. After conducting a proof of concept, Amir et al. and Caspi utilized comparable systems to measure the bending stiffness of Escherichia coli and Bacillus subtilis cells, thus expanding the method to bacterial cells (Amir et al., 2014; Caspi, 2014). Most recently, Couttenier et al. (2022) improved the technique by implementing a more sophisticated microfluidic design to measure the hyphae of the dimorphic yeast Candida albicans. In all of these works, the microfluidic system served as a platform for the actual measurement and as an incubator for the immobilization and growth of the test samples, minimizing the need for manual handling. In addition, in all previous studies that utilized the microfluidic bending tests, standard photo- and soft-lithography protocols were used for fabrication. As a consequence the filaments being measured were situated on the channel floor. This can lead to various issues, such as partial adhesion to the floor surface, which can interfere with measurements, or even complete immobilization of the hypha, making measurements impossible (Couttenier et al., 2022). This work presents a system for microfluidic bending tests that prevents interference of the channel floor with the bending measurement. For this purpose, the hyphae had to be positioned in the vertical center of the channel. To enable true 3D structuring and at the same time achieve the necessary high resolution for manipulating single fungal hyphae, the microsystems were fabricated by a two-photon polymerization (2 PP) assisted molding process. Moreover, a multi-material approach for the 2 PP process was required to integrate micrometer feature resolution in a structure spanning multiple millimeters.
2 Materials and methods
2.1 Microfluidic chip design
The basis for the presented system design is an adaption of the design for C. albicans hyphae described by Couttenier et al. (2022). Briefly, to accommodate for the two main tasks of spore immobilization and measurement, the system was designed in two halves - the loading and the measuring halve - each containing a main chamber, either the loading chamber or the measurement chamber (see Figure 1A). Inside the former, spores were immobilized and subsequently incubated to germinate and grow hyphae. Inside the latter, the probing flow subsequently deflected the hyphae growing into it. Both system halves had separate inlets for infusion with either spore suspension or liquid medium, as well as dedicated outlets. To immobilize and guide growth, 80 equidistantly spaced growth channels with a cross-section matching that of a hypha (
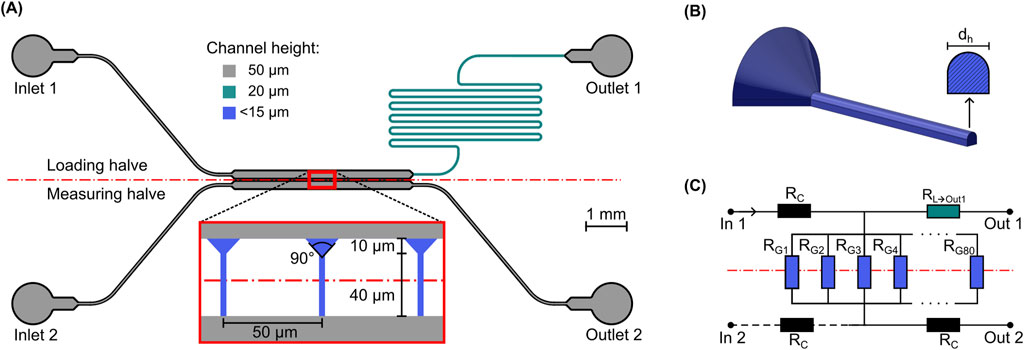
Figure 1. Schematic overview of the system design. (A) Top view of the microfluidic system layout with a zoomed view of the middle section with the growth channels. The separation of the loading and measurement halves is indicated by the dashed red line, different channel colors show different channel heights. (B) Perspective view of the 3D-shape of a growth channel and cross-section of narrow part. (C) Simplified fluidic equivalent circuit diagram used for the channel dimensioning and estimation of average chamber pressure.
2.2 2PP of the microfludic mold
Figure 2 illustrates the process of creating the negative mold for soft-lithography replica molding through 2 PP. A previously developed process for the production of dry adhesive structures (Busche et al., 2020) was adapted for this purpose. The glass substrate (Borofloat 33, Schott, Mainz, Germany) was first rinsed with acetone, ethanol, and millipore water. After blow-drying with nitrogen, the substrate was coated with an approximately 30 nm thick film of indium tin oxide (ITO) via sputtering (Laborsystem LS 440 S, Von Ardenne Anlagentechnik GmbH, Dresden, Germany) to facilitate automatic interface finding during the 2 PP process. Next, the ITO-coated substrate was treated with oxygen plasma (Zepto, Diener, Ebhausen, Germany) for 60 s at 200 W and 100 Pa, and then silanized with 3-trimethoxysilylpropyl-methacrylate (TMSPM, Sigma-Aldrich, St. Louis, United States) to promote structure adhesion as described by (Garoff and Ansorge, 1981). This step prevented delamination of the 2 PP structures during development and drying. After silanization (1), the negative structure of the channel network was printed using a 2 PP workstation (Photonic Professional GT1, Nanoscribe GmbH, Eggenstein-Leipoldshafen, Germany) equipped with a Ti:Saphire laser emitting 100 fs pulses at a central wavelength of 780 nm and a fixed rate of 80 MHz. To make the best out of the process’s full resolution while keeping printing times reasonable, the fabrication was divided into two sub-processes. In the first process, we used a 63x-objective (NA 1.4, Carl Zeiss AG, Oberkochen, Germany) to polymerize the finest structures (2). We used the commercially available photoresist IP-Dip (Nanoscribe GmbH, Eggenstein-Leipoldshafen, Germany) with a minimal radial feature size of less than 1 µm. To maintain a consistent structure height in accordance with the design, we utilized automatic interface detection for each individual structure. Following this 63x process, the structures were developed by carefully immersing the substrate in propylene glycol monomethyl ether acetate (PGMEA, Sigma-Aldrich, St. Louis, United States) for 15 min, followed by a rinse in isopropanol for 120 s and a gentle blow-dry with nitrogen. This yielded the fine structures of the growth channels (3). In the second 2 PP-subprocess, we used a 10x-objective (NA 0.3, Carl Zeiss AG, Oberkochen, Germany) with the photoresist IP-Q (Nanoscribe GmbH, Eggenstein-Leipoldshafen, Germany) to print the larger features of the system on top of the fine structures using (4). The result was the complete negative structure of the channel system (5). To allow good detachment from the mold, we used a parylene coater (nttf coatings GmbH, Rheinbreitbach, Germany) to deposit a 1 µm thick layer of Parylene-C on top of the structures (6). This uniformly deposited coating introduced a constant reduction of structure aspect ratio (height to width), which was accounted for in the initial design.
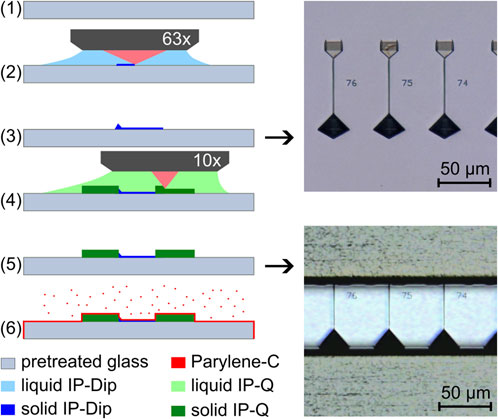
Figure 2. Fabrication steps of the negative mold by two-photon polymerization viewed from the side with white light microscopy images of the top view of the growth channel structures after the 63x-process and with the added channel structures after the 10x-process.
2.3 Microfluidic chip fabrication
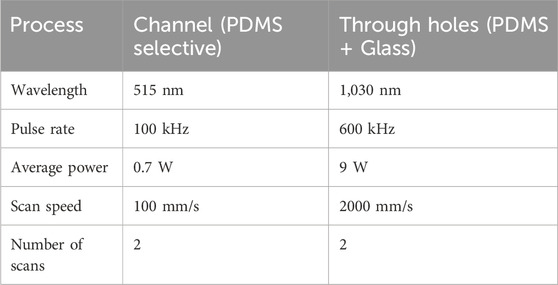
In order to obtain the positive microfluidic channels, the printed structures were molded with poly-dimethylsiloxane (PDMS). Liquid PDMS precursor and the corresponding crosslinker from the PDMS production set (Sylgard 184, Dow Chemical, Midland, United States) were mixed at a 10:1 weight ratio, degassed, and poured over the negative mold. After curing for 1 h at 70°C on a hot plate, the structured PDMS was peeled off the mold. The final assembly of the PDMS slab was conducted according to the desired system configuration. Two configurations were fabricated: the floor configuration, which represented a design corresponding to the current state of the art, and a second novel center configuration, allowing hyphae without floor contact to be exposed to the probing flow. A cross-section view of both systems is shown in Figure 3. In the floor configuration, the hyphae resided on the floor of the measurement chamber (Figure 3A), while in the center configuration it could be located in the vertical channel center, achieving a symmetrical flow around it (Figure 3B). For the floor configuration, the PDMS slab was punctured with a 1 mm autopsy punch for the in- and outlets before being permanently bonded to a glass chip through oxygen plasma treatment in a low-pressure plasma chamber (Zepto, Diener, Ebhausen, Germany), sealing the channels. The bonding was finalized by 4 hours at 40°C on a hot plate. Alternatively, to fabricate systems in center configuration, the PDMS slab was aligned with and bonded to a second system halve, containing the mirrored cavity of the measurement chamber. This second system halve was fabricated by spin-coating a layer of PDMS onto a glass wafer. The PDMS layer thickness was adjusted precisely to match the desired channel height, positioning the hypha in the vertical channel center. Using a femtosecond laser work station (microSTRUCT c, 3D Micromac AG, Chemnitz, Germany) equipped with a YB:KGW solid-state laser (Pharos, Light Conversion, Vilnius, Lithuania) we then selectively ablated the PDMS layer. In a subsequent laser process, through holes with a diameter of 1.2 mm were drilled through both the PDMS and the glass, resulting in the inlets and outlets. The parameters for both laser processes are listed in Table 1. After another plasma treatment (Zepto, Diener, Ebhausen, Germany) of both PDMS surfaces, alignment of both system halves was carried out in a mask aligner (EVG 420, EV Group, St. Florian am Inn, Austria). Permanent bonding was achieved through oxygen plasma treatment, as described above. As the same molded PDMS slab was used, the channel system and the cell traps where identical for both configurations, except for the measurement chamber height which was doubled.

Figure 3. Schematic cross sectional view of the two system configurations with the hypha either (A) on the floor (floor configuration) or (B) in the vertical center (center configuration) of the measurement chamber. The bond line for both systems is depicted in red.
2.4 Fluid handling
To be able to apply fluid flow to the microfluidic chip, we designed a chip holder using Solidworks CAD software (Dassault Systems, Vélizy-Villacoublay, France) and 3D-printed it with a high-precision inkjet printer (Agilista, Keyence, Osaka, Japan). The chip holder comprised two plates between which the microfluidic chip was clamped, as shown in Figure 4A. Fluidic connection channels with a diameter of 1 mm were integrated into the top plate, which contacts the PDMS side of the system. These channels were arranged to interface the system in- and outlets. Female M6 fluidic connector ports were located at the other end of these channels, enabling the connection of PTFE tubing to the microfluidic chip. These were connected to syringes installed in syringe pumps (AL-1000, World Precision Instruments, Sarasota, United States). The syringe pumps and the assembled chip holder are shown in Figure 4B. For the loading flow, 3 mL (Norm-Ject, Henke-Sass Wolf GmbH, Tuttlingen, Germany) syringes were used, while for the measurement flow we chose a 2.5 mL glass syringe (SETonic GmbH, Illmenau, Germany).
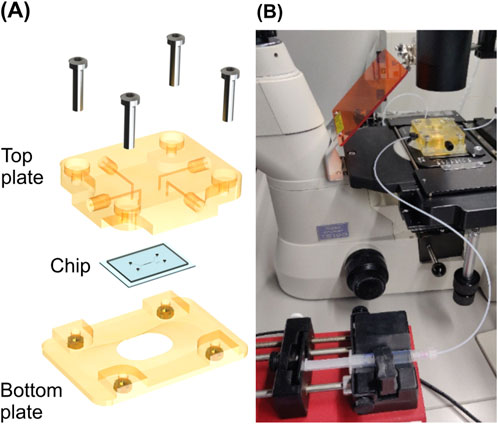
Figure 4. Measurement set up. (A) Chip holder used for fixating and interfacing of the chip during fluidic experiments. (B) Set up for bending experiments with a connected syringe pump in the foreground and the chip holder installed on the stage of the inverted microscope in the background.
2.5 CFD simulation
In order to enhance comprehension of the fluid-induced forces, we conducted a CFD simulation of the measurement flow around the hypha using the software ANSYS Fluent (V. 2023 R2, Ansys Inc., Cacnonsburg, Pennsylvania, United States). We used a model of a 500 µm long section of the measurement chamber with a rectangular profile and a rigid hypha positioned in the vertical channel center. We further selected velocity inlet and outflow as the inlet and outlet boundary conditions, respectively. The walls were modelled without slip and a symmetry condition was applied at the symmetry plane of the geometry to reduce computational cost. The geometry was discretized using a tetrahedral mesh, with refinement of mesh size on and near the surface of the hypha. A fully laminar flow model was used for the calculations.
2.6 Flow measurements
For the purpose of quantifying the forces exerted on the hyphae by the flow and to verify the theoretical flow profile, we investigated the measurement flow using Micro Particle Image Velocimetry (µPIV). We measured the particle-laden flow in the xy-plane over the entire height of the measurement chamber in z-steps of 3 μm to assess the entire flow field. To ensure good agreement of particle flow paths and flow stream lines, fluorescent particles with a mean diameter of 0.86 µm (Fluoro-Max, Thermo Fisher Scientific Inc., Waltham, United States) were chosen. The μPIV system used in this study (FlowMaster, LaVision, Göttingen, Germany) was equipped with a Nd-YAG double-pulse laser emitting at a wavelength of 532 nm at a pulse duration of 5 μs. The maximum double pulse repetition rate is 25 Hz. For each z-position, 20 individual measurements were taken, each consisting of two double frames. The time interval between the double frames was adjusted within the range of 10–100 μs, depending on the applied volume flow. This resulted in an offset of approximately 10 pixels between the double frames. To extract the velocity field across a channel cross-section, the PIV evaluation software DaVis 10 (LaVision, Göttingen, Germany) was used to evaluate the 20 single measurements per z-position by applying the implemented sum of correlation algorithm (Meinhart et al., 2000). The results for the individual z-positions were then stacked to obtain the flow field.
2.7 Fungal strain and growth media
The A. niger strain SKAn1015 (Zuccaro et al., 2008) was used as the organism in this study due to its extensive history of research on various aspects of its cultivation and biology (Priegnitz et al., 2012). To produce the spore suspension, spores were collected from a sporulating agar plate using a cotton swab and then spread onto a fresh agar plate. The newly inoculated agar was then incubated at 37°C for 4 days until excessive sporulation was visible. To obtain a spore suspension, the plate was flooded with a 0.9% NaCl solution and gently scrubbed with another cotton swab to loosen the spores. Next, a filtration step was performed using Miracloth filtration paper (Merck, pore size 22–25 µm) to remove any mycelial compounds or other unwanted contaminants from the agar plate. The spore suspension obtained was stored at 4°C for a maximum of 7 days before being used in experiments. For cultivation, a minimal medium containing 22 g L−1 glucose as carbon source, 0.5 g L−1 MgSO4·7H2O, 20 mL L−1 salt solution (26.1 g L−1 KCl, 74.8 g L−1 KH2PO4 and 250 g L−1 NaNO3) and 1 mL L−1 trace element solution (10 g L−1 EDTA, 4.4 g L−1 ZnSO4 7H2O, 1 g L−1 MnCl2 4H2O, 0.315 g L−1 CuSO4 5H2O, 2.5 g L−1 FeSO4·7H2O, 0.32 g L−1 CoCl2 6H2O, 1.47 g L−1 CaCl2 2H2O CaCl2·2H2O and 0.22 g L−1 (NH4)6Mo7O24 4H2O) was used. The carbon source and the other ingredients were sterilyzed separately in an autoclave before mixing. Afterwards, the whole solution was adjusted to a pH of 3 with HCl (3 M).
2.8 Procedure for conducting and evaluating bending tests
Spores were loaded into a microfluidic chip installed in the chip holder. For this a spore suspension of 106 spores per mL in minimal medium was used to infuse spores with a syringe pump at an average flow velocity of 3 mm s−1. After the first spores had entered the loading chamber, the syringes were exchanged and the infusion through the loading inlet was continued with filtered minimal medium. The immobilized spores where incubated at 37°C. A constant low infusion rate of 5 μL h−1 on the loading and measuring side ensured that no negative pressure gradient from measuring chamber to loading chamber would result in the dislodging of immobilized spores, while maintaining a constant supply with fresh medium. When germinated hyphae had reached the measurement chamber, usually about 20–24 h after cultivation start, a varying set of volume flow rates in the range of 0–50 μL min−1 was applied. The bending experiments were conducted with the chip holder fixed on the object table of an inverted microscope (TS200e, Nikon Corporation, Minato, Japan) and filmed with a high resolution camera (MikroLive MultiFormat, Schifferstadt, Germany) equipped with a multi-format CMOS sensor (5472
2.8.1 From flow to force
For calculation of the fluid-induced forces, we considered the hypha inside the measurement chamber of width w and height h as sketched in Figure 5A. Treating the hypha as a rigid circular cylinder, the flow-induced forces can be derived from the Stokes equations (Lamb, 1911). In the case of microfluidic bending tests in floor configuration, the analytical solution for a cylinder lying on a rigid surface oriented perpendicular to flow direction has been used to calculate the flow-induced force (Schubert, 1967; Amir et al., 2014; Caspi, 2014; Couttenier et al., 2022). The force is proportional to the unperturbed velocity gradient in z-direction at the wall
with the volume flow rate
where
to effectively double the force per unit length along the hyphal tip. The integral representation is also shown in Figure 5B.
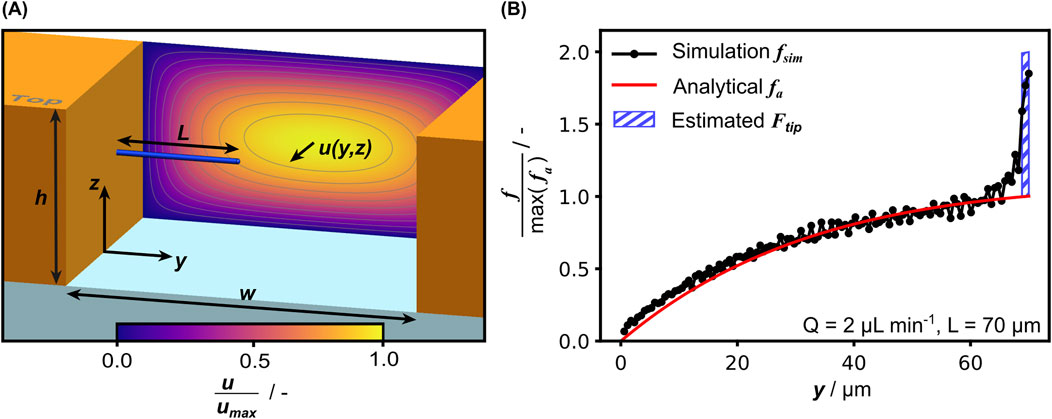
Figure 5. (A) Schematic isometric view of the open channel with a hypha in the center configuration and the Poiseuille velocity field in the background. (B) Comparison of the force per unit length as calculated with Equation 2 and extracted from CFD simulation results, normalized with the maximum of the analytically calculated value. The integral representation of the estimated
2.8.2 Calculation of the bending stiffness
The Euler-Bernoulli beam theory for a beam with constant cross section was applied to calculate the hyphal bending stiffness from the measured tip displacement and the calculated hydrodynamic loads. For this purpose the initial angle
with the bending stiffness
was used to deduce the bending stiffness from observed tip deflections, where
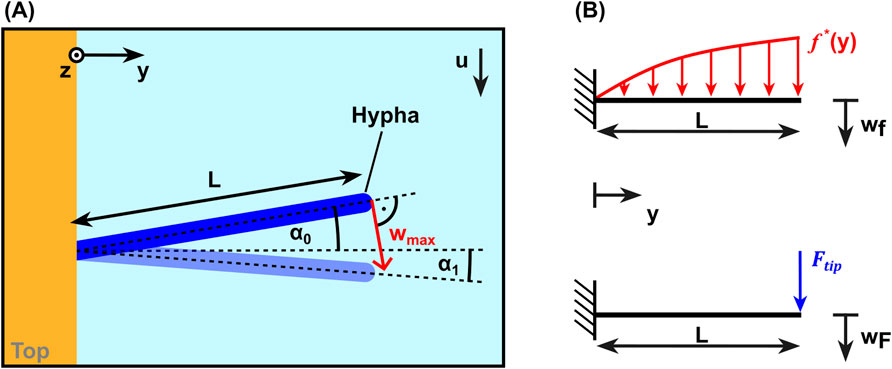
Figure 6. (A) Schematic top view of a hypha without flow (dark blue) and in bent state (light blue) defining parameters used for data analysis. (B) Schematic free body diagrams for the loads considered: the analytical force per unit length on a cylinder (above) and the estimated tip force (below).
3 Results
3.1 Spore immobilization and on chip hyphal growth
Before conducting bending experiments, spores were introduced into the system and immobilized at the entrances of the growth channels. With a loading flow rate of 108 μL min−1 and a spore concentration of 106 spores mL−1, an immobilization rate of 85% was achieved (number of cell traps filled with at least one spore vs. total trap number). The germination and growth process of the hyphae was monitored via white light microscopy in time steps of 4 h while minimizing the time the system was taken out of the incubator. Figure 7 shows representative results of this loading step and the subsequent incubation. Although most of the loaded traps had at least one spore that germinate during the experiment, in this representative case only a small fraction of 6 in total grew into the growth channels and reached the measurement area within the first 24 h. Most spores germinated and grew towards the loading chamber instead of the growth channels, which might be attributed to the small incubation flow of fresh minimal medium both chambers where constantly infused with. As stated in section 2.8, we chose this to prevent dislodging of the immobilized spores. After 42 h, 40 hyphae had reached the measurement area, while 48 hyphae had reached the measurement area by the end of the cultivation (t = 52 h). This delayed strong increase in number of hyphae entering the measurement chamber can be attributed to the germination behavior of A. niger conidia. When exposed to favourable conditions after a certain time delay, the conidia first undergo isotropic swelling before germinating later (Meyer et al., 2015). In fact, the swelling can be observed in Figure 7 as a subtle increase of the spore diameters during the first 16 h of incubation. The germination time from cultivation start however differs from spore to spore, leading to a pronounced s-shape of the plotted cumulative number of germinated hyphae over time (Ijadpanahsaravi et al., 2022). While all spores initially came into contact with liquid growth medium at the same time, some thus germinated much earlier than most others. This lead to these few early hyphae growing long distances in the measurement area before others even reached it, later interfering with bending experiments of younger hyphae. The average growth rate inside the growth channels derived from images such as those depicted in Figure 7 is 5.34 ± 2.63 μm h−1, meaning by average it took a hypha about 7.5 h to reach the measurement chamber after germination or entering the growth channel.
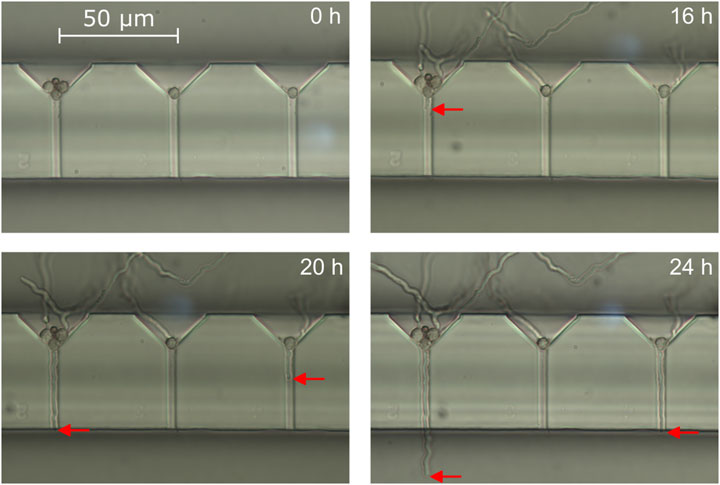
Figure 7. Light microscopy images of three growth channels in a system in floor configuration showing immobilized spores after 0, 16, 20 and 24 h of incubation. The red arrow marks the position of the hyphal tips growing through the channels towards the measurement area.
3.2 Determination of flow-induced force
In order to verify the theoretical flow profile and calculate the corresponding flow-induced forces, the entire flow field over the cross-section was investigated via µPIV. In Figure 8A the results of µPIV measurements of the flow velocity profile in the measurement chamber are depicted. Together with the knowledge about the actual chamber cross-section dimensions acquired from microscopy measurements (data not shown), this data was used to fit the analytical solution for the Poiseuille velocity field in a channel with rectangular cross-section. Although the measured horizontal profile over the chamber width agrees well with the theoretical profile (see Figure 8C), the vertical profile over the channel height in Figure 8B shows significant deviations near the horizontal walls. The velocity does not reach zero but remains at approximately 30% of the maximum velocity at the center. The reason for this lies in the field of depth, which is not restricted to a defined focal plane. Even particles that are just out of focus and therefore slightly blurred are still captured. This means that flowing particles are still detected even though the focal plane is already outside the chamber (Rossi et al., 2012). Therefore, we used the volume flow rate derived from the fit to the horizontal profile in Figure 8C to calculate the fluid-induced force per unit length. Its progression is shown in Figure 8D for both configurations, where the maximal achieved force per unit length at
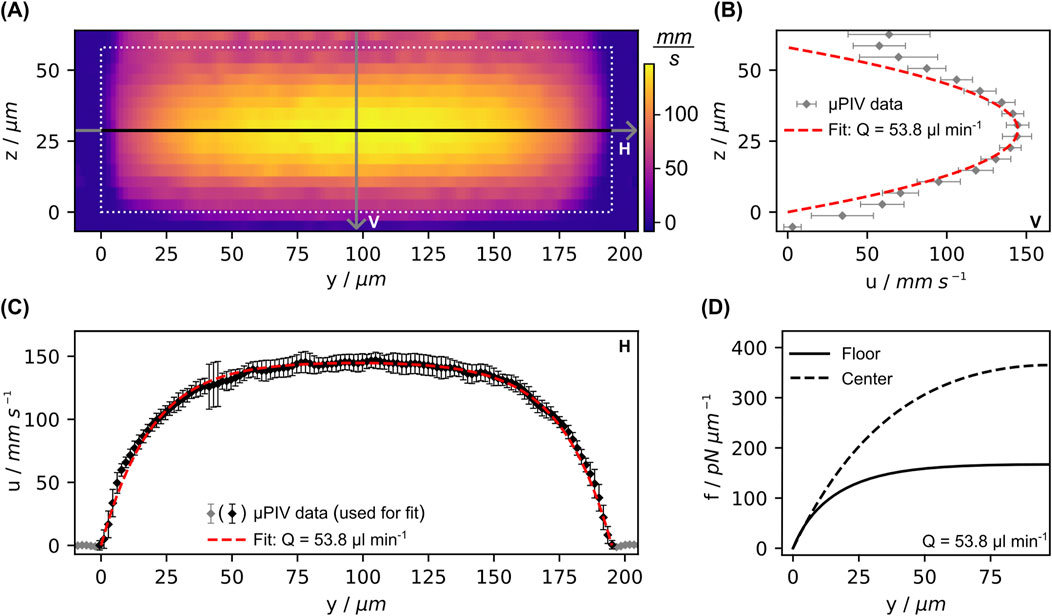
Figure 8. Results from µPIV measurements in the measurement chamber. (A) Full measured velocity field (x-component) over the cross-section of the measurement chamber half way between in- and outlet. (B, C) provide thereof extracted profiles vertically (V) and horizontally (H) through the center, as indicated by the labeled lines in (A). (D) Progression of the distributed force calculated from the fit for both configurations, for equations see SI. Error bars indicate the standard deviation of the average along x-direction.
3.3 Measurement of the bending stiffness
When the first hyphae had reached the measurement chamber such that a minimal hyphal length of 30 µm was exposed, bending flows were applied to measure the bending stiffness. In Figure 9A, the exemplary results of a bending test in floor configuration at different flow rates are shown. The depicted hypha was exposed along a length of 46 µm. For every volume flow rate the tip deflection derived from the microscopy images is plotted in Figure 9B. With the assumptions discussed earlier, the term
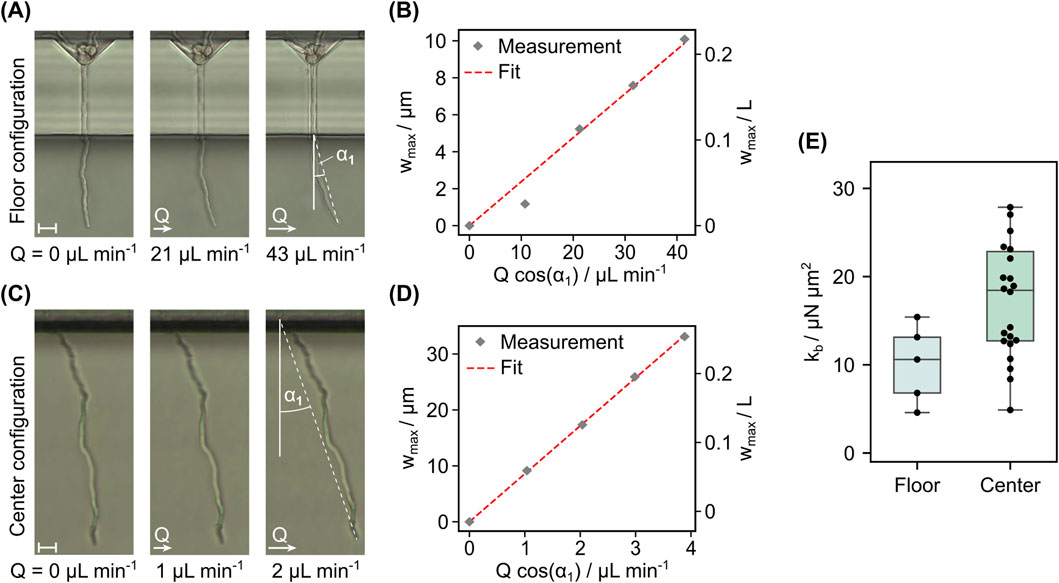
Figure 9. Results from bending experiments for floor and center configuration. (A) Frames recorded during a bending experiment with increasing flow rates in floor configuration and (B) values of tip deflection extracted from these frames versus the applied volume flow rate scaled by the equilibrium tilt angle. The fit used to extract
4 Discussion
The definition of the second moment of inertia for a circular ring cross section can be used to calculate the corresponding longitudinal Young’s Modulus of the hyphal cell wall
5 Conclusion
To the authors best knowledge, the presented work is the first reported measurement of the bending stiffness of single A. niger hyphae and among few works that tackle their micro-mechanical properties. The here derived elasticity of the cell wall still complies well with those reported by these scarce works (Günther, 2015; Zheng et al., 2017). The presented symmetrical system in center configuration advances the microfluidic bending technique in addressing key shortcomings of the previously published designs (Nezhad et al., 2013; Amir et al., 2014; Caspi, 2014; Couttenier et al., 2022). Due to the positioning of the hypha in the vertical center of the measurement flow, the problem of adhesion or friction to the glass surface is eliminated. This leads to virtually all hyphae growing into the measurement flow being deflectable and thus drastically increases specimen number per cultivation. Despite this significant advantage of the center configuration, a compromise has to be made regarding the in plane growth, as the hyphae lack the growth guidance of the glass surface. However, even though in both configurations hyphae regularly grew out of the measurement plane in z-direction, in the case of the center configuration this is less critical to the measured bending stiffness. This is because the actual deviation from the calculated load in the measurement plane is expected to be small for moderate out of plane growth, owing to the low velocity gradient in z-direction close to the measurement plane. Thanks to the fabrication of the negative mould using two-photon polymerization, a real-3D conical funnel shape could be realized, yielding a high shape conformity between spherical spore and cell trap. This effectively eliminated the need for any adhesion promoting surface treatment, as it was used by Couttenier et al. (2022) in their systems or the introduction of design alterations, like kinks, in the path of the growth channels to secure hyphal fixation during measurements (Nezhad et al., 2013).
Altogether, the microfluidic bending test in center configuration is a promising tool for parallelized studies of the mechanical properties of filamentous cells, as evidenced by the significant improvement in the measurement yield per experiment compared to the conventional floor configuration design. This enables statistically significant results on the influence of environmental factors on the bending stiffness of the cells within singular on chip cultivation measurements. As opposed to AFM force spectroscopy, the presented system demonstrates the capability to measure cell wall properties without the need for any further handling of the live cells, enabling the non-invasive monitoring of mechanical markers during cultivation. Future work will aim at the application of the methodology to different pharmaceutically relevant species such as actinomycetes for a better understanding of the cultivation process. Another focus will be the integration of sensors into the microfluidic system, such as a passive 2 PP-fabricated flow sensor to aid data analysis as well as the monitoring of the cultivation conditions inside the microsystem. Finally, to be able to study the individual growth morphology in more detail and to incorporate it into the data analysis, we aim at integrating live monitoring of the 3D-shape during tests by combining our implemented protocol with confocal microscopy. In summary, our presented work provides a basis for resolved and detailed on-chip study of filamentous cultures and their mechanics.
Data availability statement
The raw data supporting the conclusions of this article will be made available by the authors, without undue reservation.
Author contributions
SB: Conceptualization, Data curation, Investigation, Methodology, Software, Visualization, Writing–original draft, Writing–review and editing, Formal Analysis, Validation. MS: Conceptualization, Methodology, Writing–review and editing. SM: Conceptualization, Methodology, Writing–review and editing. IK: Conceptualization, Project administration, Resources, Supervision, Writing–review and editing. AK: Resources, Supervision, Writing–review and editing. AD: Resources, Supervision, Writing–review and editing.
Funding
The author(s) declare that financial support was received for the research, authorship, and/or publication of this article. The authors gratefully acknowledge the financial support for parts of the work provided by the German Research Foundation (DFG) in the priority programme “DiSPBiotech–Dispersity, structural and phase modifications of proteins and biological agglomerates in biotechnological processes” (SPP 1934, project number 315457657). We acknowledge the support by the Open Access Publication Funds of the Technische Universität Braunschweig.
Acknowledgments
The authors would like to express their gratitude to Mathias Müsken of the Central Facility for Microscopy (ZEIM) of Helmholtz Center for Infection Research (HZI, Braunschweig, Germany) for conducting TEM measurements of hyphal cross sections. The authors used deepl.com in order to improve the quality of the written English. After the usage of this tool, the authors reviewed and edited the text as needed and take full responsibility for content of the publication.
Conflict of interest
The authors declare that the research was conducted in the absence of any commercial or financial relationships that could be construed as a potential conflict of interest.
The author(s) declared that they were an editorial board member of Frontiers, at the time of submission. This had no impact on the peer review process and the final decision.
Publisher’s note
All claims expressed in this article are solely those of the authors and do not necessarily represent those of their affiliated organizations, or those of the publisher, the editors and the reviewers. Any product that may be evaluated in this article, or claim that may be made by its manufacturer, is not guaranteed or endorsed by the publisher.
Supplementary material
The Supplementary Material for this article can be found online at: https://www.frontiersin.org/articles/10.3389/fbioe.2024.1449167/full#supplementary-material
References
Aleklett, K., Ohlsson, P., Bengtsson, M., and Hammer, E. C. (2021). Fungal foraging behaviour and hyphal space exploration in micro-structured Soil Chips. ISME J. 15, 1782–1793. doi:10.1038/s41396-020-00886-7
Amir, A., Babaeipour, F., McIntosh, D. B., Nelson, D. R., and Jun, S. (2014). Bending forces plastically deform growing bacterial cell walls. Proc. Natl. Acad. Sci. U. S. A. 111, 5778–5783. doi:10.1073/pnas.1317497111
Arfsten, J., Kampen, I., and Kwade, A. (2009). Mechanical testing of single yeast cells in liquid environment: effect of the extracellular osmotic conditions on the failure behavior. Int. J. Mater. Res. 100, 978–983. doi:10.3139/146.110141
Arfsten, J., Leupold, S., Bradtmöller, C., Kampen, I., and Kwade, A. (2010). Atomic force microscopy studies on the nanomechanical properties of Saccharomyces cerevisiae. Colloids Surf. B Biointerfaces 79, 284–290. doi:10.1016/j.colsurfb.2010.04.011
Ayazi Shamlou, P., Makagiansar, H. Y., Ison, A. P., Lilly, M. D., and Thomas, C. R. (1994). Turbulent breakage of filamentous microorganisms in submerged culture in mechanically stirred bioreactors. Chem. Eng. Sci. 49, 2621–2631. doi:10.1016/0009-2509(94)E0079-6
Böl, M., Schrinner, K., Tesche, S., and Krull, R. (2021). Challenges of influencing cellular morphology by morphology engineering techniques and mechanical induced stress on filamentous pellet systems-A critical review. Eng. Life Sci. 21, 51–67. doi:10.1002/elsc.202000060
Busche, J. F., Starke, G., Knickmeier, S., and Dietzel, A. (2020). Controllable dry adhesion based on two-photon polymerization and replication molding for space debris removal. Micro Nano Eng. 7, 100052. doi:10.1016/j.mne.2020.100052
Cairns, T. C., Nai, C., and Meyer, V. (2018). How a fungus shapes biotechnology: 100 years of Aspergillus Niger research. Fungal Biol. Biotechnol. 5, 13. doi:10.1186/s40694-018-0054-5
Caspi, Y. (2014). Deformation of filamentous Escherichia coli cells in a microfluidic device: a new technique to study cell mechanics. PloS One 9, e83775. doi:10.1371/journal.pone.0083775
Chevalier, L., Pinar, M., Borgne, R. L., Durieu, C., Peñalva, M. A., Boudaoud, A., et al. (2023). Cell wall dynamics stabilize tip growth in a filamentous fungus. PLOS Biol. 21, e3001981. doi:10.1371/journal.pbio.3001981
Couttenier, E., Bachellier-Bassi, S., d’Enfert, C., and Villard, C. (2022). Bending stiffness of Candida albicans hyphae as a proxy of cell wall properties. Lab. Chip 22, 3898–3909. doi:10.1039/D2LC00219A
El-Enshasy, H., Kleine, J., and Rinas, U. (2006). Agitation effects on morphology and protein productive fractions of filamentous and pelleted growth forms of recombinant Aspergillus Niger. Process Biochem. 41, 2103–2112. doi:10.1016/j.procbio.2006.05.024
Garoff, H., and Ansorge, W. (1981). Improvements of DNA sequencing gels. Anal. Biochem. 115, 450–457. doi:10.1016/0003-2697(81)90031-2
Grimm, L. H., Kelly, S., Krull, R., and Hempel, D. C. (2005). Morphology and productivity of filamentous fungi. Appl. Microbiol. Biotechnol. 69, 375–384. doi:10.1007/s00253-005-0213-5
Günther, S. (2015). Mechanische Charakterisierung von Hyphen, Mikroalgen und Biofilmen, 1. Göttingen: Aufl. Sierke.
Harper, E. Y., and Chang, I.-D. (1967). Drag on a cylinder between parallel walls in Stokes’ flow. Phys. Fluids 10, 83–88. doi:10.1063/1.1761999
Ijadpanahsaravi, M., Teertstra, W. R., and Wösten, H. A. B. (2022). Inter- and intra-species heterogeneity in germination of Aspergillus conidia. Ant. Van Leeuwenhoek 115, 1151–1164. doi:10.1007/s10482-022-01762-4
Jensen, A. L., Sørensen, H., Rosendahl, L., Adamsen, P., and Lykholt-Ustrup, F. (2016). Investigation of drag force on fibres of bonded spherical elements using a coupled CFD-DEM approach. Available at: https://vbn.aau.dk/ws/portalfiles/portal/256310120/Investigation_of_Drag_Force_on_Fibres_of_Bonded_Spherical_Elements_using_a_Coupled_CFD_DEM_Approach.pdf.
Krull, R., Wucherpfennig, T., Esfandabadi, M. E., Walisko, R., Melzer, G., Hempel, D. C., et al. (2013). Characterization and control of fungal morphology for improved production performance in biotechnology. J. Biotechnol. 163, 112–123. doi:10.1016/j.jbiotec.2012.06.024
Lamb, H. (1911). XV. On the uniform motion of a sphere through a viscous fluid. Lond. Edinb. Dublin Philos. Mag. J. Sci. 21, 112–121. doi:10.1080/14786440108637012
Lin, P.-J., Scholz, A., and Krull, R. (2010). Effect of volumetric power input by aeration and agitation on pellet morphology and product formation of Aspergillus Niger. Biochem. Eng. J. 49, 213–220. doi:10.1016/j.bej.2009.12.016
Ma, H., Snook, L. A., Kaminskyj, S. G. W., and Dahms, T. E. S. (2005). Surface ultrastructure and elasticity in growing tips and mature regions of Aspergillus hyphae describe wall maturation. Microbiology 151, 3679–3688. doi:10.1099/mic.0.28328-0
Meinhart, C. D., Wereley, S. T., and Santiago, J. G. (2000). A PIV algorithm for estimating time-averaged velocity fields. J. Fluids Eng. 122, 285–289. doi:10.1115/1.483256
Meurer, A., Smith, C. P., Paprocki, M., Čertík, O., Kirpichev, S. B., Rocklin, M., et al. (2017). SymPy: symbolic computing in Python. PeerJ Comput. Sci. 3, e103. doi:10.7717/peerj-cs.103
Meyer, V., Andersen, M. R., Brakhage, A. A., Braus, G. H., Caddick, M. X., Cairns, T. C., et al. (2016). Current challenges of research on filamentous fungi in relation to human welfare and a sustainable bio-economy: a white paper. Fungal Biol. Biotechnol. 3, 6. doi:10.1186/s40694-016-0024-8
Meyer, V., Fiedler, M., Nitsche, B., and King, R. (2015). The cell factory Aspergillus enters the big data era: opportunities and challenges for optimising product formation. Adv. Biochem. Eng. Biotechnol. 149, 91–132. doi:10.1007/10_2014_297
Nezhad, A. S., Naghavi, M., Packirisamy, M., Bhat, R., and Geitmann, A. (2013). Quantification of the Young’s modulus of the primary plant cell wall using Bending-Lab-On-Chip (BLOC). Lab. Chip 13, 2599–2608. doi:10.1039/c3lc00012e
Nielsen, J., Johansen, C. L., Jacobsen, M., Krabben, P., and Villadsen, J. (1995). Pellet formation and fragmentation in submerged cultures of Penicillium chrysogenum and its relation to penicillin production. Biotechnol. Prog. 11, 93–98. doi:10.1021/bp00031a013
Overbeck, A., Kampen, I., and Kwade, A. (2015). Mechanical characterization of yeast cells: effects of growth conditions. Lett. Appl. Microbiol. 61, 333–338. doi:10.1111/lam.12468
Overbeck, A., Michel, S., Kampen, I., and Kwade, A. (2023). Temperature influence on the compression and breakage behaviour of yeast cells. Lett. Appl. Microbiol. 76, ovad089. doi:10.1093/lambio/ovad089
Pazouki, M., and Panda, T. (2000). Understanding the morphology of fungi. Bioprocess Eng. 22, 0127–0143. doi:10.1007/s004490050022
Priegnitz, B.-E., Wargenau, A., Brandt, U., Rohde, M., Dietrich, S., Kwade, A., et al. (2012). The role of initial spore adhesion in pellet and biofilm formation in Aspergillus Niger. Fungal Genet. Biol. 49, 30–38. doi:10.1016/j.fgb.2011.12.002
Rossi, M., Segura, R., Cierpka, C., and Kähler, C. J. (2012). On the effect of particle image intensity and image preprocessing on the depth of correlation in micro-PIV. Exp. Fluids 52, 1063–1075. doi:10.1007/s00348-011-1194-z
Schindelin, J., Arganda-Carreras, I., Frise, E., Kaynig, V., Longair, M., Pietzsch, T., et al. (2012). Fiji: an open-source platform for biological-image analysis. Nat. Methods 9, 676–682. doi:10.1038/nmeth.2019
Schubert, G. (1967). Viscous flow near a cusped corner. J. Fluid Mech. 27, 647–656. doi:10.1017/S0022112067002526
Serrano-Carreón, L., Galindo, E., Rocha-Valadéz, J. A., Holguín-Salas, A., and Corkidi, G. (2015). “Hydrodynamics, fungal physiology, and morphology,” in Filaments in bioprocesses. Editors R. Krull, and T. Bley (Cham: Springer International Publishing), 55–90.
Stocks, S. M., and Thomas, C. R. (2001). Strength of mid-logarithmic and stationary phase Saccharopolyspora erythraea hyphae during a batch fermentation in defined nitrate-limited medium. Biotechnol. Bioeng. 73, 370–378. doi:10.1002/bit.1070
Toma, M. K., Ruklisha, M. P., Vanags, J. J., Zeltina, M. O., Lelte, M. P., Galinine, N. I., et al. (1991). Inhibition of microbial growth and metabolism by excess turbulence. Biotechnol. Bioeng. 38, 552–556. doi:10.1002/bit.260380514
Waldherr, P., Bliatsiou, C., Böhm, L., and Kraume, M. (2023). Fragmentation of Aspergillus Niger pellets in stirred tank bioreactors due to hydrodynamic stress. Chem. Eng. Res. Des. 195, 116–131. doi:10.1016/j.cherd.2023.05.038
Walisko, R., Moench-Tegeder, J., Blotenberg, J., Wucherpfennig, T., and Krull, R. (2015). “The taming of the shrew - controlling the morphology of filamentous eukaryotic and prokaryotic microorganisms,” in Filaments in bioprocesses. Editors R. Krull, and T. Bley (Cham: Springer International Publishing), 1–27.
Wu, P.-H., Aroush, D. R.-B., Asnacios, A., Chen, W.-C., Dokukin, M. E., Doss, B. L., et al. (2018). A comparison of methods to assess cell mechanical properties. Nat. Methods 15, 491–498. doi:10.1038/s41592-018-0015-1
Wucherpfennig, T., Hestler, T., and Krull, R. (2011). Morphology engineering - osmolality and its effect on Aspergillus Niger morphology and productivity. Microb. Cell Factories 10, 58. doi:10.1186/1475-2859-10-58
Wucherpfennig, T., Kiep, K. A., Driouch, H., Wittmann, C., and Krull, R. (2010). Morphology and rheology in filamentous cultivations. Adv. Appl. Microbiol. 72, 89–136. doi:10.1016/S0065-2164(10)72004-9
Zhao, L., Schaefer, D., Xu, H., Modi, S. J., LaCourse, W. R., and Marten, M. R. (2005). Elastic properties of the cell wall of Aspergillus nidulans studied with atomic force microscopy. Biotechnol. Prog. 21, 292–299. doi:10.1021/bp0497233
Zheng, W., Yang, H., Xuan, G., Dai, L., Hu, Y., Hu, S., et al. (2017). Longitudinal study of the effects of environmental pH on the mechanical properties of Aspergillus Niger. ACS Biomater. Sci. Eng. 3, 2974–2979. doi:10.1021/acsbiomaterials.6b00294
Keywords: cell wall, hyphae, Aspergillus niger, bending stiffness, fungi-on-chip, two-photon polymerization
Citation: Brinkmann S, Schrader M, Meinen S, Kampen I, Kwade A and Dietzel A (2024) Highly parallel bending tests for fungal hyphae enabled by two-photon polymerization of microfluidic mold. Front. Bioeng. Biotechnol. 12:1449167. doi: 10.3389/fbioe.2024.1449167
Received: 17 June 2024; Accepted: 11 October 2024;
Published: 01 November 2024.
Edited by:
Ronnie Guy Willaert, Vrije University Brussels, BelgiumReviewed by:
Catherine Villard, UMR8236 Laboratoire Interdisciplinaire des Energies de Demain (LIED), FranceEnrico Domenico Lemma, Karlsruhe Institute of Technology (KIT), Germany
Copyright © 2024 Brinkmann, Schrader, Meinen, Kampen, Kwade and Dietzel. This is an open-access article distributed under the terms of the Creative Commons Attribution License (CC BY). The use, distribution or reproduction in other forums is permitted, provided the original author(s) and the copyright owner(s) are credited and that the original publication in this journal is cited, in accordance with accepted academic practice. No use, distribution or reproduction is permitted which does not comply with these terms.
*Correspondence: Steffen Brinkmann, cy5icmlua21hbm5AdHUtYnJhdW5zY2h3ZWlnLmRl
 Steffen Brinkmann
 Marcel Schrader
 Sven Meinen
 Ingo Kampen1,3
 Arno Kwade
 Andreas Dietzel