
ORIGINAL RESEARCH article

Front. Bioeng. Biotechnol., 05 July 2024
Sec. Biomaterials
This article is part of the Research Topic Biomedical Biodegradable Matrices and Composites View all 4 articles

Accelerated degradation testing impacts the degradation processes in 3D printed amorphous PLLA

  • Department of Materials Science and Metallurgy, Cambridge Centre for Medical Materials, University of Cambridge, Cambridge, United Kingdom

Additive manufacturing and electrospinning are widely used to create degradable biomedical components. This work presents important new data showing that the temperature used in accelerated tests has a significant impact on the degradation process in amorphous 3D printed poly-l-lactic acid (PLLA) fibres. Samples (c. 100 μm diameter) were degraded in a fluid environment at 37°C, 50°C and 80°C over a period of 6 months. Our findings suggest that across all three fluid temperatures, the fibres underwent bulk homogeneous degradation. A three-stage degradation process was identified by measuring changes in fluid pH, PLLA fibre mass, molecular weight and polydispersity index. At 37°C, the fibres remained amorphous but, at elevated temperatures, the PLLA crystallised. A short-term hydration study revealed a reduction in glass transition (Tg), allowing the fibres to crystallise, even at temperatures below the dry Tg. The findings suggest that degradation testing of amorphous PLLA fibres at elevated temperatures changes the degradation pathway which, in turn, affects the sample crystallinity and microstructure. The implication is that, although higher temperatures might be suitable for testing bulk material, predictive testing of the degradation of amorphous PLLA fibres (such as those produced via 3D printing or electrospinning) should be conducted at 37°C.

1 Introduction

Additive manufacturing has the potential to revolutionise medical device fabrication. The range of potential applications is considerable, encompassing everything from drug delivery devices (Bácskay et al., 2022), to stents (Guerra et al., 2018), screws (MacLeod et al., 2020), meshes (Ren et al., 2022) and 3D printed organs (George et al., 2023). Much research focuses on the concept of personalised device fabrication, producing devices that perfectly match the individual patient requirements (Nagarajan et al., 2018). This in turn could pave the way to a reduction in recovery time, material wastage or device cost (Goyanes et al., 2015; Qamar et al., 2019). Similarly, electrospinning has been used to fabricate scaffolds for a variety of biomedical applications including cartilage repair (Castilho et al., 2019), bone tissue regeneration (Lee et al., 2013) and tendons or ligaments (Hochleitner et al., 2018). The deposited scaffold architectures are highly controllable, forming structures that can mimic the native tissue environment (Kai et al., 2014).

Poly-L-lactic acid (PLLA) is an example of a widely used man-made poly (α-hydroxy ester). As a material, PLLA is commonplace within 3D printing and electrospinning, which combined with its good biocompatibility (Wang et al., 2017), has led to it being suggested for a range of biomedical applications (Tamai et al., 2000; Song et al., 2017; Yoon et al., 2017; Singh et al., 2019; Zhao et al., 2020; Hu et al., 2021; Jumat et al., 2021). Crucial to its success is the ability to tailor the deposited microstructure to the target application. Roper et al. have shown that the chain alignment of PLLA can be controlled during the 3D printing of thin (100 μm) single layer lines (Roper et al., 2022). The resulting microstructure was found to be aligned but amorphous. These lines could be utilised in the manufacture of thin polymeric struts, with the deposited thickness matching the requirements for certain mesh applications (de Tayrac et al., 2008) or within blood flowing areas (McCormick et al., 2018), where previous thick PLLA structures have resulted in long term thrombosis issues (Ali et al., 2018; Sakamoto et al., 2018).

One of the major advantages of PLLA as a biomedical material is its ability to degrade in-vivo in a controlled manner over a long time frame. The degradation produces harmless by-products that can be processed naturally via the Cori cycle (da Silva et al., 2018). However, this specific advantage (its long degradation time), is also a major drawback for studying the material within a research setting. PLLA requires several years to completely degrade within the body or similar in vitro conditions. As a result, many researchers use accelerated degradation testing to speed up the process. Accelerated degradation testing of poly (α-hydroxy esters) can take multiple forms but often involves either elevated temperatures (Weir et al., 2004a) or harsh chemical environments (Vasanthan and Ly, 2009; Chausse et al., 2023). When elevated temperatures are applied, the Arrhenius equation is used to extrapolate to body temperature. The elevated temperatures can be divided into one of two categories: above the starting glass transition temperature (Tg) of the dry material or below. However, the validity and applicability of either category to predict the in-vivo lifespan require further investigation (Agrawal et al., 1997). When Weir et al. investigated the degradation behaviour of 0.8 mm thick annealed PLLA they raised concerns regarding the validity of accelerated degradation testing when the temperature was raised above the starting Tg of the dry material (Weir et al., 2004a). However, a study by Bergsma et al. involving 2 mm thick semi-crystalline PLLA concluded that temperatures above the starting Tg were suitable for predicting the in-vivo lifespan and degradation pathway (Bergsma et al., 1995). Additionally, fluid immersion has been shown to effect the Tg of the polymer (Vyavahare et al., 2014). Uncertainties persist regarding the validity of accelerated degradation testing to predict in-vivo lifespan and the temperatures that are appropriate to use.

The degradation pathway of PLLA is commonly characterised as a bulk degradation process, with the diffusion of fluid into the structure faster than the degradation rate of the polymer backbone (Pierre and Chiellini, 1987; Deb and Di Silvio, 2009; von Burkersroda et al., 2002). Initially, water or fluid is absorbed into the material. Several studies have suggested that within a semi-crystalline microstructure, the amorphous regions are selectively degraded first (Fischer et al., 1973; Li et al., 1990; Pistner et al., 1993; Tsuji and Ikada, 1997; Tsuji and Ikada, 1998; Tsuji et al., 2000; Chye et al., 2005), with the eventual degradation of crystalline domains shown to proceed from the edges inwards (Fischer et al., 1973).

The impact of manufacturing technique on the degradation rate needs to be carefully considered (Vaid et al., 2021). Chausse et al. previously investigated the degradation of 3D printed PLLA stents (starting strut thickness 120.9 μm) manufactured using solvent-cast direct-writing at 50°C. They concluded that the stents underwent a bulk degradation process (Chausse et al., 2023). However, all the stents were thermally treated at 80°C for 12 h before degradation testing, with the starting microstructure semi-crystalline. There is no agreed consensus regarding the influence of starting crystallinity on the degradation rate or behaviour, or the validity of extrapolating from a semi-crystalline microstructure to an amorphous microstructure (Li et al., 1990; Pistner et al., 1993; Duek et al., 1999; Tsuji et al., 2000; Pantani and Sorrentino, 2013). Therefore, for an starting amorphous microstructure, independent degradation testing at 37°C needs to be conducted.

Following the initial degradation of the polymer chain backbone, the diffusion of degradation products out of the structure is slow. Only when the molecular weight of the formed fragments and the surrounding material are sufficiently small, can they diffuse out of the structure, marking the onset of mass loss and pH change (Göpferich, 1997). In the time between the initial polymer chain degradation, but prior to the diffusion of the molecular weight fragments out of the structure, the degradation products can catalyse the reaction via autocatalysis (leading to heterogeneous bulk degradation) (Vert et al., 1991). However, autocatalysis has not been reported in all degradation studies and is strongly linked to the material starting thickness and the product’s diffusion path to the sample exterior. Multiple studies have found that with an increase in sample thickness, the degradation rate increases (Grizzi et al., 1995; Lu et al., 1999; Witt and Kissel, 2001). With an increase in sample thickness, the diffusion path for the release of degradation products is greater, and their build-up can then autocatalyse the reaction (Fu et al., 2000). However, the critical thickness at which autocatalysis becomes significant is highly dependent upon the starting polymer and manufacturing technique. Vaid et al. reported no evidence of autocatalysis in PLA fibres (starting material contained less than 2% D-isomer) 10–15 μm in diameter (Vaid et al., 2021). They suggested that the lack of a bulk erosion within their samples was due to their high starting crystallinity from the fibre-forming process and emphasised the importance of considering the starting microstructure when considering degradation behaviour. However, Li et al. reported the presence of autocatalysis for PLLA degraded at 37°C over 2 years for both a starting amorphous microstructure and a semi-crystalline microstructure (Li et al., 1990). In both materials, the starting thickness was 2 mm, significantly greater than Vaid et al. study. There is no clear consensus regarding a critical thickness for heterogeneous degradation of PLLA or the effect of materials processing history and starting microstructure on the subsequent degradation behaviour. A study needs to investigate whether autocatalysis occurs within amorphous material, with thickness relevant to future mesh applications.

This study aims to investigate how 100 μm thick 3D printed amorphous PLLA fibres degrade at 37°C. The research focuses on the changes that occur within the microstructure over 6 months. Additionally, this study aims to investigate the validity of accelerated temperature degradation and extrapolation back to 37°C. Three different temperatures are investigated: body temperature (37°C), an elevated temperature below the Tg of the dry material (50°C), and an elevated temperature above the dry Tg (80°C). Various tests including optical microscopy, X-ray diffraction (XRD), gel permeation chromatography (GPC), mechanical testing and differential scanning calorimetry (DSC) are used to characterise the resulting microstructure. Based on the new data, an approach for future PLLA degradation testing involving 3D printed amorphous fibres, with a starting thickness suitable for biodegradable stents and meshes, is suggested.

2 Materials and methods

2.1 Materials

PLLA (2500HP) NatureWorks pellets were extruded using a Noztek extruder at 182°C, 1,200 rpm with a 1.75 mm nozzle. Prior to printing, all extruded filament was vacuum dried for 24 h. A Prusa MK3s + Fused Filament Fabrication (FFF) printer, with a mounted Titan Extruder, was used. The Titan Extruder increased the gear ratio 3:1. The print bed was preheated to 55°C and the nozzle was preheated to 215°C. Samples were extruded from a 400 μm nozzle diameter, at a 3,000 mm/min print speed. A 200 μm PVA sacrificial support layer was used during printing, as defined in previous work (Roper et al., 2021). This printing setup created highly orientated but amorphous microstructures (Roper et al., 2022). For each sample approximately 10 PLLA lines 10 cm in length, approximately 100 μm thick and 450 μm wide were printed. An example of the starting cross section from samples produced under similar conditions can be seen in our previous work (Roper et al., 2021). The fibres were printed in the x direction with a final support line printed in the y direction to maintain line separation throughout the degradation. These support lines ensured that all fibres degraded homogeneously and were dried fully prior to final mass measurement.

2.2 Hydration study

To investigate the effect of fluid immersion on the glass transition, a short hydration study involving the as printed PLLA was conducted. Samples were immersed for 3 days in fluid at either 37°C or 50°C. After 3 days, a section of the sample was immediately placed into the DSC (while still hydrated). The remainder of the sample was vacuum dried for 3 days and then placed in the DSC. The DSC was run from 0 to 210°C, whilst under a 50 mL/min nitrogen flow rate, at a 10°C/min heating rate.

2.3 Degradation testing

After printing, the PVA was peeled off. Samples were then weighed and split into groups based on their degradation time and temperature. There were three samples for each degradation time and temperature, with the total starting group mass approximately the same. Samples were placed into 7 mL individual bijou tubes with phosphate buffer saline (PBS) pipetted on top in a sample mass to fluid ratio of 1 mg:125 mL. The bijou tubes were placed into one of three temperature-controlled environments (37°C, 50°C or 80°C). For PLLA degraded at 37°C or 50°C, samples were removed at days 15, 30, 50, 70, 100, 120 and 180. For PLLA degraded at 80°C, samples were removed at 30 min, 1 h, 2 h and 1, 2, 4, 7, 10, 14 and 22 days, due to the faster degradation at this temperature.

After the allocated degradation time, samples were filtered, washed twice in deionised water and vacuum dried for 3 days.

2.4 Sample characterisation

2.4.1 pH change

Following degradation and removal from the temperature controlled environment, the fluid pH was measured three times. The error in the pH measurement was determined by the resolution of the probe.

2.4.2 Mass loss

After 3 days of vacuum drying, samples were weighed three times to find their final dry mass. The percentage mass loss during degradation was calculated using Eq. (1).

ML=MfMsMs100(1)

where ML is the percentage mass lost, Mf final dry sample mass and Ms start mass.

The percentage error for each time and temperature was calculated by taking the standard deviation in mass loss for each sample and then using standard error propagation rules to combine all samples of the same degradation time and temperature.

2.4.3 Molecular weight

Gel-permeation chromatography (GPC) was conducted on a 1,260 Infinity II Multi-Detector GPC/SEC System at the University of Manchester, supported by the Henry Royce Institute for Advanced Materials. 10–15 mg of a dried sample was dissolved in chloroform (3 mg/mL). The dissolved samples were filtered through a 0.2 μm syringe prior to insertion into the machine. The flow volume was 100 μL, and a 1 mL/min flow rate was used. A polystyrene standard was used for calibration. Analysis was conducted using Aglient GPC/SEC software. GPC was conducted to find the number average molecular weight (Mn), weight average molecular weight and the polydispersity index (PDI). The GPC was run in three separate batches. Each time a batch was run, a NatureWorks PLLA pellet was run first. The spread in reported Mn values for the pellet generated a conservative 6.0% error in each reported Mn value and 8.3% error in the reported PDI value.

2.4.4 X-ray diffraction

Wide-angle X-ray scattering (WAXS) scans on dried samples were undertaken using a Bruker D8 Advance diffractometer with a Cu-Kα source (λ = 1.54059 Å). To quantify the change in crystallinity, a Rietveld refinement was carried out using Topas software V7.21. The Rietveld refinement used a least-squares fitting approach to map experimental data to a peak list. The peak list was generated using a computational structural model. A z-matrix for all 90 carbon, oxygen and hydrogen atoms, 89 bond lengths, 88 bond angles and 87 torsional angles was used as an input for the axisymmetric polymer unit. The data set was built using the work of Wasanusuk et al. (Wasanasuk et al., 2011), assuming an orthorhombic unit cell. The bond lengths and angles were fixed, but torsional angles were able to rotate. A penalty and anti-bump penalty was introduced to stop large atomic deviation from the original coordinate site. A dummy variable linked the end of one unit cell to the next. Finally, a preferred chain orientation along the (001) direction was taken into account. The amorphous background was modelled using a Chebyshev function, and crystalline peaks were assumed to be Gaussian. The Lorentz-polarisation was zero. To maximise the model fitting, the atomic coordinates and unit cell size could change. Various space groups were initially modelled (P1211, P2111 and P212121) all assuming a 10/3 unit packing. However, it was determined that P212121 had the best fitting and was used for all analysis.

To validate the computational model, PLLA was mixed with the diffraction standard corundum in three different ratios. The corundum was supplied by MetPrep (Alpha 1.0 micron category number 159980). Across all three ratios, the model was able to correctly predict the final corundum to polymer ratio within ±10%. Based on the error in the final corundum fitting a conservative ±10% error bar is plotted on percentage crystallinity values. Following validation, the final model was fitted to each experimental WAXS data set.

2.4.5 Thermal properties

Thermal properties were measured using a TA Instruments differential scanning calorimetry (DSC) 2,500. The DSC was run in batches, with all degraded material from a single fluid temperature run at the same time. Before each batch was run, a sample of as printed material was run. The initial material characterisation values and associated errors were calculated based upon the average and standard deviation of this data. For every sample, 2–5 mg of dried material was sealed in an aluminium pan, and DSC was conducted using a 10°C/min heating rate from 0 to 210°C under a 50 mL/min nitrogen flow rate. The glass transition temperature (Tg), cold crystallisation temperature, melting temperature (Tm) and enthalpy of fusion were recorded.

2.4.6 Mechanical properties

Tensile mechanical testing was undertaken using a Tinius Olsen 1ST universal tensile testing machine. A 25 N load cell with self-tightening grips was used. Sample gauge length was measured and approximately 20 mm. The strain rate was 0.001 s1. For each time and temperature, five individual dried sample lines were measured to failure. The data were analysed using a custom script in MATLAB. The initial ramp-up section of the curve was removed, with the Young’s modulus recorded from the steepest linear section. Yield stress and strain were measured at a 0.2% strain offset. The ultimate tensile strength (UTS) was defined as the maximum stress the sample reached before failure, with the corresponding strain recorded as the failure strain.

Sample cross section was recorded using optical microscopy in reflection mode. Samples were sectioned into three pieces. A ×10 objective lens was used to find sample width and thickness for individual lines prior to mechanical testing. The cross sectional area was approximately rectangular in shape, and the formula for area of a rectangle was used to calculate the cross sectional area (Roper et al., 2021).

3 Results

3.1 Initial material characterisation

Prior to degradation testing, the initial molecular weight, X-ray diffraction scattering, thermal properties and mechanical properties of the as printed PLLA fibres were characterised (Figure 1).

Figure 1
www.frontiersin.org

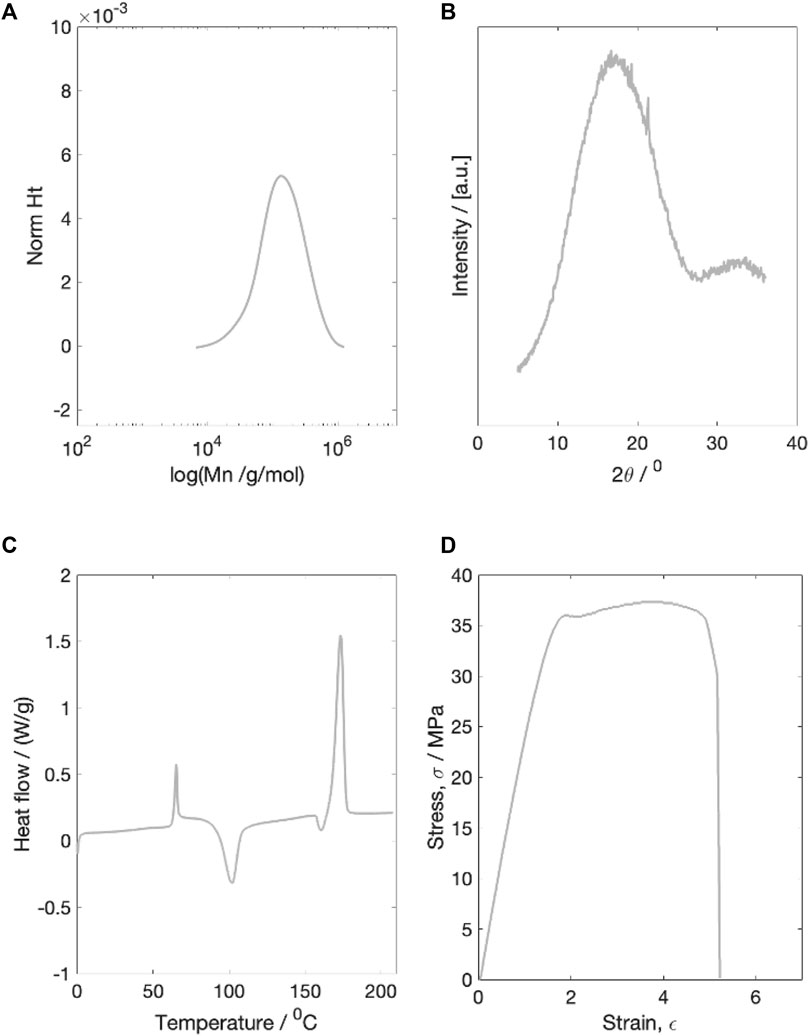
Figure 1. Example characterisation plots of the dried initial material. (A) molecular weight characterisation (B) X-ray diffraction characterisation (C) Thermal properties characterisation (D) Example stress-strain plot for a single dried starting sample. All four tests were run on dried material.

3.1.1 Molecular weight

The dry number average starting molecular weight (Mn) was measured to be 100,598 g/mol. The starting PDI was 1.79 ± 0.15. The GPC curve contained a single peak (Figure 1a).

3.1.2 X-ray diffraction

The initial dry material was completely amorphous, with a single broad WAXS peak and a calculated crystallinity of 4.5 ± 10% (Figure 1B).

3.1.3 Thermal properties

Thermal characterisation of the initial dry material revealed an average Tg of 61.5 ± 1.5°C, cold crystallisation temperature of 100.3 ± 5.1°C, and a single melting peak at 172.5 ± 3.2°C (Figure 1C). Prior to melting, a small endothermic dip was recorded.

3.1.4 Mechanical properties

The average dry starting Young’s modulus was measured to be 2.00 ± 0.46 GPa. The average material yield stress and strain were 31.27 ± 3.98 MPa and 1.81 ± 0.27 respectively, before a final average failure recorded stress and strain values of 38.24 ± 4.31 MPa and 4.42 ± 1.51 respectively (Figure 1D).

3.2 Hydration study

The DSC curves for samples hydrated in PBS for 3 days at 37°C fluid are shown in Figure 2A. The starting material curve is plotted in grey. The hydrated material (still wet) is plotted in blue and the vacuum dried material curve is plotted in red. A vertical phase shift between each of the lines has been introduced for clarity. In the hydrated state, the Tg reduced from 61.5 ± 1.5°C to 54.5 ± 1.0°C, before returning to its original value upon drying. Within the hydrated state, a prominent enthalpy relaxation peak can be seen. The peak height slightly reduced upon drying, possibly due to structural changes occurring during the water desorption (Vyavahare et al., 2014).

Figure 2
www.frontiersin.org

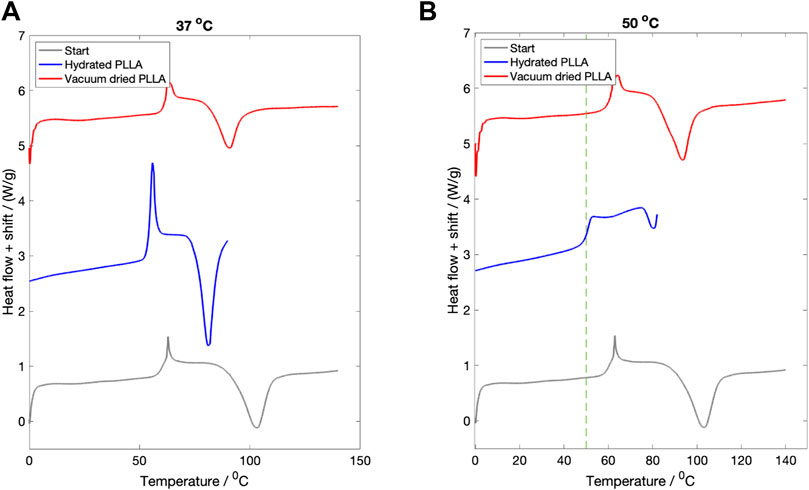
Figure 2. The effect of fluid immersion for 3 days on the recorded thermal properties. (A) Hydration at 37°C. The starting DSC curve for the dry material is shown in grey. After 3 days immersion, the measured Tg for the hydrated material was lowered slightly (blue line). After vacuum drying (red line) the Tg returned back to its start value. (B) Hydration at 50°C. In the hydrated state (blue line) the Tg was measured to be 50°C. Upon vacuum drying, the Tg returned to its original value (red line). In both figures a vertical shift (approximately 2.5 W/g) between each line has been introduced for clarity. In Figure (B) a green dotted line marking the temperature of the surrounding fluid has been added.

The same three DSC curves for PLLA hydrated at 50°C for 3 days are shown in Figure 2B. A boundary line marking the 50°C fluid temperature has been added. In the hydrated state (blue curve) the glass transition reduced from 61.5 ± 1.0°C to 50.6 ± 0.5°C. No enthalpy relaxation signal can be seen in the hydrated state. Upon vacuum drying, the Tg then returned to its original value.

The study was not undertaken at 80°C, given that mass loss and pH changes at this fluid temperature occurred within the first 24 h (Figure 4C).

3.3 Degradation study

3.3.1 Degraded sample appearance

The changes to sample appearance after degradation and sample drying, are shown in Figure 3. At 37°C, samples remained transparent throughout the degradation period (Figure 3A) and all samples maintained their structural integrity throughout the 180 days degradation period. The sample coiling arose due to sample placement within the bijou tube and was present prior to sample drying. Samples degraded at 50°C (Figure 3B) turned white during the first 30 days. After 100 days, upon removal from the bijou tube, samples were no longer intact. Samples degraded at 80°C (Figure 3C) turned white and began to lose their structural integrity within the first 24 h.

Figure 3
www.frontiersin.org

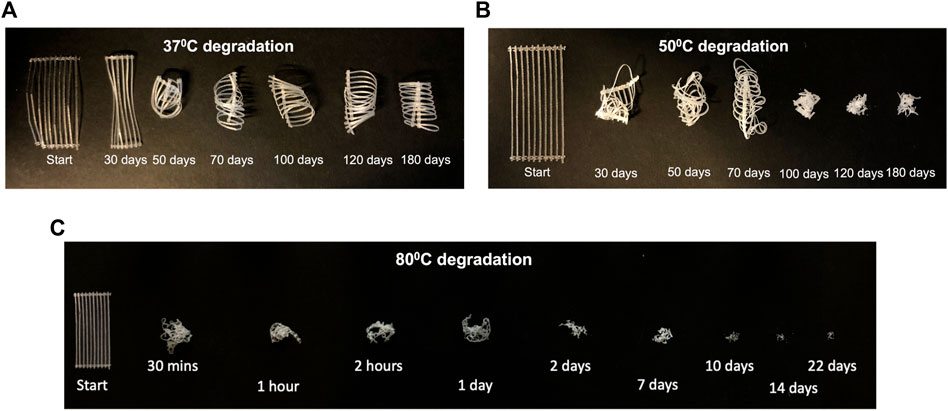
Figure 3. Change in sample appearance after drying for samples degraded at (A) 37°C, (B) 50°C and (C) 80°C. Starting samples were 10 cm in length.

3.3.2 Mass loss and pH change

The percentage mass loss and pH change are shown in Figure 4. At 37°C (Figure 4A) the fluid maintained a constant pH and after 180 days no significant mass loss was recorded.

Figure 4
www.frontiersin.org

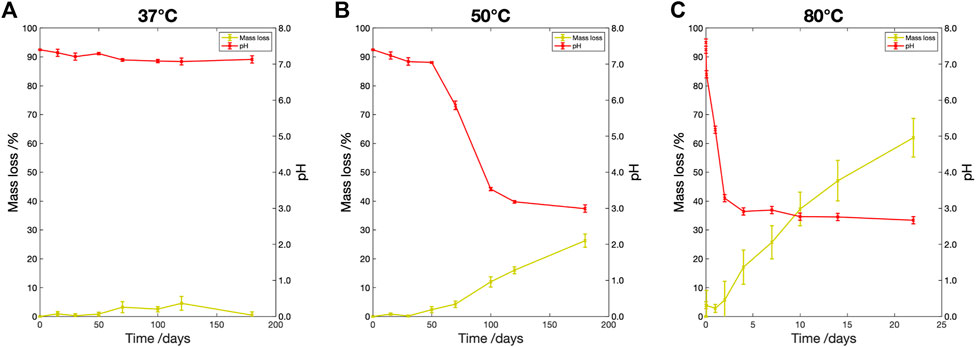
Figure 4. Percentage mass loss (yellow) and pH change (red) vs. degradation time for samples degraded in PBS at (A) 37°C, (B) 50°C and (C) 80°C. The percentage mass loss is shown on the left vertical axis, the fluid pH on the right vertical axis.

At 50°C (Figure 4B) during the first 50 days there was little change to fluid pH or sample mass. However, by Day 70, a 4.2 ± 1.1% mass loss was recorded and the pH reduced from 7.4 to 5.9 ± 0.1. The pH plateaued after 100 days, with the minimum recorded pH 3.0 ± 0.1. The sample continued to lose mass loss with a maximum recorded loss of 26.3 ± 2.3% after 180 days.

At 80°C (Figure 4C) rapid mass loss and pH change were recorded within the first 24 h. The pH shifted to 2.9 ± 0.1 after 4 days. There was no further change in the fluid pH after this point. The sample continued to lose mass throughout, with a maximum recorded loss of 62.0 ± 6.7% after 22 days.

3.3.3 Molecular weight

Across all temperatures, there was a reduction in number average molecular weight (Mn) with time (Figure 5). Samples degraded at 37°C recorded the slowest rate of Mn degradation, with a 50% drop in Mn requiring approximately 75 days. At 50°C this time reduced to approximately 15 days. For degradation at 80°C, the Mn reduced over 95% within the first 24 h. The degradation rate then slowed in the following 13 days. The GPC profiles at each degradation temperature are shown in Figure 5. At 37°C, there was a gradual shift in peak position, with a single peak recorded at each degradation time. At 50°C, a bimodal peak was seen to develop at Day 70. By Day 100, a small higher molecular weight secondary peak could be seen. By Day 120, there was a return to a single peak. Finally, at 80°C, a two peak profile was seen at Day 1. By Day 4, there was only a single peak. Figure 5D plots the change in Polydispersity index (PDI) with degradation time. At 37°C all the PDI values were less than 2.50, whilst at 50°C the PDI recorded a maximum of 2.81 ± 0.23 at Day 70. At 80°C, a maximum recorded PDI value of 2.68 ± 0.22 was recorded after Day 1, before dropping to approximately 1.50 for the remaining time period.

Figure 5
www.frontiersin.org

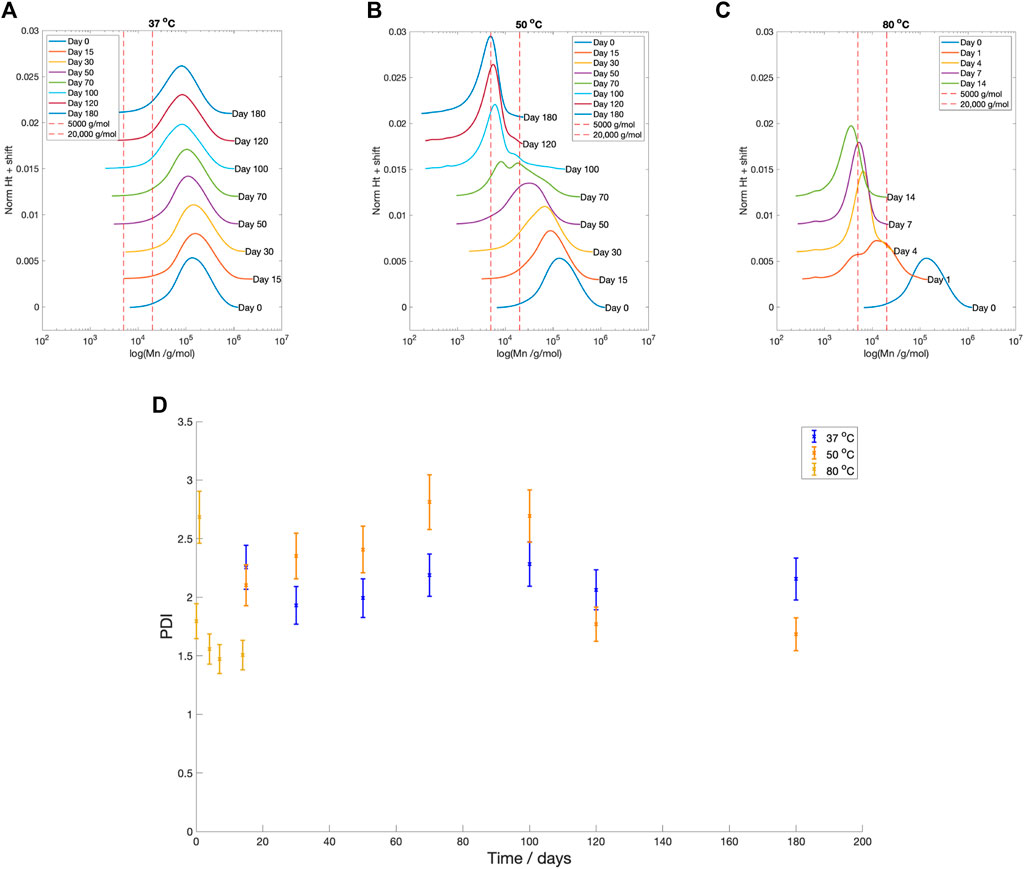
Figure 5. GPC profiles at degradation time for PLLA degraded in PBS at (A) 37°C, (B) 50°C, (C) 80°C (D) Polydispersity index vs. degradation time for all three temperatures (37°C blue, 50°C orange, 80°C yellow). By Day 22 at 80°C, not enough sample remained to run the GPC. In plots (A–D), between each degradation time point a 0.003 vertical shift has added for clarity. A red vertical line at Mn values of 5,000 g/mol and 20,000 g/mol has been added.

3.3.4 X-ray diffraction

X-ray diffraction profile of samples degraded at each fluid temperature are plotted in Figure 6. After 6 months degradation at 37°C, the XRD scans still showed a broad amorphous halo (Figure 6A). There was little recorded change in the crystallinity during this period. Two peaks are located at two theta position 21° and 24°. Samples degraded at 50°C (Figure 6B) gradually developed distinct peaks at two theta positions 16° and 19°. Samples degraded at 80°C, showed a rapid development of crystalline peaks at two theta positions approximately located at 16° and 19° (Figure 6C). Figure 6D compares WAXS patterns after 180 days of degradation at 37°C and 30 days of degradation at 50°C. Samples had a similar Mn at these respective time points (45,000 g/mol at 37°C vs. 31,000 g/mol at 50°C). The two theta peak located around 30° for the sample degraded at 50°C was identified as contamination from calcium magnesium carbonate (Blanchard, 2021).

Figure 6
www.frontiersin.org

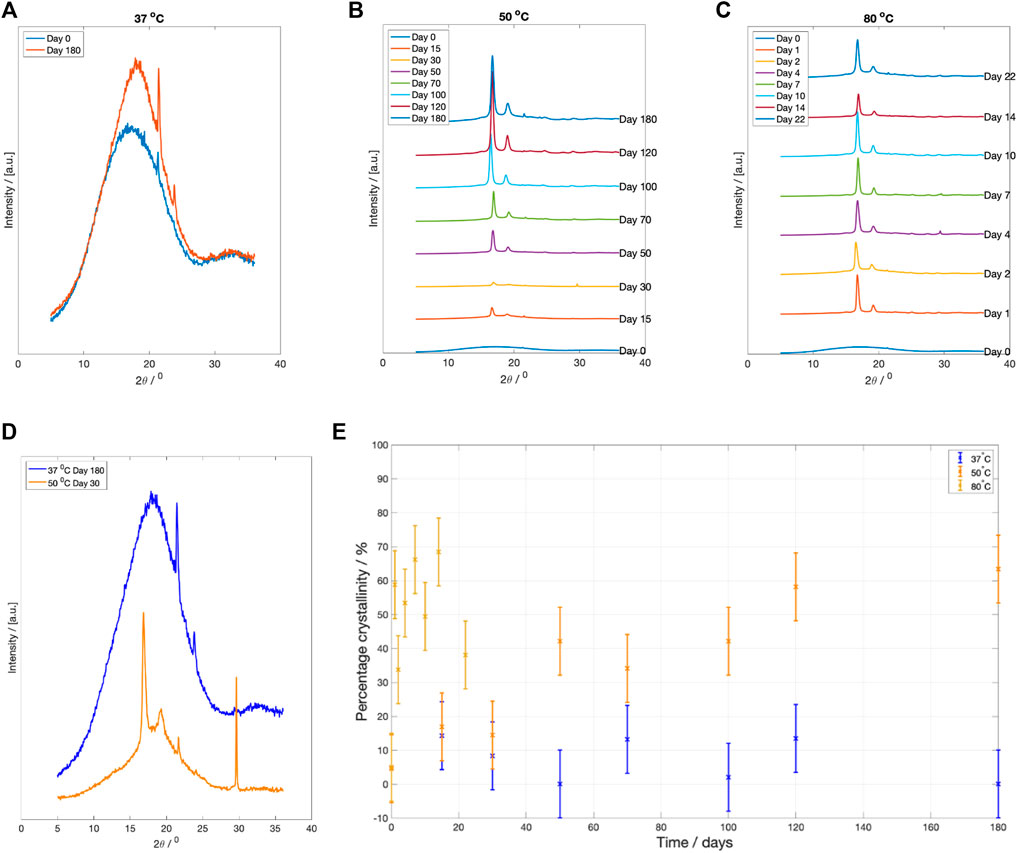
Figure 6. XRD scattering results at specific degradation time points after drying. (A) WAXS pattern for PLLA degraded at 37°C at Day 0 and 180, (B) WAXS patterns at each degradation time point for PLLA degraded at 50°C, and (C) WAXS pattern for PLLA degraded 80°C. A vertical shift, at degradation temperatures 50°C and 80°C, has been introduced between time points to make the data clearer. (D) Comparison of the WAXS diffraction patterns after drying for samples degraded at 37°C for 180 days vs. samples degraded for 50°C for 30 days. The recorded Mn values at this point are approximately the same. Note the difference in peak position for 37°C and 50°C fluid temperature. (E) Change in recorded crystallinity during hydrolysis for samples degraded at 37°C (blue), 50°C (yellow) and 80°C (yellow).

3.3.5 Crystallinity

The change in crystallinity, estimated using Rietveld refinement, is plotted in Figure 6E. There was little recorded change in sample crystallinity for PLLA degraded at 37°C, with all samples remaining amorphous. At 50°C, there was a rise in crystallinity from approximately 5% to over 60% over the 180 days of degradation. At 80°C, the crystallinity increased to 66% within the first 7 days, before falling to 38% by Day 22.

3.3.6 Thermal properties

The change in thermal properties of the dried degraded samples was investigated using DSC. For degradation at 37°C, the DSC curves are plotted in Figure 7A. A vertical shift between lines has been introduced for clarity. Both the Tg and its accompanying enthalpy relaxation peak height increased following degradation. The Tg increased from approximately 61.5 ± 1.5°C to 66.4 ± 1.5°C during the first 50 days before plateauing. At Day 180 the Tg was measured to be 68.3 ± 1.5°C. The size and shape of the Tg peak suggests an enthalpy relaxation behaviour has occurred. Simultaneously, there was a fall in cold crystallisation temperature from 100.3 ± 1.5°C to 92.3 ± 1.5°C over the degradation time period. No change in the final melting temperature in the DSC was recorded across the 180 day period.

Figure 7
www.frontiersin.org

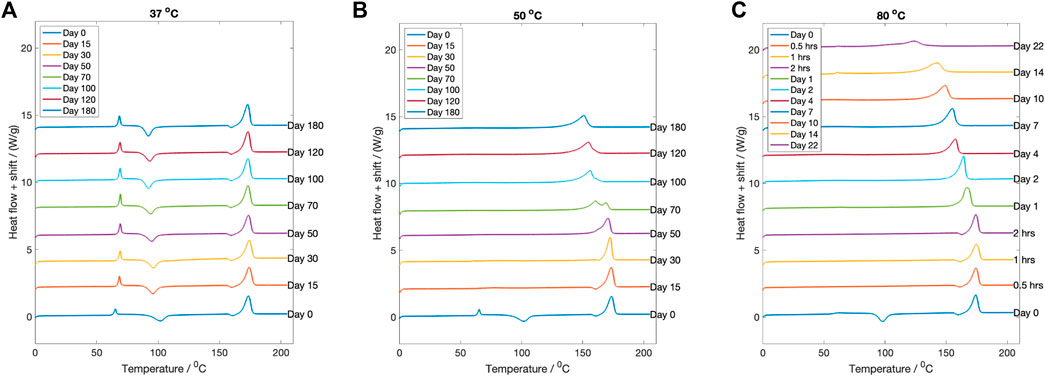
Figure 7. The DSC curves for each fluid temperature at every degradation time point. (A) 37°C, (B) 50°C and (C) 80°C. Between a degradation time point, a vertical shift of 2 W/g has been introduced for clarity.

Conversely, for samples degraded at 50°C (Figure 7B) the glass transition and cold crystallisation were not observed after degradation for any time period measured. After 50 days of degradation, the melting temperature reduced to 170.7 ± 1.5°C, and then further reduced to 152.2 ± 1.5°C by Day 180.

Samples degraded at 80°C (Figure 7C) recorded a flattening to their Tg and cold crystallisation, during the initial 24 h period. After this, the recorded melting temperature gradually reduced. After 10 days the melting temperature was recorded as 149.1 ± 1.5°C, and by Day 22 it was recorded as 124.2 ± 1.5°C.

3.3.7 Mechanical properties

The change in Young’s modulus, yield stress and ultimate tensile strength (UTS) for dried samples degraded at 37°C is shown in Figure 8. It was seen that all three parameters initially increased during the first 30 days of degradation. After this, all three parameters then steadily fell throughout the remaining 150 days. The Young’s modulus declined from a starting value of 2.00 ± 0.46 GPa to 0.98 ± 0.39 GPa at Day 50. At Day 180 there was a further decline in Young’s modulus to 0.37 ± 0.29 GPa. The UTS shifted from a peak value of 46.54 ± 5.43 MPa to a final value 7.68 ± 5.52 MPa. The samples exhibited increasingly brittle behaviour with the difference between yield stress and UTS tending to zero with prolonged degradation.

Figure 8
www.frontiersin.org

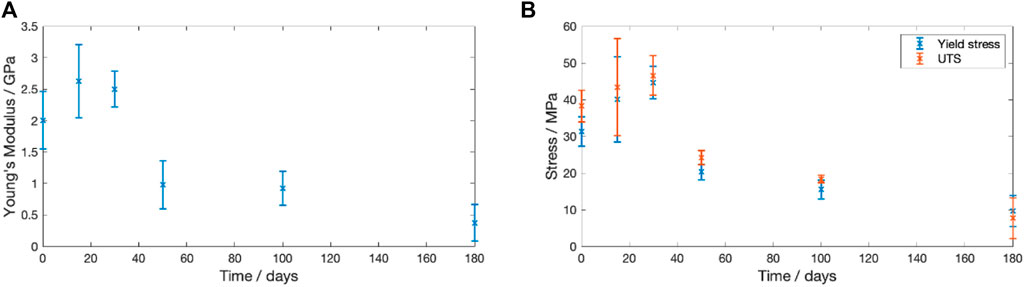
Figure 8. Change in the recorded mechanical properties for PLLA degraded in PBS at 37°C over a 180 day period. (A) Young’s modulus (B) Yield stress (blue) and (C) Ultimate tensile stress (orange) vs. degradation time.

4 Discussion

4.1 Three-stage degradation model

When the data from the pH and mass loss experiments were combined with the molecular weight data, across all fluid temperatures, a three-stage degradation process could be identified (Figure 9). Previous studies have subdivided the degradation of poly(α-hydroxy esters) into a number of stages. However, the exact number and precise stage classification is still debated within the literature (Li, 1999; Middleton and Tipton, 2000; Alexy and Levi, 2013; Limsukon et al., 2023). By breaking down the degradation into distinct stages, we can gain a better understanding of the overall degradation process, and more accurately model the behaviour of the polymer at each stage.

Figure 9
www.frontiersin.org

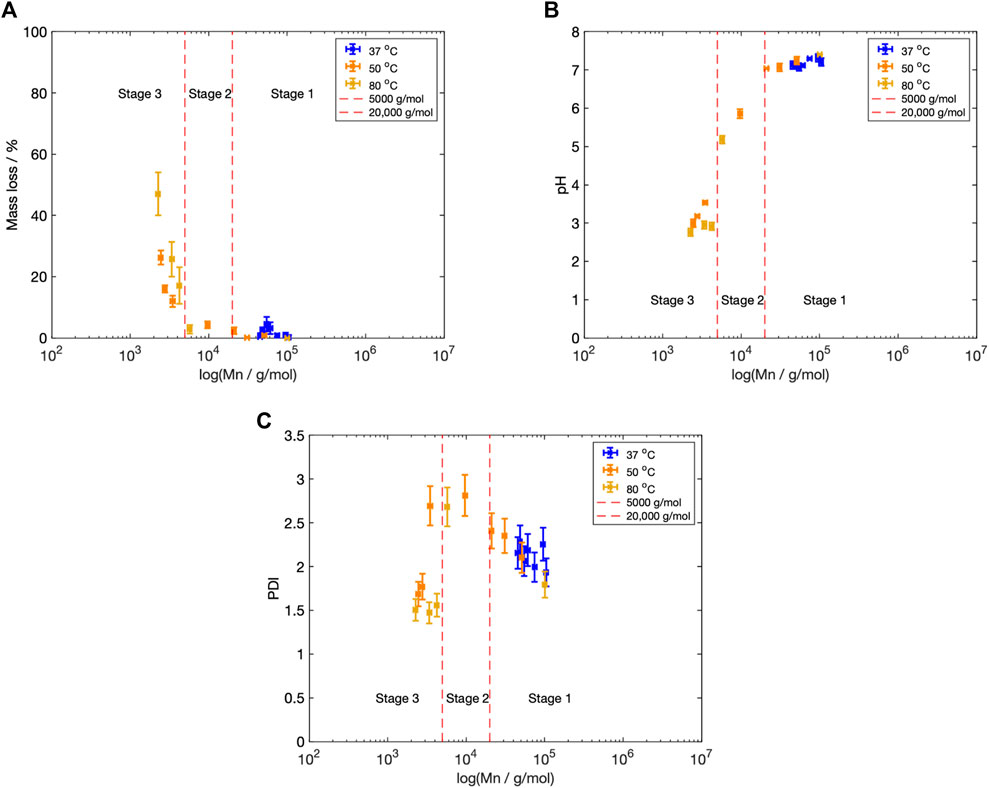
Figure 9. (A) Mn vs. mass loss across all three fluid temperatures, 37°C (blue), 50°C (orange) and 80°C (yellow) (B) Mn vs. pH at each fluid temperature. (C) Polydispersity index (PDI) vs. Mn at each fluid temperatures. The three degradation stages have been marked, along with the approximate stage boundaries.

The Mn boundaries between each stage are approximate; however, the overall categorisation was based on trends across the entire data set and previous literature. The boundary between Stage 1 and 2 was determined by the increase in the PDI from 2.40 to greater than 2.60 (Figure 5D), as well as the reduction in fluid pH (Figure 4), once the Mn fell below 20,000 g/mol (Figure 5). Weir et al. also reported the onset of mass loss for 0.8 mm annealed PLLA once the sample molecular weight fell below 20,000 (Weir et al., 2004a). The boundary between Stage 2 and 3 was based upon the drop in the PDI from 2.60 to below 2.00 (Figure 5D), alongside the increase in mass loss (Figure 4) that occurred when Mn shifted to less than 5,000 g/mol (Figure 5). Grizzi et al. similarly reported the onset of significant mass loss once the molecular weight was less than 7,000 g/mol, for 0.3 mm thick compression moulded amorphous poly(D-L lactic acid) (Grizzi et al., 1995; Sevim and Pan, 2018).

Stage 1: Mn > 20,000 g/mol During Stage 1 there was a reduction in Mn from its 100,598 g/mol starting value to approximately 20,000 g/mol (Figure 5). There was little change to the sample mass or fluid pH throughout this stage (Figure 4). This suggests that the sample was undergoing bulk erosion rather than surface erosion. The diffusion of degradation products out of a bulk eroding structure is slow (Middleton and Tipton, 2000). Conversely, for a sample undergoing surface degradation, a linear erosion profile would be expected (von Burkersroda et al., 2002).

Stage 2: 5,000 < Mn < 20,000 g/mol Once the molecular weight was less than 20,000 g/mol, mass loss and pH changes were measured (Figure 4), marking the onset of Stage 2. This reduction in sample mass and fluid pH indicates that the degraded short-chain monomers and oligomers were small enough to diffuse out of the microstructure. The release of these carboxylic acid end groups into the fluid would then reduce the fluid pH. As the fluid pH approached and eventually surpassed the pKa point of lactic acid (3.86), the pH plateaued, most likely because the lactic acid began to exist in its protonated form (Eyal and Canari, 1995).

Stage 3: Mn < 5,000 g/mol Once the molecular weight reached 5,000 g/mol, samples were determined to have crystallinity above of 50% (Figure 6E), marking the onset of Stage 3. The crystalline regions within the microstructure are commonly termed ‘crystalline residues’ (Tsuji, 2002; Tsuji et al., 2004; Auras et al., 2010). The GPC profile contained a single peak, with the poldispersity index less than its starting value (Figure 5D). This suggests that the microstructure was relatively homogeneous, containing several crystalline residues. Fischer et al. previously determined that single crystals of PLLA degrade from the outer edges (Fischer et al., 1973). The samples studied here appear to be following a similar degradation pathway, with a steady rate of polymer erosion and mass loss (Figure 4).

4.2 Molecular weight changes in Stage 1 and the effect on mechanical properties

4.2.1 Equation to represent molecular weight evolution with time in Stage 1

Two models have been proposed to represent the reduction in Mn, prior to the onset of mass loss (Stage 1). Anderson et al. suggested a statistical approach with the molecular weight following an inverse relationship with degradation time, t (Eq. (2)):

1MN=1MN0+k1t(2)

where MN is the number average molecular weight, MN0 starting molecular weight, k1 rate constant and t the degradation time.

The model assumes that no autocatalysis has occurred. Pitt and Gu developed an alternative model to account for the autocatalysis of the carboxylic acid end groups generated during the degradation (Pitt et al., 1981). Their model predicted an exponential relationship with degradation time, t (Eq. (3)):

MN=MN0ek2t(3)

Neither model can be applied to samples degraded at 80°C, where mass loss occurred within 24 h.

Table 1 shows that at 37°C, both the degradation models of Anderson et al. and Pitt or Gu fit well. The overall degradation rate was slow, and thus the influence of autocatalysis within the 6 month period was minimal. For degradation at 50°C, there was marginally better fitting with the autocatalytic model. At both fluid temperatures, values are compared with previous literature, either Weir et al. at 37°C, or Weir et al. and Chausse et al. at 50°C (Weir et al., 2004a; Chausse et al., 2023). Weir et al. samples were 0.8 mm annealed PLLA degraded in PBS. Chausse et al. samples were 3D printed 120.9 μm thick samples, annealed for 12 h prior to degradation in PBS. At both degradation temperatures, there was found to be good agreement between calculated rate constants in the present work and previous literature.

Table 1
www.frontiersin.org

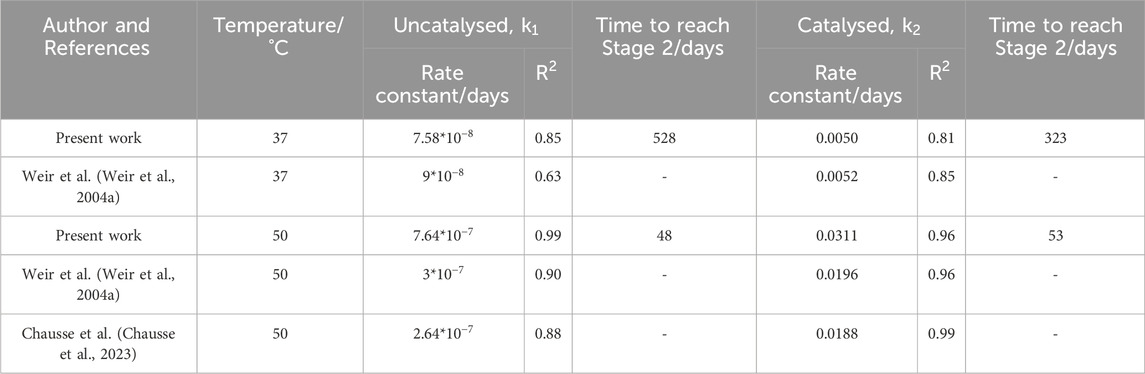
Table 1. Rate constants and accompanying R2 for the uncatalysed and autocatalysed models for samples degraded at 37°C and 50°C. Table also predicts the time required for degraded samples to reach a Mn of 20,000 g/mol for both degradation models. This Mn marks the onset of Stage 2.

Using the degradation models developed by Anderson et al. and Pitt and Gu respectively, the time to reach a molecular weight of 20,000 g/mol was determined (Table 1). This marks the boundary between Stage 1 and 2 and the approximate onset of mass loss and pH changes (Figure 9).

4.2.2 The dependency of mechanical properties on molecular weight in Stage 1

The reduction in Mn during Stage 1, was accompanied by a change in mechanical properties at 37°C. Figure 10 plots the change in Young’s modulus and the UTS with the Mn. A linear fit for both parameters (R2 fitting of 0.87 and 0.96 for Young’s modulus and UTS respectively) was determined, agreeing with Weir et al.’s reported behaviour for annealed PLLA (Weir et al., 2004a).

Figure 10
www.frontiersin.org

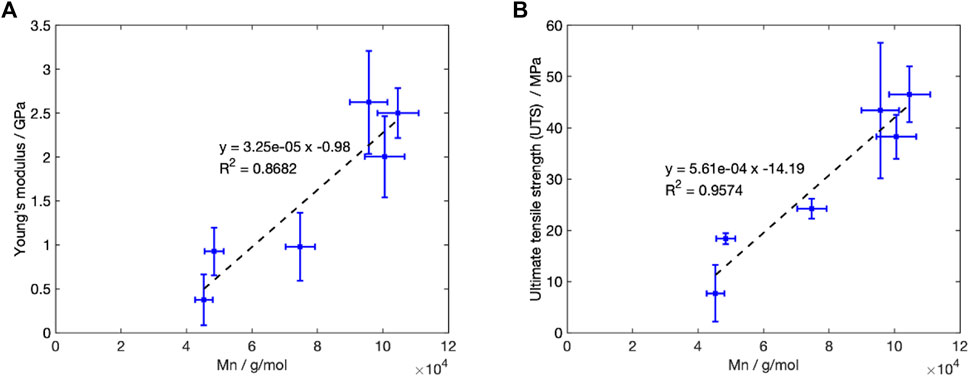
Figure 10. Change in the recorded mechanical properties with Mn for degradation at 37°C (A) Young’s modulus vs. Mn. A linear trend line has been added with an R2 value of 0.87. (B) Ultimate tensile strength (UTS) vs. Mn. An R2 value of 0.96 was recorded.

4.3 Mass and molecular weight changes in Stage 3

4.3.1 Equation to represent mass change with time in Stage 3

In Stage 3, oligomer and short-chain monomers were predicted to move via diffusion from the sample into the surrounding fluid. This diffusion was assumed to obey Fick’s diffusion laws. As such, Stefan’s approximation predicting the change in mass over time was fitted (Eq. (4)) (Moliner et al., 2020).

MtMs=4lDtπ12(4)

Where Mt is the mass at time t, Ms saturation mass (amount of fluid initially absorbed by the structure), D the diffusion coefficient, l the diffusion length and t the degradation time.

A constant saturation mass, diffusion length and coefficient are assumed in Eq. (4). Mt can then be replaced with the percentage mass loss at time t. There was good fitting between Stefan’s equation and the data collected at both 50°C and 80°C, both R2 values were 0.99, once Stage 3 was reached (Figure 11).

Figure 11
www.frontiersin.org

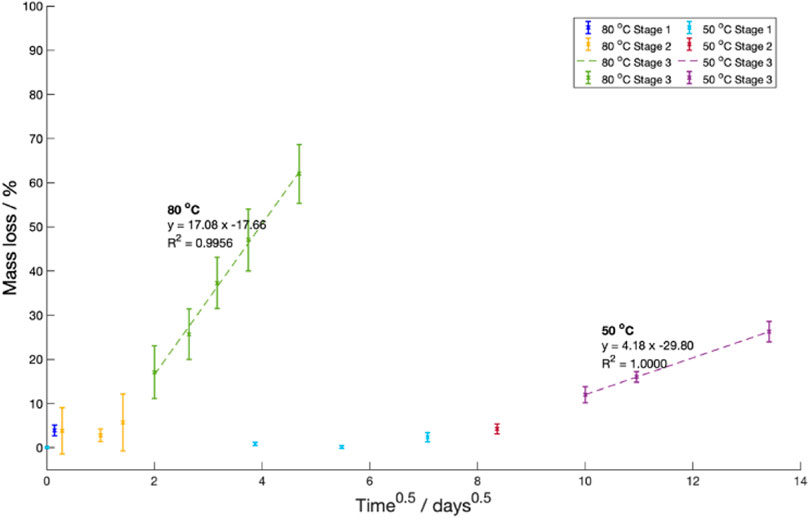
Figure 11. Mass loss against the square route of the degradation time at 50°C (light blue, red and purple) and 80°C (navy, yellow and green). For both temperatures, Stages 1 and 2 (prior to the onset of mass loss) are shown in different colours for clarity.

4.3.2 Evolution of molecular weight with time in Stage 3

Tsuji et al. previously found that the molecular weight of crystalline residues decreased with a linear time dependency (Tsuji and Ikarashi, 2004a; Tsuji and Ikarashi, 2004b). They manufactured their starting crystalline residues by degrading as-cast PLLA 100 μm films at 97°C for 40 h in PBS. Their crystalline residue starting molecular weight was 10,200 g/mol. For the data collected in the present work, we found that once the recorded Mn was below 5,000 g/mol, the reduction in molecular weight could similarly be modelled with a linear time dependency. Table 2 lists the calculated experimental rate constants, comparing them to Tsuji et al. values. For samples degraded at 80°C, Mn values from Day 4 onwards are used. For samples degraded at 50°C, Mn values from Day 100 onwards are used.

Table 2
www.frontiersin.org

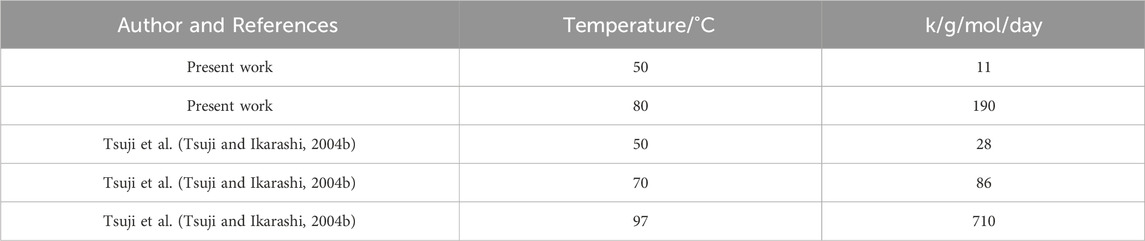
Table 2. Linear rate constant during Stage 3 degradation. For the present work data, k is calculated from Day 100 onwards at 50°C and Day 4 onwards at 80°C.

There was good matching between the calculated rate constant at 80°C for the present work and Tsuji et al. value. However, the rate constant calculated at 50°C for the present work was smaller than Tsuji et al.’s reported value. The PDI value at Day 100 for samples degraded at 50°C was 2.69 ± 0.22, larger than Tsuji et al.’s starting value (1.23). Secondly, the GPC curve contained a small secondary peak (Figure 5B), which could indicate the presence of some preferentially degraded amorphous material within the microstructure. This is consistent with the XRD scattering results in Figure 6E which recorded the presence of amorphous material within the microstructure. The presence of amorphous material could explain the difference in rate constant between the two data sets.

4.4 Overall degradation pathway as a function of temperature

In Figures 5B,C, the development of multi-modal peaks during Stage 2 at 50°C and 80°C fluid temperatures, suggests that some parts of the microstructure were being selectively degraded. Previous studies have suggested that multi-modal GPC peaks occur when the core of the sample is degrading faster relative to the surface (Li et al., 1990; Grizzi et al., 1995). The good fitting between the Pitt and Gu’s autocatalytic hydrolysis model and the current Mn data set, might suggest that this has occurred within this studies degraded samples. However, this explanation cannot explain the observed increase in crystallinity at 50°C and 80°C (Figure 6E). Alternatively, some studies have suggested that the formation of a double peak within the Mn curves occurs due to the preferential hydrolysis of the amorphous regions (Fischer et al., 1973; Li et al., 1990; Pistner et al., 1993; Tsuji and Ikada, 1997; Tsuji and Ikada, 1998; Tsuji et al., 2000; Chye et al., 2005). The selective hydrolysis of the amorphous regions would explain the recorded increase in crystallinity seen at 50°C and 80°C. However, across all fluid temperatures, there were only marginal increases to the measured PDI values (Figure 5D). The recorded PDI values in the present study are very similar in size to those reported by Weir et al. for 0.8 mm annealed PLLA, degraded in PBS at 37°C (Weir et al., 2004b). They suggested their samples were degrading homogeneously, with little surface to core, or autocatalytic degradation occurring. It may not be possible for us to determine exactly which explanation and degradation pathway occurred, and it is likely that multiple pathways were concurrently active.

In Figure 9, the overall degradation was divided into three-stages. Samples degraded at 37°C did not advance beyond Stage 1 during the studied time period. The suggested degradation behaviour in Stages 2 and 3 is only based on the data sample degradation at 50°C and 80°C. At 37°C, the sample Mn remained greater than 20,000 g/mol throughout the 180 days degradation period.

4.4.1 Degradation at 80°C

Above Tg, changes to polymer orientation or crystallinnity can occur. For samples degraded at 80°C the increase in crystallinity was expected, with the recorded observations fitting this behaviour. A maximum crystallinity of 66% was recorded after 7 days (Figure 6E). With further hydrolysis, the sample crystallinity reduced, possibly due to disruption of the crystal structure during crystalline residue break-up (von Recum et al., 1995). Visually the PLLA turned white during the first 24 h and with prolonged degradation the material formed a fine powder (Figure 3C). The reduction in the amount of connecting amorphous material present produced a structure which fell apart under its own weight. The melting point reduced from approximately 172°C to 124°C over the 22 days as Mn reduced (Figure 7C). The reduction in final melting temperature is consistent with a gradual reduction in crystal thickness (Tsuji and Ikarashi, 2004b).

4.4.2 Degradation at 37°C

Conversely, for samples degraded at 37°C, the polymer was below its Tg and there was little change in polymer crystallinity during degradation (Figure 6E). The results in the present work agree with Tsuji and Suzuyoshi who reported that for amorphous PLLA, less than 50 μm thick, no increase in crystallinity was observed over a 70 day period (Tsuji and Suzuyoshi, 2002). The two theta peaks located at 21° and 24° (Figure 6A) are not believed to have arisen from scattering from a PLLA crystal structure, since peaks in this two theta position have not been reported elsewhere for any PLLA crystal structure (Ru et al., 2016; Lotz et al., 2017). It seems likely that the scattering was due to sample contamination. The peaks were identified to be from Polyethylene (PE) (see the Supplementary Material for more information). The DSC results (Figure 7A) indicated that upon reheating, the PLLA underwent an enthalpy relaxation. This relaxation is indicative of a physical ageing process and suggests that glass densification may have occurred (Vyavahare et al., 2014). This densification might explain the rise in Tg from 6 1.5°C to 69°C (Pan et al., 2008). Conversely, the increase in polymer chain mobility in the hydrated state might explain the gradual shift in the cold crystallisation temperature from 97°C to 92°C (Vyavahare et al., 2014). The physical ageing within the amorphous regions at 37°C agrees with previous reported results (Tsuji, 2002; Vyavahare et al., 2014). The GPC profile showed a gradual reduction in Mn, and no increase in PDI (Figure 5A). This suggests that either no preferential degradation of the amorphous regions or autocatalysis occurred. The findings at 37°C (no increase in crystallinity and no evidence of autocatalysis) contrast with some previous results. Li et al. found that amorphous PLLA degraded at 37°C had an approximately linear increase in crystallinity over a 2-year period (Li et al., 1990). The crystallinity rose from 0% to 17% during the initial 31-week period. Li et al. starting Mn was slightly smaller than the degraded samples used within this study, approximately 72,000 g/mol compared with 100,598 g/mol respectively. Importantly however, their samples were 2 mm thick, and an autocatalysed core clearly developed. The larger sample thickness, may be crucial to explain both the autocatalysis and their recorded increase in crystallinity during degradation.

During the 180 days degradation there were significant changes to the mechanical properties. Figure 8 shows that during the first 30 days of degradation there was an increase in the Young’s Modulus and UTS. However, the PLLA transitioned from elastic-plastic behaviour to brittle behaviour. The recorded behaviour matches that reported by Pan et al. who found that physical ageing of 380–400 μm thick amorphous PLLA at 40°C for 465 h, increased the tensile modulus and yield strength, whilst simultaneously reducing the fracture strain (Pan et al., 2007). Cui et al. suggested that the development of large internal stresses during the ageing process can lead to brittle failure, with the interplay between the decreasing free volume and the development of internal stresses determining the final mechanical and thermal properties (Cui et al., 2020). With prolonged degradation, the Young’s modulus of samples in the present study, dropped. Chain cleavage has been shown to reduce the Van der Waals forces between polymer chains, which in turn can reduce the Young’s modulus (Ding et al., 2012).

4.4.3 Degradation at 50°C

For degradation occurring at 50°C, PLLA was below its dry starting glass transition (60°C). Accordingly, there should be little change to the sample crystallinity. However, Figure 6E showed that sample crystallinity increased to over 60% during the 6 month period. To explain this result the effect of hydration on the Tg (Figure 2B) must be considered. Fluid immersion reduced the Tg, and as a result, the chains underwent structural rearrangement and crystallised. A similar magnitude of Tg reduction was reported by Siemann for Poly-D,L-lactic acid (P(DL)LA) (Siemann, 1985). The shift in Tg was a hydration effect, not a degradation effect, as the Tg rebounded to start value after vacuum drying (Figure 2B). Furthermore, the reduction in Tg to at or below the fluid temperature might explain why crystalliation was happening faster than enthalpy relaxation for samples degraded at 50°C.

This reduction in Tg when immersed in fluid, meant the samples followed the behaviour recorded at 80°C. Visually, there was a significant transition to a more opaque colour, and after 100 days the samples were no longer intact (Figure 3B). The DSC curves indicated that, relative to the starting microstructure, after 50 days little amorphous material was present (Figure 7B). Any remaining amorphous material after this time appeared to be rigid amorphous, with the chains tightly bound to the crystalline regions. The removal of mobile amorphous regions, and in particular the tie chains between the crystalline domains, may explain the sample break-up. With additional degradation time, a subsequent reduction in sample crystallinity would be expected, due to the disruption of the crystal structure during crystalline residue break-up.

It is important to consider whether the Tg of samples degraded at 37°C would eventually reach that of the surrounding fluid. Passerini and Craig previously reported that the lowering of Tg in fluid obeyed the Gordon-Taylor relationship (Passerini and Craig, 2001). Using their suggested relationship, to lower the Tg of the PLLA used in the present study from its starting value of 6 1.5°C to 37°C, a water content (saturation mass) in excess of 6% would be required. PLLA is a hydrophobic polymer, and when Weir et al. conducted a degradation experiment for 66 weeks at 37°C, a maximum water content of 2.5% was found (Weir et al., 2004b). By this time the samples started to lose mass as short chain monomers and oligomers diffused out. This suggests that the sample Tg would not lower below 37°C, and that the samples are not expected to crystallise when immersed in fluid at this temperature even after a prolonged time.

4.4.4 Extrapolation from 50°C to 37°C

This study has shown a clear difference between the degradation behaviour at different fluid temperatures. When degraded samples with a similar Mn at different temperatures are compared, significant differences between the material microstructures were found. After 30 days degradation at 50°C the Mn was approximately 31,000 g/mol. Similarly, after 6 months of degradation at 37°C, the Mn was approximately 45,000 g/mol. However, the XRD scans at these two time points are markedly different (Figure 6D). By Day 30 at 50°C, several crystalline peaks have begun to emerge. However, at 37°C, the PLLA microstructure recorded a broad amorphous halo. The divergence between the microstructures would be expected to widen with prolonged degradation time. It appears that degrading amorphous PLLA at elevated temperatures, regardless of whether the temperature is above or below the starting Tg, changes the degradation pathway.

To determine whether extrapolation from 50°C to 37°C is valid, irrespective of the change in degradation pathway, the Arrhenius equation (Eq. (5)) can be used to extrapolate from 50°C to 37°C (Weir et al., 2004a; Chausse et al., 2023). The calculated results can be compared with the collected experimental data for the present work. The rate constants determined at 50°C, were on the same order of magnitude as Weir et al. (Weir et al., 2004a) (Table 1). When Weir et al. applied the Arrhenius equation to their data set they calculated the activation energy required for Mn loss to be Ea to be 100.5 kJ/mol. Applying this value to the present work, for both the autocatalysed model and the uncatalysed degradation models, a calculated rate constant for 37°C was generated (Table 3). The table also lists the percentage difference between the calculated and experimental rate constant. Table 4 lists the time in days to reach a Mn value of 20,000 g/mol, the onset of mass loss. Again the percentage difference between the calculated and experimental based values are given.

k=AeEaRT(5)

where k is the rate constant, A is a constant, Ea the activation energy, R the universal gas constant, and T the temperature in Kelvin.

Table 3
www.frontiersin.org

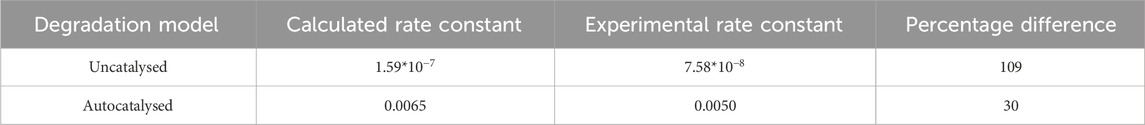
Table 3. Extrapolation using the Arrhenius equation and the experimentally measured 50°C data set, a rate constant at 37°C can be calculated. The percentage difference between the calculated and experimental rate constant is shown.

Table 4
www.frontiersin.org

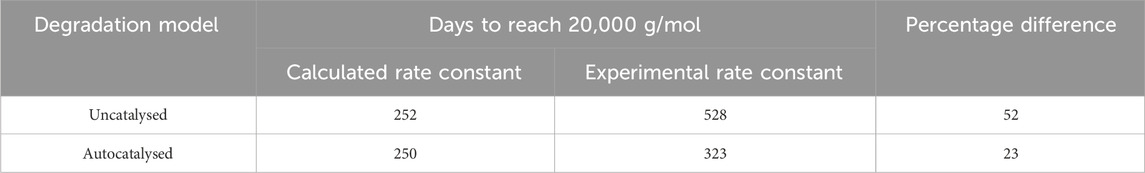
Table 4. The time to reach Stage 2, at 37°C, for the calculated rate constants (determined using the Arrhenius equation) and the experimental rate constant calculated within this study. The percentage difference between the two values is listed.

The values in Tables 3 and 4 show that at best, there is a 30% difference between the calculated rate constant and experimental rate constant, which leads to a 23% difference in time to reach the onset of mass loss. Based on this data, it appears that Arrhenius temperature extrapolation is not a suitable method for predicting the lifespan of amorphous PLLA at 37°C.

The results gathered from this study suggest that 3D printed PLLA degrading at 37°C undergoes bulk degradation. However, the results have not found clear evidence for the formation of an autocatalytic region within the 100 μm thick amorphous PLLA fibres. Furthermore, there was no recorded increase in sample crystallinity during degradation at 37°C. This is contrast to the recorded behaviour at 50°C and 80°C. At elevated fluid temperatures, it appears there is a change in degradation pathway. This change effects the validity of temperature extrapolation, and renders temperature extrapolation an unsuitable method to accurately predict the functional lifespan of amorphous PLLA degraded at 37°C. Amorphous samples should instead be tested at body temperature. The degradation models developed by Anderson et al. and Pitt and Gu can successfully predict the change Mn prior to the onset of mass loss. The provisional data from the present work suggests that late stage mass loss can be modelled using a diffusion-based approach.

5 Conclusion

This work investigated the degradation pathway of 100 μm thick 3D printed amorphous PLLA, degrading in PBS over 6 months. The results collected in the present work suggest that the PLLA fibres underwent homogeneous bulk degradation. However, there were significant microstructural changes dependent upon the fluid temperature. At 37°C, the PLLA microstructure remained amorphous, but there was a densification process during the degradation period. Conversely, at 50°C and 80°C, XRD revealed that the PLLA crystallised, suggesting the PLLA underwent an alternative degradation pathway. A hydration study revealed that immersion of PLLA in PBS, lowered the Tg, thereby enabling crystallisation at temperatures below its dry starting Tg. Due to the difference in degradation pathway between the PLLA degraded at 37°C, and the PLLA degraded at 50°C or 80°C, we suggest that using accelerated degradation testing, at elevated temperatures, to predict the in-vivo lifespan is not valid. Instead, for future in-vivo applications, samples should be tested at 37°C. These findings are important when considering the degradation behaviour of future biomedical devices containing amorphous PLLA fibres.

Data availability statement

The raw data supporting the conclusions of this article will be made available by the authors, without undue reservation.

Author contributions

LM: Investigation, Methodology, Writing–original draft, Writing–review and editing. SB: Supervision, Writing–original draft, Writing–review and editing. RC: Supervision, Writing–original draft, Writing–review and editing.

Funding

The author(s) declare that financial support was received for the research, authorship, and/or publication of this article. This work was funded by the Engineering and Physical Sciences Research Council (EPSRC) grants EP/R513180/1, EP/T517847/1. This work was supported by the Henry Royce Institute for Advanced Materials, funded through EPSRC grants EP/R00661X/1, EP/S019367/1, EP/P025021/1 and EP/P025498/1.

Acknowledgments

The authors thank Giulio Lampronti for his assistance in collecting and analysing the X-ray diffraction data. We thank the Henry Royce Institute for Advance Materials at the University of Manchester for data collection using the 1260 Infinity II Multi-Detector GPC/SEC System.

Conflict of interest

The authors declare that the research was conducted in the absence of any commercial or financial relationships that could be construed as a potential conflict of interest.

Publisher’s note

All claims expressed in this article are solely those of the authors and do not necessarily represent those of their affiliated organizations, or those of the publisher, the editors and the reviewers. Any product that may be evaluated in this article, or claim that may be made by its manufacturer, is not guaranteed or endorsed by the publisher.

Supplementary material

The Supplementary Material for this article can be found online at: https://www.frontiersin.org/articles/10.3389/fbioe.2024.1419654/full#supplementary-material

References

Agrawal, C. M., Huang, D., Schmitz, J. P., and Athanasiou, K. A. (1997). Elevated temperature degradation of a 50:50 copolymer of PLA-PGA. Tissue Eng. 3, 345–352. doi:10.1089/ten.1997.3.345

CrossRef Full Text | Google Scholar

Alexy, R. D., and Levi, D. S. (2013). Materials and manufacturing technologies available for production of a pediatric bioabsorbable stent. BioMed Res. Int. 2013, 1–11. doi:10.1155/2013/137985

PubMed Abstract | CrossRef Full Text | Google Scholar

Ali, Z. A., Gao, R., Kimura, T., Onuma, Y., Kereiakes, D. J., Ellis, S. G., et al. (2018). Three-year outcomes with the absorb bioresorbable scaffold: individual-patient-data meta-analysis from the ABSORB randomized trials. Circulation 137, 464–479. doi:10.1161/CIRCULATIONAHA.117.031843

PubMed Abstract | CrossRef Full Text | Google Scholar

Anderson, J. M. (1995). “Perspectives on the in vivo responses of biodegradable polymers,” in Biomedical applications of synthetic biodegradable polymers. Editor J. O. Hollinger (Boca Raton, FL, USA: CRC Press), 223–233.

Google Scholar

Auras, R. A., Lim, L. T., Selke, S. E. M., Tsuji, H., Lim, L. T., and Tsuji, H. (2010). Poly(Lactic acid): synthesis, structures, properties, processing, and applications. Incorporated: John Wiley and Sons.

Google Scholar

Bácskay, I., Ujhelyi, Z., Fehér, P., and Arany, P. (2022). The evolution of the 3D-printed drug delivery systems: a review. Pharmaceutics 14, 1312. doi:10.3390/pharmaceutics14071312

PubMed Abstract | CrossRef Full Text | Google Scholar

Bergsma, J. E., Rozema, F. R., Bos, R. R. M., Boering, G., Joziasse, C. A. P., and Pennings, A. J. (1995). In vitro predegradation at elevated temperatures of poly(lactide). J. Mater. Sci. Mater. Med. 6, 642–646. doi:10.1007/BF00123445

CrossRef Full Text | Google Scholar

Blanchard, F. (2021). ICDD grant-in-aid (1991). Powder diffraction file (PDF)- 2 2021, 00-043-0697.

Google Scholar

Castilho, M., Mouser, V., Chen, M., Malda, J., and Ito, K. (2019). Bi-layered micro-fibre reinforced hydrogels for articular cartilage regeneration. Acta Biomater. 95, 297–306. doi:10.1016/j.actbio.2019.06.030

PubMed Abstract | CrossRef Full Text | Google Scholar

Chausse, V., Iglesias, C., Bou-Petit, E., Ginebra, M. P., and Pegueroles, M. (2023). Chemical vs thermal accelerated hydrolytic degradation of 3D-printed PLLA/PLCL bioresorbable stents: characterization and influence of sterilization. Polym. Test. 117, 107817. doi:10.1016/j.polymertesting.2022.107817

CrossRef Full Text | Google Scholar

Chye, J. L. S., Ooi, C. P., Hong, E. W. S., and Chiang, F. B. Y. (2005). Effect of isothermal annealing on the hydrolytic degradation rate of poly(lactide-co-glycolide) (PLGA). Biomaterials 26, 2827–2833. doi:10.1016/j.biomaterials.2004.08.031

PubMed Abstract | CrossRef Full Text | Google Scholar

Cui, L., Imre, B., Tátraaljai, D., and Pukánszky, B. (2020). Physical ageing of Poly(Lactic acid): factors and consequences for practice. Polymer 186, 122014. doi:10.1016/j.polymer.2019.122014

CrossRef Full Text | Google Scholar

da Silva, D., Kaduri, M., Poley, M., Adir, O., Krinsky, N., Shainsky-Roitman, J., et al. (2018). Biocompatibility, biodegradation and excretion of polylactic acid (PLA) in medical implants and theranostic systems. Chem. Eng. J. 340, 9–14. doi:10.1016/j.cej.2018.01.010

PubMed Abstract | CrossRef Full Text | Google Scholar

Deb, S. (2009). “2 - degradable polymers and polymer composites for tissue engineering,” in Cellular Response to biomaterials (woodhead publishing). Editor L. Di Silvio (Cambridge, United Kingdom: Woodhead Publishing Series in Biomaterials), 28–60. doi:10.1533/9781845695477.1.28

CrossRef Full Text | Google Scholar

de Tayrac, R., Chentouf, S., Garreau, H., Braud, C., Guiraud, I., Boudeville, P., et al. (2008). In vitro degradation and in vivo biocompatibility of poly(lactic acid) mesh for soft tissue reinforcement in vaginal surgery. J. Biomed. Mater. Res. Part B Appl. Biomaterials 85B, 529–536. doi:10.1002/jbm.b.30976

CrossRef Full Text | Google Scholar

Ding, L., Davidchack, R. L., and Pan, J. (2012). A molecular dynamics study of Young’s modulus change of semi-crystalline polymers during degradation by chain scissions. J. Mech. Behav. Biomed. Mater. 5, 224–230. doi:10.1016/j.jmbbm.2011.09.002

PubMed Abstract | CrossRef Full Text | Google Scholar

Duek, E. A. R., Zavaglia, C. A. C., and Belangero, W. D. (1999). In vitro study of poly(lactic acid) pin degradation. Polymer 40, 6465–6473. doi:10.1016/S0032-3861(98)00846-5

CrossRef Full Text | Google Scholar

Eyal, A. M., and Canari, R. (1995). pH dependence of carboxylic and mineral acid extraction by amine-based extractants: effects of pKa, amine basicity, and diluent properties. Industrial Eng. Chem. Res. 34, 1789–1798. doi:10.1021/ie00044a030

CrossRef Full Text | Google Scholar

Fischer, E. W., Sterzel, H. J., and Wegner, G. (1973). Investigation of the structure of solution grown crystals of lactide copolymers by means of chemical reactions. Kolloid-Z, U. Z. Polym., 11. doi:10.1007/BF01498927

CrossRef Full Text | Google Scholar

Fu, K., Pack, D. W., Klibanov, A. M., and Langer, R. (2000). Visual evidence of acidic environment within degrading poly(lactic-co-glycolic acid) (PLGA) microspheres. Pharm. Res. 17, 100–106. doi:10.1023/A:1007582911958

PubMed Abstract | CrossRef Full Text | Google Scholar

George, A. S. H., George, D. A. S., Baskar, D. T., and Shahul, A. (2023). 3D printed organs: a new frontier in medical technology. Partners Univers. Int. Innovation J. 1, 187–208. doi:10.5281/zenodo.8076965

CrossRef Full Text | Google Scholar

Göpferich, A. (1997). Polymer bulk erosion. Macromolecules 30, 2598–2604. doi:10.1021/ma961627y

CrossRef Full Text | Google Scholar

Goyanes, A., Buanz, A. B. M., Hatton, G. B., Gaisford, S., and Basit, A. W. (2015). 3D printing of modified-release aminosalicylate (4-ASA and 5-ASA) tablets. Eur. J. Pharm. Biopharm. 89, 157–162. doi:10.1016/j.ejpb.2014.12.003

PubMed Abstract | CrossRef Full Text | Google Scholar

Grizzi, I., Garreau, P., Li, S., and Vert, M. (1995). Hydrolytic degradation of devices based on poly(dl-lactic acid) size-dependence. Biomaterials 16, 305–311. doi:10.1016/0142-9612(95)93258-F

PubMed Abstract | CrossRef Full Text | Google Scholar

Guerra, A. J., Cano, P., Rabionet, M., Puig, T., and Ciurana, J. (2018). 3D-Printed PCL/PLA composite stents: towards a new solution to cardiovascular problems. Materials 11, 1679. doi:10.3390/ma11091679

PubMed Abstract | CrossRef Full Text | Google Scholar

Hochleitner, G., Chen, F., Blum, C., Dalton, P. D., Amsden, B., and Groll, J. (2018). Melt electrowriting below the critical translation speed to fabricate crimped elastomer scaffolds with non-linear extension behaviour mimicking that of ligaments and tendons. Acta Biomater. 72, 110–120. doi:10.1016/j.actbio.2018.03.023

PubMed Abstract | CrossRef Full Text | Google Scholar

Hu, Q., Zhang, R., Zhang, H., Yang, D., Liu, S., Song, Z., et al. (2021). Topological structure design and fabrication of biocompatible PLA/TPU/ADM mesh with appropriate elasticity for hernia repair. Macromol. Biosci. 21, 2000423. doi:10.1002/mabi.202000423

CrossRef Full Text | Google Scholar

Jumat, M. A., Chevallier, P., Mantovani, D., Copes, F., Razak, S. I. A., and Saidin, S. (2021). Three-dimensional printed biodegradable poly(l-lactic acid)/poly(d-lactic acid) scaffold as an intervention of biomedical substitute. Polymer-Plastics Technol. Mater. 60, 1005–1015. doi:10.1080/25740881.2021.1876879

CrossRef Full Text | Google Scholar

Kai, D., Liow, S. S., and Loh, X. J. (2014). Biodegradable polymers for electrospinning: towards biomedical applications. Mater. Sci. Eng. C 45, 659–670. doi:10.1016/j.msec.2014.04.051

PubMed Abstract | CrossRef Full Text | Google Scholar

Lee, H., Ahn, S., Choi, H., Cho, D., and Kim, G. (2013). Fabrication, characterization, and in vitro biological activities of melt-electrospun PLA micro/nanofibers for bone tissue regeneration. J. Mater. Chem. B 1, 3670–3677. doi:10.1039/C3TB20424C

PubMed Abstract | CrossRef Full Text | Google Scholar

Li, S. (1999). Hydrolytic degradation characteristics of aliphatic polyesters derived from lactic and glycolic acids. J. Biomed. Mater. Res. 48, 342–353. doi:10.1002/(SICI)1097-4636(1999)48:3⟨342::AID-JBM20⟩3.0.CO;2-7

PubMed Abstract | CrossRef Full Text | Google Scholar

Li, S., Garreau, H., and Vert, M. (1990). Structure-property relationships in the case of the degradation of massive poly(alpha-hydroxy acids) in aqueous media. J. Mater. Sci. Mater. Med. 1, 198–206. doi:10.1007/BF00701077

CrossRef Full Text | Google Scholar

Limsukon, W., Rubino, M., Rabnawaz, M., Lim, L. T., and Auras, R. (2023). Hydrolytic degradation of poly(lactic acid): unraveling correlations between temperature and the three phase structures. Polym. Degrad. Stab. 217, 110537. doi:10.1016/j.polymdegradstab.2023.110537

CrossRef Full Text | Google Scholar

Lotz, B., Li, G., Chen, X., and Puiggali, J. (2017). Crystal polymorphism of polylactides and poly(Pro-alt-CO): the metastable beta and gamma phases. Formation of homochiral PLLA phases in the PLLA/PDLA blends. Polymer 115, 204–210. doi:10.1016/j.polymer.2017.03.018

CrossRef Full Text | Google Scholar

Lu, L., Garcia, C. A., and Mikos, A. G. (1999). In vitro degradation of thin poly(DL-lactic-co-glycolic acid) films. J. Biomed. Mater. Res. 46, 236–244. doi:10.1002/(SICI)1097-4636(199908)46:2⟨236::AID-JBM13⟩3.0.CO;2-F

PubMed Abstract | CrossRef Full Text | Google Scholar

MacLeod, A., Patterson, M., MacTear, K., and Gill, H. S. (2020). 3D printed locking osteosynthesis screw threads have comparable strength to machined or hand-tapped screw threads. J. Orthop. Res. 38, 1559–1565. doi:10.1002/jor.24712

PubMed Abstract | CrossRef Full Text | Google Scholar

McCormick, C. (2018). “1 - overview of cardiovascular stent designs,” in Functionalised cardiovascular stents. Editors J. G. Wall, H. Podbielska, and M. Wawrzyńska (Duxford, United Kingdom: Woodhead Publishing), 3–26. doi:10.1016/B978-0-08-100496-8.00001-9

CrossRef Full Text | Google Scholar

Middleton, J. C., and Tipton, A. J. (2000). Synthetic biodegradable polymers as orthopedic devices. Biomaterials 21, 2335–2346. doi:10.1016/S0142-9612(00)00101-0

PubMed Abstract | CrossRef Full Text | Google Scholar

Moliner, C., Finocchio, E., Arato, E., Ramis, G., and Lagazzo, A. (2020). Influence of the degradation medium on water uptake, morphology, and chemical structure of poly(lactic acid)-sisal bio-composites. Materials 13, 3974. doi:10.3390/ma13183974

PubMed Abstract | CrossRef Full Text | Google Scholar

Nagarajan, N., Dupret-Bories, A., Karabulut, E., Zorlutuna, P., and Vrana, N. E. (2018). Enabling personalized implant and controllable biosystem development through 3D printing. Biotechnol. Adv. 36, 521–533. doi:10.1016/j.biotechadv.2018.02.004

PubMed Abstract | CrossRef Full Text | Google Scholar

Pan, P., Liang, Z., Zhu, B., Dong, T., and Inoue, Y. (2008). Roles of physical aging on crystallization kinetics and induction period of poly(l-lactide). Macromolecules 41, 8011–8019. doi:10.1021/ma801436f

CrossRef Full Text | Google Scholar

Pan, P., Zhu, B., and Inoue, Y. (2007). Enthalpy relaxation and embrittlement of poly(l-lactide) during physical aging. Macromolecules 40, 9664–9671. doi:10.1021/ma071737c

CrossRef Full Text | Google Scholar

Pantani, R., and Sorrentino, A. (2013). Influence of crystallinity on the biodegradation rate of injection-moulded poly(lactic acid) samples in controlled composting conditions. Polym. Degrad. Stab. 98, 1089–1096. doi:10.1016/j.polymdegradstab.2013.01.005

CrossRef Full Text | Google Scholar

Passerini, N., and Craig, D. Q. M. (2001). An investigation into the effects of residual water on the glass transition temperature of polylactide microspheres using modulated temperature DSC. J. Control. Release 73, 111–115. doi:10.1016/S0168-3659(01)00245-0

PubMed Abstract | CrossRef Full Text | Google Scholar

Pierre, T. S., and Chiellini, E. (1987). Review: biodegradability of synthetic polymers for medical and pharmaceutical applications: Part 2—backbone hydrolysis. J. Bioact. Compatible Polym. 2, 4–30. doi:10.1177/088391158700200101

CrossRef Full Text | Google Scholar

Pistner, H., Bendi, D. R., Mühling, J., and Reuther, J. F. (1993). Poly (l-lactide): a long-term degradation study in vivo: Part III. Analytical characterization. Biomaterials 14, 291–298. doi:10.1016/0142-9612(93)90121-H

PubMed Abstract | CrossRef Full Text | Google Scholar

Pitt, G. G., Gratzl, M. M., Kimmel, G. L., Surles, J., and Sohindler, A. (1981). Aliphatic polyesters II. The degradation of poly (DL-lactide), poly (ε-caprolactone), and their copolymers in vivo. Biomaterials 2, 215–220. doi:10.1016/0142-9612(81)90060-0

PubMed Abstract | CrossRef Full Text | Google Scholar

Qamar, N., Abbas, N., Irfan, M., Hussain, A., Arshad, M. S., Latif, S., et al. (2019). Personalized 3D printed ciprofloxacin impregnated meshes for the management of hernia. J. Drug Deliv. Sci. Technol. 53, 101164. doi:10.1016/j.jddst.2019.101164

CrossRef Full Text | Google Scholar

Ren, J., Murray, R., Wong, C. S., Qin, J., Chen, M., Totsika, M., et al. (2022). Development of 3D printed biodegradable mesh with antimicrobial properties for pelvic organ prolapse. Polymers 14, 763. doi:10.3390/polym14040763

PubMed Abstract | CrossRef Full Text | Google Scholar

Roper, D. M., Kwon, K. A., Best, S. M., and Cameron, R. E. (2021). The 3D printing of freestanding PLLA thin layers and improving first layer consistency through the introduction of sacrificial PVA. Appl. Sci. 11, 6320. doi:10.3390/app11146320

CrossRef Full Text | Google Scholar

Roper, D. M., Kwon, K. A., Malone, L. P., Best, S. M., and Cameron, R. E. (2022). Induced birefringence in 3D printing: concealing information optically within printed objects. Adv. Mater. Technol. 7, 2200139. doi:10.1002/admt.202200139

CrossRef Full Text | Google Scholar

Ru, J. F., Yang, S. G., Zhou, D., Yin, H. M., Lei, J., and Li, Z. M. (2016). Dominant β-form of poly(l-lactic acid) obtained directly from melt under shear and pressure fields. Macromolecules 49, 3826–3837. doi:10.1021/acs.macromol.6b00595

CrossRef Full Text | Google Scholar

Sakamoto, A., Jinnouchi, H., Torii, S., Virmani, R., and Finn, A. V. (2018). Understanding the impact of stent and scaffold material and strut design on coronary artery thrombosis from the basic and clinical points of view. Bioengineering 5, 71. doi:10.3390/bioengineering5030071

PubMed Abstract | CrossRef Full Text | Google Scholar

Sevim, K., and Pan, J. (2018). A model for hydrolytic degradation and erosion of biodegradable polymers. Acta Biomater. 66, 192–199. doi:10.1016/j.actbio.2017.11.023

PubMed Abstract | CrossRef Full Text | Google Scholar

Siemann, U. (1985). The influence of water on the glass transition of poly(dl-lactic acid). Thermochim. Acta 85, 513–516. doi:10.1016/0040-6031(85)85633-1

CrossRef Full Text | Google Scholar

Singh, D., Babbar, A., Jain, V., Gupta, D., Saxena, S., and Dwibedi, V. (2019). Synthesis, characterization, and bioactivity investigation of biomimetic biodegradable PLA scaffold fabricated by fused filament fabrication process. J. Braz. Soc. Mech. Sci. Eng. 41, 121. doi:10.1007/s40430-019-1625-y

CrossRef Full Text | Google Scholar

Song, Z., Ma, Y., Xia, G., Wang, Y., Kapadia, W., Sun, Z., et al. (2017). In vitro and in vivo combined antibacterial effect of levofloxacin/silver co-loaded electrospun fibrous membranes. J. Mater. Chem. B 5, 7632–7643. doi:10.1039/C7TB01243H

PubMed Abstract | CrossRef Full Text | Google Scholar

Tamai, H., Igaki, K., Kyo, E., Kosuga, K., Kawashima, A., Matsui, S., et al. (2000). Initial and 6-month results of biodegradable poly-l-lactic acid coronary stents in humans. Circulation 102, 399–404. doi:10.1161/01.cir.102.4.399

PubMed Abstract | CrossRef Full Text | Google Scholar

Tsuji, H. (2002). Autocatalytic hydrolysis of amorphous-made polylactides: effects of l-lactide content, tacticity, and enantiomeric polymer blending. Polym. (Guilford) 43, 1789–1796. doi:10.1016/S0032-3861(01)00752-2

CrossRef Full Text | Google Scholar

Tsuji, H., and Ikada, Y. (1997). Blends of crystalline and amorphous poly(lactide). III. Hydrolysis of solution-cast blend films. J. Appl. Polym. Sci. 63, 855–863. doi:10.1002/(sici)1097-4628(19970214)63:7<855::aid-app5>3.3.co;2-4

CrossRef Full Text | Google Scholar

Tsuji, H., and Ikada, Y. (1998). Properties and morphology of poly(L-lactide). II. Hydrolysis in alkaline solution. J. Polym. Sci. Part A Polym. Chem. 36, 59–66. doi:10.1002/(SICI)1099-0518(19980115)36:1⟨59::AID-POLA9⟩3.0.CO;2-X

CrossRef Full Text | Google Scholar

Tsuji, H., and Ikarashi, K. (2004a). In vitro hydrolysis of poly(l-lactide) crystalline residues as extended-chain crystallites. Part I: long-term hydrolysis in phosphate-buffered solution at 37°C. Biomaterials 25, 5449–5455. doi:10.1016/j.biomaterials.2003.12.053

PubMed Abstract | CrossRef Full Text | Google Scholar

Tsuji, H., and Ikarashi, K. (2004b). In vitro hydrolysis of poly(l-lactide) crystalline residues as extended-chain crystallites: II. Effects of hydrolysis temperature. Biomacromolecules 5, 1021–1028. doi:10.1021/bm034523l

PubMed Abstract | CrossRef Full Text | Google Scholar

Tsuji, H., Ikarashi, K., and Fukuda, N. (2004). Poly(l-lactide): XII. Formation, growth, and morphology of crystalline residues as extended-chain crystallites through hydrolysis of poly(l-lactide) films in phosphate-buffered solution. Polym. Degrad. Stab. 84, 515–523. doi:10.1016/j.polymdegradstab.2004.01.010

CrossRef Full Text | Google Scholar

Tsuji, H., Mizuno, A., and Ikada, Y. (2000). Properties and morphology of poly(L-lactide). III. Effects of initial crystallinity on long-term in vitro hydrolysis of high molecular weight poly(L-lactide) film in phosphate-buffered solution. J. Appl. Polym. Sci. 77, 1452–1464. doi:10.1002/1097-4628(20000815)77:7⟨1452::AID-APP7⟩3.0.CO;2-S

CrossRef Full Text | Google Scholar

Tsuji, H., and Suzuyoshi, K. (2002). Environmental degradation of biodegradable polyesters 1. Poly(ε-caprolactone), poly[(R)-3-hydroxybutyrate], and poly(L-lactide) films in controlled static seawater. Polym. Degrad. Stab. 75, 347–355. doi:10.1016/S0141-3910(01)00240-3

CrossRef Full Text | Google Scholar

Vaid, R., Yildirim, E., Pasquinelli, M. A., and King, M. W. (2021). Hydrolytic degradation of polylactic acid fibers as a function of pH and exposure time. Molecules 26, 7554. doi:10.3390/molecules26247554

PubMed Abstract | CrossRef Full Text | Google Scholar

Vasanthan, N., and Ly, O. (2009). Effect of microstructure on hydrolytic degradation studies of poly (l-lactic acid) by FTIR spectroscopy and differential scanning calorimetry. Polym. Degrad. Stab. 94, 1364–1372. doi:10.1016/j.polymdegradstab.2009.05.015

CrossRef Full Text | Google Scholar

Vert, M., Li, S., and Garreau, H. (1991). More about the degradation of LA/GA-derived matrices in aqueous media. J. Control. release 16, 15–26. doi:10.1016/0168-3659(91)90027-B

CrossRef Full Text | Google Scholar

von Burkersroda, F., Schedl, L., and Göpferich, A. (2002). Why degradable polymers undergo surface erosion or bulk erosion. Biomaterials 23, 4221–4231. doi:10.1016/S0142-9612(02)00170-9

PubMed Abstract | CrossRef Full Text | Google Scholar

von Recum, H. A., Cleek, R. L., Eskin, S. G., and Mikos, A. G. (1995). Degradation of polydispersed poly(l-lactic acid) to modulate lactic acid release. Biomaterials 16, 441–447. doi:10.1016/0142-9612(95)98816-W

PubMed Abstract | CrossRef Full Text | Google Scholar

Vyavahare, O., Ng, D., and Hsu, S. L. (2014). Analysis of structural rearrangements of poly(lactic acid) in the presence of water. J. Phys. Chem. B 118, 4185–4193. doi:10.1021/jp500219j

PubMed Abstract | CrossRef Full Text | Google Scholar

Wang, X., Li, G., Liu, Y., Yu, W., and Sun, Q. (2017). Biocompatibility of biological material polylactic acid with stem cells from human exfoliated deciduous teeth. Biomed. Rep. 6, 519–524. doi:10.3892/br.2017.881

PubMed Abstract | CrossRef Full Text | Google Scholar

Wasanasuk, K., Tashiro, K., Hanesaka, M., Ohhara, T., Kurihara, K., Kuroki, R., et al. (2011). Crystal structure analysis of poly(l-lactic acid) α form on the basis of the 2-dimensional wide-angle synchrotron X-ray and neutron diffraction measurements. Macromolecules 44, 6441–6452. doi:10.1021/ma2006624

CrossRef Full Text | Google Scholar

Weir, N. A., Buchanan, F. J., and Dickson, G. R. (2004b). Degradation of poly-L-lactide. Part 1: in vitro and in vivo physiological temperature degradation. Proc. Institution Mech. Eng. Part H, J. Eng. Med. 218, 307–319. doi:10.1243/0954411041932782

PubMed Abstract | CrossRef Full Text | Google Scholar

Weir, N. A., Buchanan, F. J., Orr, J. F., Farrar, D. F., and Dickson, G. R. (2004a). Degradation of poly-L-lactide. Part 2: increased temperature accelerated degradation. Proc. Institution Mech. Eng. Part H J. Eng. Med. 218, 321–330. doi:10.1243/0954411041932809

PubMed Abstract | CrossRef Full Text | Google Scholar

Witt, C., and Kissel, T. (2001). Morphological characterization of microspheres, films and implants prepared from poly(lactide-co-glycolide) and ABA triblock copolymers: is the erosion controlled by degradation, swelling or diffusion? Eur. J. Pharm. Biopharm. 51, 171–181. doi:10.1016/S0939-6411(01)00130-8

PubMed Abstract | CrossRef Full Text | Google Scholar

Yoon, S. D., Kwon, Y. S., and Lee, K. S. (2017). Biodegradation and biocompatibility of poly L-lactic acid implantable mesh. Int. Neurourol. J. 21, S48–S54. doi:10.5213/inj.1734882.441

PubMed Abstract | CrossRef Full Text | Google Scholar

Zhao, W., Du, Z., Fang, J., Fu, L., Zhang, X., Cai, Q., et al. (2020). Synthetic/natural blended polymer fibrous meshes composed of polylactide, gelatin and glycosaminoglycan for cartilage repair. J. Biomaterials Sci. 31, 1437–1456. doi:10.1080/09205063.2020.1760701

PubMed Abstract | CrossRef Full Text | Google Scholar

Keywords: poly-l-lactic acid, degradation, biodegradable polymers, crystallinity, molecular weight, 3D printing, electrospinning

Citation: Malone LP, Best SM and Cameron RE (2024) Accelerated degradation testing impacts the degradation processes in 3D printed amorphous PLLA. Front. Bioeng. Biotechnol. 12:1419654. doi: 10.3389/fbioe.2024.1419654

Received: 18 April 2024; Accepted: 18 June 2024;
Published: 05 July 2024.

Edited by:

Eliza L. S. Fong, National University of Singapore, Singapore

Reviewed by:

Ajay Devidas Padsalgikar, Biolinq Inc, United States
Luis A. Diaz-Gomez, Universidade de Santiago de Compostela, Spain

Copyright © 2024 Malone, Best and Cameron. This is an open-access article distributed under the terms of the Creative Commons Attribution License (CC BY). The use, distribution or reproduction in other forums is permitted, provided the original author(s) and the copyright owner(s) are credited and that the original publication in this journal is cited, in accordance with accepted academic practice. No use, distribution or reproduction is permitted which does not comply with these terms.

*Correspondence: Luke P. Malone, lpm39@cam.ac.uk

Disclaimer: All claims expressed in this article are solely those of the authors and do not necessarily represent those of their affiliated organizations, or those of the publisher, the editors and the reviewers. Any product that may be evaluated in this article or claim that may be made by its manufacturer is not guaranteed or endorsed by the publisher.