 Robin Remus
 Christian Sure
 Sascha Selkmann
 Eike Uttich
 Beate Bender
- Chair of Product Development, Department of Mechanical Engineering, Ruhr-University Bochum, Bochum, Germany
Simulations of human-technology interaction in the context of product development require comprehensive knowledge of biomechanical in vivo behavior. To obtain this knowledge for the abdomen, we measured the continuous mechanical responses of the abdominal soft tissue of ten healthy participants in different lying positions anteriorly, laterally, and posteriorly under local compression depths of up to 30 mm. An experimental setup consisting of a mechatronic indenter with hemispherical tip and two time-of-flight (ToF) sensors for optical 3D displacement measurement of the surface was developed for this purpose. To account for the impact of muscle tone, experiments were conducted with both controlled activation and relaxation of the trunk muscles. Surface electromyography (sEMG) was used to monitor muscle activation levels. The obtained data sets comprise the continuous force-displacement data of six abdominal measurement regions, each synchronized with the local surface displacements resulting from the macro-indentation, and the bipolar sEMG signals at three key trunk muscles. We used inverse finite element analysis (FEA), to derive sets of nonlinear material parameters that numerically approximate the experimentally determined soft tissue behaviors. The physiological standard values obtained for all participants after data processing served as reference data. The mean stiffness of the abdomen was significantly different when the trunk muscles were activated or relaxed. No significant differences were found between the anterior-lateral measurement regions, with exception of those centered on the linea alba and centered on the muscle belly of the rectus abdominis below the intertubercular plane. The shapes and areas of deformation of the skin depended on the region and muscle activity. Using the hyperelastic Ogden model, we identified unique material parameter sets for all regions. Our findings confirmed that, in addition to the indenter force-displacement data, knowledge about tissue deformation is necessary to reliably determine unique material parameter sets using inverse FEA. The presented results can be used for finite element (FE) models of the abdomen, for example, in the context of orthopedic or biomedical product developments.
1 Introduction
Understanding the functions and properties of biomechanical systems is a key success factor in computer-aided human-centered design (Neumann and Bender, 2022). The basis for this are robust and valid human body models, that allow to examine the effects of crucial biological or technical variables (Wolf et al., 2020b; Neumann et al., 2020). Product development involving user behaviors or properties of the human body has traditionally been an iterative and empirical process (Grujicic et al., 2010). CAE (computer-aided engineering) can help reduce development costs and time, as it enables early preclinical verification, ethical assurance, reduction of repetitive patient involvement, and quantification of mechanisms of action (Wolf et al., 2020a; Alawneh et al., 2022). However, the study and optimization of the interfaces between biomechanical and technical systems is particularly complex, as the transferred values are directly influenced by the interaction between the geometry and mechanical properties of both the human tissue and the technical system (Haug et al., 2004; Portnoy et al., 2008; Moerman et al., 2016; Sadler et al., 2018; Fougeron et al., 2023). In particular, this is the case in the lower part of the trunk, or the abdomen, as it consists of highly vulnerable tissue with great anatomical variations (Lamielle et al., 2008) and ensures vital bodily functions (Standring et al., 2016). Moreover, issues affecting the lower back, such as pain, are also associated with the soft tissues of the abdomen, which contribute to its stabilization (Hodges et al., 2005; Driscoll and Blyum, 2019) and unloading (Hodges et al., 2001; Stokes et al., 2010). In order to broaden the understanding of these biomechanical relationships and to improve the development of new aids using simulation models, the soft tissue behavior of the abdomen will be investigated in this study.
Recent simulation models that include the biomechanical behavior of the abdomen or parts of it differ in their implementing methods, scope, and degree of detail, depending on the requirements of their intended use case (Anderson et al., 2007; Hicks et al., 2015). Possible use cases encompass, for example, studies on 1) the effect of individual braces in scoliosis treatment (Périé et al., 2004; Clin et al., 2010; Sattout et al., 2016), or of lumbar orthoses (Molimard et al., 2019; Bonnaire et al., 2020) on the lumbosacral spine, 2) injury prevention in crash testing (King, 2018; Untaroiu et al., 2018; Grébonval et al., 2021) and stiff structure impact (Lee and Yang, 2001; Haug et al., 2004; Snedeker et al., 2007) or vertical impact load (Cox, 2020) studies, or 3) the load removal of the spine by increasing the intra-abdominal pressure (El-Monajjed and Driscoll, 2020; Guo et al., 2021). Another use case is modelling the interaction of organs (Misra et al., 2008), or the abdominal wall with surgical instruments (Hernández et al., 2011); these models are used for virtual surgical planning or support of education (Leong et al., 2022). Recently, authors analyzed the effects of muscular contractions on the biomechanics of the abdominal wall numerically (Pavan et al., 2019; Todros et al., 2020).
FEA is a standard approach in mechanics to calculate the reaction of structures to loads or interactions, but only few FE models exist that model the biomechanics for the whole abdomen (King, 2018). One aspect of biomechanical modelling are geometric shapes. While imaging data is accurate (Hayes et al., 2013a), it is not sufficient to derive material properties in terms of stress-strain data for all nonlinear responses of soft tissues (Sadler et al., 2018) and their interplay. In recent years, advancements in automatic segmentation methods, e.g., deep learning algorithms for exact and individual or statistical shape models, enabled the rapid generation of anatomical geometries (Sekuboyina et al., 2021; Ji et al., 2022; Ma et al., 2022). Geometrical data sets were generated using a large amount of imaging data, which include collections of single organs, vessels, and bones, as well as collections of body segments (Li et al., 2023).
While geometries are increasingly patient-specific and complex, the literature still lacks data on soft tissue material behavior, which is crucial for valid simulations (Kauer et al., 2002; van Loocke et al., 2006; Anderson et al., 2007). Thus, it is difficult to compile the complete data sets required for biomechanical modelling of the abdomen. Numerous invasive and non-invasive studies have been conducted to capture properties that go beyond the pure geometry of the abdomen, the abdominal wall that spans the anterior and lateral side of the abdomen, or the organs. Strategies used include, for example, the indirect and non-invasive estimation of intra-abdominal pressure (Tayebi et al., 2021) by measuring the tension of the abdominal wall via indentation (van Ramshorst et al., 2008; van Ramshorst et al., 2011). Functional responses, deformations, and kinematics of the abdominal wall were assessed during controlled muscle activity (Todros et al., 2019; Jourdan et al., 2022) or during upper body movements (Szymczak et al., 2012; Remus et al., 2023). Song et al. (2006) measured the in vivo elasticity of the entire abdominal wall during laparoscopic surgery and Szepietowska et al. (2023) investigated the non-homogeneous strain fields of external living human abdominal walls during peritoneal dialysis and breathing. Podwojewski et al. (2014) and Tran et al. (2014) examined abdominal walls subjected to air pressure loading ex vivo. Because the abdominal wall plays a crucial role in protecting the abdominal organs, moving the trunk, and stabilizing the lumbar spine (Hodges et al., 2005), other researchers used shear wave elastography (Tran et al., 2016; Wang et al., 2020) to estimate the elasticity of abdominal wall muscles, for example, to improve the treatment of hernias (Deeken and Lake, 2017). However, the biomechanical behavior of the abdomen and its elements depends strongly on the interplay of its elements. For example, muscle contractions and intra-abdominal pressure affect the biomechanics of the abdominal wall (Pavan et al., 2019), and the abdominal organs interact with neighboring organs and the walls of the abdominal cavity while undergoing large relative sliding movements (Haug et al., 2004). The mechanical properties of organs and their interactions were investigated under numerous aspects such as abdominal trauma (Viano, 1989; Lamielle et al., 2008; Ramachandra, 2016) or tool-tissue interactions (Carter et al., 2001; Davies et al., 2002; Tay et al., 2006; Sato et al., 2013).
Due to the lack of data on soft tissue behavior, in addition to an exact anatomical model, simplifications and assumptions, depending on the biomechanical modelling goals (Lee and Yang, 2001), are necessary. While it is known that abdominal muscles have a stiffening effect on the trunk (Hodges et al., 2015), it is rarely considered in abdominal interaction models and as it can only be determined in vivo. Modelling the macroscopic behavior requires geometry data and force-compression functions, but the amount of in vivo data present in literature is limited, e.g., due to ethical implications, costs, or expenditure of time. Therefore, when creating an interaction model, it may be necessary to identify own material parameters for the macroscopic behavior. A common approach for the abdomen is to assume one linear material parameter per body region and varying body postures (Périé et al., 2004; Cooper et al., 2019; Bonnaire et al., 2020), but among others, Huang and Zheng (2015) state that one parameter pure elasticity theory is not sufficient to meet the hyperelastic properties of soft tissue (van Loocke et al., 2006).
Indentation is a common approach to determine the macroscopic behavior and properties of tissue in different body regions (Huang and Zheng, 2015), e.g., buttock (Grujicic et al., 2010), thigh (Sadler et al., 2018), shank (Moerman et al., 2016), foot (Erdemir et al., 2006), or lower arm (Moerman, 2012). If impact time and total deformation are surveilled and limited, indentation is a safe and non-invasive method for in vivo measurement of hyperelastic soft tissue (Huang and Zheng, 2015). Zhang et al. (1997) and Marinopoulos et al. (2020) view material property measurement of soft tissue with an indenter as an inverse problem, and Davies et al. (2002) introduced an inverse engineering approach to solve the problem. However, extracting unique material parameters from indenter measurements can be difficult (Pierrat et al., 2018), because the inverse FEA might result in several parameter sets, which lead to similar experimental and simulation data with one or none being valid (Oddes and Solav, 2023). A possible approach to solve this problem is to measure the displacement of the surrounding surface, for example, via 3D digital image correlation (Solav et al., 2018), or an optical 3D deformation analyzer (Ahn and Kim, 2010). Conducting indentations and surface displacement measurements usually requires custom technical solutions (Lister et al., 2011) that must comply with strict safety regulations while producing adequate results (Marinopoulos et al., 2020).
The assessment of hyperelastic in vivo material parameters of the abdomen is extensive and requires appropriate measurements, which have rarely been reported. The aim of this study is therefore to determine the mechanical in vivo responses of the physiological abdomen under local uniaxial compression, taking into account the activation of trunk muscles during various controlled activities, and to derive characterizing hyperelastic material properties. For this purpose, we aim to
1) obtain continuous force-displacement curves from macro-indentation experiments, including the associated surface deformations, and
2) conduct inverse FE simulations for region-specific hyperelastic material model data.
We hypothesize that the abdominal tissue responses under local compressions show significant variations between regions and with varying muscle activities. Our approach is to determine unique material parameters using inverse FEA based on data that we have recorded non-invasively with an indenter developed for this purpose, including ToF 3D measurements. In order to evaluate the influence of muscle tone on the elasticity of the abdominal soft tissue, the tests were performed on multiple participants under both activation and relaxation of the trunk muscles. sEMG signals of the main trunk muscles were measured to monitor and evaluate activation. Measurements hopefully reduce inherent variability and errors due to uncertainties and provide new possibilities for human-technology interaction simulations.
2 Materials and methods
The study is divided into three sections: 1) The experimental acquisition of force-displacement curves with the associated surface deformations at six different regions of the abdomen, 2) the processing of the measured data, and 3) the determination of descriptive material parameters by means of inverse FEA.
2.1 Study design and participants
A total of ten healthy males (25–37 years) participated in the study. Exclusion criteria were acute abdominal or low back pain, limited range of motion and trunk injuries, nervous system disorders, or skin diseases. All participants were fasting at least 2 h before the start of the study and wore loose pants without a restrictive waistband. Anthropometric characteristics of the participants were taken as shown in Table 1. This included body weight and skinfold thicknesses (Clauser et al., 1988; Norton, 2018). The latter was measured three times at each of seven positions (Norton, 2018) with a calibrated Harpenden Skinfold Caliper. For consistency, all data was recorded by a single examiner. The participants’ body mass index (BMI) was within the normal range (19.5–24.6 kg/m2). The Ethics Committee of the Medical Faculty of the Ruhr-University Bochum approved the study (23-7868 08/10/23) and participants provided written informed consent.
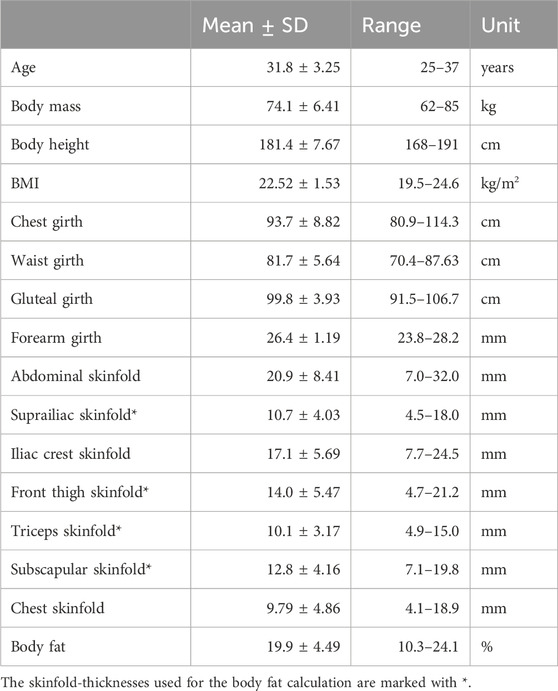
Table 1. Anthropometric characteristics of the participants. Body fat percentage was assessed indirectly using a 4-compartment skinfold-thickness equation (Peterson et al., 2003).
2.2 Equipment and technical calibration
A custom-built mechatronic tissue indenter with test rig (Figure 1) was used to gather the force-displacement curves and the surface displacements simultaneously. The indenter tip was moved towards the participant through a ring [in analogy to Carter et al. (2001)] mounted on the indenter housing. The ring was not continuous, but had cutouts laterally, allowing for visual measurement of the skin deformation (Figure 1C). To define the zero position for each test and to ensure a perpendicular measurement orientation, this contact ring rested lightly on the skin so that the tissue was just visibly compressed. The plastic indenter tip had the shape of a hemisphere with radius
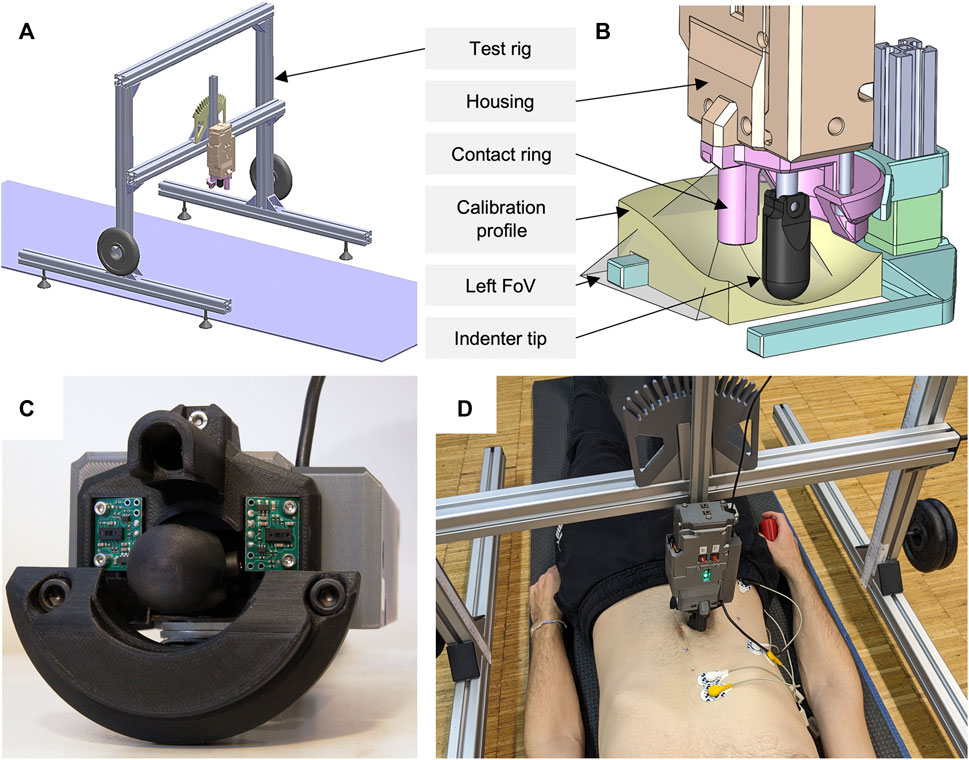
Figure 1. Overview of the experimental setup used. (A) Complete test rig with yoga mat, two additional weights, and mounted indenter in vertical position. (B) ToF sensor calibration setup with visualization of the left field of view (FoV) and an exemplary calibration profile. (C) Close-up of the mechatronic indenter (bottom view). Both ToF sensors, the contact ring with cutouts, and the indenter tip can be seen. (D) Participant in the experimental procedure of measurement region R2 with sEMG electrodes applied and the remote control in his right hand.
To calibrate our force-displacement test setup with tissue-like material (Wells and Liang, 2011), we used cylinders made of ballistic gelatin (GELITA BALLISTIC 3 gelatin, 255–265 g Bloom). The cylinders, 100 mm in diameter and 80 mm in height, were produced according to the preparation procedure of GELITA: Comprised of heating distilled water and gelatin to a maximum of 55°C ± 5°C, curing the mixture in molds for 24 h, demolding the specimens, and conditioning for 60 h within a moisture-sealing barrier. Conditioning temperatures for our cylinders with 10 wt% gelatin solution were 4°C according to FBI recommendations (Fackler and Malinowski, 1988; Maiden et al., 2015) and 15°C for increased compliance. Since gelatin is very sensitive to shear stress (Wells and Liang, 2011; Valliere et al., 2018), we covered the entire top of the gelatin cylinder with a rigid acrylic plate during calibration. Ultrasonic gel was applied in between. A cylinder with 10 mm radius was used as indenter tip. We compressed the differently tempered cylinders three times each at 5 mm/s up to 200 N using our experimental test setup (Figure 1A) and a materials testing machine (Zwick Z010 with GTM GmbH series K, 10 kN, 2 mV/V). Maximum deformation was 24.6 mm at 15°C. Comparing the measurement accuracy, maximum root mean square errors (RMSE) were 0.389 and 0.433 N, and percentage deviations were below 2.4% and 3.1%, for maximum compression forces of 60 and 120 N.
To optically measure the 3D surface deformations, two 8×8 Multi-Zone ToF sensors (VL53L5CX, STMicroelectronics) were used. These were mounted sagittal symmetrically to the sides of the indenter tip on the housing, each at a 12° angle to the observation plane (Figure 1C). The sensor distances perpendicular to the reference plane (zero position) were 35.1 mm. Each trapezoidal field of view, starting at the tip of the indenter, had a diagonal of 63° and a minimum length of 39.1 mm laterally to the reference plane. This resulted in a minimum observable area of approximately 16.74 cm2. When the tissue is deformed starting from its initial state, the measurable area increases. For calibration of the ToF sensors and their data processing, we used 3D printed PLA (polylactic acid) profiles in matt white after ensuring that the optically measured distances did not differ from those of the skin [all participants had a Fitzpatrick skin type (Fitzpatrick, 1988) of I-III]. The seven profiles (including horizontal planar, bevelled at 12° and thus parallel to the sensor plane, convex or concave converging towards the sensor tip) represented continuous surface deformations from 0 to 45 mm (Figure 1B). The processing of the 15 Hz raw sensor data included a transformation of the absolute distance values for the 64 measuring zones into the 3D displacement of the trapezoidally measured surface, a calculation of the means over a sliding window of length 5 across the neighboring elements, and a linear time interpolation to 0.1 s. The comparisons to the fully known geometries resulted in absolute measurement deviations of ±1.6 mm. Maximum deviations occurred in the peripheral measurement zones. Mean RMSE and standard deviation (SD) over all profiles was 0.805 ± 0.45 mm.
2.3 Surface electromyography
During the indenter measurements, bipolar sEMG activity of the three main trunk muscles was recorded using 42 × 24 mm Ag/AgCl disposable surface electrodes with hydrogel (Kendall H93SG). Following skin preparation, three pairs of electrodes were placed on the right side of the body on the anterior abdominal (E1), the lateral abdominal wall (E2), and the paraspinal musculature (E3) (Criswell, 2011) with a center-to-center distance of 24 mm. To not interfere with the optical measurements of the skin deformations, the placements of E1, E2, and E3 were cranial to the subcostal plane. E1 was centered on the rectus abdominis and E3 was centered on the muscle belly of the erector spinae. E2 was located at the level of the most caudal palpable costa spuria in the transition between the hypochondric and right lumbar region (Figure 2). The reference electrode was placed caudally to the lateral abdominal wall muscles in the region of the anterior superior iliac spine. For sEMG signal acquisition, we used three bipolar preamplifiers of type ToMEMG V1.2 and a Tower of Measurement (DeMeTec GmbH, Langgöns, Germany). sEMG signals were sampled at 1024 Hz, filtered, quantified, visualized, and recorded using custom-built software. To mitigate the influence of electrocardiographic and power line artifacts, a band-pass filter between 45 and 500 Hz and a notch filter at 50 Hz were applied to the raw signals. For quantization, root mean square of the filtered signal was calculated on a sliding window of 200 samples (195.3 ms).
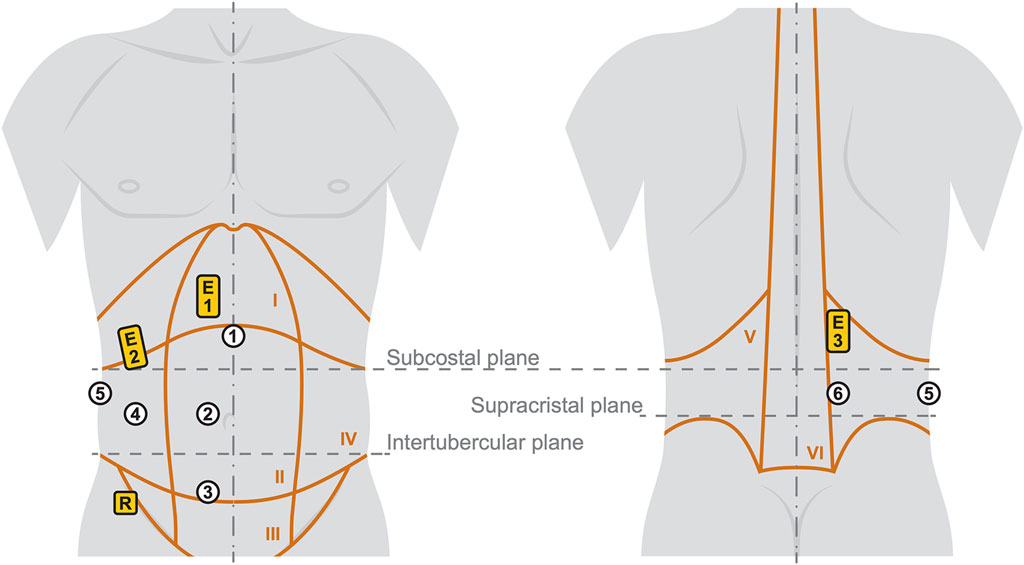
Figure 2. Illustration of the six measurement regions (white circles) with the three sEMG positions (yellow rectangles). The trunk with indicated anatomical characteristics is shown on the left from anterior and on the right from posterior. Details and labels of the Roman numbered body regions I-VI are given in Table 2.
To create a frame of reference for normalization, participants performed maximum voluntary contractions (MVC) in three positions and received the following instructions:
1) MVC in supine position: Crunch with legs bent 90° and abdominal muscles actively tensed after inhaling. Arms at sides of torso, shoulders and head not touching the floor. Gaze is centered on the test bench.
2) MVC in left lateral position: Jackknife with legs and the arm on top extended. The left arm is locked behind the head, the back and neck are kept straight. Legs and head do not touch the floor.
3) MVC in prone position: Superman with arms and legs outstretched. Head, legs, and arms do not touch the ground.
For the sEMG amplitude normalization, the MVCs from the same positions as in the measurements were used in each case. The baseline sEMG activity was recorded when the participants were lying fully relaxed in all three positions before the start of the measurements.
2.4 Experimental procedure
Six measurement regions were deduced from the muscular structures and anatomical characteristics of the abdomen (Rohen et al., 2015; Netter, 2017; Schünke et al., 2018; Tayebi et al., 2021) as visualized in Figure 2 and explained in more detail in Table 2. The regions were identified by palpation (Van Sint Jan, 2007) and marked with a water-soluble pen. To eliminate individual and uncontrollable influence of the trunk muscles to stabilize the spine (Hodges et al., 2015), the participants were lying in three positions: supine, lateral, and prone. Four measurements were taken at each region with fully relaxed (R) and controlled activated (A) musculature, leading to a total of 48 measurements per participant. The regions are numbered from 1 to 6 and measurements were carried out in the same order (for instance: indentation with fully relaxed muscles in measurement region 1 is named R1). To maximize comparability, participants were given the following instructions:
• All measurements: Exhale before starting a measurement and hold the breath while the indenter tip moves out.
• R1-R4 (Supine position): Your legs and arms are stretched out and lie flat on the yoga mat. The head lies on the pillow so that all your muscles are fully relaxed.
• R5 (Left lateral position): Your head lies on the pillow and the legs are slightly bent on top of each other on the yoga mat. The upper arm is held in front of the body. The left arm can be placed under the pillow to support the head and relax the lateral muscles.
• R6 (Prone position): The legs are stretched out and lying on the yoga mat. Your head lies sideways on the pillow and the arms are crossed next to the head. All muscles should be relaxed.
• A1-A4 (Supine position): Your legs and head do not touch the mat. The legs form a right angle. The center of your gaze is directed towards the indenter. The arms are at the side of the upper body.
• A5 (Left lateral position): Your right leg and head are not touching the mat. The right leg is fully extended and in line with the head. To stabilize the body, the right arm is held in front of the body and the left leg is slightly bent. The left arm is stretched upwards.
• A6 (Prone position): Legs and head do not touch the mat. Your legs are stretched out. The arms are folded to the side of the head and are just not touching the mat.
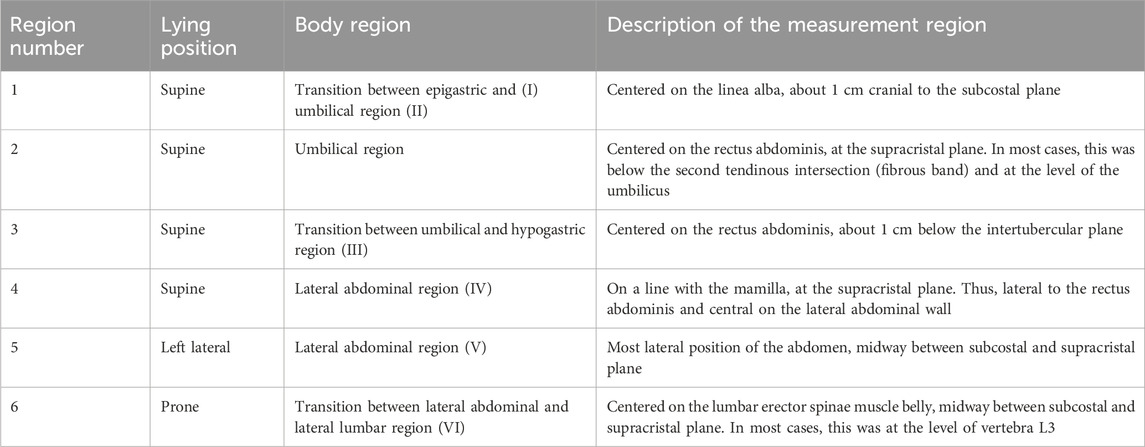
Table 2. Test plan of the unilateral indenter measurements. Assuming abdominal symmetry, the measurements were solely performed on the right side of the body. Each measurement was carried out with fully relaxed (R) and controlled activated (A) muscles at the six regions listed (cf. Figure 2).
By comparing the monitored sEMG amplitudes to that of other participants, the postures were evaluated before and during each measurement and adjusted by interacting with the participant if necessary. To reduce tilting of the pelvis and chest in coronal plane, a folded towel was placed under the waist.
After the posture instructions, ultrasound gel was applied to the measurement region to minimize friction between skin and indenter tip. The test rig was set up so that the indenter was perpendicular to the body (Figure 1D) and the contact ring was in light contact with the skin. This was checked before each single measurement. To familiarize participants with the measurement procedure, test measurements were performed at region 1 with R and A at least once. If the patient breathed during an indentation, significant changes in muscle activity were observed, or other disturbances were detected, the respective measurement was repeated.
2.5 Data processing
Data was processed and analyzed using MATLAB R2022b (MathWorks, Inc., Natick, MA). Three measurements were manually selected for each participant at each measurement region. Data recorded before a detectable contact force and after maximum stroke was not considered for further data processing. For the force-displacement curves, the raw data was cleaned of recording-related outliers. Polynomial curve fits
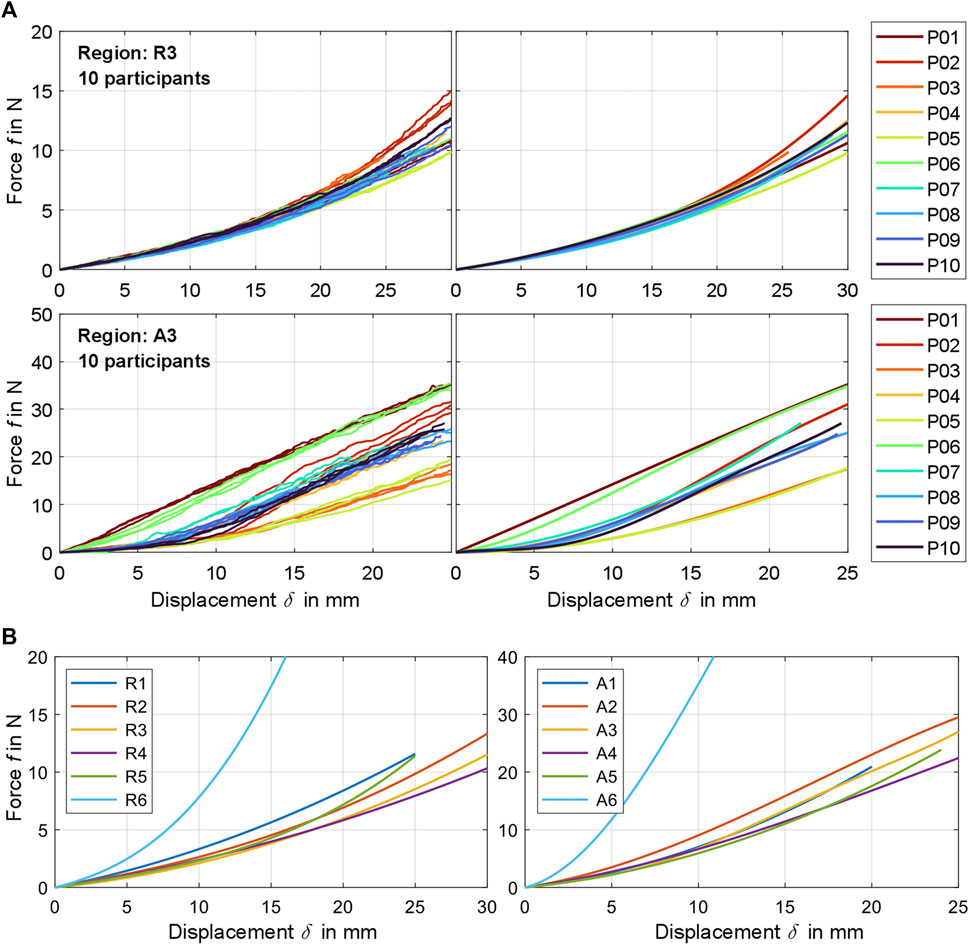
Figure 3. (A) Exemplary comparison of experimentally determined raw force-displacement curves (left) and the participant-related curve fits calculated from these (right) for measurement region 3 for fully relaxed (R) and controlled activated (A) musculature. A visualization for all participants and regions can be found in Supplementary Material S3. (B) Compilation of all mean curve fits
The coefficients
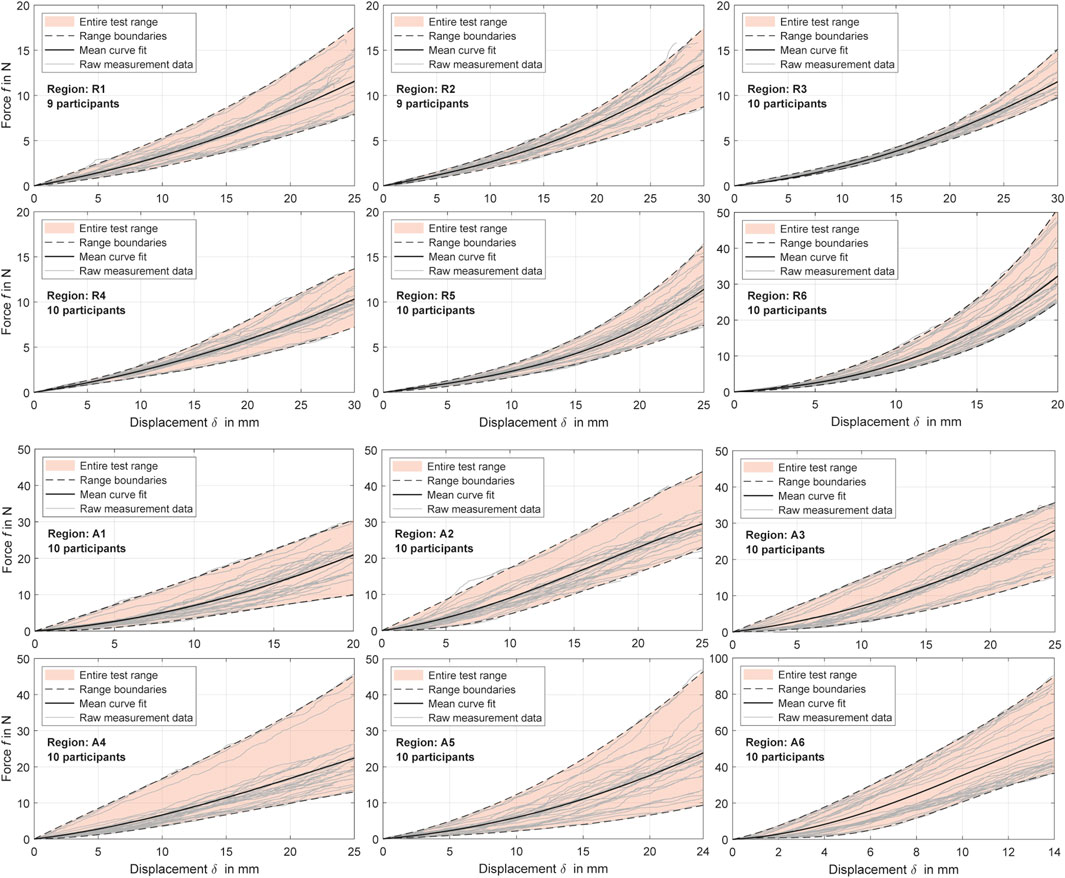
Figure 4. Experimental force-displacement curves for all measurement regions with distinction between relaxed and activated musculature (R and A). The polynomial curve fits (Table 4) are shown alongside the cleaned raw data for all participants and the resulting value ranges.
For the relative skin or surface displacements, we used the measuring points from the fifth row from the anterior of both ToF sensors (Figure 5A), which were synchronized in time with the force-displacement data. These two sets of eight ToF measuring points were located to the left and right of the indenter tip respectively and were used to deduce continuous surface displacement curves: In relation to the reference plane, the vertical components, as visualized in Figure 5B, served as the relative surface displacements. Offsets to the indenter tip were eliminated on the surface side. The first measurable contact force as a result of an incipient deformation was taken as reference. Assuming that measuring points close to the indenter tip are distorted, raw data in the range
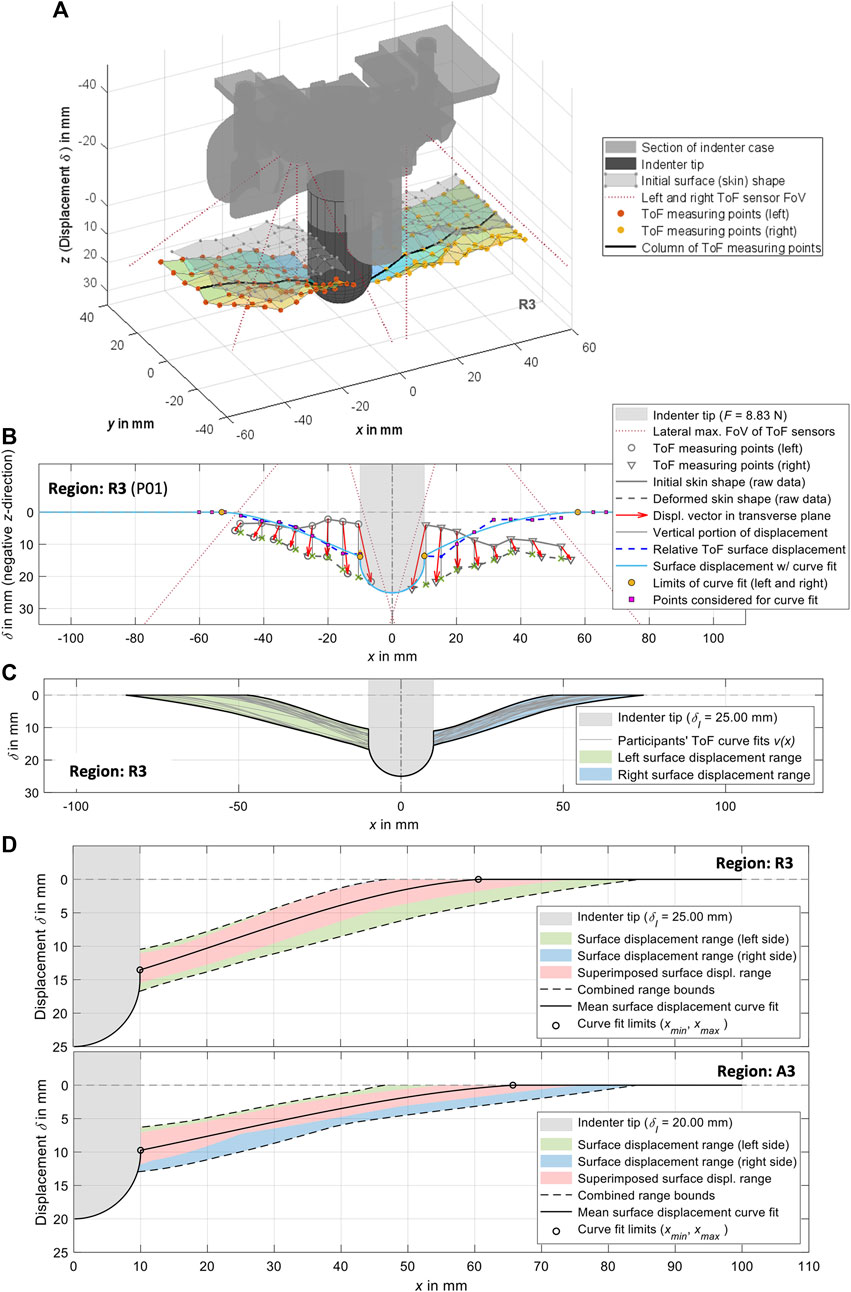
Figure 5. Visualizations of the experimental surface measurements and their processing exemplarily for measurement region 3. (A) 3D plot of the ToF measuring points from the left and right side, together with a visualization of the indenter tip and the indenter case. In addition to the initially measured undeformed skin, the deformation resulting from the measuring points is also shown. (B) Procedure for generating curve fits from the ToF measuring points in transverse plane (cf. Section 2.5). (C) Compilation of the left and right curve fits for all participants with visualization of the resulting ranges. (D) Complete surface displacements for both sides of all participants for
For mean surface displacement per measurement region
2.6 Statistical analysis
The experimental force-displacement results were statistically analyzed for T1) differences between the six measurement regions with similar muscle activities (R or A), and T2) differences between muscle activities for the six measurement regions. A p-value of <0.05 was considered statistically significant. Statistical tests were conducted for
2.7 Axisymmetric FE model
For the inverse FEA of an axisymmetric indentation test, we utilized the framework indentify (https://github.com/SolavLab/indentify, v1.0.1) developed and made available by Oddes and Solav (2023) and adapted it to our needs. For pre- and postprocessing of the simulations, running in the FE solver FEBio v4.3 (Maas et al., 2012), we used MATLAB R2022b with the open-source toolbox GIBBON (Moerman, 2018). The indentation model comprises an FE cylinder with radius and height
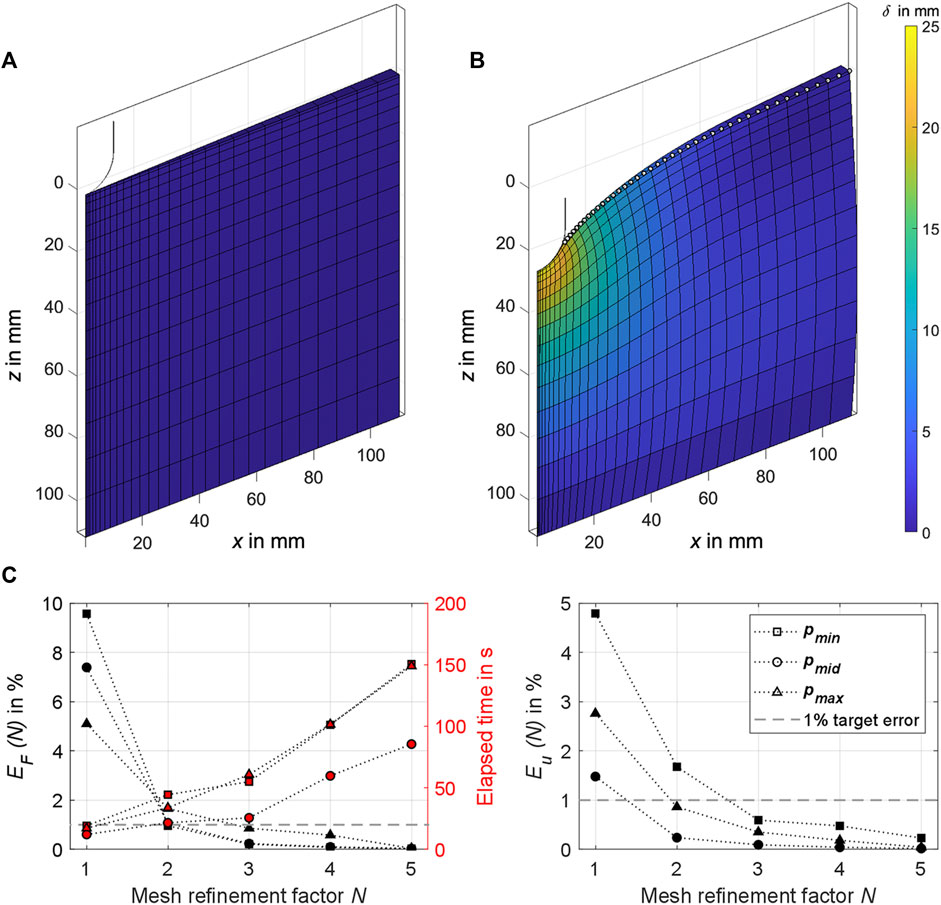
Figure 6. (A) The 2° sector of the axisymmetric FE cylinder as used in the analysis. The section of the hemispherical indenter tip in the initial state is also shown in the cylinder’s center. (B) Exemplary simulation result for
An FE mesh convergence analysis was conducted to check the numerical simulation accuracy for different mesh densities. The mesh density bias was 1.1 towards the center and 0.8 towards the top of the FE cylinder. No larger mesh density bias could be set to ensure model stability until
2.8 Constitutive model
Consistent with previous mechanical descriptions of human soft tissue (Holzapfel, 2000; Erdemir et al., 2006; Flynn et al., 2011; Halloran and Erdemir, 2011; Maas et al., 2012; Moerman et al., 2017; Calvo-Gallego et al., 2018; Wang et al., 2019; Marinopoulos et al., 2020; Alawneh et al., 2022; Lohr et al., 2022), we used a hyperelastic, nearly-incompressible Ogden material model (Simo and Taylor, 1991) to describe the nonlinear force-displacement and surface deformation behaviors gathered in this study. With a set of material parameters
where
2.9 Objective function analysis
Based on the objective function analysis with synthetic reference values of Oddes and Solav (2023), we defined the combined objective function
The modulation factor
The nodes visualized in Figure 6B (vertex and edge nodes in the range
To analyze the objective functions combined over all indentation depths,
Consequently, the minimum of
We evaluated a trim factor
3 Results
All participants were students or academic employees. No complications occurred during the measurement sessions, there were no interruptions, and a complete set of data was recorded in each case. The results of the sEMG measurements are summarized in Table 3. Because the MVCs primarily targeted the muscle regions over which direct measurements were conducted, the most relevant values are highlighted. With regard to the MVC in the supine position, the anterior relative muscle activities at E1 amounted to an average of 3.9% during R1-R3, and 33.2% during A1-A3 (see Figure 2 for measurement regions). The anterolateral measurement region 4 was located lateral to the rectus abdominus. The subjects were in supine position, which is why the MVC in this position was used. Because this and the active posture took place within the sagittal plane, the relative activity at E2 was higher by a factor of 6.4 and 1.5 for R and A respectively compared to E1. For the lateral MVC, the absolute muscle activity at E2 was 216.5% higher, which explains the increased relative activity at E2 during R4. In general, however, the measurement data also confirmed the experimental assessment that the anterolateral muscles measured with E2 were less well activated selectively by the participants. Except during the measurements in region 4, the relative muscle activities in the relevant regions for R were 5.3% ± 2.04% and for A 34.3% ± 7.03%. During measurements R1 and R2 only one participant was unable to fully relax his abdominal muscles (E1 ≥ 10.4%, E2 ≥ 42.1%), as a result of which the forces for
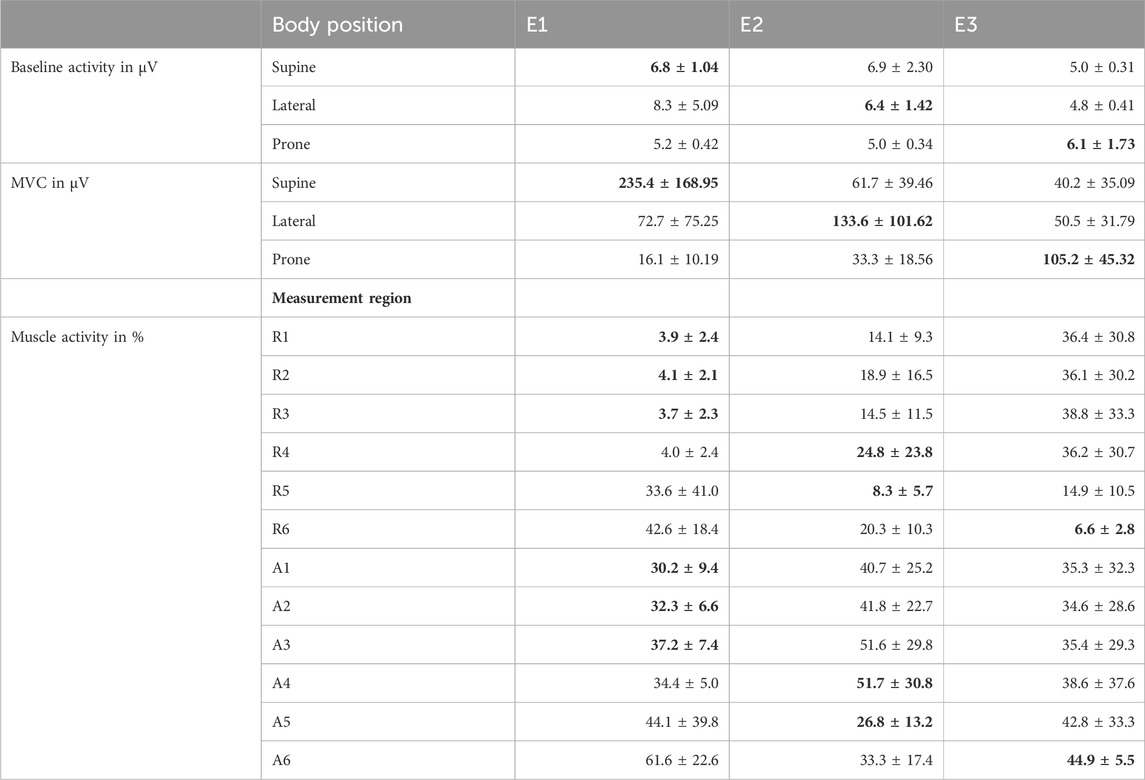
Table 3. Surface EMG amplitude of the participants. Electrode positions E1, E2, and E3 are displayed in Figure 2 and data is given as mean with standard deviation (mean ± SD). The most relevant values for the evaluations are printed in bold (activity of the muscle group on which the indentation was conducted).
3.1 Force-displacement curves
The processed force-displacement curves for the measured regions with distinction between R (fully relaxed musculature) and A (controlled activated musculature) are visualized in Figure 4 and the mean curve fits
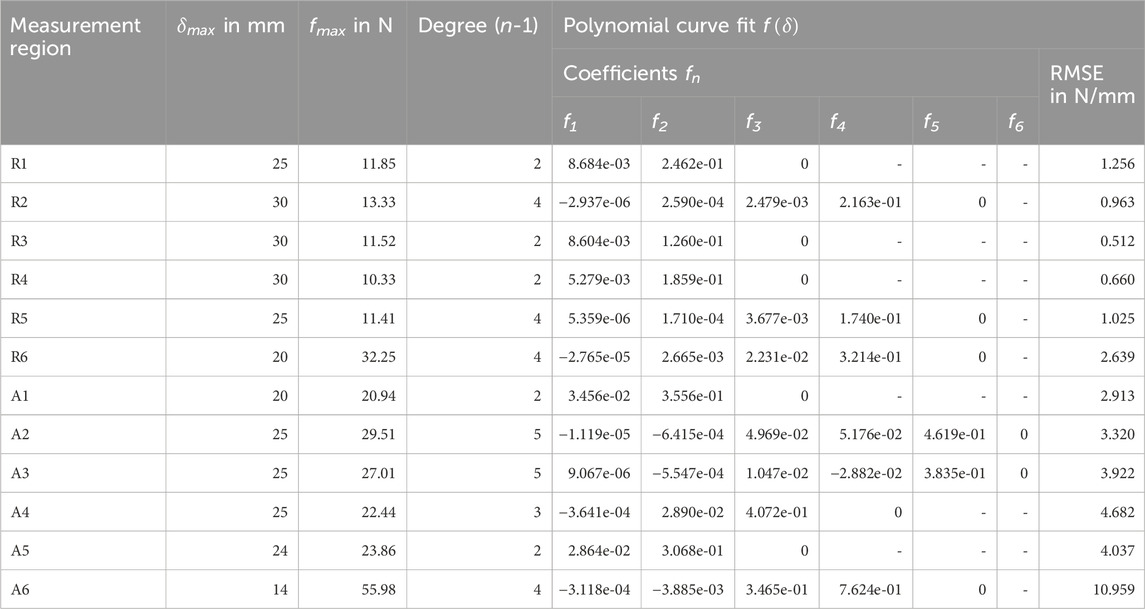
Table 4. Coefficients of the experimental mean force-displacement curves (Figure 4). Each polynomial curve fit
Overall, measurement regions 2, 3, 4, and 6 showed large linear sections with muscles activated. In the center of the linea alba and laterally (regions 1 and 5) the curve curses remained predominantly non-linear. Mean gradients of the linear sections for regions 1 to 6 with activated musculature could be approximated with 1.42, 1.39, 1.43, 1.08, 1.36, and 5.22 N/mm. For better comparability, we subdivided the curves with relaxed muscles at
The Kolmogorov-Smirnov tests (T1) were statistically significant (
3.2 Surface displacements
The experimental mean surface displacements for all measurement regions at
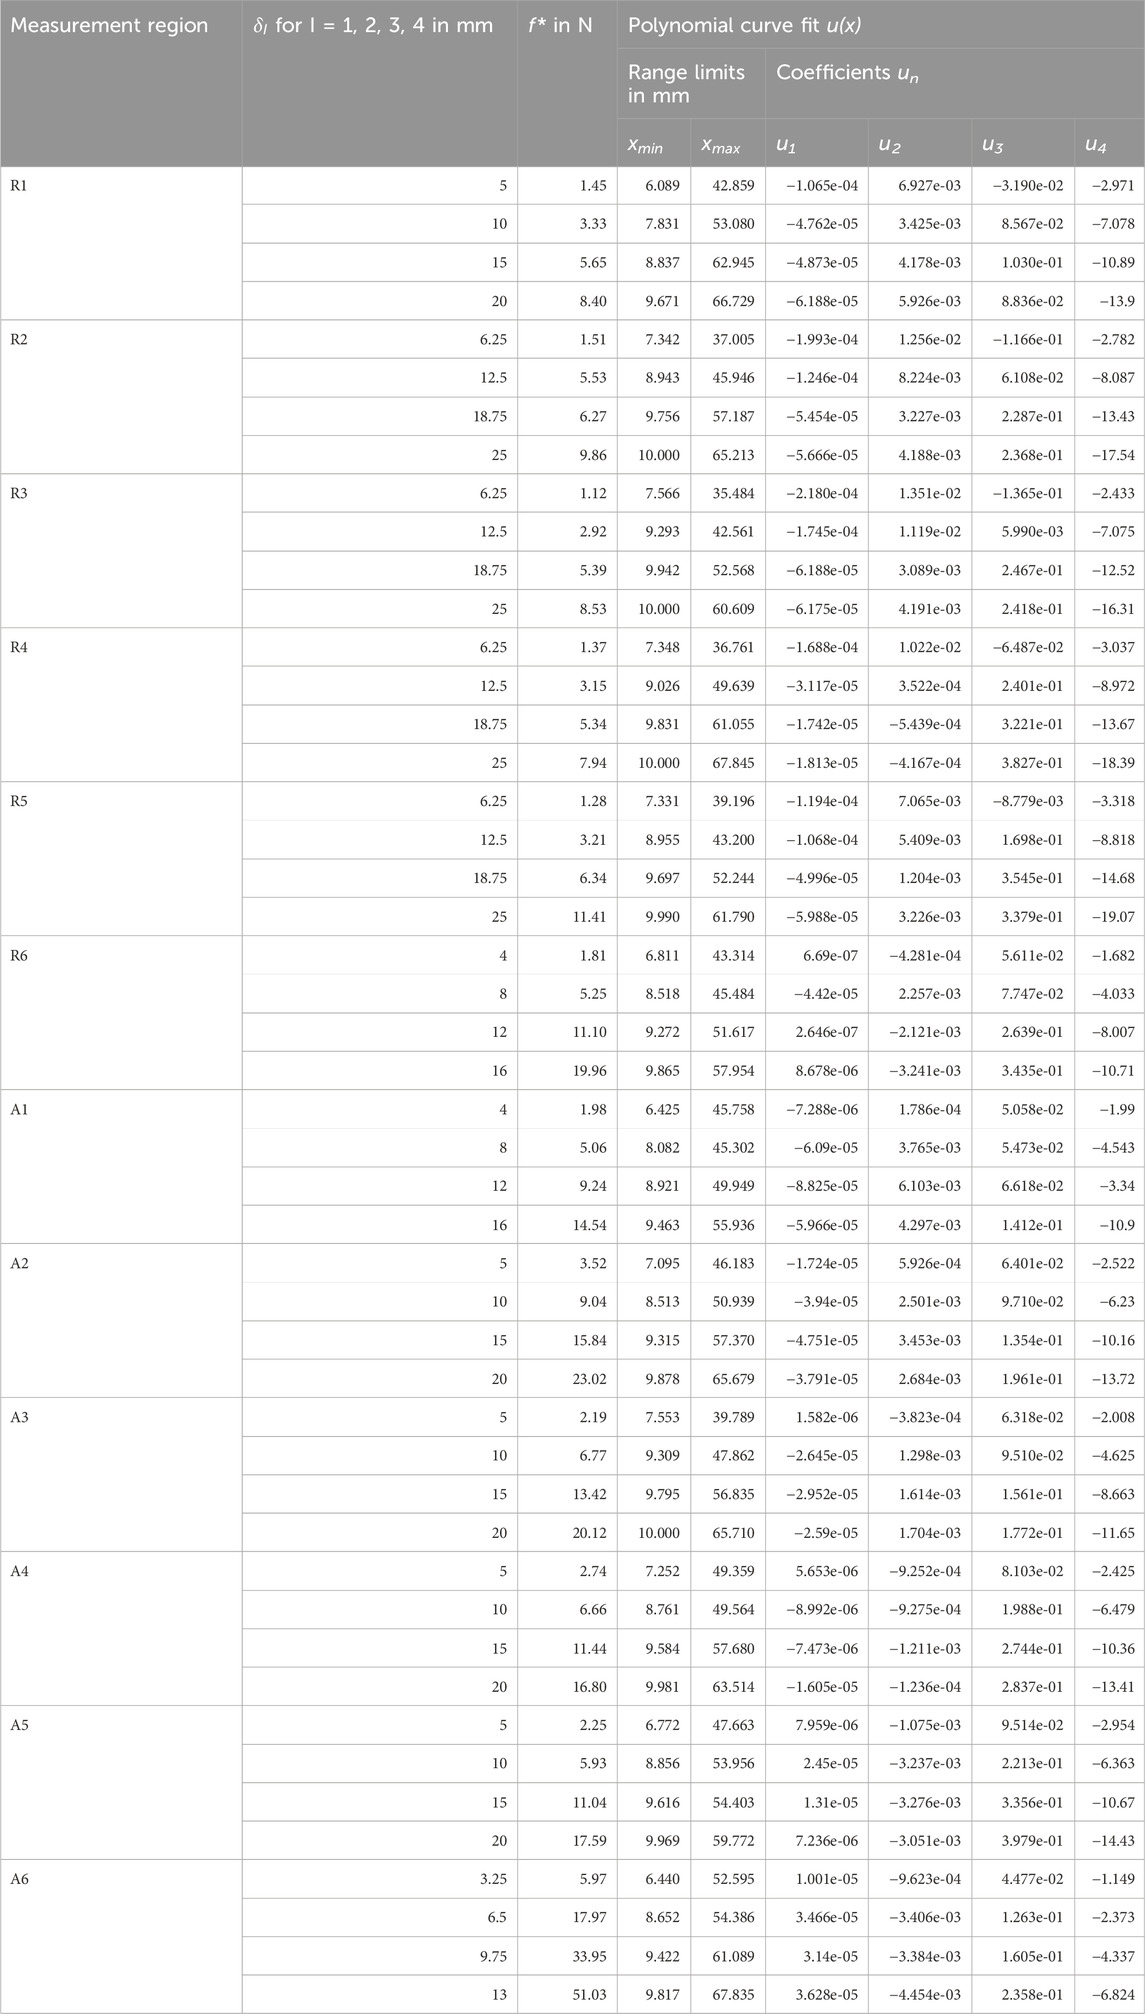
Table 5. Experimental mean surface displacements (Figure 5) for all measurement regions with mean indentation forces
3.3 FE mesh convergence analysis
We ran all simulations on a PC with Windows 11 Pro, Intel Core i7-10700K 3.80 GHz CPU, and 32 GB RAM. The results for the FE mesh convergence analysis are shown in Figure 6C. Given a short calculation time of ≤60 s, the errors for
3.4 Hyperelastic abdominal material parameters
Four parameter spaces P with a total of 3321, 2565, 2565, and 2115 parameter sets for
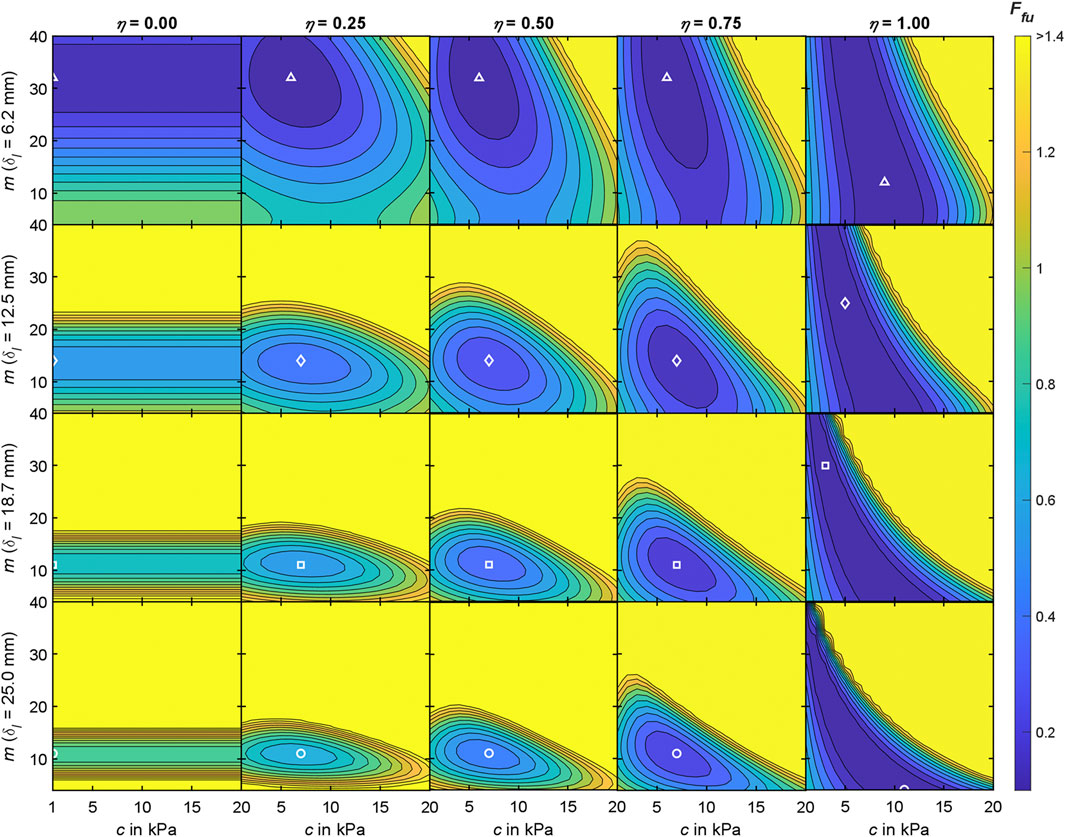
Figure 7. Interim results of the objective function analysis for the Ogden material model at measurement region 3 with
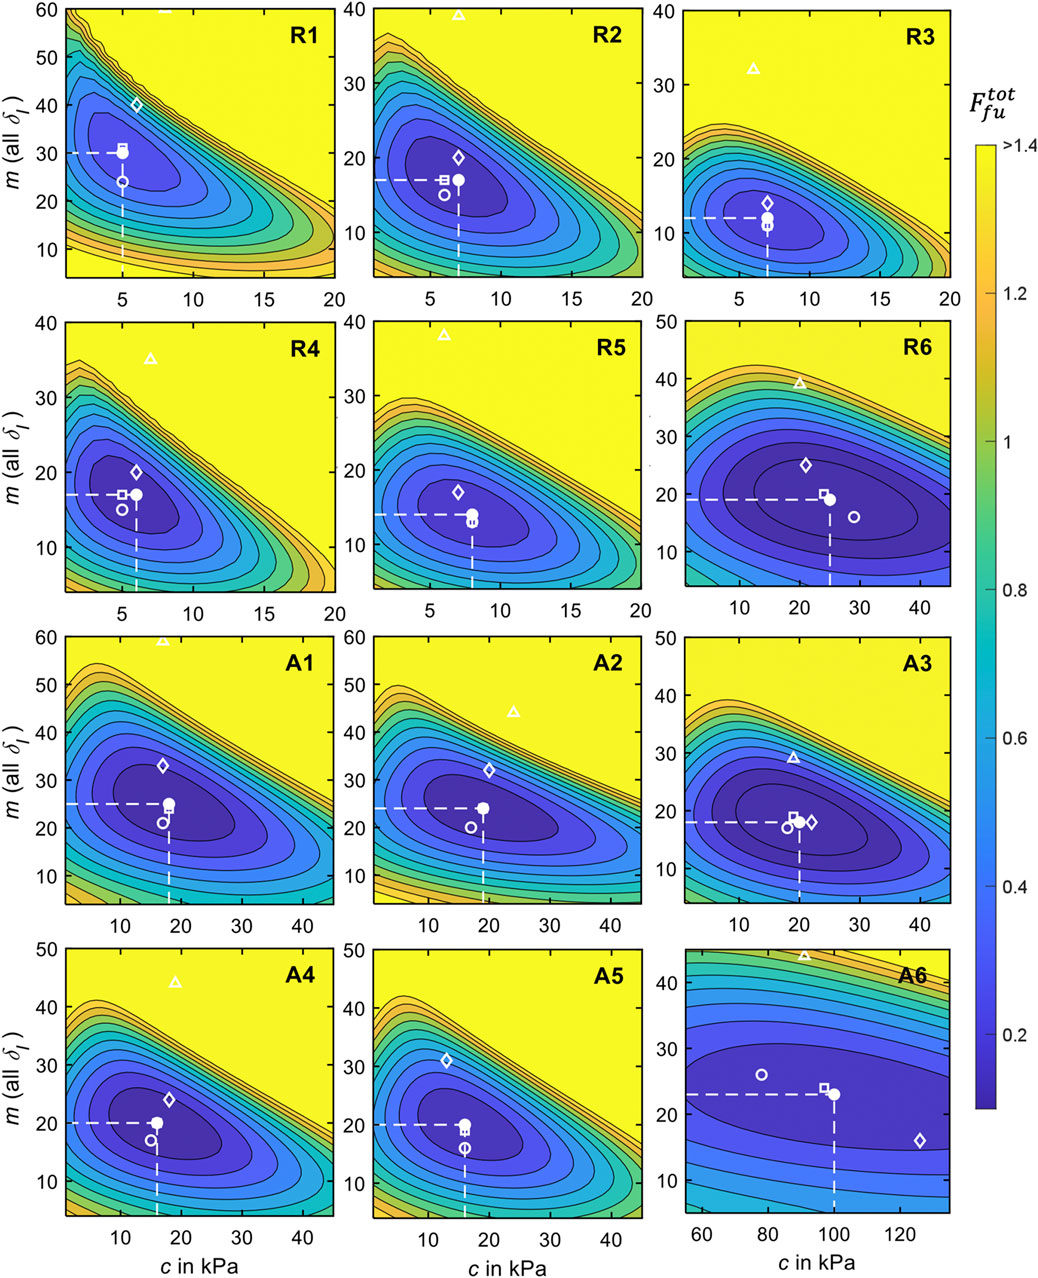
Figure 8. Results of the objective function analysis for all measurement regions and relaxed and activated musculature for
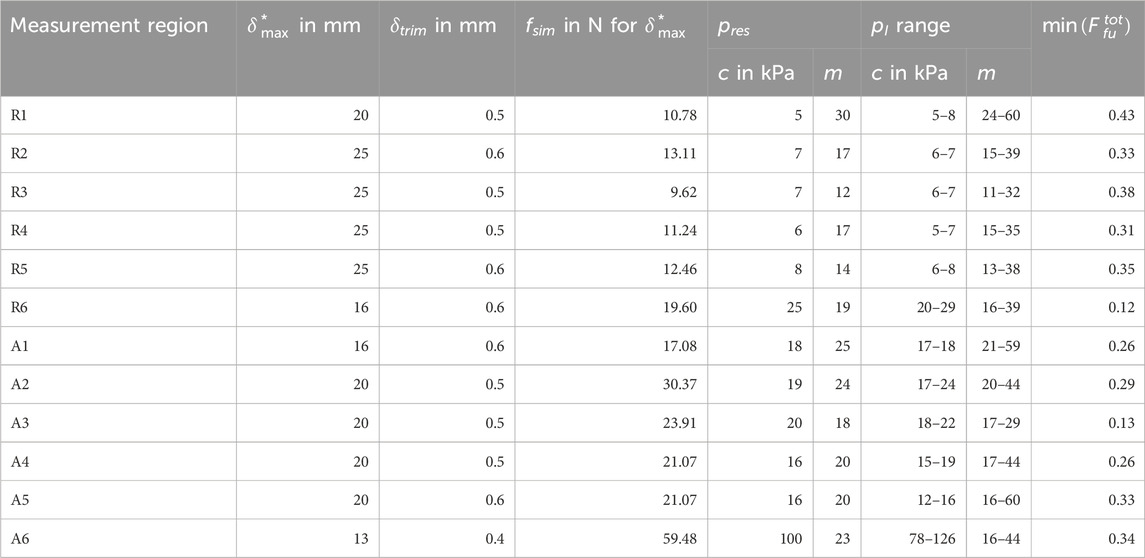
Table 6. Resulting (best fit) Ogden material parameter sets
From the closed shapes of
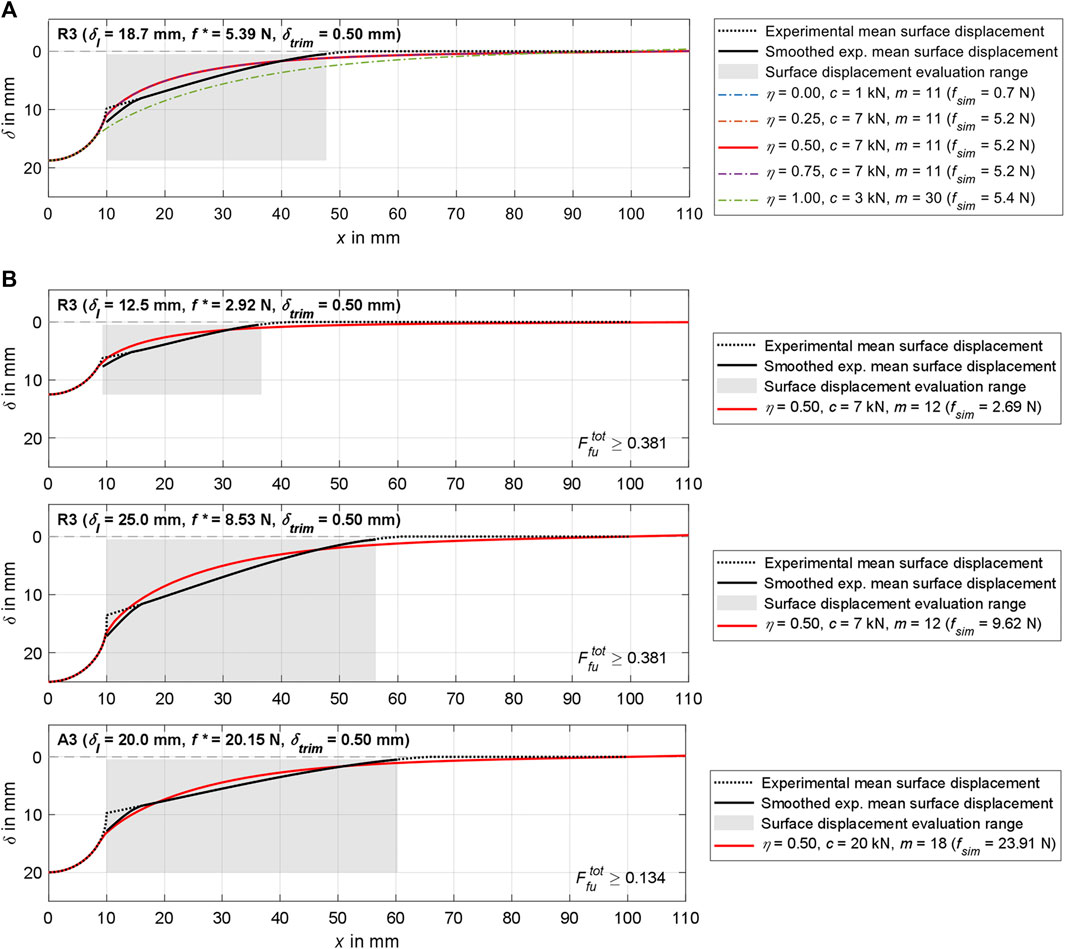
Figure 9. Visualization of simulation results for region 3 and various
4 Discussion
In this study, macro-indentation and time-of-flight skin deformation measurements were conducted to obtain data sets quantifying the in vivo material behavior of the physiological adult male abdomen. The data sets comprise the slow and continuous (non-ballistic) force-displacement curves of six abdominal regions, each synchronized with the displacements of the surrounding soft tissue resulting from the indentation. To account for the influence of the trunk muscles, the measurements were conducted with both fully relaxed and controlled activated muscles in various lying positions. Due to the small scatter range of the physiological parameters, standard values were calculated for all participants combined, which served as reference for inverse FEA. The inverse FEA was used to numerically estimate material parameters, which allowed the mechanical responses of the soft tissues to be simulated as a whole. All processed data sets and the material parameters of this study are described in detail or made available in the Supplementary Material S1–S4.
Our focus was on the in vivo characterization of the mechanical responses of the human abdominal wall and the structures it encloses in the abdominal cavity. During trunk muscle activation, the sections assumed to be linearized after foot regions of 3.5–8 mm were on average 5.2 N/mm posteriorly and 1.1–1.4 N/mm elsewhere (anterior-lateral). During relaxation, stiffnesses for small displacements were 0.72 N/mm posteriorly, and 0.24–0.34 N/mm anteriorly to laterally. The stiffnesses of the abdomen under large deformations (45%
For each measurement region (Figure 2), we conducted an objective function analysis in which the mean experimental indenter force-displacement curve (Table 4) and the mean surface displacement (Table 5) served as the optimization targets. The accumulated differences between these and the simulation results were visualized using contour plots (Figure 8) and the convergence to a minimum was marked. Regarding the material stiffness and the surface displacement, the sensitivities of m and c [see Ogden strain energy density function in (5)] become apparent in Figure 7 for
To the best of our knowledge, our study is the first of its kind, but has limitations in several aspects. Only young and healthy male participants with a similar BMI (Table 1) were involved in the study. As expected, we only found small inter-individual differences. Consequently, no general conclusions can be drawn about the entire population. However, other publications report significant differences in soft tissue behavior (Song et al., 2006; van Ramshorst et al., 2011; Sadler et al., 2018) as well as distribution of subcutaneous adipose tissue and body composition (Esparza-Ros et al., 2022) between women and men. Men’s tissue is often stiffer and less deformable. In 2011, van Ramshorst et al. (2011) reported that abdominal wall tension was on average 31% higher in men than in women, but that BMI had no significant influence. We were able to confirm this for the BMI, except for one participant with activated and pronounced abdominal muscles and the lowest percentage of body fat in regions 1, 4, and 5.
The experimental setup we developed (Figure 1) was accurate in terms of repeatability and absolute accuracy when compared to a mechanical testing machine with gelatine and 3D printed surface profiles. Overall, the test setup proved to be suitable for the aims of this study. Because the application of the test procedure is not limited to young male participants, data should also be gathered from other populations in the future, for example, women, people with a higher BMI, people with pathologies, and older people. This data could have a major impact on the computer-aided development of medical aids and products for which patient compliance is important. As only changes in the surface profile of the skin were measured using ToF, only tissue displacements in the axial direction could be captured and not, for example, strains. In addition, the initial positions and displacements of the soft tissues and organs of the abdomen were unknown in our study. Technically, these could not be determined with the current measurement setup. Supplementary MRIs or ultrasound scans can provide additional information to better categorize possible inter-individual variances, internal tissue deformations, and improve models with heterogeneous material or individual organs. The circumvention of physical limitations during MRI measurements has already been addressed and solved, for example, by Moerman (2012) by use of a custom designed, hydraulically powered, and MRI compatible soft tissue indenter.
Because both ToF sensors were mounted on the indenter housing, the field of view and thus the covered measuring range around the indenter tip was limited. As part of the data processing, we approximated laterally exceeding displacements of the skin with a multifactorial optimization using polynomial curve fits of third degree and base points (Figure 5). This procedure proved to be reliable, albeit time-consuming, because it had to be performed for each data set at the desired indentation depth. Nevertheless, in our opinion, this approach provides an accurate approximation of the total deformations under the assumption of an initially planar surface. In further studies, ToF sensors with a higher resolution could be mounted further away from the skin, or ToF sensors with a wider field of view could be used. Alternatively, laser scanning (Todros et al., 2019; Todros et al., 2020) or 3D digital image correlation (Moerman et al., 2009) would be accurate and reliable methods for superficial measurement of the abdominal wall, although they could make the experimental setup more complex. As interactions with skin are an important topic in modelling (Sanders et al., 1998; Portnoy et al., 2008), these should be examined more closely on the abdomen in the future. Detailed results from previous mechanical studies of the skin (Ní Annaidh et al., 2012) can serve as basis for this. However, due to the anisotropy of the skin, the orientation of the Langer lines is also relevant. To quantify the proportional influence of the skin on overall in vivo reactions, the effective movements of natural or applied surface patterns of the skin can be measured using digital image correlation (Szepietowska et al., 2023). Analyzing the displacement of the discrete structures of the overall image provides information about the anisotropic skin strains, which is not possible with ToF sensors that only return distance images.
In the current study, the sEMG signals were used to monitor whether the participants followed the instructions regarding muscle activation. Due to our primary aim of generating experimental reference data for the inverse FEA, we did not perform subject- or region-specific correlation analyses with other results. A potential shortcoming of the measurement in the anterolateral region 4 was that the supine position and movements in the lateral plane did not explicitly activate the abdominal oblique muscles (E2). Anterolateral crunches or a posterolateral position could be better suited in the future. For the anterior measurement regions 1-4, the participants were either fully extended or held their legs at a right angle with their lower legs horizontal. Due to the macroscopic nature of our study, we consider any subsequent influences on the tissue density and tension of the skin as a result of the postural changes to be negligible. The same applies to possible alterations in abdominal organ location, morphology, and rib coverage due to postural changes (Hayes et al., 2013a; Hayes et al., 2013b). The large anterior and lateral tissue deformations required ultrasound gel between indenter tip and skin, as the contact friction would otherwise have been highly unpleasant for the participants. In addition, this simplified the contact condition for the inverse FEA.
The present work is limited to one isotropic and hyperelastic material, thus the application to anisotropic and viscoelastic materials requires further research. For fat, the assumption of isotropic behavior is accurate (Dubuis et al., 2012), but the approximately 30 mm thick abdominal wall consists of numerous layers of muscles, tendinous structures, and blood vessels with fibers oriented in different directions (Song et al., 2006; Hernández et al., 2011; Deeken and Lake, 2017). However, the interaction of the layers decreases the degree of anisotropic response significantly (Hernández et al., 2011; Simón-Allué et al., 2017; Lohr et al., 2022). In addition, we used a 2° sector of an axisymmetric FE cylinder (Figure 6A). Further adaptations of the framework used in combination with FEBio and the opportunity to freely customize the codes offer a wide range of possibilities for more detailed inverse FEA. A first and already integrated approach should be the investigation of other hyperelastic material models (Mooney-Rivlin, Neo-Hookean, and Ogden-Moerman) that can be used for soft tissue modelling (Alawneh et al., 2022) as well as higher order Ogden models. There is also potential for improvement in terms of computational efficiency and model stability. Even though our study showed that a first-order Ogden model already provides good approximations for all regions, the numerical results for larger deformations offer the potential to be closer to the experimental data (Figure 8). Because the volumetric behavior depends on the bulk-like modulus and we determined it via a ratio to the varied material parameter c, its influence on the FE surface deformation is to be analyzed systematically in further studies.
Another simplification worth mentioning is the planarization of the locally compressed abdominal surface, here in the form of a right circular cylinder. As was also evident in the ToF raw data, the undeformed measurement regions were mostly cylindrical surfaces, but were converted to a planar reference plane during data processing. This means that all
The use of four equidistant indentation depth steps
It should be noted that we focused on the transient material response during indentation and thus did not consider tissue relaxation. All measurements were carried out with the same indentation speed. Each test run was completed quickly and continuously in less than 16 s (extension and retraction of the indenter tip with 40 mm maximum travel), so the reaction was considered as an instantaneous response (Yu et al., 2006; Lu et al., 2009). The fact that the participants had to hold their breath and purposefully activated their muscles, however, prohibited slower tests (<5 mm/s) and prolonged holding of the indenter tip at maximum stroke (>1 s). Deep inhalation lifted the abdominal wall and the muscle activity was measurably increased. Limited by the indenter being in continuous contact with the skin, no active breathing could be examined and separate runs would be necessary. We therefore assume increased abdominal stiffness during inhalation, which should be investigated in further studies.
Modelling viscoelasticity is straightforward and can be carried out, for example, using an elastic component coupled with a viscous component, which acts as a damper that delays the stress-strain response (Wells and Liang, 2011). The use of our data for the validation of complex models, that represent the abdomen in detail, is also conceivable. Along with exact anatomical models, patient-specific material that takes biological data into account, is becoming increasingly relevant in biomedical engineering and treatment (Erdemir et al., 2006; Moerman et al., 2016; Simón-Allué et al., 2017; Macron et al., 2020; Lerchl et al., 2022). By averaging over all participants and discarding the anatomical characteristics, we are not yet able to make statements beyond the physiological standard values. Further work will seek to address subject-specific material parameters from inverse FEA using in vivo indentation data and tissue displacements.
A long-term goal of our work is to assess biomechanical principles of action of the lower back to improve the development of biomedical products specifically in the early design phases. We aim to achieve this by simulating the interaction between a digital human body model and a virtual technical system. This facilitates the methodical variation of the properties of the technical system as part of the engineering design process with regard to ethical and economic factors. Moreover, even the latest experimental methods are limited when it comes to studying internal mechanics such as muscle forces or stress states in soft tissues, the overall context of the stabilizing functions of individual muscles, and thus the possible causes of pain (Remus et al., 2021). To support the engineering design process, a new type of digital model of the lower trunk aims to couple a muscle-driven forward dynamical active hybrid model of the lumbosacral spine (Remus et al., 2023) with the surrounding soft tissue of the abdomen. In this regard, the work presented here contributes to a better understanding and numerical quantification of abdominal in vivo soft tissue behavior under local compression.
5 Conclusion
In this study, we presented a novel, simple, and reliable method for in vivo measurement of the mechanical soft tissue behavior of the human abdomen. The force-displacement curves, the associated surface displacements of the skin, and the muscle activities of ten males were measured in a total of six regions, in each case with completely relaxed and with controlled activated muscles while lying horizontally. The experimental data allowed us to identify similarities and significant differences between the regions and states of muscle activation. In addition, we used inverse FEA to derive unique hyperelastic material parameter sets that numerically approximate the experimentally measured soft tissue behaviors. This comprehensive in vivo dataset is not available in the current literature and represents an advance in our knowledge of abdominal material properties, enabling improved numerical human body models, interaction studies, and product development processes.
Data availability statement
The original contributions presented in the study are included in the article/Supplementary Material, further inquiries can be directed to the corresponding author.
Ethics statement
The studies involving humans were approved by the Ethics Committee of the Medical Faculty of the Ruhr-University Bochum (23-7868 08/10/23). The studies were conducted in accordance with the local legislation and institutional requirements. The participants provided their written informed consent to participate in this study.
Author contributions
RR: Conceptualization, Data curation, Formal Analysis, Investigation, Methodology, Project administration, Resources, Software, Validation, Visualization, Writing–original draft, Writing–review and editing. CS: Investigation, Resources, Software, Writing–review and editing. SS: Formal Analysis, Resources, Software, Validation, Writing–review and editing. EU: Validation, Writing–original draft, Writing–review and editing. BB: Funding acquisition, Supervision, Writing–review and editing.
Funding
The author(s) declare that financial support was received for the research, authorship, and/or publication of this article. We acknowledge support by the DFG Open Access Publication Funds of the Ruhr-University Bochum.
Acknowledgments
The authors would like to thank Christoph Ehlert (Chair of Product Development, RUB) for his technical support in the realization and calibration of the measurement equipment, and Letícia Mamede for conducting an explorative preliminary indenter study as part of her student thesis. Additionally, we would like to acknowledge all the volunteers who participated in this research project for devoting their time to the experimental activity.
Conflict of interest
The authors declare that the research was conducted in the absence of any commercial or financial relationships that could be construed as a potential conflict of interest.
Publisher’s note
All claims expressed in this article are solely those of the authors and do not necessarily represent those of their affiliated organizations, or those of the publisher, the editors and the reviewers. Any product that may be evaluated in this article, or claim that may be made by its manufacturer, is not guaranteed or endorsed by the publisher.
Supplementary material
The Supplementary Material for this article can be found online at: https://www.frontiersin.org/articles/10.3389/fbioe.2024.1384062/full#supplementary-material
SUPPLEMENTARY MATERIAL S1 | Complete data set of coefficients and goodness of fits of the polynomial curve fitted experimental force-displacement curves
SUPPLEMENTARY MATERIAL S2 | Exemplary visualization of the trim factor
SUPPLEMENTARY MATERIAL S3 | Visualization of the experimentally determined raw force-displacement curves (left) and the participant-related curve fits calculated from these (right) for all regions.
SUPPLEMENTARY MATERIAL S4 | Experimental mean surface displacements and ranges for all measurement regions at
References
Ahn, B., and Kim, J. (2010). Measurement and characterization of soft tissue behavior with surface deformation and force response under large deformations. Med. Image Anal. 14, 138–148. doi:10.1016/j.media.2009.10.006
Alawneh, O., Zhong, X., Faieghi, R., and Xi, F. (2022). Finite element methods for modeling the pressure distribution in human body–seat interactions: a systematic review. Appl. Sci. 12, 6160. doi:10.3390/app12126160
Anderson, A. E., Ellis, B. J., and Weiss, J. A. (2007). Verification, validation and sensitivity studies in computational biomechanics. Comput. Methods Biomech. Biomed. Engin 10, 171–184. doi:10.1080/10255840601160484
Bonnaire, R., Woo-Suck, H., Calmels, P., Convert, R., and Molimard, J. (2020). “Parametric study of lumbar belts in the case of low back pain: effect of patients’ specific characteristics,” in Computational biomechanics for medicine: personalisation, validation and therapy. Editors M. P. Nash, P. M. F. Nielsen, A. Wittek, K. Miller, and G. R. Joldes (Cham, Switzerland: Springer), 43–59.
Calvo-Gallego, J. L., Domínguez, J., Gómez Cía, T., Gómez Ciriza, G., and Martínez-Reina, J. (2018). Comparison of different constitutive models to characterize the viscoelastic properties of human abdominal adipose tissue. A pilot study. J. Mech. Behav. Biomed. Mater 80, 293–302. doi:10.1016/j.jmbbm.2018.02.013
Carter, F. J., Frank, T. G., Davies, P. J., McLean, D., and Cuschieri, A. (2001). Measurements and modelling of the compliance of human and porcine organs. Med. Image Anal. 5, 231–236. doi:10.1016/S1361-8415(01)00048-2
Clauser, C., Tebbetts, I., Bradtmiller, B., McConville, J., and Gordon, C. (1988) Measurer's handbook: U.S. Army anthropometric survey 1987-1988: Natick, Massachusetts.
Clin, J., Aubin, C.-E., Parent, S., and Labelle, H. (2010). A biomechanical study of the Charleston brace for the treatment of scoliosis. Spine 35, E940–E947. doi:10.1097/BRS.0b013e3181c5b5fa
Cooper, L., Gullane, A., Harvey, J., Hills, A., Zemura, M., Martindale, J., et al. (2019). Experimental platform to facilitate novel back brace development for the improvement of spine stability. Comput. Methods Biomech. Biomed. Engin 22, 1163–1173. doi:10.1080/10255842.2019.1645837
Cox, C. A. (2020) Computational modeling of the lumbar spine: active musculature and intra-abdominal pressure in compressive loading. Dissertation: Duke University, Department of Biomedical Engineering.
E. Criswell (2011). Cram's introduction to surface electromyography (Sudbury, MA: Jones and Bartlett).
Davies, P. J., Carter, F. J., and Cuschieri, A. (2002). Mathematical modelling for keyhole surgery simulations: a biomechanical model for spleen tissue. IMA J. Appl. Math. 67, 41–67. doi:10.1093/imamat/67.1.41
Deeken, C. R., and Lake, S. P. (2017). Mechanical properties of the abdominal wall and biomaterials utilized for hernia repair. J. Mech. Behav. Biomed. Mater 74, 411–427. doi:10.1016/j.jmbbm.2017.05.008
Driscoll, M., and Blyum, L. (2019). Investigation of the inter-dependence between intra-abdominal pressure and spinal stability. Clin. Biomech. (Bristol, Avon) 69, 164–167. doi:10.1016/j.clinbiomech.2019.07.018
Dubuis, L., Avril, S., Debayle, J., and Badel, P. (2012). Identification of the material parameters of soft tissues in the compressed leg. Comput. Methods Biomech. Biomed. Engin 15, 3–11. doi:10.1080/10255842.2011.560666
El-Monajjed, K., and Driscoll, M. (2020). A finite element analysis of the intra-abdominal pressure and paraspinal muscle compartment pressure interaction through the thoracolumbar fascia. Comput. Methods Biomech. Biomed. Engin 23, 585–596. doi:10.1080/10255842.2020.1752682
Erdemir, A., Viveiros, M. L., Ulbrecht, J. S., and Cavanagh, P. R. (2006). An inverse finite-element model of heel-pad indentation. J. Biomechanics 39, 1279–1286. doi:10.1016/j.jbiomech.2005.03.007
Esparza-Ros, F., Moreira, A. C., Vaquero-Cristóbal, R., Barrigas, C., Albaladejo-Saura, M., and Vieira, F. (2022). Differences between four skinfold calipers in the assessment of adipose tissue in young adult healthy population. Nutrients 14, 2085. doi:10.3390/nu14102085
Fackler, M. L., and Malinowski, J. A. (1988). Ordnance gelatin for ballistic studies. Detrimental effect of excess heat used in gelatin preparation. Am. J. forensic Med. pathology 9, 218–219. doi:10.1097/00000433-198809000-00008
Fitzpatrick, T. B. (1988). The validity and practicality of sun-reactive skin types I through VI. Arch. Dermatol 124, 869. doi:10.1001/archderm.1988.01670060015008
Flynn, C., Taberner, A., and Nielsen, P. (2011). Modeling the mechanical response of in vivo human skin under a rich set of deformations. Ann. Biomed. Eng. 39, 1935–1946. doi:10.1007/s10439-011-0292-7
Fougeron, N., Trebbi, A., Keenan, B., Payan, Y., and Chagnon, G. (2023). Current Poisson’s ratio values of finite element models are too low to consider soft tissues nearly-incompressible: illustration on the human heel region. Comput. Methods Biomech. Biomed. Engin, 1–10. doi:10.1080/10255842.2023.2269286
Grébonval, C., Trosseille, X., Petit, P., Wang, X., and Beillas, P. (2021). Effects of seat pan and pelvis angles on the occupant response in a reclined position during a frontal crash. PLOS ONE 16, e0257292. doi:10.1371/journal.pone.0257292
Grujicic, M., Pandurangan, B., Xie, X., Gramopadhye, A. K., Wagner, D., and Ozen, M. (2010). Musculoskeletal computational analysis of the influence of car-seat design/adjustments on long-distance driving fatigue. Int. J. Industrial Ergonomics 40, 345–355. doi:10.1016/j.ergon.2010.01.002
Guo, J., Guo, W., and Ren, G. (2021). Embodiment of intra-abdominal pressure in a flexible multibody model of the trunk and the spinal unloading effects during static lifting tasks. Biomech. Model Mechanobiol. 20, 1599–1626. doi:10.1007/s10237-021-01465-1
Halloran, J. P., and Erdemir, A. (2011). Adaptive surrogate modeling for expedited estimation of nonlinear tissue properties through inverse finite element analysis. Ann. Biomed. Eng. 39, 2388–2397. doi:10.1007/s10439-011-0317-2
Haug, E., Choi, H.-Y., Robin, S., and Beaugonin, M. (2004). “Human models for crash and impact simulation,” in Handbook of numerical analysis: computational models for the human body (Germany: Elsevier), 231–452.
Hayes, A. R., Gayzik, F. S., Moreno, D. P., Martin, R. S., and Stitzel, J. D. (2013a). Abdominal organ location, morphology, and rib coverage for the 5(th), 50(th), and 95(th) percentile males and females in the supine and seated posture using multi-modality imaging. Ann. Adv. Automot. Med. 57, 111–122.
Hayes, A. R., Gayzik, F. S., Moreno, D. P., Martin, R. S., and Stitzel, J. D. (2013b). Comparison of organ location, morphology, and rib coverage of a midsized male in the supine and seated positions. Comput. Math. Methods Med. 2013, 1–12. doi:10.1155/2013/419821
Hernández, B., Peña, E., Pascual, G., Rodríguez, M., Calvo, B., Doblaré, M., et al. (2011). Mechanical and histological characterization of the abdominal muscle. A previous step to modelling hernia surgery. J. Mech. Behav. Biomed. Mater 4, 392–404. doi:10.1016/j.jmbbm.2010.11.012
Hicks, J. L., Uchida, T. K., Seth, A., Rajagopal, A., and Delp, S. L. (2015). Is my model good enough? Best practices for verification and validation of musculoskeletal models and simulations of movement. J. Biomech. Eng. 137, 020905. doi:10.1115/1.4029304
Hodges, P. W., Cresswell, A. G., Daggfeldt, K., and Thorstensson, A. (2001). In vivo measurement of the effect of intra-abdominal pressure on the human spine. J. Biomechanics 34, 347–353. doi:10.1016/S0021-9290(00)00206-2
Hodges, P. W., Eriksson, A. E. M., Shirley, D., and Gandevia, S. C. (2005). Intra-abdominal pressure increases stiffness of the lumbar spine. J. Biomechanics 38, 1873–1880. doi:10.1016/j.jbiomech.2004.08.016
Hodges, P. W., Ferreira, P. H., and Ferreira, M. L. (2015). “Chapter 14 - lumbar spine: treatment of motor control disorders,” in Pathology and intervention in musculoskeletal rehabilitation. Editors D. J. Magee, J. E. Zachazewski, W. S. Quillen, and R. C. Manske (Germany: s.l. Elsevier Health Sciences), 520–560.
Holzapfel, G. A. (2000) Nonlinear solid mechanics: a continuum approach for engineering. Chichester: Wiley.
Huang, Y.-P., and Zheng, Y.-P. (2015) Measurement of soft tissue elasticity in vivo: techniques and applications. Boca Raton: CRC Press.
Ji, Y., Bai, H., Yang, J., Ge, C., Zhu, Y., Zhang, R., et al. (2022). AMOS: a large-scale abdominal multi-organ benchmark for versatile medical image segmentation. ArXiv. doi:10.48550/arXiv.2206.08023
Jourdan, A., Rapacchi, S., Guye, M., Bendahan, D., Masson, C., and Bège, T. (2022). Dynamic-MRI quantification of abdominal wall motion and deformation during breathing and muscular contraction. Comput. Methods Programs Biomed. 217, 106667. doi:10.1016/j.cmpb.2022.106667
Kauer, M., Vuskovic, V., Dual, J., Szekely, G., and Bajka, M. (2002). Inverse finite element characterization of soft tissues. Med. Image Anal. 6, 275–287. doi:10.1016/S1361-8415(02)00085-3
King, A. I. (2018). “Chapter 12: impact biomechanics of the abdomen,” in The biomechanics of impact injury: biomechanical response, mechanisms of injury, human tolerance and simulation. Editor A. I. King (Cham: Springer).
Lamielle, S., Vezin, P., Verriest, J.-P., Petit, P., Trosseille, X., and Vallancien, G. (2008). 3D deformation and dynamics of the human cadaver abdomen under seatbelt loading. Stapp Car Crash J. 52, 267–294. doi:10.4271/2008-22-0011
Lee, J. B., and Yang, K. H. (2001). Development of a finite element model of the human abdomen. Stapp Car Crash J. 45, 79–100. doi:10.4271/2001-22-0004
Leong, F., Lai, C. Y., Khosroshahi, S. F., He, L., Lusignan, S. de, Nanayakkara, T., et al. (2022). A surrogate model based on a finite element model of abdomen for real-time visualisation of tissue stress during physical examination training. Bioengineering 9, 687. doi:10.3390/bioengineering9110687
Lerchl, T., El Husseini, M., Bayat, A., Sekuboyina, A., Hermann, L., Nispel, K., et al. (2022). Validation of a patient-specific musculoskeletal model for lumbar load estimation generated by an automated pipeline from whole body CT. Front. Bioeng. Biotechnol. 10, 862804. doi:10.3389/fbioe.2022.862804
Li, J., Pepe, A., Gsaxner, C., Luijten, G., Jin, Y., Ambigapathy, N., et al. (2023) MedShapeNet -- A large-scale dataset of 3D medical shapes for computer vision.
Lister, K., Gao, Z., and Desai, J. P. (2011). Development of in vivo constitutive models for liver: application to surgical simulation. Ann. Biomed. Eng. 39, 1060–1073. doi:10.1007/s10439-010-0227-8
Lohr, M. J., Sugerman, G. P., Kakaletsis, S., Lejeune, E., and Rausch, M. K. (2022). An introduction to the Ogden model in biomechanics: benefits, implementation tools and limitations. Philos. Trans. A Math. Phys. Eng. Sci. 380, 20210365. doi:10.1098/rsta.2021.0365
Lu, M.-H., Yu, W., Huang, Q.-H., Huang, Y.-P., and Zheng, Y.-P. (2009). A hand-held indentation system for the assessment of mechanical properties of soft tissues in vivo. IEEE Trans. Instrum. Meas. 58, 3079–3085. doi:10.1109/TIM.2009.2016876
Ma, J., Zhang, Y., Gu, S., Zhu, C., Ge, C., Zhang, Y., et al. (2022). AbdomenCT-1K: is abdominal organ segmentation a solved problem? IEEE Trans. Pattern Anal. Mach. Intell. 44, 6695–6714. doi:10.1109/TPAMI.2021.3100536
Maas, S. A., Ellis, B. J., Ateshian, G. A., and Weiss, J. A. (2012). FEBio: finite elements for biomechanics. J. Biomech. Eng. 134, 011005. doi:10.1115/1.4005694
Macron, A., Pillet, H., Doridam, J., Rivals, I., Sadeghinia, M. J., Verney, A., et al. (2020). Is a simplified Finite Element model of the gluteus region able to capture the mechanical response of the internal soft tissues under compression? Clin. Biomech. 71, 92–100. doi:10.1016/j.clinbiomech.2019.10.005
Maiden, N. R., Fisk, W., Wachsberger, C., and Byard, R. W. (2015). Ballistics ordnance gelatine - how different concentrations, temperatures and curing times affect calibration results. J. forensic Leg. Med. 34, 145–150. doi:10.1016/j.jflm.2015.05.019
Marinopoulos, T., Zani, L., Li, S., and Silberschmidt, V. V. (2020). Modelling indentation of human lower-limb soft tissue: simulation parameters and their effects. Contin. Mech. Thermodyn. 35, 939–955. doi:10.1007/s00161-020-00933-w
Melia, M., Schmidt, M., Geissler, B., König, J., Krahn, U., Ottersbach, H. J., et al. (2015). Measuring mechanical pain: the refinement and standardization of pressure pain threshold measurements. Behav. Res. 47, 216–227. doi:10.3758/s13428-014-0453-3
Misra, S., Ramesh, K. T., and Okamura, A. M. (2008). Modeling of tool-tissue interactions for computer-based surgical simulation: a literature review. PRESENCE Teleoperators Virtual Environ. 17, 463–491. doi:10.1162/pres.17.5.463
Moerman, K. M. (2012) An improved Framework for the inverse Analysis of skeletal muscle tissue in-vivo. Dissertation. Dublin: The University of Dublin, Trinity College.
Moerman, K. M. (2018). GIBBON: the geometry and image-based bioengineering add-on. J. Open Source Softw. 3, 506. doi:10.21105/joss.00506
Moerman, K. M., Holt, C. A., Evans, S. L., and Simms, C. K. (2009). Digital image correlation and finite element modelling as a method to determine mechanical properties of human soft tissue in vivo. J. Biomechanics 42, 1150–1153. doi:10.1016/j.jbiomech.2009.02.016
Moerman, K. M., Solav, D., Sengeh, D., and Herr, H. (2016) Automated and data-driven computational design of patient-specific biomechanical interfaces. engrxiv. doi:10.31224/osf.io/g8h9n
Moerman, K. M., van Vijven, M., Solis, L. R., van Haaften, E. E., Loenen, A. C., Mushahwar, V. K., et al. (2017). On the importance of 3D, geometrically accurate, and subject-specific finite element analysis for evaluation of in-vivo soft tissue loads. Comput. Methods Biomech. Biomed. Engin 20, 483–491. doi:10.1080/10255842.2016.1250259
Molimard, J., Bonnaire, R., Han, W. S., Convert, R., and Calmels, P. (2019). In-silico pre-clinical trials are made possible by a new simple and comprehensive lumbar belt mechanical model based on the Law of Laplace including support deformation and adhesion effects. PLoS ONE 14, e0212681. doi:10.1371/journal.pone.0212681
Muttray, A., Melia, M., Geißler, B., König, J., and Letzel, S. (2014). Kollaborierende Roboter: Ermittlung der Schmerzempfindlichkeit an der Mensch-Maschine-Schnittstelle. Wiss. Schlussbericht zum Vorhaben FP-0317.
Neumann, M., and Bender, B. (2022). “Challenges in the development of biomechatronic systems,” in Design methodology for future products (Cham: Springer), 105–122.
Neumann, M., Remus, R., Sauerhoff, M., Lipphaus, A., Uttich, E., Sure, C., et al. (2020). Digitale Zwillinge in Interaktion mit Menschmodellen. ZWF 115, 116–120. doi:10.3139/104.112327
Ní Annaidh, A., Bruyère, K., Destrade, M., Gilchrist, M. D., and Otténio, M. (2012). Characterization of the anisotropic mechanical properties of excised human skin. J. Mech. Behav. Biomed. Mater 5, 139–148. doi:10.1016/j.jmbbm.2011.08.016
Norton, K. I. (2018). “Standards for anthropometry assessment,” in Kinanthropometry and exercise physiology. Editors K. Norton, and R. Eston (Boca Raton, FL: Routledge), 68–137.
Oddes, Z., and Solav, D. (2023). Identifiability of soft tissue constitutive parameters from in-vivo macro-indentation. J. Mech. Behav. Biomed. Mater 140, 105708. doi:10.1016/j.jmbbm.2023.105708
Pavan, P. G., Todros, S., Pachera, P., Pianigiani, S., and Natali, A. N. (2019). The effects of the muscular contraction on the abdominal biomechanics: a numerical investigation. Comput. Methods Biomech. Biomed. Engin 22, 139–148. doi:10.1080/10255842.2018.1540695
Périé, D., Aubin, C. E., Lacroix, M., Lafon, Y., and Labelle, H. (2004). Biomechanical modelling of orthotic treatment of the scoliotic spine including a detailed representation of the brace-torso interface. Med. Biol. Eng. Comput. 42, 339–344. doi:10.1007/BF02344709
Peterson, M. J., Czerwinski, S. A., and Siervogel, R. M. (2003). Development and validation of skinfold-thickness prediction equations with a 4-compartment model. Am. J. Clin. Nutr. 77, 1186–1191. doi:10.1093/ajcn/77.5.1186
Pierrat, B., MacManus, D. B., Murphy, J. G., and Gilchrist, M. D. (2018). Indentation of heterogeneous soft tissue: local constitutive parameter mapping using an inverse method and an automated rig. J. Mech. Behav. Biomed. Mater 78, 515–528. doi:10.1016/j.jmbbm.2017.03.033
Podwojewski, F., Otténio, M., Beillas, P., Guérin, G., Turquier, F., and Mitton, D. (2014). Mechanical response of human abdominal walls ex vivo: effect of an incisional hernia and a mesh repair. J. Mech. Behav. Biomed. Mater 38, 126–133. doi:10.1016/j.jmbbm.2014.07.002
Portnoy, S., Yizhar, Z., Shabshin, N., Itzchak, Y., Kristal, A., Dotan-Marom, Y., et al. (2008). Internal mechanical conditions in the soft tissues of a residual limb of a trans-tibial amputee. J. Biomechanics 41, 1897–1909. doi:10.1016/j.jbiomech.2008.03.035
Ramachandra, R. (2016) Injury and impact responses of the abdomen subjected to seatbelt loading. Dissertation: The Ohio State University. US.
Remus, R., Lipphaus, A., Neumann, M., and Bender, B. (2021). Calibration and validation of a novel hybrid model of the lumbosacral spine in ArtiSynth-The passive structures. PLOS ONE 16, e0250456. doi:10.1371/journal.pone.0250456
Remus, R., Selkmann, S., Lipphaus, A., Neumann, M., and Bender, B. (2023). Muscle-driven forward dynamic active hybrid model of the lumbosacral spine: combined FEM and multibody simulation. Front. Bioeng. Biotechnol. 11, 1223007. doi:10.3389/fbioe.2023.1223007
Rohen, J. W., Yokochi, C., and Lütjen-Drecoll, E. (2015) Anatomy: a photographic atlas. USA: Wolters Kluwer.
Sadler, Z., Scott, J., Drost, J., Chen, S., Roccabianca, S., and Bush, T. R. (2018). Initial estimation of the in vivo material properties of the seated human buttocks and thighs. Int. J. Non-Linear Mech. 107, 77–85. doi:10.1016/j.ijnonlinmec.2018.09.007
Sanders, J. E., Greve, J. M., Mitchell, S. B., and Zachariah, S. G. (1998). Material properties of commonly-used interface materials and their static coefficients of friction with skin and socks. J. Rehabil. Res. Dev. 35, 161–176.
Sato, F., Yamamoto, Y., Ito, D., Antona-Makoshi, J., Ejima, S., Kamiji, K., et al. (2013). “Hyper-viscoelastic response of perfused liver under dynamic compression and estimation of tissue strain thresholds with a liver finite element model,” in Proceedings of the 2013 IRCOBI Conference, China, September 11-13, 2013 (IEEE), 736–750.
Sattout, A., Clin, J., Cobetto, N., Labelle, H., and Aubin, C.-E. (2016). Biomechanical assessment of providence nighttime brace for the treatment of adolescent idiopathic scoliosis. Spine Deform. 4, 253–260. doi:10.1016/j.jspd.2015.12.004
Schünke, M., Schulte, E., and Schumacher, U. (2018) PROMETHEUS Allgemeine Anatomie und Bewegungssystem: LernAtlas der Anatomie. Stuttgart: Georg Thieme Verlag.
Sekuboyina, A., Husseini, M. E., Bayat, A., Löffler, M., Liebl, H., Li, H., et al. (2021). VerSe: a Vertebrae labelling and segmentation benchmark for multi-detector CT images. Med. Image Anal. 73, 102166. doi:10.1016/j.media.2021.102166
Simo, J. C., and Taylor, R. L. (1991). Quasi-incompressible finite elasticity in principal stretches. Continuum basis and numerical algorithms. Appl. Mech. Eng. 85, 273–310. doi:10.1016/0045-7825(91)90100-k
Simón-Allué, R., Calvo, B., Oberai, A. A., and Barbone, P. E. (2017). Towards the mechanical characterization of abdominal wall by inverse analysis. J. Mech. Behav. Biomed. Mater 66, 127–137. doi:10.1016/j.jmbbm.2016.11.007
Snedeker, J. G., Barnstuble, B. B., Iaizzo, P. A., Farshad, M., Niederer, P., and Schmidlin, F. R. (2007). A comprehensive renal injury concept based on a validated finite element model of the human abdomen. J. Trauma 62, 1240–1249. doi:10.1097/01.ta.0000215531.05677.19
Solav, D., Moerman, K. M., Jaeger, A. M., Genovese, K., and Herr, H. M. (2018). MultiDIC: an open-source toolbox for multi-view 3D digital image correlation. IEEE Access 6, 30520–30535. doi:10.1109/ACCESS.2018.2843725
Song, C., Alijani, A., Frank, T., Hanna, G., and Cuschieri, A. (2006). Elasticity of the living abdominal wall in laparoscopic surgery. J. Biomechanics 39, 587–591. doi:10.1016/j.jbiomech.2004.12.019
Standring, S., Ananad, N., and Gray, H. (2016). Gray's anatomy: the anatomical basis of clinical practice (Philadelphia, Pa: Elsevier).
Stokes, I. A., Gardner-Morse, M. G., and Henry, S. M. (2010). Intra-abdominal pressure and abdominal wall muscular function: spinal unloading mechanism. Clin. Biomech. (Bristol, Avon) 25, 859–866. doi:10.1016/j.clinbiomech.2010.06.018
Szepietowska, K., Troka, M., Lichodziejewska-Niemierko, M., Chmielewski, M., and Lubowiecka, I. (2023). Full-field in vivo experimental study of the strains of a breathing human abdominal wall with intra-abdominal pressure variation. J. Mech. Behav. Biomed. Mater 147, 106148. doi:10.1016/j.jmbbm.2023.106148
Szymczak, C., Lubowiecka, I., Tomaszewska, A., and Smietański, M. (2012). Investigation of abdomen surface deformation due to life excitation: implications for implant selection and orientation in laparoscopic ventral hernia repair. Clin. Biomech. (Bristol, Avon) 27, 105–110. doi:10.1016/j.clinbiomech.2011.08.008
Tay, B. K., Kim, J., and Srinivasan, M. A. (2006). In vivo mechanical behavior of intra-abdominal organs. IEEE Trans. Biomed. Eng. 53, 2129–2138. doi:10.1109/TBME.2006.879474
Tayebi, S., Gutierrez, A., Mohout, I., Smets, E., Wise, R., Stiens, J., et al. (2021). A concise overview of non-invasive intra-abdominal pressure measurement techniques: from bench to bedside. J. Clin. Monit. Comput. 35, 51–70. doi:10.1007/s10877-020-00561-4
Todros, S., Cesare, N. de, Concheri, G., Natali, A. N., and Pavan, P. G. (2020). Numerical modelling of abdominal wall mechanics: the role of muscular contraction and intra-abdominal pressure. J. Mech. Behav. Biomed. Mater 103, 103578. doi:10.1016/j.jmbbm.2019.103578
Todros, S., Cesare, N. de, Pianigiani, S., Concheri, G., Savio, G., Natali, A. N., et al. (2019). 3D surface imaging of abdominal wall muscular contraction. Comput. Methods Programs Biomed. 175, 103–109. doi:10.1016/j.cmpb.2019.04.013
Tran, D., Mitton, D., Voirin, D., Turquier, F., and Beillas, P. (2014). Contribution of the skin, rectus abdominis and their sheaths to the structural response of the abdominal wall ex vivo. J. Biomechanics 47, 3056–3063. doi:10.1016/j.jbiomech.2014.06.031
Tran, D., Podwojewski, F., Beillas, P., Ottenio, M., Voirin, D., Turquier, F., et al. (2016). Abdominal wall muscle elasticity and abdomen local stiffness on healthy volunteers during various physiological activities. J. Mech. Behav. Biomed. Mater 60, 451–459. doi:10.1016/j.jmbbm.2016.03.001
Untaroiu, C. D., Pak, W., Meng, Y., Schap, J., Koya, B., and Gayzik, S. (2018). A finite element model of a midsize male for simulating pedestrian accidents. J. Biomech. Eng. 140. doi:10.1115/1.4037854
Valliere, M. J., Wall, P. L., and Buising, C. M. (2018). From pull to pressure: effects of Tourniquet buckles and straps. J. Am. Coll. Surg. 227, 332–345. doi:10.1016/j.jamcollsurg.2018.06.005
van Loocke, M., Lyons, C. G., and Simms, C. K. (2006). A validated model of passive muscle in compression. J. Biomechanics 39, 2999–3009. doi:10.1016/j.jbiomech.2005.10.016
van Ramshorst, G. H., Lange, J. F., Goossens, R. H. M., Agudelo, N. L., Kleinrensink, G. J., Verwaal, M., et al. (2008). Non-invasive measurement of intra-abdominal pressure: a preliminary study. Physiol. Meas. 29, N41–N47. doi:10.1088/0967-3334/29/8/N01
van Ramshorst, G. H., Salih, M., Hop, W. C. J., van Waes, O. J. F., Kleinrensink, G.-J., Goossens, R. H. M., et al. (2011). Noninvasive assessment of intra-abdominal pressure by measurement of abdominal wall tension. J. Surg. Res. 171, 240–244. doi:10.1016/j.jss.2010.02.007
Van Sint Jan, S. L. (2007) Color atlas of skeletal landmark definitions: guidelines for reproducible manual and virtual palpations. Edinburgh, New York: Churchill Livingstone.
Viano, D. C. (1989). Biomechanical responses and injuries in blunt lateral impact. SAE Trans. 98, 892432–901719. doi:10.4271/892432
Wang, X., He, K., Zhu, Y., Fu, X., Huang, Z., Ding, R., et al. (2020). Use of shear wave elastography to quantify abdominal wall muscular properties in patients with incisional hernia. Ultrasound Med. Biol. 46, 1651–1657. doi:10.1016/j.ultrasmedbio.2020.03.027
Wang, X., Savonnet, L., Theodorakos, I., Beurier, G., and Duprey, S. (2019). “Biomechanical human models for seating discomfort assessment,” in DHM and posturography. Editor S. Scataglini (San Diego: Elsevier Science and Technology), 643–656.
Wells, P. N. T., and Liang, H.-D. (2011). Medical ultrasound: imaging of soft tissue strain and elasticity. J. R. Soc. Interface 8, 1521–1549. doi:10.1098/rsif.2011.0054
Wolf, A., Miehling, J., and Wartzack, S. (2020a). Challenges in interaction modelling with digital human models – a systematic literature review of interaction modelling approaches. Ergonomics 63, 1442–1458. doi:10.1080/00140139.2020.1786606
Wolf, A., Miehling, J., and Wartzack, S. (2020b). Elementary affordances: a study on physical user-product interactions. Procedia CIRP 91, 621–626. doi:10.1016/j.procir.2020.02.220
Yu, W., Li, Y., Zheng, Y.-P., Lim, N. Y., Lu, M. H., and Fan, J. (2006). Softness measurements for open-cell foam materials and human soft tissue. Meas. Sci. Technol. 17, 1785–1791. doi:10.1088/0957-0233/17/7/017
Keywords: soft tissue biomechanics, inverse FEA, surface EMG (sEMG), abdominal wall, hyperelastic material properties, human abdomen, in vivo indenter measurements, FEBio
Citation: Remus R, Sure C, Selkmann S, Uttich E and Bender B (2024) Soft tissue material properties based on human abdominal in vivo macro-indenter measurements. Front. Bioeng. Biotechnol. 12:1384062. doi: 10.3389/fbioe.2024.1384062
Received: 08 February 2024; Accepted: 22 April 2024;
Published: 24 May 2024.
Edited by:
Jörg Miehling, Technische Fakultät, Friedrich-Alexander-Universität Erlangen-Nürnberg, GermanyReviewed by:
Alessio Gizzi, Campus Bio-Medico University, ItalyWojciech Wolański, Silesian University of Technology, Poland
Copyright © 2024 Remus, Sure, Selkmann, Uttich and Bender. This is an open-access article distributed under the terms of the Creative Commons Attribution License (CC BY). The use, distribution or reproduction in other forums is permitted, provided the original author(s) and the copyright owner(s) are credited and that the original publication in this journal is cited, in accordance with accepted academic practice. No use, distribution or reproduction is permitted which does not comply with these terms.
*Correspondence: Robin Remus, cm9iaW4ucmVtdXNAcnViLmRl