Abstract
Phenotypic analysis has significant potential for aiding breeding efforts. However, there is a notable lack of studies utilizing phenotypic analysis in the field of edible fungi. Pleurotus geesteranus is a lucrative edible fungus with significant market demand and substantial industrial output, and early-stage phenotypic analysis of Pleurotus geesteranus is imperative during its breeding process. This study utilizes image recognition technology to investigate the phenotypic features of the mycelium of P. geesteranus. We aim to establish the relations between these phenotypic characteristics and mycelial quality. Four groups of mycelia, namely, the non-degraded and degraded mycelium and the 5th and 14th subcultures, are used as image sources. Two categories of phenotypic metrics, outline and texture, are quantitatively calculated and analyzed. In the outline features of the mycelium, five indexes, namely, mycelial perimeter, radius, area, growth rate, and change speed, are proposed to demonstrate mycelial growth. In the texture features of the mycelium, five indexes, namely, mycelial coverage, roundness, groove depth, density, and density change, are studied to analyze the phenotypic characteristics of the mycelium. Moreover, we also compared the cellulase and laccase activities of the mycelium and found that cellulase level was consistent with the phenotypic indices of the mycelium, which further verified the accuracy of digital image processing technology in analyzing the phenotypic characteristics of the mycelium. The results indicate that there are significant differences in these 10 phenotypic characteristic indices (), elucidating a close relationship between phenotypic characteristics and mycelial quality. This conclusion facilitates rapid and accurate strain selection in the early breeding stage of P. geesteranus.
1 Introduction
Pleurotus geesteranus, a globally cultivated edible fungus, plays a significant role in economies worldwide (Singh et al., 2021; Wei et al., 2023). Analysis of P. geesteranus market prospects in 2024 showed that the global P. geesteranus market size is approximately 10.9 billion US dollars and is expected to grow at an annual rate of about 5%. In 2023, P. geesteranus accounted for 17.45% of the output of edible fungi in China. The seeds of edible fungi are referred to as edible fungus strains. According to the source, generation of propagation, and production purposes, they can be divided into three levels: mother strain, original strain, and cultivation strain. The mycelial quality is intricately tied to its yield, making it a crucial factor influencing economic benefits (Zhang et al., 2019). Mycelial degeneration refers to the phenomenon where the traits of edible fungus populations deteriorate, leading to deviations in yield, quality, and resistance that do not meet human needs. Mycelial degeneration is a serious issue commonly encountered in the cultivation of various edible fungi. In practical production, mycelial degradation generally takes place during its preservation and subculture. Using degenerated strains for cultivation often results in delayed fruiting, low yield, and poor quality, which cause significant economic losses to producers of edible fungus (Pérez et al., 2021). The mycelial phenotype is the collective expression of its individual traits within a certain environment and provides fundamental information for breeding purposes (Helgason and Fitter, 2009). Mycelial degeneration of P. geesteranus is both complex and varied. To optimize the high production cultivation of the mycelium of P. geesteranus, breeders need to evaluate the mycelial phenotype by gathering phenotypic information through sampling, measurement, observation, and calculation techniques (Lehmann et al., 2019; James et al., 2022). Phenotypic parameters including mycelium growth rate, density, color, and content of specific substances such as polysaccharides, active proteins, and other bioactive components of the strain serve as the primary criteria for assessing the mycelial quality of P. geesteranus (Yang et al., 2022). In the initial stages of cultivation, accurately distinguishing the degenerated mycelium based on phenotypic characteristics is crucial (Danner et al., 2023). This process aids in effective selection and cultivation of the mycelium, while also preventing the degenerated mycelium from flowing into the production process, ultimately enhancing overall economic efficiency.
To date, the phenotypic characteristics of edible fungi have been assessed through observation, resulting in drawbacks like low precision, inadequate standardization, time-intensive procedures, and high-intensity labor (Furbank and Tester, 2011; Yin et al., 2022; Liu et al., 2023). Digital image processing is capable of precise computation for qualitative and quantitative analyses, instead of manual measurement, which often relies on subjective judgment based on experience. Recently, digital image processing has emerged as a vital analytical method for evaluating the phenotypic attributes of crops, encompassing factors like crop color, growth, density, and uniformity (Mahajan et al., 2015; Zhao et al., 2019; Omari et al., 2020). This approach involves analyzing pixel attributes and inter-pixel attributes and analyzing the dynamic characteristics of their trait expression over growth time (Chen et al., 2014). Guo et al. (2018) extracted a total of 51 image-based traits from 507 rice samples for studying the plant drought tolerance traits and assisting in drought-resistant breeding. Li B. et al. (2020) conducted a systematic analysis of 119 image-based digital traits of 200 cotton seedlings under drought stress. Li H. et al. (2020) quantified the correlation among 43 phenotypic characteristics of rapeseed with their growth conditions and predicted the final rapeseed yield. Currently, researchers have attained high-throughput, high-precise, and non-destructive acquisition of crop phenotypes for staple food crops like rice, wheat, and soybean, utilizing digital image processing technologies. This motivates the focus toward digital and efficient breeding research (Shakoor et al., 2017).
The phenotypes of edible fungi associated with mycelial quality are varied and intricate, encompassing factors such as growth rate, density, color, and content of specific substances. These phenotypic characteristics have a strong correlation with mycelial quality (Yoo et al., 2019). Specifically, it is generally manifested in the following aspects: 1) mycelial morphology: the relation between mycelial morphology and quality lies in the fact that the more regular and faster-growing species often have higher quality; 2) mycelial density: the higher the mycelial density, the more vigorous the mycelial growth and the higher the yield; 3) mycelial growth rate: the mycelium with faster growth rates can quickly occupy growth space and reduce competitive pressure, thereby improving yield; 4) mycelial color: the color of the mycelium can reflect the metabolic state and growth environment. The mycelium with bright and uniform coloration usually grows vigorously.
At present, the current research and applications of digital image processing for phenotypic analysis of P. geesteranus remain open. The objective of this paper is to investigate the inherent relations between the phenotypic characteristics of P. geesteranus and its mycelial quality. We acquired imaging data depicting four groups of the mycelium of P. geesteranus, encompassing both non-degraded and degraded states. We extracted two pivotal phenotypic characteristics of the mycelium, outline and texture, including a total of 10 indices and carried out quantitative calculation and analysis through digital image processing technology (Williams et al., 2013; Minervini et al., 2014; Yang et al., 2019; Basak et al., 2021).
Additionally, in order to study the correlation between phenotypic traits and mycelial quality, we also compared cellulase and laccase activities for verification. Cellulase, known as carboxymethyl cellulase (CL), is present ubiquitously in bacteria, fungi, and animals (Ghose, 1987). CL facilitates the degradation of carboxymethyl cellulose and finds extensive applications in medicine, food, cotton spinning, environmental protection, and renewable resource utilization (Khan et al., 2023). When cellulase breaks down cellulose, it is converted into glucose units and other reducing sugars. These reducing sugars can react with an anthrone reagent to form a blue–green complex, the intensity of which is proportional to the concentration of the reducing sugar. By measuring the color intensity after the reaction, the activity of cellulase can be indirectly calculated, that is, the amount of reducing sugar produced by cellulose breakdown per unit time. Therefore, we used the anthrone colorimetric method to analyze the cellulase activity on the mycelium. Laccase is a copper-containing polyphenol oxidase, belonging to the cupric blue oxidase family, widely distributed in fungi and higher plants, with strong redox ability, and has a wide range of applications in pulp biobleaching, degradation of environmental pollutants, lignocellulosic degradation, and biological detection.
Finally, the paper concluded that the phenotypic indices of cellulase and the mycelium were consistent and analyzed the internal relationship between mycelial quality and these phenotypic characteristics concerning the mycelial outline and texture.
2 Materials and methods
2.1 Strain image materials
2.1.1 Mycelium of P. geesteranus
This study selected the mycelium from P. geesteranus (Xiu 2), along with subcultures up to the 5th and 14th generations, as well as degraded strains. All these materials were sourced from the Fungi Research Center of Fujian Agriculture and Forestry University. Among them, the non-degenerated strain was labeled as X2-N, the 5th generation subculture strain was labeled as X2-5, the 14th generation subculture strain was labeled as X2-14, and the degenerated strain was labeled as X2-T.
During the experiment, the solid medium, Potato Dextrose Agar (PDA), comprised 200 potato, 20 glucose, 20 agar, and 1,000 water. First, we performed strain activation by inoculating each of the four mycelium strains into 90--diameter Petri dishes containing the PDA medium. These dishes were then placed in a 25 incubation room and cultured in an inverted position for 8 days. The images of the four activated species are shown in Figure 1. In the next step, we expanded the culture on the activated strain samples of P. geesteranus. A 5-mm-diameter piece of the mycelium was cut from the end of the mycelium and inoculated at the center of a new 90--diameter PDA Petri dish. They were cultured in an inverted position in a 25- incubation room for 8 days, and data were collected at that time. In this test, 100 non-degenerated strains, 100 X2-5 strains, 100 X2-14 strains, and 100 degenerated strains were collected; a total of 400 samples were preserved in the Key Laboratory of Agricultural Information Perception Technology, Qishan Campus, Fujian Agriculture and Forestry University.
FIGURE 1
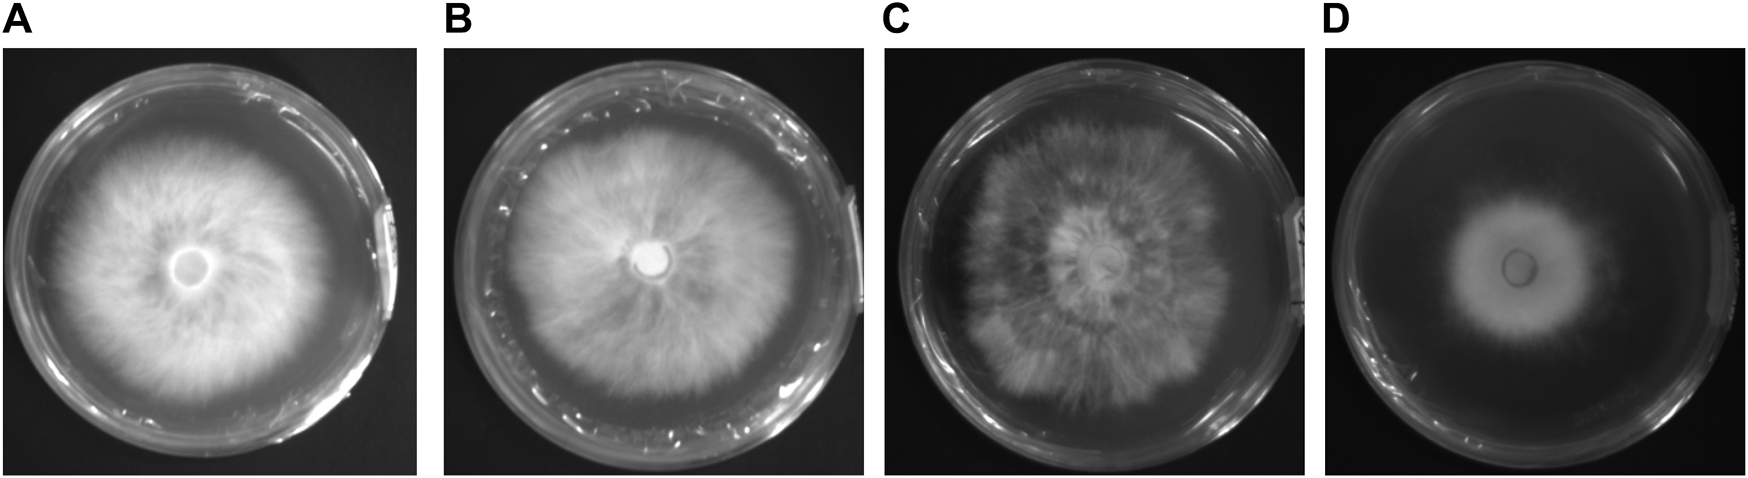
Image of four activated mycelium samples of Pleurotus geesteranus. (A) non-degenerated strain labeled X2-N; (B) 5th generation subculture strain labeled X2-5; (C) 14th generation subculture strain labeled X2-14; (D) degenerated strain labeled X2-T.
2.1.2 Image acquisition
This experiment captured the images of the mushroom by using an industrial camera (Basler acA 1300-30 gm; Germany), which was equipped with a Sony ICX445 CCD chip, 20 frames per second, resolution of 1.3 million pixels through Pylon Viewer 64-Bit software. The camera was positioned at a fixed distance of 25 directly above the Petri dish, resulting in mycelial images with a size of 1,280 × 980 pixels. Images were captured on days 2 and 8 following mycelial subculture. The mycelial samples displaying evident abnormalities in the outline and texture morphology were excluded, and the remaining 400 samples were employed for calculation and analysis in this study. The device for image acquisition of the mycelium was set in the Key Laboratory of Agricultural Information Perception Technology at Fujian Agriculture and Forestry University, as shown in Figure 2, which consisted of an industrial camera, light source, computer, and detection objects.
FIGURE 2
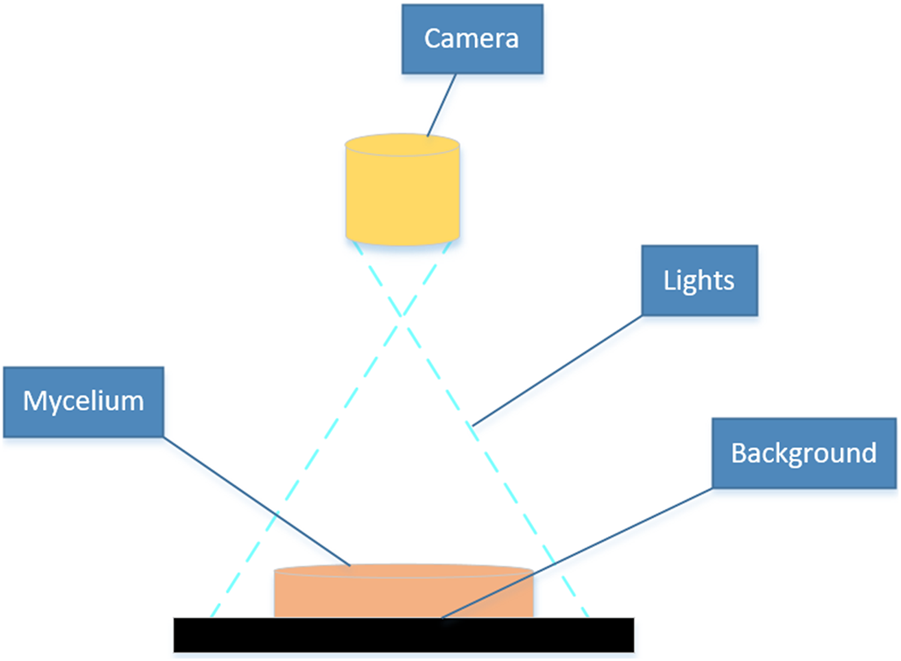
Equipment for mycelium image acquisition.
2.1.3 Image processing software
In order to realize the analysis and quantitative calculation of mycelial images on outline and texture indices, this experiment first used MATLAB 2020b (9.9.0.1467703) 64-bit (win64) software to perform the outline and texture processing, allowing computation in the formulations of 10 indices, namely, radius, perimeter, area, growth rate, change speed, mycelium coverage, integrity, groove depth, density, and density change. Furthermore, IBM SPSS Statistics R26.0.0.0 64-bit was utilized to analyze and optimize the normality and correlation of the acquired image data. In addition, OriginPro 2022 software outputted the statistical maps of the data. The computer environment was Windows 10 with the graphics card driver being version 27.21.14.5167 of NVIDIA GeForce GT 730.
2.2 Strain image processing methods
The comprehensive technology is presented in Figure 3. We obtained 10 phenotypic indicator datasets for each strain sample by employing both outline and texture processing methods. Initially, in the outline formulation, binarization and threshold segmentation were employed to delineate the mycelial boundary, minimum circumscribed rectangle, and horizontal and vertical axes (Chen et al., 2008; Underwood et al., 2017). Following this, five indices, namely, mycelial perimeter, radius, area, growth rate, and change speed, were calculated to scrutinize the morphological and phenotypic traits of the mycelial outline (Bae et al., 2011; Le et al., 2012). Subsequently, the gray-level co-occurrence matrix was used to extract pixel count, contrast, and entropy (Xuan et al., 2022; Wu et al., 2023). An additional set of five indices, namely, mycelium coverage, roundness, groove depth, density, and density change, were calculated to analyze the phenotypic characteristics of the mycelium texture (Hu et al., 2022). Moreover, the cellulase and laccase activity indexes of the mycelium were compared, providing additional validation for the analysis results on the phenotypic characteristics of the mycelium (Samy et al., 2022). Finally, the study analyzed the internal correlation between the outline and texture concerning the phenotypic characteristics of the mycelium for P. geesteranus.
FIGURE 3
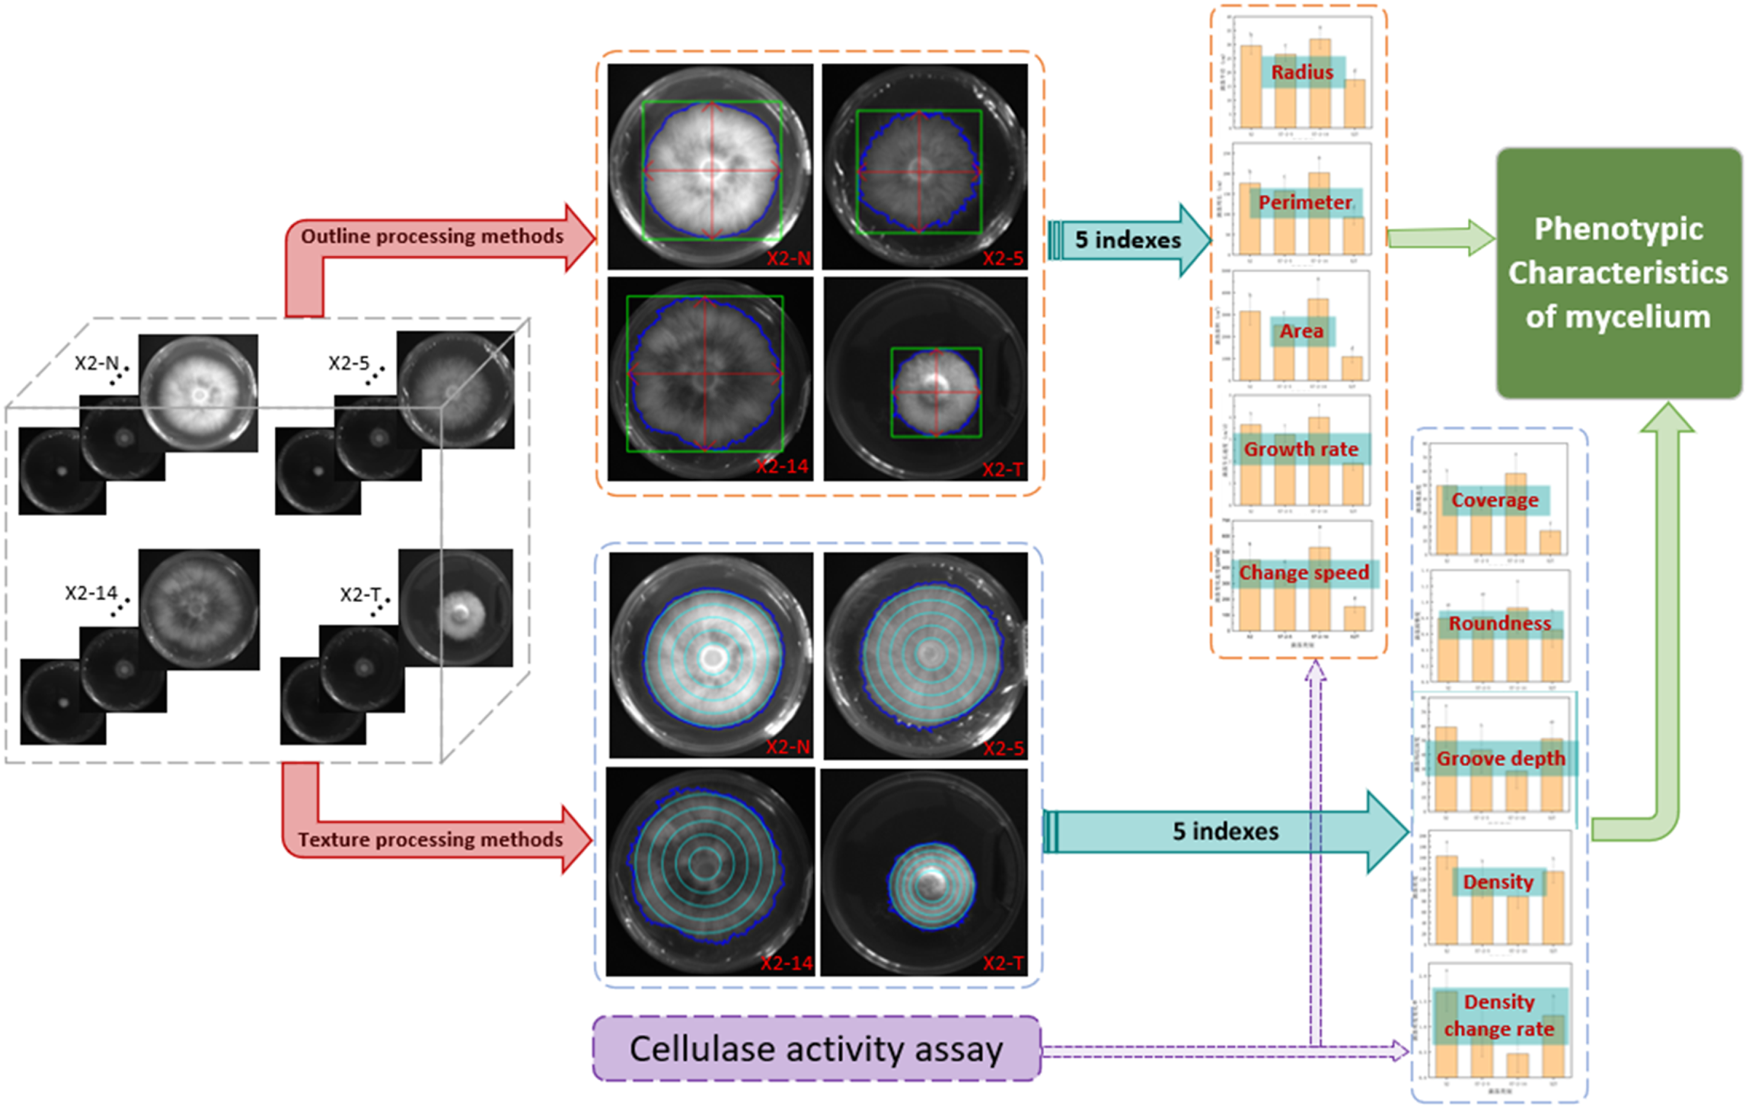
Comprehensive technical framework for phenotypic characteristics of the mycelium. 1) Four categories of mycelium samples, non-degraded (X2-N) and degraded (X2-T) mycelium and the 5th (X2-5) and 14th (X2-14) subcultures, were processed using two methods: contour and texture; 2) the calculations generated 10 corresponding indices of mycelial phenotypic characteristics; 3) statistical analysis of these data revealed the relationship between mycelial phenotypic characteristics and its quality; 4) the cellulase activity assessments were used to verify the accuracy of the above two methods.
2.2.1 Outline processing methods
We made observations at two time points—on day 2, following mycelium activation, and on day 8 of its growth—calculating the growth rate and change speed accordingly. The calculation steps and methods are shown in Figure 4.
FIGURE 4
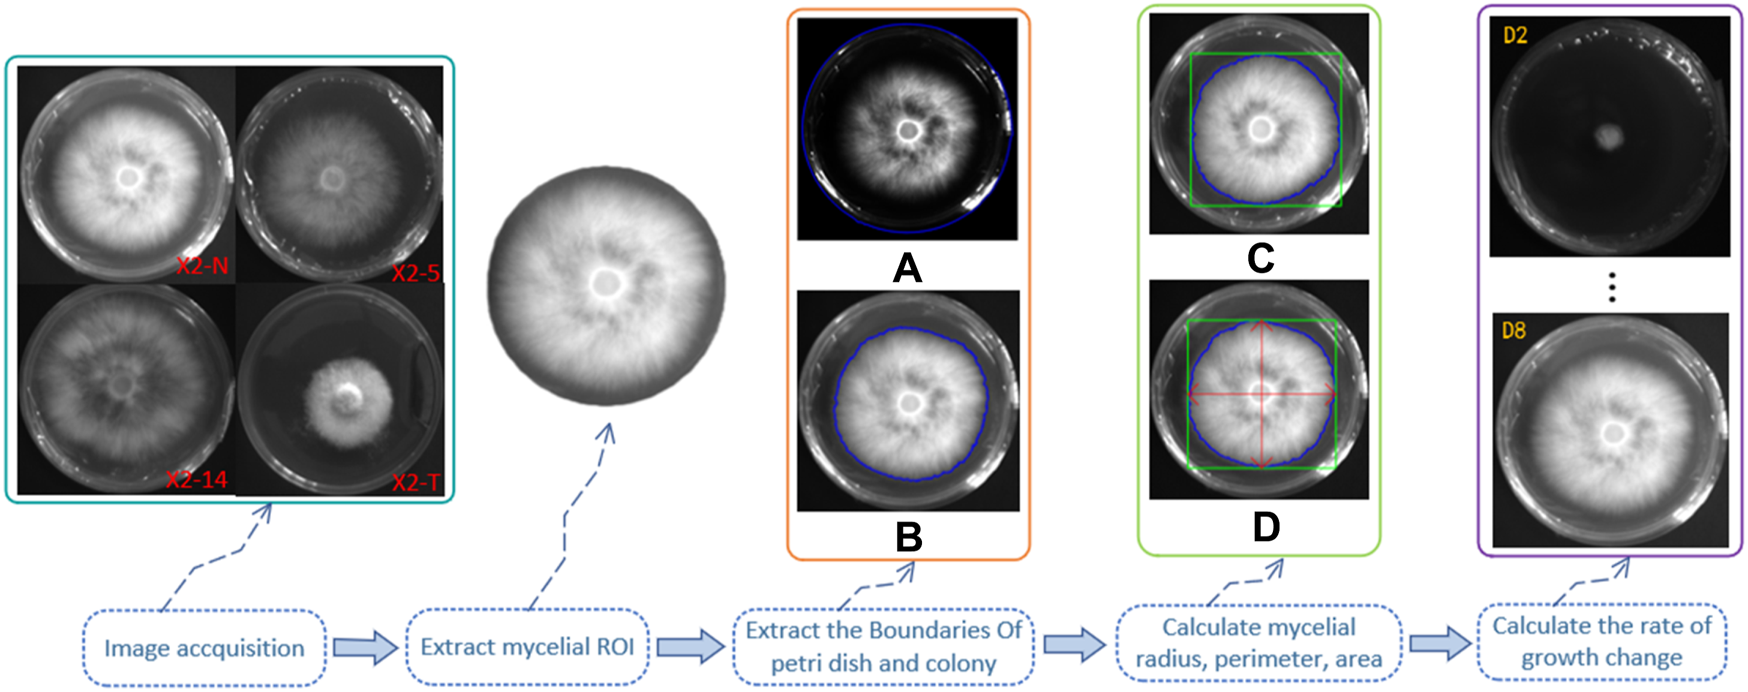
Calculation steps and methods of the mycelial outline. 1) Grayscale of the digital image of the mycelium was obtained using the camera, and the region of interest (ROI) was extracted; 2) outline of the boundary of the Petri dish (A) and the mycelium (B), as shown by the blue line; 3) the minimum external matrix of the mycelial boundary is denoted by the green line (C); 4) the radius, perimeter, and area were calculated through the horizontal and vertical axes by the red double-headed arrow (D); 5) days 2 and 8 of mycelium growth were set as two unit time observation points to calculate their growth rate and change speed.
The detailed procedure for analyzing the phenotypic characteristics of the mycelium concerning outline morphology is summarized as follows:
Algorithm 1.
Input: The gray value of the mycelial image
1) Grayscale processing on the mycelial image:
← Analyze the gray-level difference of the inner and outer edges of the Petri dish, and calculate the number of pixels on the border of the Petri dish;
← Analyze the difference between the gray level of the mycelium and the background pixel, and calculate the number of pixels on the border of the mycelium.
2) Use the number of all 2D pixels contained within the boundary:
← Calculate the number of Petri dish pixels;
← Calculate the number of mycelium pixels.
3) Calculate the minimum circumscribed circle matrix:
← Extract the horizontal axis in the mycelium outline, and calculate the number of pixels on the horizontal axis of the mycelium;
← Extract the mycelial vertical axis, and calculate the number of pixels on the vertical axis of the mycelium.
4) Day 2 of strain growth was regarded as the first observation time point , and day 8 was regarded as the second observation time point :
← Calculate the mycelium radius and mycelium area at ;
← Calculate the mycelium radius and mycelium area at .
Output: Use Eqs 1–5 to obtain five indexes of the mycelium outline (, , , , and ).
The five indices of the mycelial outline, namely, the mycelial radius, perimeter, area, growth rate, and change speed, were calculated to analyze the morphological and phenotypic characteristics (Hu et al., 2022), and the obtained results are shown in Table 1; Figure 5.
TABLE 1
| Index | X2-N | X2-5 | X2-14 | X2-T | F | p |
|---|---|---|---|---|---|---|
| Radius (cm) | 29.59 ± 3.04b | 26.50 ± 2.44c | 31.93 ± 3.46a | 17.38 ± 2.32d | 100.30 | <0.001 |
| Perimeter (cm) | 176.10 ± 22.54b | 157.39 ± 30.09c | 201.94 ± 31.99a | 92.68 ± 18.42d | 62.66 | <0.001 |
| Area (cm2) | 3,150.30 ± 621.31b | 2,515.08 ± 474.53c | 3,715.42 ± 816.76a | 30.32 ± 33.55d | 75.62 | <0.001 |
| Growth speed (cm/d) | 3.66 ± 0.43b | 3.22 ± 0.35c | 4.00 ± 0.49a | 1.92 ± 0.33d | 100.30 | <0.001 |
| Change speed (cm2/d) | 449.93 ± 88.76b | 359.19 ± 67.79c | 530.66 ± 116.68a | 155.32 ± 39.25d | 75.63 | <0.001 |
Phenotypic characteristic indices of the mycelial outline.
Note: 1) All characteristic data were recorded on day 8 after subcultures and subject to the mean () in each group; 2) values with superscripts denoted significant differences across index rows (); 3) all the comparison data were checked using the Bonferroni correction.
FIGURE 5
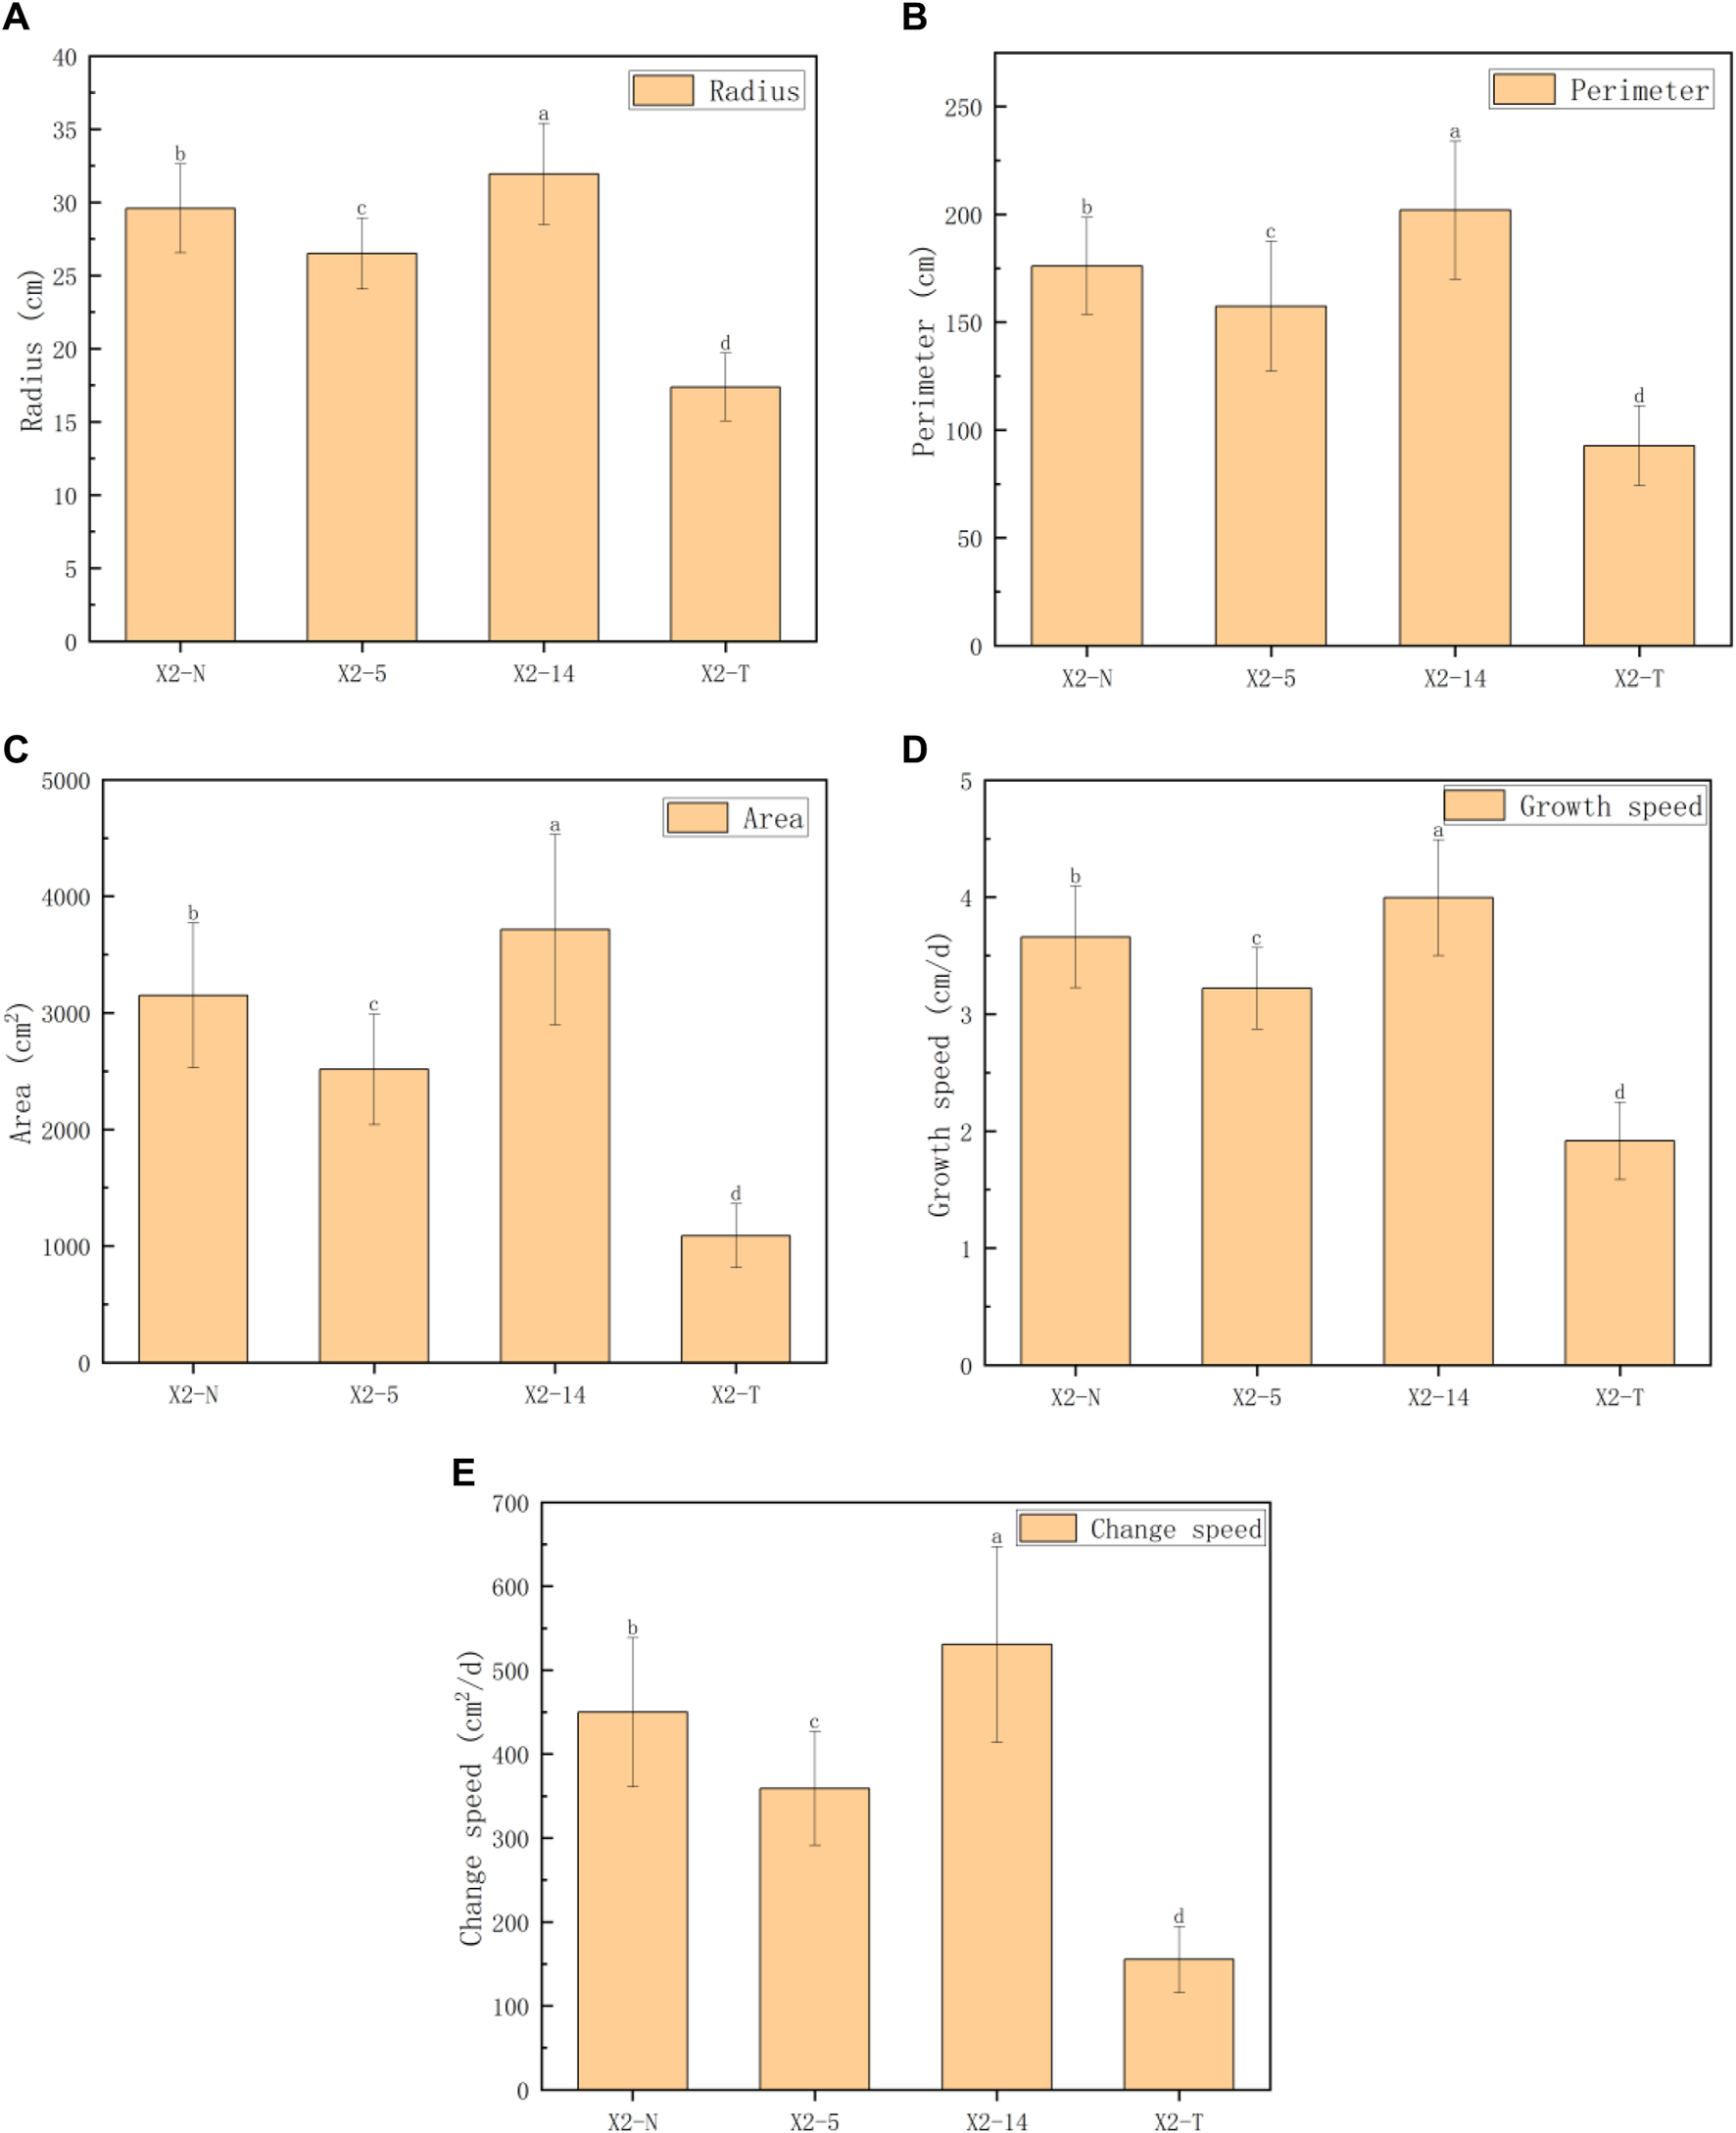
Comparison of five phenotypic characteristic indexes on the mycelial outline. (A) Radius (cm), (B) perimeter (cm), (C) area (cm2), (D) growth speed (cm/d), and (E) change speed (cm2/d). 1) The horizontal axis represented the four groups of mycelia, and the vertical axis represented each phenotypic data index; 2) all characteristic data were recorded on day 8 after subcultures and subject to the mean () in each group; and 3) values with superscripts denoted significant differences across index rows ().
2.2.1.1 Radius
where is the mycelial radius; and are the number of pixels on the horizontal and vertical axes of the mycelium, respectively; and and are the number of pixels on the border of the Petri dish and the measured diameter of the petri dish, respectively.
2.2.1.2 Perimeter
where is the perimeter of the mycelium, is the number of pixels on the border of the mycelium, and is the number of pixels on the border of the Petri dish.
2.2.1.3 Area
where is the mycelial area, is the number of pixels of the Petri dish, and is the number of pixels of the mycelium.
2.2.1.4 Growth rate
where is the growth rate of the mycelium, is the mycelial radius of observation time points, and is the mycelial radius of observation time points.
2.2.1.5 Change speed
where is the change in mycelial growth and and are the mycelium areas at two observation time points.
2.2.2 Texture processing methods
The steps of processing the phenotypic characteristics of the mycelium concerning texture morphology are summarized as follows:
Algorithm 2.
Input: The gray value of the original image of the mycelium is 0–255
1) ← Use the ratio of mycelial area and Petri dish area to calculate the mycelial coverage, as shown in Eq. 6;
2) ← Use the square of the ratio of mycelial perimeter and the mycelial area to calculate the mycelial roundness, as shown in Eq. 7;
3) ← Use the contrast feature quantity of the gray-scale co-occurrence matrix to calculate the mycelial groove depth, as shown in Eq. 8;
4) ← Use the gray value at the axis to calculate mycelial density, as shown in Eq. 9;
5) ← Use the density at time and to calculate the density change, as shown in Eq. 10;
Output: Five indices of mycelial texture morphology, , , , , and .
The five indices of the mycelial texture, namely, coverage, roundness, groove depth, density, and density change, were computed to analyze the morphological and phenotypic characteristics (Hu et al., 2022), and the obtained results are shown in Table 2; Figure 6.
TABLE 2
| Index | X2-N | X2-5 | X2-14 | X2-T | F | p |
|---|---|---|---|---|---|---|
| Coverage | 49.52 ± 9.77b | 39.53 ± 7.46c | 58.40 ± 12.84a | 17.10 ± 4.32d | 75.62 | <0.001 |
| Roundness | 0.80 ± 0.15ab | 0.81 ± 0.27ab | 0.93 ± 0.32a | 0.65 ± 0.22b | 4.12 | 0.009 |
| Groove depth | 59.30 ± 14.05a | 43.24 ± 16.16b | 28.43 ± 12.35c | 51.15 ± 10.54ab | 19.16 | <0.001 |
| Density | 162.65 ± 23.46a | 117.89 ± 32.62b | 88.71 ± 22.07c | 134.24 ± 20.89b | 30.13 | <0.001 |
| Density change | 1.69 ± 0.39a | 0.95 ± 0.54b | 0.47 ± 0.37c | 1.22 ± 0.35b | 30.13 | <0.001 |
Phenotypic characteristic indices of the mycelial texture.
Note: 1. All characteristic data were recorded on day 8 after subcultures and subject to the mean () in each group; 2) values with superscripts denoted significant differences across index rows (); 3) all the comparison data were checked by using the Bonferroni correction.
FIGURE 6
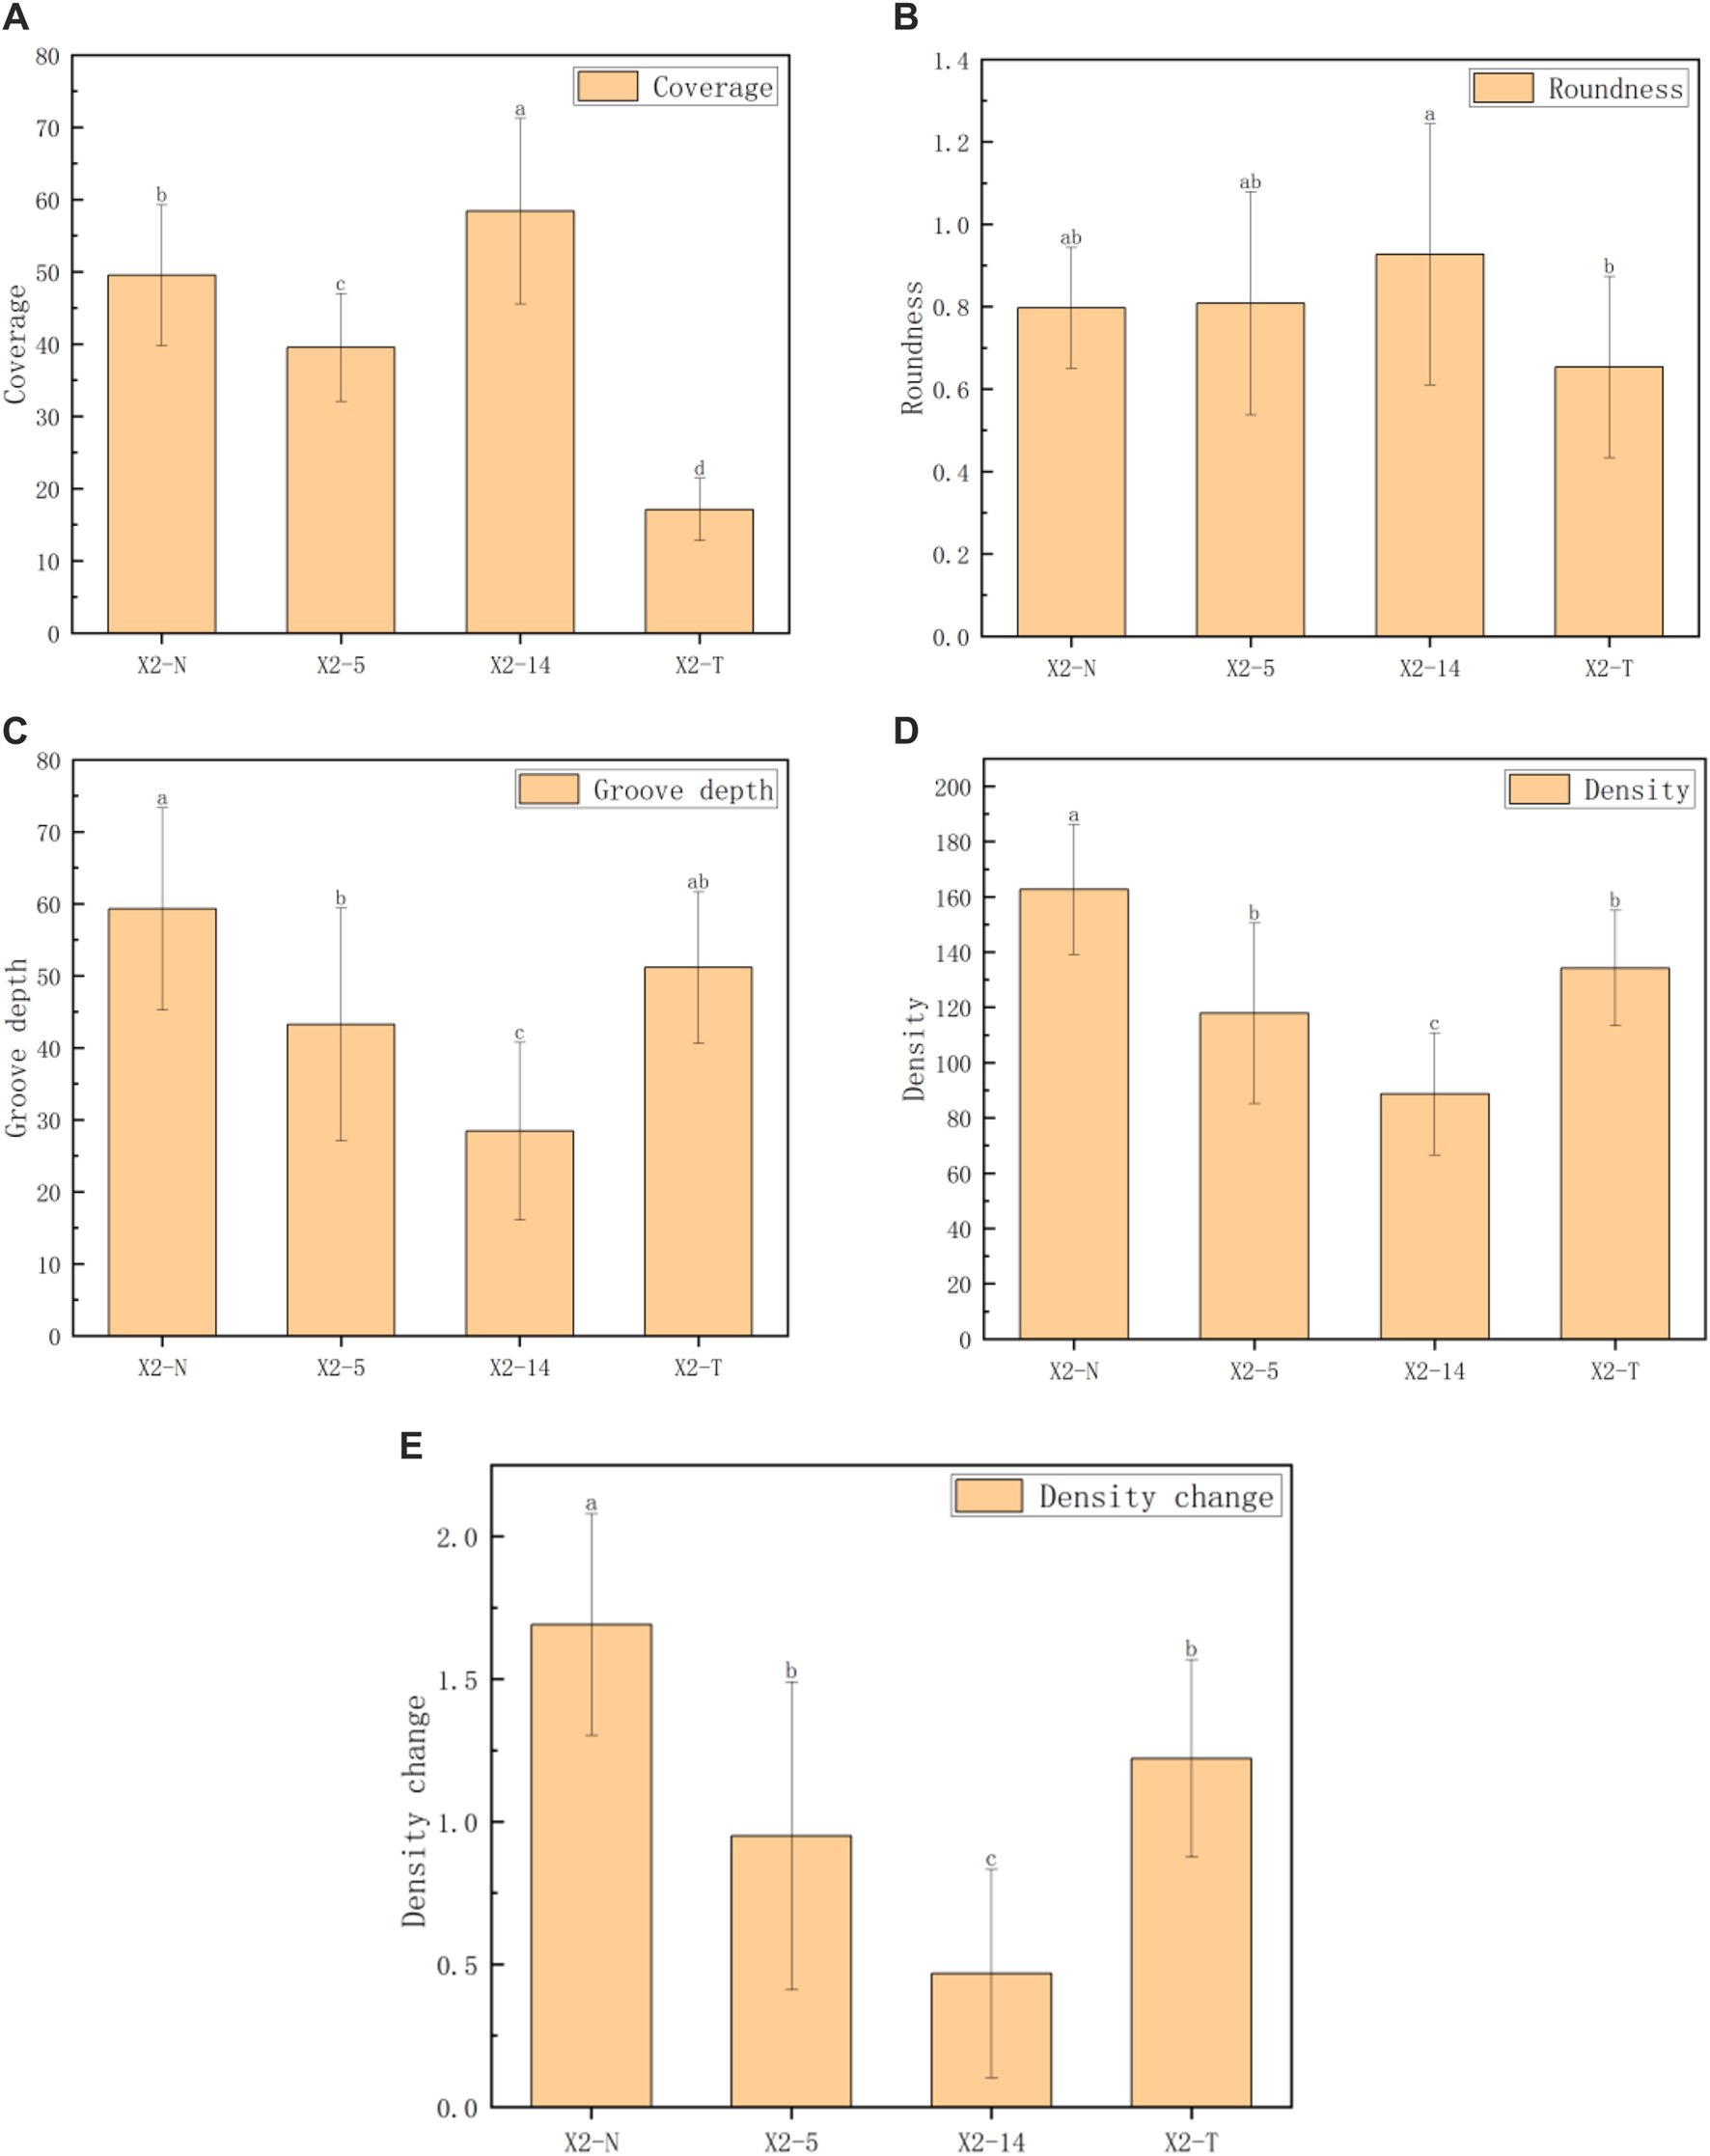
Comparison of five indexes of the mycelial texture. (A) Coverage, (B) roundness, (C) groove depth, (D) density, and (E) density change. 1) The horizontal axis represented the four groups of mycelia, and the vertical axis represented each phenotypic data index; 2) all characteristic data were recorded on day 8 after subcultures and subject to mean () in each group; 3) values with superscripts denoted significant differences across index rows ().
2.2.2.1 Coverage
where is the coverage of the mycelium, is the number of pixels of the Petri dish, is the number of pixels of the mycelium, and is the measured diameter of the Petri dish.
2.2.2.2 Roundness
where is the roundness of the mycelium, is the perimeter of the mycelium, and is the mycelial area.
2.2.2.3 Groove depth
where is the number of pixels between the minimum and maximum values along the horizontal axis, is the number of pixels between the minimum and maximum values along the vertical axis, and are the brightness values of the pixels, and is the total number of occurrences.
2.2.2.4 Density
where is the density of the mycelium and is the gray value at the axis .
2.2.2.5 Density change
where is the density change and and denote the density at time and , respectively.
2.3 Methods for extracting enzyme activity from the mycelium
2.3.1 Extraction method for cellulase activity
The activated mycelium was placed in a centrifuge tube using a hole puncher with a diameter of 5 mm and was then stored in a refrigerator at 4. Approximately 0.1 of mycelial tissue was measured, to which 1 of extract was added. The mixture was homogenized in an ice bath and then centrifuged at 8,000 for 10 min at 4. The supernatant was carefully extracted and stored on ice for subsequent use (Marei et al., 2012).
We adapted the anthrone colorimetric method to quantify the reducing sugar content generated through the degradation of sodium carboxymethyl cellulose, which was catalyzed by CL (Wood and Bhat, 1988). The procedure involved shaking the sample at 37 for 1 h and then placing it in a 90- water bath for 15 min. Subsequently, we centrifuged the sample at 8,000 at 25 for 10 min after cooling, collected the supernatant, and mixed it to prepare the saccharification solution. This solution was then incubated in a 90 water bath for 10 min. After cooling, we took 200 of the reaction solution and measured the absorbance value at 620 using a 96-well plate and then calculated , where and denote the measurement and control tubes, respectively. It was noted that these reducing sugars can react with the anthrone reagent to form a blue–green complex, the intensity of which is proportional to the concentration of the reducing sugar. By measuring the color intensity after the reaction, the activity of cellulase can be indirectly calculated, that is, the amount of reducing sugar produced by cellulose breakdown per unit time.
The regression equation for determining standard conditions was given by , where is the standard concentration () and is the absorbance value. The catalytic production of 1 of glucose per of tissue per minute is defined as a unit of enzyme activity. Then, based on the fresh weight of the sample, we calculated cellulase activity as shown below, and the results are given in Figure 7A.where denotes the total volume of the reaction, is the reaction volume of samples, is the extra volume of the extraction, is the reaction time, and is the sample mass. In this test, we gave the following parameters: , , , and .
FIGURE 7
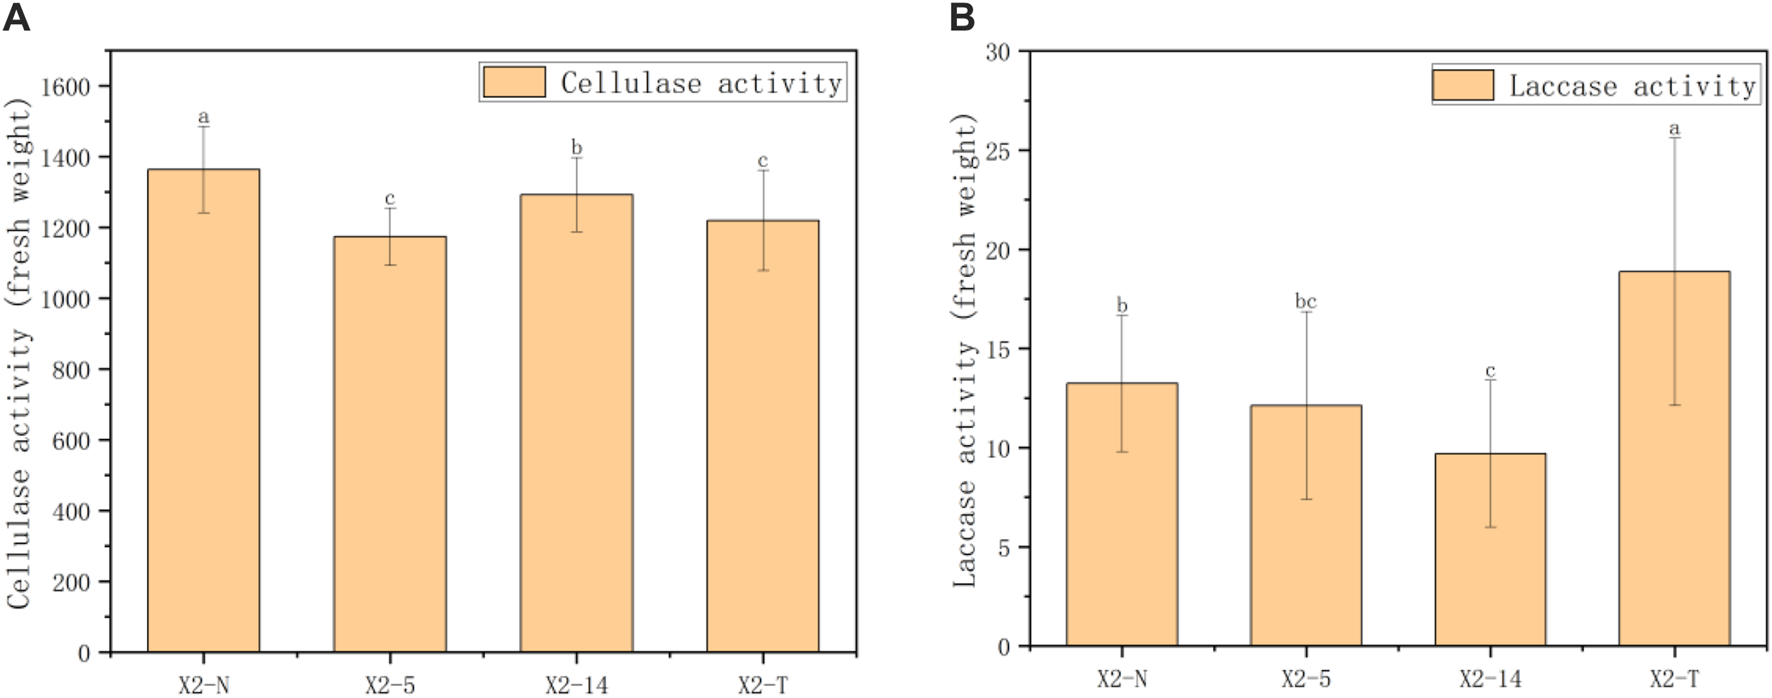
Results of enzyme activity in four groups of mycelia. (A) Results of cellulase activity in four groups of mycelia and (B) results of laccase activity in four groups of mycelia. 1) The horizontal axis represented the four groups of mycelia, and the vertical axis represented the enzyme activity in units of fresh weight; 2) all characteristic data were recorded on day 8 after subcultures and subject to the mean () in each group; 3) values with superscripts denoted significant differences across index rows ().
2.3.2 Extraction method for laccase activity
The activated mycelium was placed in a centrifuge tube using a hole puncher with a diameter of 5 and was then stored in a refrigerator at 4. Approximately 0.1 of mycelial tissue was measured, to which 1 of the extract was added. The mixture was homogenized in an ice bath and then centrifuged at 13,000 for 30 min at 4. The supernatant was carefully extracted and stored on ice for subsequent use.
Laccase decomposes the substrate ABTS to produce ABTS free radicals, which have a significantly higher absorbance coefficient at 420 than the substrate ABTS. By determining the increase rate of ABTS free radicals, the activity of laccase can be calculated. The reaction mixture was cooled to room temperature after 20 min in a water bath at 60. We took 200 of the reaction solution and measured the absorbance value at 420 using a 96-well plate and then calculated , where and denote the measurement and control tubes, respectively. The amount of enzyme required to oxidize 1 substrate ABTS per gram of sample per minute was defined as one unit of enzyme activity. Then, based on the fresh weight of the sample, we calculated cellulase activity as shown below, and the results by using Eq. 12 are given in Figure 7B.
where denotes the millimolar extinction coefficient of ABTS, is the light diameter of the cuvette, denotes the total volume of the reaction, is the reaction volume of samples, is the extra volume of the extraction, is the reaction time, and is the sample mass. In this test, we gave the following parameters: , , , , , and .
3 Results
3.1 Results of the mycelial outline
For convenience, four groups of mycelium, namely, the non-degraded and degraded mycelium and the 5th and 14th subcultures, were denoted as X2-N, X2-T, X2-5, and X2-14, respectively. We took 100 samples selected from each group. A total of 400 samples were photographed and recorded on day 8 after inoculation. We precisely computed the outline morphology of the mycelium by using Algorithm 1, resulting in a total of five phenotypic characteristic indices: radius, perimeter, area, growth speed, and change speed. We adopted the one-way ANOVA method, and the mean and standard deviation (SD) of the five indices for the four groups of mycelium are shown in Table 1. The results showed that there were significant statistical differences in the five indices among the four groups (all ). The pairwise comparison of each index showed that all five indices of X2-T related to the outline morphology are lower than those of the X2-N and X2-5 and X2-14.
Figure 5 shows the performance trends of the five indices on the phenotypic characteristics of the mycelial outline (radius, perimeter, area, growth rate, and change speed), which were basically consistent. The growth rate of the mycelium weakened from the activation stage to X2-5, but it accelerated from X2-5 to X2-14. However, for X2-T, there was a significant downward trend in all aspects.
3.2 Results of the mycelial texture
For the 400 existing samples, we accurately calculated the texture morphology of the mycelium by using Algorithm 2, resulting in five indices of phenotypic characteristics: coverage, roundness, groove depth, density, and density change. We took the one-way ANOVA method, and the mean and SD of the five indices of the four groups of mycelium are given in Table 2. The results showed that there were statistical differences in the five indices among the four groups (all ). Among them, the difference in the mycelial roundness data was the smallest (), and the differences among the other indices were more significant (). The pairwise comparison of each index showed that X2-T had the lowest mycelium coverage, while X2-14 had the worst performance in terms of groove depth, density, and density change.
The coverage indices given in Figure 6 were generally consistent. The roundness of the four groups of mycelia showed little difference. However, as the subculture times increase, the groove depth, mycelial density, and their rate of changes significantly decreased, even falling below X2-T. This phenomenon suggested that during the process, a faster growth rate in the subculture leads to sparser mycelium texture, darker coloration, and shallower grooves. On the contrary, X2-T exhibited the lowest coverage due to its extremely slow growth rate but maintained relatively completed roundness, and the mycelial texture was still white and dense with obvious grooves.
3.3 Results of enzyme activity
In this study, 30 samples were selected from X2-N, X2-5, X2-14, and X2-T. The anthrone colorimetric method was used to calculate the index of cellulase activity in the unit of mycelium mass using Formula 11. The comprehensive statistical results of these indexes through one-way ANOVA showed that there were statistical differences in cellulase activity among the four groups (). As shown in Figure 7A, during the process of subculture, the cellulase activity was subject to the characteristics of decreasing and then increasing, and the cellulase activity of the degraded mycelium was lower than that of X2-N. Furthermore, as shown in Figure 7B, the laccase activity was most active in the degraded mycelium.
Comparing Figures 5–7 shows that the cellulase activity trend of the mycelium was basically consistent with the analysis results of five indices related to its mycelium outline, as well as the analysis results of the two indices of mycelium coverage and roundness in its texture morphology. However, the laccase activity of the strain was different from the 10 indices in the outline and texture of the mycelium, and contrarily, the laccase activity of the degraded mycelium was particularly significant. Therefore, from the physiological perspective of the mycelium, the cellulase activity of this mycelium can be consistent with the phenotypic characteristic indices of the mycelium. Cellulase activity can be well used to verify the accuracy of digital image processing technology in the analysis of phenotypic characteristics.
4 Discussion
As a species of edible fungi with high yield and high economic value, the analysis of the phenotypic characteristics of P. geesteranus currently involves a lot of manual repeated operations, mainly including the average growth rate, color, texture, density, and edge uniformity, measured and calculated by a manual ruler or experience (Cardini et al., 2020). By applying digital image technology to the analysis of the mycelium, its phenotypic data can not only improve the accuracy of phenotypic characteristics obtained by manual measurement but also convert qualitative phenotypic characteristics into objective ones that can be qualitatively and quantitatively analyzed (Hardy et al., 2017). It has been shown that the use of digital image processing technology is regarded as an automated mean to extract and analyze the phenotypic characteristics of the mycelium, which has obvious advantages (Phoulady et al., 2016).
In order to better analyze the phenotypic characteristics of
P. geesteranus, digital image processing technology has made certain progress in the following aspects (
Alkhudaydi et al., 2019):
1) Image acquisition and preprocessing: High-quality image acquisition equipment and preprocessing techniques are used to obtain the enhanced images of the growth process of P. geesteranus.
2) Feature extraction: Relevant features related to the phenotype of P. geesteranus are extracted from the preprocessed images. These features can include shape, color, and texture (Yang et al., 2024).
3) Algorithm design and analysis: Utilizing algorithms and mathematical formulas to digitally calculate the phenotypic characteristics of P. geesteranus (Zhai et al., 2019).
4) Application and expansion: Combining technologies from other fields with digital image processing to achieve more efficient and accurate phenotypic analysis of P. geesteranus (Wei et al., 2021).
In our study, the statistical analysis results of the above phenotypic characteristics showed that during the subculture process of the mycelium, the growth rate of the mycelium showed a trend of slowing down at first and then accelerating, and the texture quality of the mycelium decreased with the acceleration of their growth rate. At the same time, the growth ability of the degraded mycelium was definitely the weakest. Therefore, in the early breeding stage of the mycelium, we could efficiently eliminate those degraded mycelia with slow production speed from the outline indices, and we also eliminated those mycelia with uneven texture and sparse density from the texture indices. Thus, among these two types of phenotypic characteristics, the mycelium with better growth, higher quality, and stronger vitality could be quickly identified for cultivating P. geesteranus.
In summary, there is still considerable room for development in the digital image processing research of P. geesteranus phenotypic analysis. In this paper, four groups of mycelia, X2-N, X2-5, X2-14, and X2-T, were formulated by using digital image processing technology from its outline and texture morphology. However, different edible fungus species had individual differences, and their phenotypic characteristics were also different in the macroscopic view. Therefore, in the field of research on the phenotypic characteristics of edible fungi, it is necessary to combine the characteristics of different mycelia to address proper algorithms and analysis schemes of phenotypic characteristics (Zhang et al., 2020).
5 Conclusion
This paper studied the phenotypic characteristics of the mycelium of P. geesteranus by using image recognition technology. We found that the mycelium was analyzed from the outline and texture shapes. In the outline shape, five indexes, namely, mycelium radius, perimeter, area, growth rate, and change speed, were calculated to obtain the results of quantitative analysis. In texture shape, five indices, namely, mycelial coverage, roundness, groove depth, density, and density change, were calculated to obtain the results of qualitative analysis. All indices of the degraded mycelium were significantly lower than those of the non-degraded mycelium, and the obtained analysis results showed large statistical differences (). Moreover, these analysis results were further verified by using cellulase activity. It could be observed that during the subculture process of the mycelium, the growth rate of the mycelium showed a trend of slowing down at first and then accelerating, and the texture quality of the mycelium decreased with the acceleration of its growth rate. At the same time, the growth ability of the degraded mycelium was definitely the weakest. Our results revealed a close relationship between phenotypic characteristics and mycelial quality, providing a rapid and accurate method for strain selection in the early breeding stage of P. geesteranus.
Statements
Data availability statement
The original contributions presented in the study are included in the article/Supplementary Material; further inquiries can be directed to the corresponding author.
Author contributions
XiW: data curation, formal analysis, methodology, and writing–original draft. YX: software and writing–review and editing. XuW: funding acquisition and writing–review and editing.
Funding
The author(s) declare financial support was received for the research, authorship, and/or publication of this article. This research was funded by the Outstanding Young Research Talents Program of Fujian Agriculture and Forestry University (xjq202116); the Fujian Province Science and Technology Plan Project (2021J01131024).
Acknowledgments
The authors thank Prof. Zhixiong Zhong (College of Computer and Control Engineering, Minjiang University) for his comments on the early drafts of this paper. The authors thank editors and reviewers for their constructive comments.
Conflict of interest
The authors declare that the research was conducted in the absence of any commercial or financial relationships that could be construed as a potential conflict of interest.
Publisher’s note
All claims expressed in this article are solely those of the authors and do not necessarily represent those of their affiliated organizations, or those of the publisher, the editors, and the reviewers. Any product that may be evaluated in this article, or claim that may be made by its manufacturer, is not guaranteed or endorsed by the publisher.
References
1
AlkhudaydiT.ReynoldsD.GriffithsS.ZhouJ.de la IglesiaB. (2019). An exploration of deep-learning based phenotypic analysis to detect spike regions in field conditions for UK bread wheat. Plant Phenomics2019, 7368761. 10.34133/2019/7368761
2
BaeE.BaiN.AroonnualA.BhuniaA. K.HirlemanE. D. (2011). Label‐free identification of bacterial microcolonies via elastic scattering. Biotechnol. Bioeng.108 (3), 637–644. 10.1002/bit.22980
3
BasakA. K.MirzaeiM.StrzałkaK.YamadaK. (2021). Texture feature extraction from microscope images enables a robust estimation of ER body phenotype in Arabidopsis. Plant Methods17, 109–116. 10.1186/s13007-021-00810-w
4
CardiniA.PellegrinoE.Del DottoreE.GamperH. A.MazzolaiB.ErcoliL. (2020). HyLength: a semi-automated digital image analysis tool for measuring the length of roots and fungal hyphae of dense mycelia. Mycorrhiza30 (2-3), 229–242. 10.1007/s00572-020-00956-w
5
ChenD.NeumannK.FriedelS.KilianB.ChenM.AltmannT.et al (2014). Dissecting the phenotypic components of crop plant growth and drought responses based on high-throughput image analysis. plant Cell.26 (12), 4636–4655. 10.1105/tpc.114.129601
6
ChenQ.SunQ.HengP. A.XiaD. S. (2008). A double-threshold image binarization method based on edge detector. Pattern Recognit.41 (4), 1254–1267. 10.1016/j.patcog.2007.09.007
7
DannerC.MachR. L.Mach-AignerA. R. (2023). The phenomenon of strain degeneration in biotechnologically relevant fungi. Appl. Microbiol. Biotechnol.107, 4745–4758. 10.1007/s00253-023-12615-z
8
FurbankR. T.TesterM. (2011). Phenomics–technologies to relieve the phenotyping bottleneck. Trends plant Sci.16 (12), 635–644. 10.1016/j.tplants.2011.09.005
9
GhoseT. K. (1987). Measurement of cellulase activities. Pure Appl. Chem.59 (2), 257–268. 10.1351/pac198759020257
10
GuoZ.YangW.ChangY.MaX.TuH.XiongF.et al (2018). Genome-wide association studies of image traits reveal genetic architecture of drought resistance in rice. Mol. Plant11 (6), 789–805. 10.1016/j.molp.2018.03.018
11
HardyN.MoreaudM.GuillaumeD.AugierF.NienowA.BéalC.et al (2017). Advanced digital image analysis method dedicated to the characterization of the morphology of filamentous fungus. J. Microsc.266 (2), 126–140. 10.1111/jmi.12523
12
HelgasonT.FitterA. H. (2009). Natural selection and the evolutionary ecology of the arbuscular mycorrhizal fungi (Phylum Glomeromycota). J. Exp. Bot.60 (9), 2465–2480. 10.1093/jxb/erp144
13
HuD.YuanT.YuH. L.MaC.TianM.LiL. (2022). Digital image processing assisted phenotypic analysis of Pleurotus giganteus colony. Acta Edulis Fungi29 (3), 32–40. 10.16488/j.cnki.1005-9873.2022.03.005
14
JamesJ. E.SanthanamJ.ZakariaL.Mamat RusliN.Abu BakarM.SuetrongS.et al (2022). Morphology, phenotype, and molecular identification of clinical and environmental Fusarium solani species complex isolates from Malaysia. J. Fungi8 (8), 845. 10.3390/jof8080845
15
KhanG. M. A.HasanM. S.RahamanM. H.AydidA.RahmanM. M.HasanuzzamanM.et al (2023) Cellulose and its composites in textiles and food industry. Regenerated Cellulose and composites: morphology-property relationship. Singapore: Springer Nature Singapore, 223–264.
16
LeC. N.MendesR.KruijtM.RaaijmakersJ. M. (2012). Genetic and phenotypic diversity of Sclerotium rolfsii in groundnut fields in central Vietnam. Plant Dis.96 (3), 389–397. 10.1094/pdis-06-11-0468
17
LehmannA.ZhengW.SoutschekK.RoyJ.YurkovA. M.RilligM. C. (2019). Tradeoffs in hyphal traits determine mycelium architecture in saprobic fungi. Sci. Rep.9 (1), 14152. 10.1038/s41598-019-50565-7
18
LiB.ChenL.SunW.WuD.WangM.YuY.et al (2020a). Phenomics‐based GWAS analysis reveals the genetic architecture for drought resistance in cotton. Plant Biotechnol. J.18 (12), 2533–2544. 10.1111/pbi.13431
19
LiH.FengH.GuoC.YangS.HuangW.XiongX.et al (2020b). High‐throughput phenotyping accelerates the dissection of the dynamic genetic architecture of plant growth and yield improvement in rapeseed. Plant Biotechnol. J.18 (11), 2345–2353. 10.1111/pbi.13396
20
LiuF.WangS. H.JiaD. H.TanH.WangB.ZhaoR. L. (2023). Development of multiple nucleotide polymorphism molecular markers for enoki mushroom (flammulina filiformis) cultivars identification. J. Fungi9 (3), 330. 10.3390/jof9030330
21
MahajanS.DasA.SardanaH. K. (2015). Image acquisition techniques for assessment of legume quality. Trends Food Sci. Technol.42 (2), 116–133. 10.1016/j.tifs.2015.01.001
22
MareiG. I. K.RasoulM. A. A.AbdelgaleilS. A. M. (2012). Comparative antifungal activities and biochemical effects of monoterpenes on plant pathogenic fungi. Pesticide Biochem. physiology103 (1), 56–61. 10.1016/j.pestbp.2012.03.004
23
MinerviniM.AbdelsameaM. M.TsaftarisS. A. (2014). Image-based plant phenotyping with incremental learning and active contours. Ecol. Inf.23, 35–48. 10.1016/j.ecoinf.2013.07.004
24
OmariM. K.LeeJ.FaqeerzadaM. A.JoshiR.ParkE.ChoB. K. (2020). Digital image-based plant phenotyping: a review. Korean J. Agric. Sci.47 (1), 119–130.
25
PérezG.Lopez-MoyaF.ChuinaE.Ibañez-VeaM.GardeE.López-LlorcaL. V.et al (2021). Strain degeneration in Pleurotus ostreatus: a genotype dependent oxidative stress process which triggers oxidative stress, cellular detoxifying and cell wall reshaping genes. J. Fungi7 (10), 862. 10.3390/jof7100862
26
PhouladyH. A.GoldgofD. B.HallL. O.MoutonP. R. (2016). Nucleus segmentation in histology images with hierarchical multilevel thresholding. Med. Imaging 2016 Digit. Pathol. SPIE9791, 280–285. 10.1117/12.2216632
27
SamyM. M.AlmamlookR. E.ElkhoulyH. I.BarakatS. (2022). Decision-making and optimal design of green energy system based on statistical methods and artificial neural network approaches. Sustain. Cities Soc.84, 104015. 10.1016/j.scs.2022.104015
28
ShakoorN.LeeS.MocklerT. C. (2017). High throughput phenotyping to accelerate crop breeding and monitoring of diseases in the field. Curr. Opin. plant Biol.38, 184–192. 10.1016/j.pbi.2017.05.006
29
SinghM.KamalS.SharmaV. P. (2021). Species and region-wise mushroom production in leading mushroom producing countries-China, Japan, USA, Canada and India. Mushroom Res.30 (2), 99–108. 10.36036/mr.30.2.2021.119394
30
UnderwoodJ.WendelA.SchofieldB.McMurrayL.KimberR. (2017). Efficient in‐field plant phenomics for row‐crops with an autonomous ground vehicle. J. Field Robotics34 (6), 1061–1083. 10.1002/rob.21728
31
WeiY.HeY.LiX. (2021). Tea moisture content detection with multispectral and depth images. Comput. Electron. Agric.183, 106082. 10.1016/j.compag.2021.106082
32
WeiX.LiuS.XieC.FangW.DengC.WenZ.et al (2023). Nondestructive detection of pleurotus geesteranus strain degradation based on micro-hyperspectral imaging and machine learning. Front. Plant Sci.14. 10.3389/fpls.2023.1260625
33
WilliamsK.MunkvoldJ.SorrellsM. (2013). Comparison of digital image analysis using elliptic Fourier descriptors and major dimensions to phenotype seed shape in hexaploid wheat (Triticum aestivum L.). Euphytica190, 99–116. 10.1007/s10681-012-0783-0
34
WoodT. M.BhatK. M. (1988). Methods for measuring cellulase activities. Methods Enzym.160, 87–112. 10.1016/0076-6879(88)60109-1
35
WuG.FangY.JiangQ.CuiM.LiN.OuY.et al (2023). Early identification of strawberry leaves disease utilizing hyperspectral imaging combing with spectral features, multiple vegetation indices and textural features. Comput. Electron. Agric.204, 107553. 10.1016/j.compag.2022.107553
36
XuanG.LiQ.ShaoY.ShiY. (2022). Early diagnosis and pathogenesis monitoring of wheat powdery mildew caused by blumeria graminis using hyperspectral imaging. Comput. Electron. Agric.197, 106921. 10.1016/j.compag.2022.106921
37
YangC.MaX.GuanH.FanB. (2022). Rapid detection method of Pleurotus eryngii mycelium based on near infrared spectral characteristics. Spectrochimica Acta Part A Mol. Biomol. Spectrosc.271, 120919. 10.1016/j.saa.2022.120919
38
YangN.QianY.el‐MeseryH. S.ZhangR.WangA.TangJ. (2019). Rapid detection of rice disease using microscopy image identification based on the synergistic judgment of texture and shape features and decision tree–confusion matrix method. J. Sci. Food Agric.99 (14), 6589–6600. 10.1002/jsfa.9943
39
YangT.ZhuS.ZhangW.ZhaoY.SongX.YangG.et al (2024). Unmanned aerial vehicle-scale weed segmentation method based on image analysis technology for enhanced accuracy of maize seedling counting. Agriculture14 (2), 175. 10.3390/agriculture14020175
40
YinH.YiW.HuD. (2022). Computer vision and machine learning applied in the mushroom industry: a critical review. Comput. Electron. Agric.198, 107015. 10.1016/j.compag.2022.107015
41
YooS.LeeH. Y.MarkkandanK.MoonS.AhnY. J.JiS.et al (2019). Comparative transcriptome analysis identified candidate genes involved in mycelium browning in Lentinula edodes. BMC genomics20, 1–13. 10.1186/s12864-019-5509-4
42
ZhaiZ.JinZ.ZhangR. (2019). Information integration of force sensing and machine vision for in‐shell shrivelled walnut detection based on the golden‐section search optimal discrimination threshold. J. Sci. Food Agric.99 (8), 3941–3949. 10.1002/jsfa.9618
43
ZhangH.ZhanB.PanF.LuoW. (2020). Determination of soluble solids content in oranges using visible and near infrared full transmittance hyperspectral imaging with comparative analysis of models. Postharvest Biol. Technol.163, 111148. 10.1016/j.postharvbio.2020.111148
44
ZhangJ.LiX.YingY.YaoX. (2019). Effects of the camellia oleifera shell substrate on the yield and nutritional composition of Pleurotus geesteranus. Agric. Sci.10 (10), 1298–1311. 10.4236/as.2019.1010096
45
ZhaoC.ZhangY.DuJ.GuoX.WenW.GuS.et al (2019). Crop phenomics: current status and perspectives. Front. Plant Sci.10, 714. 10.3389/fpls.2019.00714
Summary
Keywords
image recognition, mycelial quality, outline, phenotypic characteristics, Pleurotus geesteranus, texture feature
Citation
Wang X, Xu Y and Wei X (2024) Phenotypic characteristics of the mycelium of Pleurotus geesteranus using image recognition technology. Front. Bioeng. Biotechnol. 12:1338276. doi: 10.3389/fbioe.2024.1338276
Received
14 November 2023
Accepted
14 May 2024
Published
17 June 2024
Volume
12 - 2024
Edited by
Zhixiong Zhong, Minjiang University, China
Reviewed by
Maura Téllez Téllez, Autonomous University of the State of Morelos, Mexico
Miha Humar, University of Ljubljana, Slovenia
Baby Summuna, Sher-e-Kashmir University of Agricultural Sciences and Technology, India
Updates
Copyright
© 2024 Wang, Xu and Wei.
This is an open-access article distributed under the terms of the Creative Commons Attribution License (CC BY). The use, distribution or reproduction in other forums is permitted, provided the original author(s) and the copyright owner(s) are credited and that the original publication in this journal is cited, in accordance with accepted academic practice. No use, distribution or reproduction is permitted which does not comply with these terms.
*Correspondence: Xuan Wei, xuanwei@fafu.edu.cn
Disclaimer
All claims expressed in this article are solely those of the authors and do not necessarily represent those of their affiliated organizations, or those of the publisher, the editors and the reviewers. Any product that may be evaluated in this article or claim that may be made by its manufacturer is not guaranteed or endorsed by the publisher.