 Zhibo Jing
 Jianda Han1,2,3,4
 Juanjuan Zhang
- 1Tianjin Key Laboratory of Intelligent Robotics, Nankai University, Tianjin, China
- 2Institute of Robotics and Automatic Information System, Nankai University, Tianjin, China
- 3College of Artificial Intelligence, Nankai University, Tianjin, China
- 4Smart Sensing Interdisciplinary Science Center, Nankai University, Tianjin, China
Introduction: Musculoskeletal model-based simulations have gained popularity as a tool for analyzing human movement biomechanics. However, when examining the same gait, different models with varying anatomical data and assumptions may produce inconsistent biomechanical results. This inconsistency is particularly relevant for children with cerebral palsy, who often exhibit multiple pathological gait patterns that can impact model outputs.
Methods: The aim of this study was to investigate the effect of selecting musculoskeletal models on the biomechanical analysis results in children with cerebral palsy. Gait data were collected from multiple participants at slow, medium, and fast velocities. Joint kinematics, joint dynamics, and muscle activation were calculated using six popular musculoskeletal models within a biomechanical simulation environment.
Results: The degree of inconsistency, measured as the root-mean-square deviation, in kinematic and kinetic results produced by the different models ranged from 4% to 40% joint motion range and 0%–28% joint moment range, respectively. The correlation between the results of the different models (both kinematic and kinetic) was good (R
Discussion: These results provide insights into the consistency of model results, factors influencing consistency, characteristics of each model’s outputs, mechanisms underlying these characteristics, and feasible applications for each model. By elucidating the impact of model selection on biomechanical analysis outcomes, this study advances the field’s understanding of musculoskeletal modeling and its implications for clinical gait analysis model decision-making in children with cerebral palsy.
1 Introduction
Biomechanical analysis plays an important role in forecasting the impact of musculoskeletal injury on gait, developing rehabilitation devices for patients with pathological gaits, and understanding the biomechanics of human movement. Musculoskeletal models are widely used in motion biomechanical analysis (Shippen and May 2010; Wagner et al., 2010; Steele et al., 2012; Amiri and Bull, 2022), particularly in estimating quantities that are challenging to be measured noninvasively (e.g., muscle force (Li et al., 2022; Luis et al., 2022), joint contact force (Hosseini Nasab et al., 2022), joint torque (Heinrich et al., 2022)) and predicting the influence of external forces (e.g., exoskeleton assistance) or gait conditions (e.g., rough terrain) on human motion.
Musculoskeletal models of specific joints, segments, and the whole body have been built by researchers. In general, such models are comprised of bones with three-dimensional (3D) geometries, joints with kinematics definitions, and muscles with force generation characteristics. The parameters of muscle tendon units were usually determined based on autopsy data and nuclear magnetic resonance imaging data. The models of lower limb joints (Wickiewicz et al., 1984; Yamaguchi and Zajac, 1989; Friederich and Brand, 1990) are widely used in musculoskeletal models which were developed and deployed in biomechanical simulation environments such as OpenSim (Delp et al., 2007) and ANYBODY (Damsgaard et al., 2006). Researchers can access source codes of the models and extend the work of other people easily. Users can use the models for biomechanical analysis without the ability to develop them.
Biomechanical analysis of children with cerebral palsy (CP) has been widely conducted with musculoskeletal models. CP patients often suffer from pathological gaits such as equinus, crouch, and excessive hip flexion (Wren et al., 2005). Researchers used models to study the causes and effects of pathological gaits: changes in muscle force and tibiofemoral contact force with increased knee flexion (Steele et al., 2012), effects of crouch gait on hip-knee muscle extension during single-limb stance (Hicks et al., 2008), and contributions of muscles to centroid acceleration and joint angular acceleration in the squat gait (Steele et al., 2010). These studies scaled the generic musculoskeletal models developed from adult cadaver data using the children measure. This procedure ignored the patient-specific geometry and parameters of muscles and bones. In order to generate a more personalized model, researchers tried to generate a musculoskeletal model from medical images (Kainz et al., 2021). Due to the lack of resources (i.e., hardware conditions, maturity of methods, and tolerance of children) in clinic, it is difficult to collect necessary data and generate completely subject-specific models. Therefore, it is a common practice in clinic to use the scaled general musculoskeletal model.
The same analyses performed with different models or software are expected to produce consistent results. However, several studies (Sandholm et al., 2011; Wagner et al., 2013; Trinler et al., 2019; Weinhandl and Bennett, 2019) showed differences in joint angles, joint torques, muscle forces, muscle moment levers, and tibial contact forces produced by different models and primarily discussed causes of the differences. While there were some issues to be considered: comparisons of too few models, no collection of participants’ data, and few studies of patients with abnormal gaits. Some important fundamental issues, such as the effect of walking speed on the consistency of model output, the characteristics and mechanisms of each model output, and which model has the highest correlation between simulated muscle activation and measured surface EMG of children with cerebral palsy, are not yet fully understood.
The aim of this study was to investigate the effects of model choices on the outputs of biomechanical analysis, consistency between the outputs of different models, and factors affecting the consistency in children with cerebral palsy. We collected patient data and used a biomechanical analysis method based on musculoskeletal models to calculate joint kinematics, kinetics, and muscle activation in a simulation environment. We defined and calculated the degree of inconsistency between the model outputs and analysed factors affecting the consistency. We tried to relate the differences in results to the underlying modelling and computational assumptions. We hope to help physicians or researchers understand the characteristics of musculoskeletal model results and select the appropriate model for their own research.
2 Methods
2.1 Musculoskeletal models
This study included six generic three-dimensional full-body musculoskeletal models (Gait2354 (Delp et al., 1990), Gait2392 (Delp et al., 1990), Lai’s model (Lai et al., 2017), Falisse’s model (Falisse et al., 2019), Rajagopal2015 model (Rajagopal et al., 2016), RUN model (Hamner et al., 2010), see Table 1) in OpenSim. Although Gait2392 and Gait2354 did not have upper limbs, they can still be used as full-body models when focusing on lower limb movements. The two models adopted the lower extremity joint of Delp et al. (1990), the low back joints and anthropometry of Anderson and Pandy (1999), and the planar knee model of Yamaguchi and Zajac (1989). Falisse’s model and RUN Model were modifications and extensions of the Gait 2392 model. Rajagopal2015 model and Lai’s model were derived from the lower body model published by Arnold et al. (2010). Since Arnold’s model only had lower limbs, it was not included in this study.
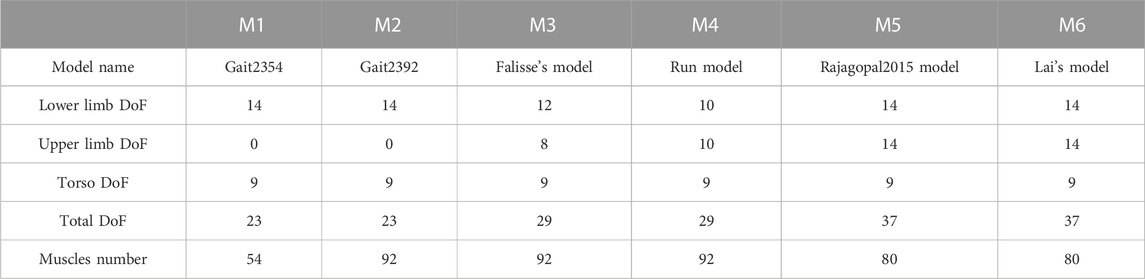
TABLE 1. Numbers of DOFs and muscles of the models.
These models had different numbers of degrees of freedom (DoFs, see Table 2). Both Gait2392 and Gait2354 had 23 DoFs. They had 6 DoFs between the pelvis and the ground. The lumbar, hip, knee, ankle and subtalar joints had 3, 3, 1, 2 and 1 DoFs respectively. Compared to Gait2392 and Gait2354, Falisse’s model added bilateral arms with 4 DoFs per arm and removed the metatarsal joint, so it had 29 degrees of freedom in total. Although the number of RUN model was also 29, each arm had 5 DoFs, and it did not have subtalar and metatarsal joints. Both Rajagopal2015 model and Lai’s model had 37 DoFs, and each had 7 DoFs for each upper arm and lower limb.
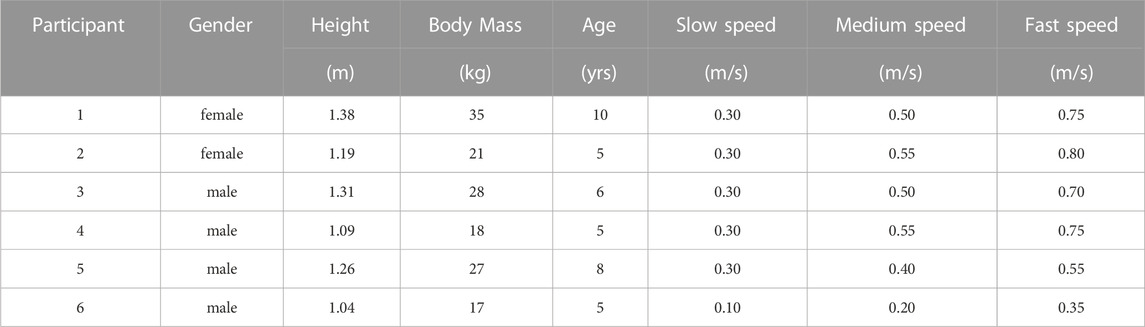
TABLE 2. Participants’ information.
Gait2354 reduced 92 muscles in Gait2392 to 54 muscles. Gait2354 increased the maximum isometric force of each muscle and modified other muscle and tendon parameters accordingly to compensate for the lack of strength caused by the reduction in the number of muscles. The muscle numbers, muscle-tendon parameters, and muscle geometry of Falisse’s model and RUN model were the same as those in Gait2392. Rajagopal2015 had 80 muscle-tendon units, and the muscle force distribution was updated based on a young, healthy population. Based on Rajagopal 2015, Lai et al. updated the knee joint muscle path and some muscle force parameters.
2.2 Experimental setup
Six children with cerebral palsy were recruited (age 6.50 ± 2.07 years; weight 24.33 ± 6.92 kg; height 1.21 ± 0.13 m; and mean ± S.D., see Table 2) for walking experiments in Human Robot Interactive Gait Lab of Nankai University. The study was approved by the Ethics Committee of Nankai University. All participants were provided with written informed consent before completing the protocol.
Four sEMG modules (Bagnoli, Delsys, MA, United States) were placed on the medial gastrocnemius (m.GAS) and the rectus femoris (RF) of participants’ bilateral legs respectively to record the sEMG signals during locomotion at a frequency of 500 Hz (see Figure 1). Raw sEMG signals were high-pass filtered with a second-order Butterworth filter (cutoff frequency 20 Hz), full-wave rectified, and low-pass filtered with a second-order Butterworth filter (cutoff frequency 10 Hz). Twenty nine optical reflective markers were placed on the anatomical landmarks and functional joint centers of participants. A motion capture system (Oqus 700+, Qualisys, Gothenburg, Sweden) with nine camera lenses was used to record trajectories of markers at a sampling rate of 100 Hz. We used Qualisys Track Manager to fill and smooth the marker trajectories. Ground reaction forces (including Fx, Fy, Fz, Mx, My, and Mz) were measured at a sampling rate of 500 Hz by a force-plate instrumented treadmill (FIT, Bertec Corporation, OH, United States). Raw forces and torque were low-pass filtered with a second-order Butterworth filter (cutoff frequency 12 Hz).
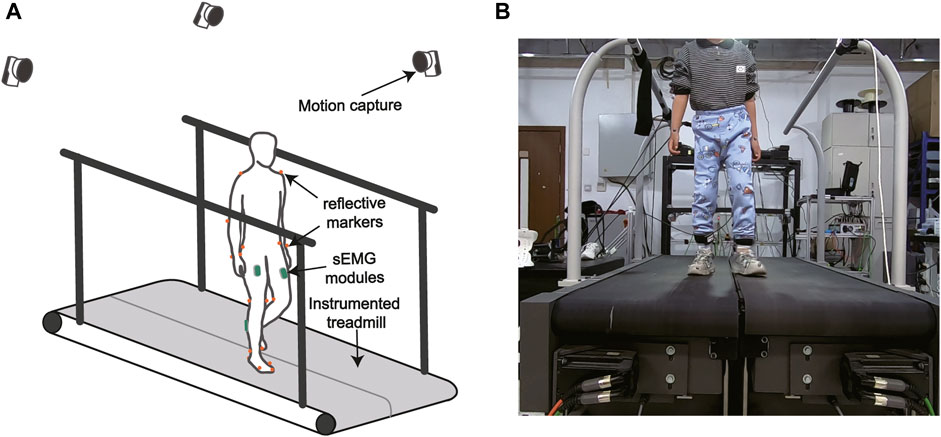
FIGURE 1. (A) The gait analysis hardware system. (B) The experimental setup. Muscle surface EMG was recorded by wireless EMG modules. Ground reaction forces were measured by a force-plate instrumented treadmill. A motion capture system recorded reflective marker trajectories.
In the experiments, the subjects first wore sensors and held the still standing posture which was the default pose of the musculoskeletal models we set for at least 10 s. The motion capture system recorded the positions of markers in the static pose for scaling of the generic musculoskeletal models. The treadmill velocity then increased from 0.3 m/s to the maximum velocity that the patient could bear, in increments of 0.05 m/s. Subjects walked at each walking velocity for at least 30 s. The data of the first stable step in each velocity for each subject was used for subsequent analysis.
2.3 Biomechanical analysis
We performed model-based biomechanical analysis in Matlab R2021b by calling the API of Opensim 4.1, including scaling with the scale tool, inverse kinematics with the IK tool, inverse dynamics with the residual reduction algorithm (RRA) tool, and simulated muscle activation with the computed muscle control (CMC) tool (Thelen and Anderson, 2006). Each segment of the models was first scaled to match the subject’s anthropometric measurements. The scale factors were ratios of the distances of marker pairs in the static experiments to the corresponding virtual distances in the model. Body mass and muscle parameters related to length were also scaled according to these ratios. Joint coordinate values corresponding to the static pose were computed. Marker positions were adjusted at the same time to match experimental marker locations. For each scaled model, the IK tool was used to solve for the joint angles to minimize the differences between the experimentally measured marker positions and the virtual positions. The RRA tool computed joint dynamics from kinematics and measured ground reaction forces and reduced the magnitude of the residual force by slightly adjusting joint kinematics and model mass properties. Joint torque was normalized to body weight and was presented in unit of N ⋅ m/kg−1. The CMC tool was used to generate a set of muscle activations, resulting in a coordinated muscle-actuated simulation of the subject’s movements. In order to study the effect of different models on the results, all procedures and parameter settings were the same on all models.
2.4 Data analysis
To quantify the consistency between the biomechanical results yielded by different models, we averaged the joint angle waveforms yielded by six models for each participant at each velocity trial, and calculated the root-mean-square deviation (RMSD) between the joint angle waveform yielded by each model and the averaged waveform. Then we normalized the RMSD to the ranges of joint angles. The RMSD and the normalized RMSD of the joint torque were calculated using the same method.
We calculated the average and range of joint angles (represented as
We performed correlation analyses on results of the same biomechanics yield by different models. The correlation coefficients between the ankle angle of each participant yielded by each model at each velocity trial and the ankle angle of that participant yielded by the other models at that velocity trial. We calculated these correlation coefficients in the kinematic and kinetic results of all joints. The correlation coefficients between the muscle activation yielded models and the measured sEMG values in the medial gastrocnemius and the rectus femoris for all participants at each velocity trial. All statistical analyses were conducted with MATLAB R2021b (MathWorks, Natick, MA, United States).
3 Results
The RMSDs and the normalized RMSDs for kinematic results ranged from 4% to 40% and from 1.5° to 7.3° respectively (shown in Tables 3, 4), and the RMSDs and the normalized RMSDs for dynamic results ranged from 0% to 28% and from 1.2 × 10⁻²N ⋅ m/kg to 19.8 × 10⁻²N ⋅ m/kg respectively (shown in Tables 5, 6). For ankle kinematics, the normalized RMSDs were the biggest during the slow walking trials, and those were the smallest during the fast walking trials. A similar pattern was observed for knee and hip kinematics. However, the RMSDs of kinematics were similar during different velocity walking trials. The normalized RMSDs of dynamics were smaller than those of kinematics as a whole. No obvious change trend was observed for the normalized RMSDs of dynamics during different velocity walking trials.
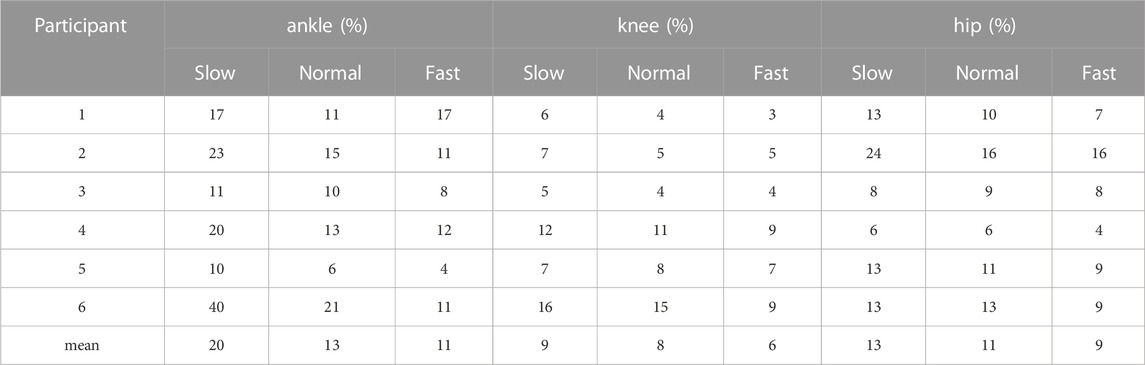
TABLE 3. Normalized RMSD of kinematics of participants on all joints.
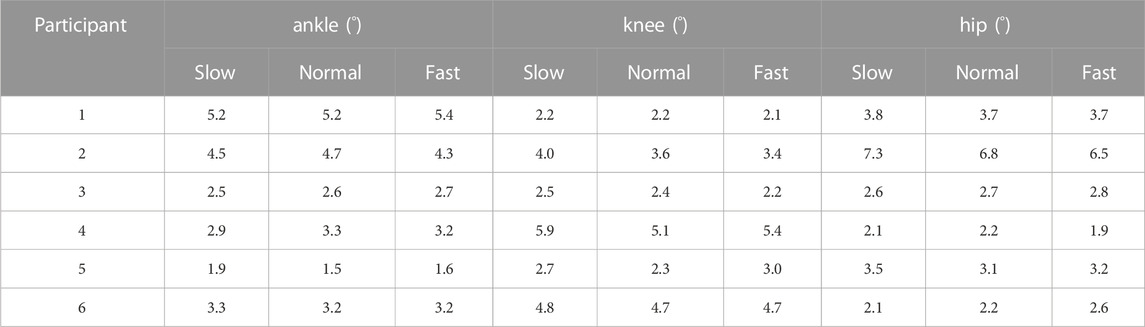
TABLE 4. The RMSD of kinematics of participants on all joints.
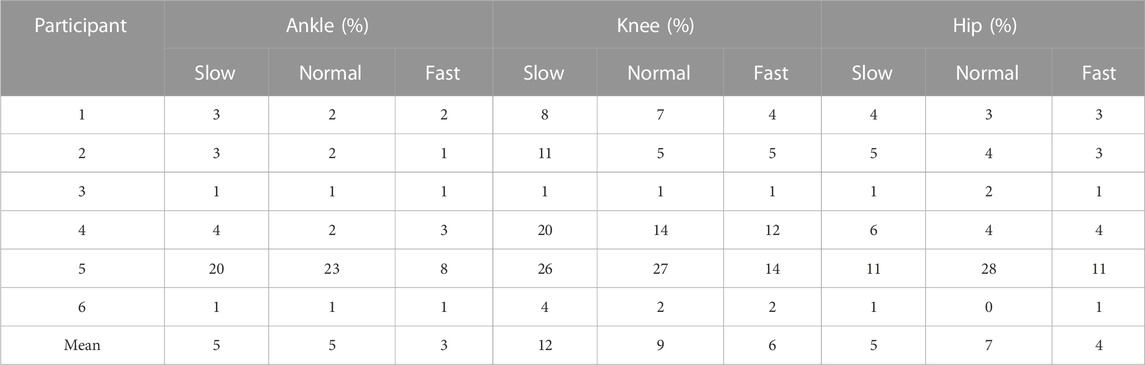
TABLE 5. The normalized RMSD of dynamics of participants on all joints.
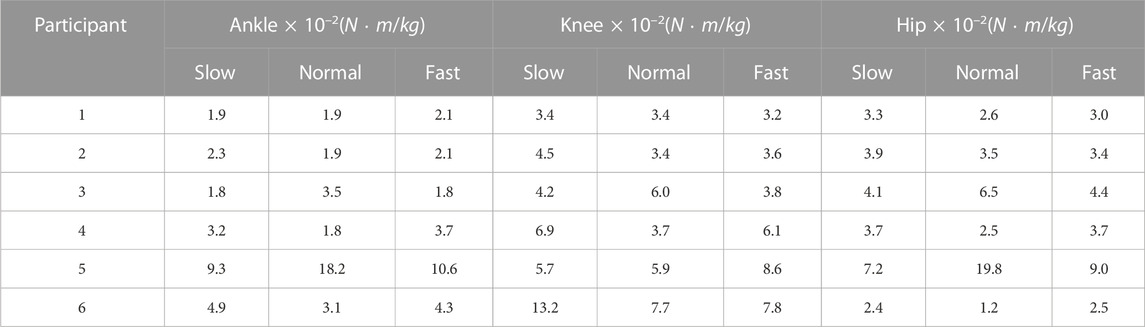
TABLE 6. The RMSD of dynamics of participants on all joints.
The means and the ranges (
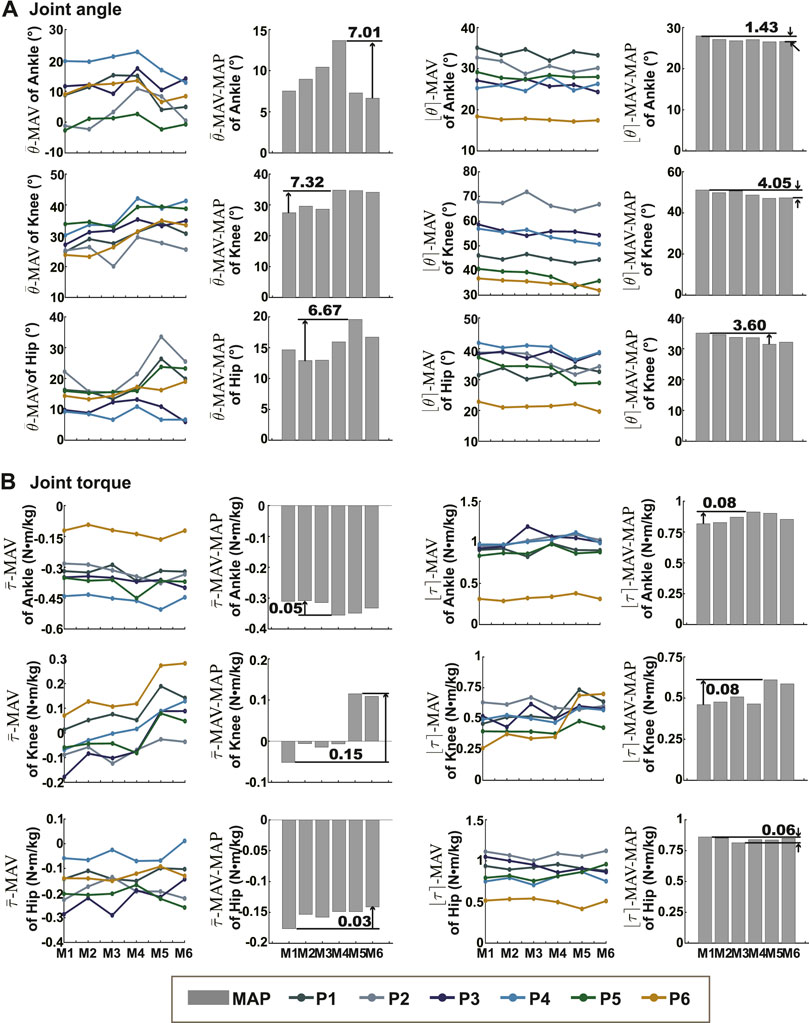
FIGURE 2. The means and ranges of joint kinematics and dynamics. (A) Showed the
Correlation coefficients between outputs (dynamics and kinematics) yielded by different models on all joints were all greater than 0.85 (P
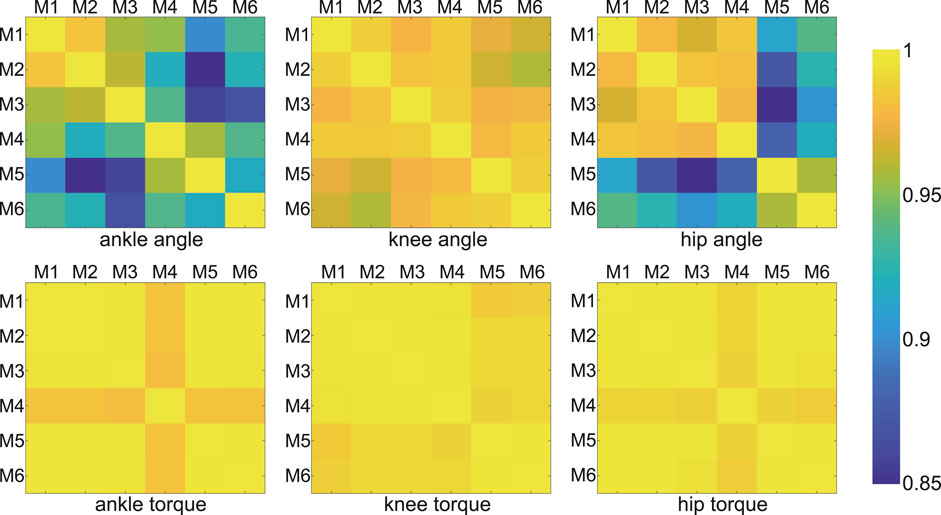
FIGURE 3. Correlation coefficients of joint angles and moments between any two models (among all models). Each color block showed the coefficient corresponding to the two model results. The coefficients were all greater than 0.85 (P
Except for model M3 and model M5, measured RF sEMG and muscle activity computed by the models showed positive correlations, and the correlation coefficients of them were less than 0.6 (P
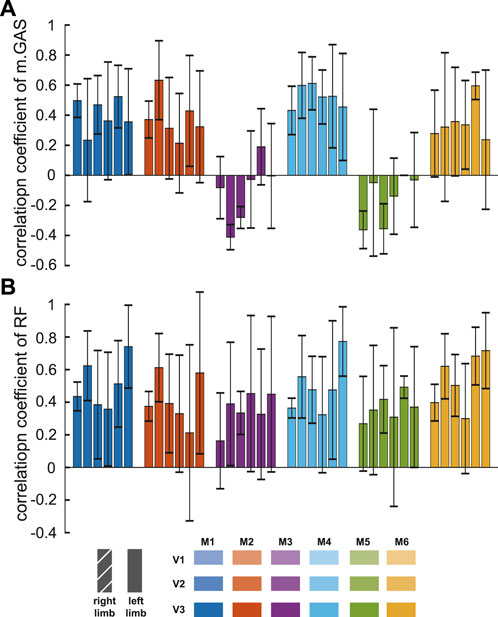
FIGURE 4. Correlation coefficients between simulated muscle activation yielded by the models and measured sEMG of muscles [medial gastrocnemius, (A), rectus femoris, (B)]. The six colors represented outputs of different models at three velocities. Each bar showed the mean and one standard deviation of the six participants.
4 Discussion
The purpose of this study was to investigate differences between the biomechanical results yielded by six popular models during different velocity walking trials. To achieve it, various kinds of data were collected from six children with cerebral palsy while walking on a treadmill, and biomechanical analyses were performed on each participant using all six models. Differences in joint kinematics, dynamics, and muscle activations were observed in the results with different models.
Consistency and accuracy in results across models are the ultimate goals in biomechanical analysis. They are generally explored in comparative studies of musculoskeletal models. Although consistent outputs are unnecessarily accurate, inconsistent outputs of at least some, maybe not all, models are inaccurate. Due to the unavailability of the actual value, we discussed the difference between models (consistency) but not the difference between outputs and actual values (accuracy). In this paper, the RMSD and the normalized RMSD were calculated to represent the consistency in results across models.
Our reported results of the RMSD (kinematics: 1.5°–7.3° and kinetics: 1.2 × 10⁻²N ⋅ m/kg-19.8 × 10−2N ⋅ m/kg) were similar to the results of Kainz et al. (kinematics: below 5° and kinetics: 0.15 N ⋅ m/kg) (Kainz et al., 2021), which were between generic-scaled and MRI-based models, and the results of Flux et al. (kinematics: 3°–8°) (Flux et al., 2020), which were between the Human Body Model and conventional gait models. For joint kinematics, the normalized RMSD decreased with increasing velocity, indicating that the kinematic results of the different models were relatively more consistent at high walking speeds. This was because the RMSDs were almost constant with speed, while joint range of motion increased significantly with speed.
The possible reason for the wide variation in the RMSDs across patients was the variation in gait between patients. There was a wide distribution of age, weight, height, cerebral palsy subtype, and degree of pathological gait among the patients participating in this study, so there were large differences in gait between patients. Gait characteristics have an impact on the consistency of the results, for example, Wagner et al. (2013) found better agreement of moment arms and tibiofemoral joint contact forces occurring at low knee flexion angles. We also observed a similar effect of gait on consistency: participant P5 had the smallest ankle angle of anyone during the walking trials, and his consistency of ankle moment results was the worst of anyone.
The magnitude of the differences between the model results varied across joints. One study (Falisse et al., 2018) compared the outputs of the Gait2392 and Human Body Models and showed that the largest differences in kinematics and kinetics occurred at the hip joint. While, our results showed that the largest normalized RMSD between model outputs for kinematics was in the ankle joint and the largest normalized RMSD between kinetics was in the knee joint. The largest differences in the mean and range values of the kinematic and kinetic results output by the different models were in the knee joint. The reason for the different conclusions may be that the two studies calculated the differences differently and the models compared were different.
The output values produced by the different models (e.g., ankle joint angle) showed the same order in multiple subjects. Although it was not known which was closer to the true value, it helped us understand whether each model’s output was skewed larger or smaller across the six models. The differences in definitions and parameters of the models were partly responsible for difference of the outputs. The planar knee model specified the transformation between the femur, tibia, and patella reference frames as a function of knee angle. The functions were based on Yamaguchi et al. (Yamaguchi and Zajac, 1989) (Gait2354, Gait2392, and Falisse’s model), Seth et al. (2010) (Run model), and Walker et al. (1988) (Rajagopal2015 model and Lai’s model). The larger
The difference of the model outputs was also affected by marker placement errors and the model scaling algorithm. Although we took carefully to place both virtual model markers and actual markers on participants at the same anatomical locations, kinematics had been shown to be highly sensitive to model marker locations (Lund et al., 2015). The locations of the markers at the knee joint axis more anterior resulted in a smaller knee flexion angle. There was an error in the placement of the markers on the pelvis on the body, resulting in the need to rotate the pelvic pitch angle to make the spatial position better match. The six models discussed in this article were developed to represent adults of varying heights so that the parameters of their bone geometries were not the same. The sizes of scaled models were not exactly the same, despite the scale algorithm’s best efforts to scale them.
In all studies involving muscle actuation simulations, including this one (Figure 4), obtaining simulated activations that exactly match the muscle’s measured sEMG remains an important challenge. Model M5 derived its muscle strength parameters from MRI data collected from healthy young people (Handsfield et al., 2014) rather than aged cadavers. However, the correlation coefficients of gastrocnemius muscle were one of the lowest among the different models. M6, among all models, produced the highest correlation coefficients between simulated muscle activation and measured rectus femoris sEMG. Its correlation coefficient standard deviations were the smallest, indicating that it had better performance in each subject. It modified muscle geometry and parameters, reducing the passive force of the hip and knee extensors. This improvement reduced the co-activation of antagonist muscles.
The results showed differences in kinematics, kinetics and muscle activation between the outputs yielded by the different models. Accurate modelling of muscles, bones and joints is important for consistency in joint kinematics, joint dynamics and muscle force estimation across different models (Mohout et al., 2023). In order to improve the accuracy of modelling, researchers measured precise joint anatomy using magnetic resonance imaging (MRI) (Valente et al., 2014) and calibrated muscle parameters by functional experiments (Garner and Pandy, 2003; Lund et al., 2015; Wu et al., 2016). In addition to model customization, there is potential for improvement in biomechanical analysis algorithms of locomotion. For the scale algorithm in Opensim, errors of the markers will cause joint kinematics to shift. These improvements may lead to more consistent results between generic musculoskeletal models.
In conclusion, this study provides valuable insights into the differences in biomechanical results obtained from different models. It highlights the importance of accurate modeling of muscles, bones, and joints for achieving consistency in joint kinematics, dynamics, and muscle force estimation. Further research can focus on exploring and addressing the variations between models and improving the algorithms used in biomechanical analysis of locomotion.
5 Conclusion
In our study, we conducted a comprehensive comparison of joint kinematics, kinetics, and simulated muscle activation results obtained from six commonly used models. The consistency of the kinematic results was similar across speed experiments, and the consistency of the kinematic results normalized by joint range decreased with increasing speed. The output values of the model showed the same characteristics in multiple subjects. Correlations between kinetic results from different models were stronger than those between kinematic results, and correlation coefficients for both kinetics and kinematics were greater than 0.85. The muscle activation yielded by RUN model and the activation yielded by Lai’s model were the most correlated with the sEMG signals of m. GAS and RF, respectively. We analysed the effects of model definition and parameter differences, the model scaling algorithm, and marker errors on the results. By quantifying the differences between the output results of different models, our research provides valuable insights for researchers in selecting the most appropriate model for their studies. Moreover, we believe that future research should focus on improving musculoskeletal models, developing methods for personalizing models, and advancing biomechanical analysis algorithms. These advancements will contribute to enhancing the accuracy and consistency of the results in this field.
Data availability statement
The raw data supporting the conclusion of this article will be made available by the authors, without undue reservation.
Ethics statement
The studies involving humans were approved by the Ethics Committee of Nankai University. The studies were conducted in accordance with the local legislation and institutional requirements. Written informed consent for participation in this study was provided by the participants’ legal guardians/next of kin.
Author contributions
ZJ, JH, and JZ designed the study. ZJ performed data collection, processing, and analysis. ZJ, JH, and JZ interpreted results of the study. ZJ drafted the manuscript. All authors contributed to the article and approved the submitted version.
Funding
This work was supported by the National Natural Science Foundation of China under Grant 62073179.
Conflict of interest
The authors declare that the research was conducted in the absence of any commercial or financial relationships that could be construed as a potential conflict of interest.
Publisher’s note
All claims expressed in this article are solely those of the authors and do not necessarily represent those of their affiliated organizations, or those of the publisher, the editors and the reviewers. Any product that may be evaluated in this article, or claim that may be made by its manufacturer, is not guaranteed or endorsed by the publisher.
References
Amiri, P., and Bull, A. M. (2022). Prediction of in vivo hip contact forces during common activities of daily living using a segment-based musculoskeletal model. Front. Bioeng. Biotechnol. 10, 995279. doi:10.3389/fbioe.2022.995279
Anderson, F. C., and Pandy, M. G. (1999). A dynamic optimization solution for vertical jumping in three dimensions. Comput. methods biomechanics Biomed. Eng. 2, 201–231. doi:10.1080/10255849908907988
Arnold, E. M., Ward, S. R., Lieber, R. L., and Delp, S. L. (2010). A model of the lower limb for analysis of human movement. Ann. Biomed. Eng. 38, 269–279. doi:10.1007/s10439-009-9852-5
Damsgaard, M., Rasmussen, J., Christensen, S. T., Surma, E., and De Zee, M. (2006). Analysis of musculoskeletal systems in the anybody modeling system. Simul. Model. Pract. Theory 14, 1100–1111. doi:10.1016/j.simpat.2006.09.001
Delp, S. L., Anderson, F. C., Arnold, A. S., Loan, P., Habib, A., John, C. T., et al. (2007). Opensim: open-source software to create and analyze dynamic simulations of movement. IEEE Trans. Biomed. Eng. 54, 1940–1950. doi:10.1109/tbme.2007.901024
Delp, S. L., Loan, J. P., Hoy, M. G., Zajac, F. E., Topp, E. L., and Rosen, J. M. (1990). An interactive graphics-based model of the lower extremity to study orthopaedic surgical procedures. IEEE Trans. Biomed. Eng. 37, 757–767. doi:10.1109/10.102791
Falisse, A., Serrancolí, G., Dembia, C. L., Gillis, J., Jonkers, I., and De Groote, F. (2019). Rapid predictive simulations with complex musculoskeletal models suggest that diverse healthy and pathological human gaits can emerge from similar control strategies. J. R. Soc. Interface 16, 20190402. doi:10.1098/rsif.2019.0402
Falisse, A., Van Rossom, S., Gijsbers, J., Steenbrink, F., van Basten, B. J., Jonkers, I., et al. (2018). Opensim versus human body model: A comparison study for the lower limbs during gait. J. Appl. biomechanics 34, 496–502. doi:10.1123/jab.2017-0156
Flux, E., Van der Krogt, M., Cappa, P., Petrarca, M., Desloovere, K., and Harlaar, J. (2020). The human body model versus conventional gait models for kinematic gait analysis in children with cerebral palsy. Hum. Mov. Sci. 70, 102585. doi:10.1016/j.humov.2020.102585
Friederich, J. A., and Brand, R. A. (1990). Muscle fiber architecture in the human lower limb. J. biomechanics 23, 91–95. doi:10.1016/0021-9290(90)90373-b
Garner, B. A., and Pandy, M. G. (2003). Estimation of musculotendon properties in the human upper limb. Ann. Biomed. Eng. 31, 207–220. doi:10.1114/1.1540105
Hamner, S. R., Seth, A., and Delp, S. L. (2010). Muscle contributions to propulsion and support during running. J. biomechanics 43, 2709–2716. doi:10.1016/j.jbiomech.2010.06.025
Handsfield, G. G., Meyer, C. H., Hart, J. M., Abel, M. F., and Blemker, S. S. (2014). Relationships of 35 lower limb muscles to height and body mass quantified using mri. J. biomechanics 47, 631–638. doi:10.1016/j.jbiomech.2013.12.002
Heinrich, D., Van den Bogert, A. J., and Nachbauer, W. (2022). Estimation of joint moments during turning maneuvers in alpine skiing using a three dimensional musculoskeletal skier model and a forward dynamics optimization framework. Front. Bioeng. Biotechnol. 10, 894568. doi:10.3389/fbioe.2022.894568
Hicks, J. L., Schwartz, M. H., Arnold, A. S., and Delp, S. L. (2008). Crouched postures reduce the capacity of muscles to extend the hip and knee during the single-limb stance phase of gait. J. biomechanics 41, 960–967. doi:10.1016/j.jbiomech.2008.01.002
Hosseini Nasab, S. H., Smith, C. R., Maas, A., Vollenweider, A., Dymke, J., Schütz, P., et al. (2022). Uncertainty in muscle–tendon parameters can greatly influence the accuracy of knee contact force estimates of musculoskeletal models. Front. Bioeng. Biotechnol. 10, 808027. doi:10.3389/fbioe.2022.808027
Kainz, H., Wesseling, M., and Jonkers, I. (2021). Generic scaled versus subject-specific models for the calculation of musculoskeletal loading in cerebral palsy gait: effect of personalized musculoskeletal geometry outweighs the effect of personalized neural control. Clin. Biomech. 87, 105402. doi:10.1016/j.clinbiomech.2021.105402
Lai, A. K., Arnold, A. S., and Wakeling, J. M. (2017). Why are antagonist muscles co-activated in my simulation? A musculoskeletal model for analysing human locomotor tasks. Ann. Biomed. Eng. 45, 2762–2774. doi:10.1007/s10439-017-1920-7
Li, G., Ao, D., Vega, M. M., Shourijeh, M. S., Zandiyeh, P., Chang, S.-H., et al. (2022). A computational method for estimating trunk muscle activations during gait using lower extremity muscle synergies. Front. Bioeng. Biotechnol. 10, 964359. doi:10.3389/fbioe.2022.964359
Luis, I., Afschrift, M., De Groote, F., and Gutierrez-Farewik, E. M. (2022). Evaluation of musculoskeletal models, scaling methods, and performance criteria for estimating muscle excitations and fiber lengths across walking speeds. Front. Bioeng. Biotechnol. 10, 1002731. doi:10.3389/fbioe.2022.1002731
Lund, M. E., Andersen, M. S., de Zee, M., and Rasmussen, J. (2015). Scaling of musculoskeletal models from static and dynamic trials. Int. Biomech. 2, 1–11. doi:10.1080/23335432.2014.993706
Mohout, I., Elahi, S. A., Esrafilian, A., Killen, B. A., Korhonen, R. K., Verschueren, S., et al. (2023). Signatures of disease progression in knee osteoarthritis: insights from an integrated multi-scale modeling approach, a proof of concept. Front. Bioeng. Biotechnol. 11, 1214693. doi:10.3389/fbioe.2023.1214693
Rajagopal, A., Dembia, C. L., DeMers, M. S., Delp, D. D., Hicks, J. L., and Delp, S. L. (2016). Full-body musculoskeletal model for muscle-driven simulation of human gait. IEEE Trans. Biomed. Eng. 63, 2068–2079. doi:10.1109/tbme.2016.2586891
Sandholm, A., Schwartz, C., Pronost, N., de Zee, M., Voigt, M., and Thalmann, D. (2011). Evaluation of a geometry-based knee joint compared to a planar knee joint. Vis. Comput. 27, 161–171. doi:10.1007/s00371-010-0538-7
Seth, A., Sherman, M., Eastman, P., and Delp, S. (2010). Minimal formulation of joint motion for biomechanisms. Nonlinear Dyn. 62, 291–303. doi:10.1007/s11071-010-9717-3
Shippen, J. M., and May, B. (2010). Calculation of muscle loading and joint contact forces during the rock step in Irish dance. J. dance Med. Sci. 14, 11–18. doi:10.1177/1089313x1001400102
Steele, K. M., DeMers, M. S., Schwartz, M. H., and Delp, S. L. (2012). Compressive tibiofemoral force during crouch gait. Gait posture 35, 556–560. doi:10.1016/j.gaitpost.2011.11.023
Steele, K. M., Seth, A., Hicks, J. L., Schwartz, M. S., and Delp, S. L. (2010). Muscle contributions to support and progression during single-limb stance in crouch gait. J. biomechanics 43, 2099–2105. doi:10.1016/j.jbiomech.2010.04.003
Thelen, D. G., and Anderson, F. C. (2006). Using computed muscle control to generate forward dynamic simulations of human walking from experimental data. J. biomechanics 39, 1107–1115. doi:10.1016/j.jbiomech.2005.02.010
Trinler, U., Schwameder, H., Baker, R., and Alexander, N. (2019). Muscle force estimation in clinical gait analysis using anybody and opens. J. biomechanics 86, 55–63. doi:10.1016/j.jbiomech.2019.01.045
Valente, G., Pitto, L., Testi, D., Seth, A., Delp, S. L., Stagni, R., et al. (2014). Are subject-specific musculoskeletal models robust to the uncertainties in parameter identification?. PLoS One 9, e112625. doi:10.1371/journal.pone.0112625
Wagner, D. W., Divringi, K., Ozcan, C., Grujicic, M., Pandurangan, B., and Grujicic, A. (2010). Combined musculoskeletal dynamics/structural finite element analysis of femur physiological loads during walking. Multidiscip. Model. Mater. Struct. 6, 417–437. doi:10.1108/15736101011095118
Wagner, D. W., Stepanyan, V., Shippen, J. M., DeMers, M. S., Gibbons, R. S., Andrews, B. J., et al. (2013). Consistency among musculoskeletal models: caveat utilitor. Ann. Biomed. Eng. 41, 1787–1799. doi:10.1007/s10439-013-0843-1
Walker, P., Rovick, J., and Robertson, D. (1988). The effects of knee brace hinge design and placement on joint mechanics. J. biomechanics 21, 965–974. doi:10.1016/0021-9290(88)90135-2
Weinhandl, J. T., and Bennett, H. J. (2019). Musculoskeletal model choice influences hip joint load estimations during gait. J. biomechanics 91, 124–132. doi:10.1016/j.jbiomech.2019.05.015
Wickiewicz, T. L., Roy, R. R., Powell, P. L., Perrine, J. J., and Edgerton, V. R. (1984). Muscle architecture and force-velocity relationships in humans. J. Appl. Physiology 57, 435–443. doi:10.1152/jappl.1984.57.2.435
Wren, T. A., Rethlefsen, S., and Kay, R. M. (2005). Prevalence of specific gait abnormalities in children with cerebral palsy: influence of cerebral palsy subtype, age, and previous surgery. J. Pediatr. Orthop. 25, 79–83. doi:10.1097/01241398-200501000-00018
Wu, W., Lee, P. V., Bryant, A. L., Galea, M., and Ackland, D. C. (2016). Subject-specific musculoskeletal modeling in the evaluation of shoulder muscle and joint function. J. biomechanics 49, 3626–3634. doi:10.1016/j.jbiomech.2016.09.025
Keywords: locomotion biomechanics, musculoskeletal models choice, consistency, opensim, cerebral palsy
Citation: Jing Z, Han J and Zhang J (2023) Comparison of biomechanical analysis results using different musculoskeletal models for children with cerebral palsy. Front. Bioeng. Biotechnol. 11:1217918. doi: 10.3389/fbioe.2023.1217918
Received: 06 May 2023; Accepted: 15 September 2023;
Published: 26 September 2023.
Edited by:
Zhen Luo, University of Technology Sydney, AustraliaReviewed by:
Mona Batish, University of Delaware, United StatesSaidul Islam, University of Technology Sydney, Australia
Copyright © 2023 Jing, Han and Zhang. This is an open-access article distributed under the terms of the Creative Commons Attribution License (CC BY). The use, distribution or reproduction in other forums is permitted, provided the original author(s) and the copyright owner(s) are credited and that the original publication in this journal is cited, in accordance with accepted academic practice. No use, distribution or reproduction is permitted which does not comply with these terms.
*Correspondence: Juanjuan Zhang, anVhbmp1YW56aGFuZ0BuYW5rYWkuZWR1LmNu