 Yujin Kim
 Zachary Flinkstrom
 Pieter Candry
 Mari-Karoliina H. Winkler
 Jaewook Myung
95% of researchers rate our articles as excellent or good
Learn more about the work of our research integrity team to safeguard the quality of each article we publish.
Find out more
ORIGINAL RESEARCH article
Front. Bioeng. Biotechnol. , 31 July 2023
Sec. Bioprocess Engineering
Volume 11 - 2023 | https://doi.org/10.3389/fbioe.2023.1210392
This article is part of the Research Topic Microbial Biorefineries For A More Sustainable, Circular Economy View all 5 articles
Aquatic environments account for half of global CH4 emissions, with freshwater wetlands being the most significant contributors. These CH4 fluxes can be partially offset by aerobic CH4 oxidation driven by methanotrophs. Additionally, some methanotrophs can convert CH4 into polyhydroxyalkanoate (PHA), an energy storage molecule as well as a promising bioplastic polymer. In this study, we investigate how PHA-accumulating methanotrophic communities enriched from wetlands were shaped by varying resource availability (i.e., C and N concentrations) at a fixed C/N ratio. Cell yields, PHA accumulation, and community composition were evaluated in high (20% CH4 and 10 mM NH4+) and low resource (0.2% CH4 and 0.1 mM NH4+) conditions simulating engineered and environmental settings, respectively. High resource availability decreased C-based cell yields, while N-based cell yields remained stable, suggesting nutrient exchange patterns differed between methanotrophic communities at different resource concentrations. PHA accumulation was only observed in high resource enrichments, producing approximately 12.6% ± 2.4% (m/m) PHA, while PHA in low resource enrichments remained below detection. High resource enrichments were dominated by Methylocystis methanotrophs, while low resource enrichments remained significantly more diverse and contained only a minor population of methanotrophs. This study demonstrates that resource concentration shapes PHA-accumulating methanotrophic communities. Together, this provides useful information to leverage such communities in engineering settings as well as to begin understanding their role in the environment.
Despite the groundbreaking relevance of plastics as synthetic materials, they also have become a global threat to the environment due to their durability and resistance to degradation under ambient conditions (MacLeod et al., 2021). An estimated 12,000 Mt of plastic waste will be deposited into landfills or the environment by 2050 (Chamas et al., 2020). To address plastic waste issues, polyhydroxyalkanoates (PHAs)—microbially produced polyesters with applications in packaging and medical industries (Tan et al., 2014)—have been proposed as alternative bioplastics due to their high biodegradability (Choe et al., 2022) and biocompatibility (Koller, 2018).
Some microorganisms can produce and accumulate PHA-granules in their cell biomass as a strategy for energy storage to overcome periods where nutrients (e.g., nitrogen, phosphorus) are limited but carbon is still readily available (Pieja et al., 2017). Short-chain organic acids (e.g., acetate, propionate) have been widely explored as carbon substrates for PHA production (Albuquerque et al., 2007; Johnson et al., 2010). More recently, methanotrophic PHA accumulators have been explored as a powerful tool to upgrade low-value biogas (CH4/CO2) streams to bioplastics. These methanotrophic PHA-accumulators are type II methanotrophs (i.e., using the serine cycle for biomass synthesis (Nguyen et al., 2021)) capable of converting CH4 gas into PHA granules (Rostkowski et al., 2013). Typical type II methanotrophs are Methylocystis, Methylosinus, Methylocella, Methylocapsa, and Methyloferula. While these organisms are widely distributed, most studies enriching PHA-accumulating methanotrophic communities have focused on activated sludge from wastewater treatment plants, leaving their presence and role in natural settings underexplored (Pieja et al., 2011; Strong et al., 2016; Pérez et al., 2019).
While PHA-accumulating methanotrophic microorganisms have been excessively studied in engineered settings, research on their relevance to the natural environment remains sparse. However, in the face of defining the origins and sinks of climate change-related greenhouse budgets, there is an urgent need to study their role more holistically in natural systems. In specific, freshwater wetlands contribute approximately 20%–30% of global CH4 emissions (Rosentreter et al., 2021). Given the large global warming potential of CH4, about 30 CO2 equivalents over a 100-year time horizon, even small quantities of CH4 can largely affect the carbon footprint. Thus, a reduction of CH4 to CO2 through methanotrophs can significantly lower the emission factor from wetlands. In periodically flooded wetlands, alternating anaerobic and aerobic conditions promote the production and consumption of CH4, respectively. This pattern is especially pronounced in the thin oxic layer near the sediment-water interface where methanotrophs oxidize CH4 to CO2, counteracting some of these CH4 fluxes (Chowdhury and Dick, 2013). Moreover, aerobic CH4 oxidation has been suggested to be the key process that offsets the CH4 fluxes generated from saturated wetland soils (Chowdhury and Dick, 2013). Despite the critical role of methanotrophs in wetlands, their capacity for PHA accumulation remains untested.
Most studies have investigated PHA accumulation in methanotrophs under high (>20%) CH4 concentrations (Pieja et al., 2012; Myung et al., 2015; López et al., 2018). Under these conditions, the C/N ratio was found to affect PHA production and methanotrophic growth yield (Rostkowski et al., 2013; Zaldívar Carrillo et al., 2018). However, the impact of resource availability (i.e., concentration) on PHA-accumulating methanotrophs remains uncertain. One study investigated kinetic properties and substrate affinities of methanotrophic cultures enriched at low CH4 concentrations (200 ppm) (Dunfield et al., 1999). While this community harbored type II methanotrophs, the potential for PHA accumulation was not evaluated.
In this study, the impact of carbon and nitrogen resource availability on methanotrophic cultures enriched from freshwater wetland sediments was investigated. Communities were enriched under high and low resource (i.e., CH4, NH4+) conditions, to represent engineered and natural systems, respectively. Under these conditions, cell growth and substrate consumption were evaluated in batch cultures, PHA accumulation was tested to examine the potential implications for biorefineries, and differences in microbial community composition were evaluated.
Three different soil cores were obtained from a seasonally flooded urban freshwater wetland connected to Lake Washington in Seattle, WA, United States (Coordinates: 47.642196° N, −122.296236° W) using a soil core sampler (AMS, Inc., American Falls, ID). The cores were transported to the laboratory on ice for same-day processing. The cores were not mixed, and 1 mL of soil from the surface of each core was inoculated into 50 mL of ammonium mineral salts (AMS) medium. AMS medium was chosen based on its ability to enrich PHA-accumulating methanotrophs (Myung et al., 2015). The basal AMS medium contained (per 1,000 mL): 1 g of MgSO4.7H2O, 0.2 g of CaCl2.2H2O, 0.1 mL of a 3.8% (w/v) Fe(III)-EDTA solution, 0.5 mL of a 0.1% (w/v) Na2MoO4.2H2O solution, and 1 mL of a trace element solution. The trace element solution contained (per L): 0.5 g of FeSO4.7H2O, 0.4 g of ZnSO4.7H2O, 0.02 g of MnCl2.7H2O, 0.05 g of CoCl2.6H2O, 0.01 g of NiCl2.6H2O, 0.015 g of H3BO3 and 0.25 g of EDTA. After autoclaving, 10 mL of 0.4 M of phosphate buffer solution adjusted to pH 6.8 with KH2PO4 and Na2HPO4.7H2O, 1 mL of a 10-fold concentrated filter-sterilized vitamin stock (which contained 20 mg of biotin, 20 mg of folic acid, 50 mg of thiamine HCl, 50 mg of Ca pantothenate, 1 mg of vitamin B12, 50 mg of riboflavin, and 50 mg of nicotinamide per L), and 1 mL of a 10 mM CuCl2.2H2O solution were injected into the 1 L-medium. Serum bottles (160 mL total volume, Wheaton, Millville, NJ) were filled with 50 mL of medium, capped with butyl-rubber stoppers, and crimp-sealed under atmospheric pressure.
In this study, we investigated two conditions: 1) high resource enrichments with 20% CH4 (99.999%, Linde, Danbury, CT) and 10 mM NH4+ (0.53 g NH4Cl·L-1), and 2) low resource enrichments with 0.2% CH4 and 0.1 mM NH4+ (0.0053 g of NH4Cl·L-1). Bottles were agitated horizontally in a shaking incubator at 150 rpm controlled at a temperature of 30 °C. Communities were enriched in batch cycles, transferring 10% (v/v) after 14 days (first transfer) or every 7 days (every subsequent transfer).
All PHA accumulation cycles were performed with fully grown cultures from routine enrichment described above. Specifically, 40 mL of culture was centrifuged at 4,000 rpm for 15 min. The supernatant was removed, and the biomass pellet was resuspended in 10 mL of fresh nitrogen-depleted AMS medium, which was then injected into serum bottles with 40 mL of nitrogen-depleted AMS medium for a final liquid volume of 50 mL. The headspace was replaced with either 20% or 0.2% of pure CH4 gas (99.999%, Linde, Danbury, CT) for high and low resource conditions, respectively. All bottles were agitated horizontally in a temperature-controlled (30 °C) shaking incubator at 150 rpm for 5 days.
The gas phase of the enrichment cultures was analyzed by gas chromatography (SRI 8610C, SRI Instruments, Torrance, CA) with a 1.83 m Haysep D column and a thermal conductivity detector (TCD) to measure the CH4 consumption during the growth cycle. N2 carrier gas was continuously injected at 17 psi, and the oven and detector were set at 70 °C and 100 °C, respectively. NH4+, NO2−, and TON (NO3− + NO2−) concentrations in the liquid phase were monitored daily with a Gallery™ Discrete Analyzer (Thermo Fisher, United States ) using standard methods (EPA Methods 350.1, 354.1, and 353.1 respectively). Flow cytometry (Guava easyCyte™, Luminex, Austin, TX) was used to measure the cell concentrations during the growth cycle. Samples were diluted 100-fold (high resource) or 10-fold (low resource) in PBS buffer. 1 mL of diluted cell suspension was stained with 10 µL of 30-fold diluted SYBR Green stain (100,00x concentrate, Thermo Fischer) in TE buffer. The stained samples were incubated for 30 min at 37 °C under dark conditions and then analyzed on the flow cytometer.
PHA granules were stained with Nile Blue A and visualized with epifluorescence microscopy (Lazic et al., 2022). Cells collected after a PHA accumulation cycle were diluted and stained with 10 µL of 30-fold diluted SYBR Green solution and 10 µL Nile Blue A solution (0.05% (w/v) Nile Blue A in ethanol) per milliliter. Stained samples were incubated at 30°C for 30 min. Prior to imaging, stained cells were filtered onto a 0.2 µm Isopore membrane (Cat No. GTBP02500, Millipore, Burlington, MA, United States ) and were imaged on a glass slide with coverslip. An epifluorescent microscope (Axioskop ×2, Zeiss, Germany) equipped with a mercury-arc lamp and ×63Plan-APOCHROMAT objective was used to visualize the cells. Nile Blue stained PHA granules were visualized with a Cy3 filter set (513–556 nm excitation, 570–613 nm emission), Nile Blue stained membranes were visualized with a Cy5 filter set (604–644 nm excitation, 672–712 nm emission), and SYBR Green stained DNA was visualized with a FITC filter set (467–498 nm excitation, 513–556 emission).
Quantitative image analysis was performed using Fiji ImageJ (Schindelin et al., 2012). Images from each fluorescence channel were thresholded using a Bernsen Auto Local Threshold before input into the Analyze Particles plugin. PHA content per cell was calculated using the fraction of membrane area occupied by PHA particles. The percent area was converted to a percent volume by assuming a volume equal to that of a sphere with the measured cross-sectional area. Finally, the percent volume was converted to a percent mass using the 1.099 PHA to biomass density ratio described by (Lazic et al., 2022). To calculate the percentage of cells harboring PHA, the number of cells with detectable PHA signal was divided by the image cell count based on SYBR Green DNA staining.
PHA content was quantitatively measured by gas chromatography (GC) following the protocol described in (Myung et al., 2015). After PHA accumulation, the liquid phase was centrifuged at 4,000 rpm for 15 min and the biomass in the pellet was freeze-dried, weighed, and transferred to a 12-mL glass vial. Each sample was amended with 2 mL of chloroform and 2 mL of acidified methanol containing sulfuric acid (3%, vol/vol) and benzoic acid (0.25 mg/mL methanol). All vials were sealed tight with Teflon-lined plastic caps, shaken, and heated at 100°C for 3.5 h. After cooling to room temperature, 1 mL of deionized water was added to create an aqueous phase separated from the chloroform organic phase. The reaction cocktail was vortex mixed for 30 s and then allowed to phase separate. The organic phase was sampled by syringe and analyzed using a GC (Agilent, 8,890) equipped with an HP-5 column (Agilent, 30 m
Amplicon sequencing of the 16S rRNA gene was conducted to investigate the microbial community composition of each sample from the original wetland soil, and the high and low resource enrichments. DNA was extracted using the DNeasy PowerSoil Pro kit (Qiagen, Hilden, Germany) according to the manufacturer’s protocol. The concentration of DNA was quantified using the Qubit™ dsDNA High Sensitivity Assay (Thermo Fisher Scientific, Waltham, MA, United States ) and normalized with nuclease-free water to 2.5 ng/μL. The V4-V5 region of the 16S rRNA gene was PCR amplified by mixing the following ingredients to a final volume of 25 µL: 12.5 µL of LongAmp® Taq 2x master mix (New England Biolabs, Ipswich, MA, United States ), 1 µL of 10 µM stocks of 515F and 926R primers (Parada et al., 2016) with partial Illumina adapter sequences, 2 µL of DNA sample, and 8.5 µL of nuclease-free water. Samples were amplified according to the following process: denaturation at 94 °C for 30 s, 50 °C for 45 s, and 65 °C for 30 s for 30 cycles, with a final extension at 65 °C for 10 min. Agarose gel electrophoresis was performed to confirm the size and purity of PCR products. PCR products were purified using the DNA Clean and Concentrator kit (Zymo Research, Irvine, CA, United States ) and sent to Genewiz (South Plainfield, NJ, United States ) for Amplicon-EZ Illumina sequencing.
Analysis of demultiplexed and adapter-trimmed reads was performed using USEARCH v11 (Edgar, 2010). Paired-end reads were merged using fastq_mergepairs, length filtered using sortbylength with a minimum sequence length of 400 base pairs, primer sequences were removed using fastx_truncate, and reads were quality filtered using fastq_filter with the fastq_maxee option set to 1.0 to remove reads with greater than one expected error. Unique reads and their abundances were computed using fastx_uniques followed by denoising and chimera removal using the unoise3 command (Edgar, 2016). Reads were mapped to the resulting zero-radius OTUs (ZOTUs) using the otutab command. The taxonomy of the ZOTUs was assigned using the nbc_tax command (Naïve Bayesian Classifier) trained on the RDP 16S database v18 (Cole et al., 2014) with an 80% confidence threshold. ZOTUs below the confidence threshold at a given taxonomic level were labeled as unclassified at that level. Shannon diversity, PERMANOVA, and principal coordinates analysis (PcoA) ordination were computed on the resulting ZOTU tables using scikit-bio’s Diversity, Distance, and Ordination modules, respectively.
Consumption of CH4 and NH4+ as well as cell growth were characterized during incubations of low and high resource enrichments to investigate the impact of resource availability on methanotrophic activity.
CH4 concentrations were monitored to understand how resource concentration affected CH4 oxidation. In the low resource enrichments, only 25% ± 10% of the initial CH4 was consumed during cultivation with fluctuations. Core 1 consumed 39.2% of the CH4, which shows the highest consumption in the low resource enrichments, while core 2 and 3 consumed 20.0% and 15.9% of CH4, respectively (Figure 1A). In the high resource enrichments, 53% ± 3.9% of the initially injected CH4 was consumed rapidly during the exponential phase followed by the stationary phase (Figure 1B).
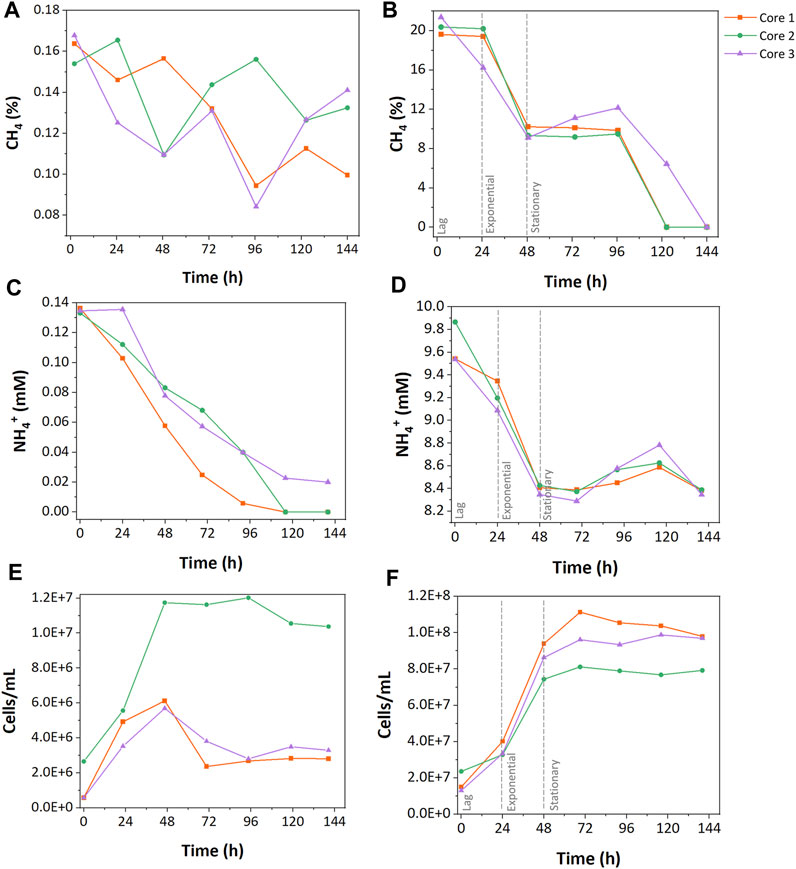
FIGURE 1. Growth characteristics of low and high resource methanotrophic enrichments from wetlands. CH4 consumption (A,B), NH4+ consumption (C, D), and cell counts (E,F). (A), (C), and (E) represent the results of low resource enrichment, and (B), (D), and (F) indicate the results of high resource enrichment.
NH4+ was the sole nitrogen source during growth incubations, and its concentration was measured to explore the differences in nitrogen uptake between enrichments. In the low resource enrichments, 85% ± 21% of initially injected NH4+ was consumed during the growth cycle (Figure 1C). While cores 1 and 2 consumed all the provided NH4+ during the growth, core 3 only assimilated 55% of the nitrogen source. In contrast, the high resource enrichments consumed only 13% ± 1.3% of total NH4+ (Figure 1D). No accumulation of NO2− or NO3− was observed during the incubations suggesting that NH4+ oxidation was not a major pathway of NH4+ consumption (Supplementary Table S1).
Cell concentrations of the low and high resource enrichments were measured throughout growth cycles. High resource enrichments contained approximately 10 times more cells compared to the low resource enrichment (high, 7.42 ± 0.975 · 107 cells ∙ mL-1; low, 5.91 ± 0.359 · 106 cells ∙ mL-1). Additionally, growth curves of the low resource enrichments were more variable between core samples than the high resource enrichments. For instance, low resource enrichment from core 2 grew rapidly up to 1.20 · 107 cells ∙ mL-1 and remained stable at that level, while enrichments from cores 1 and 3 only reached 2.75 ± 0.0875 · 106 cells ∙ mL-1 and began decaying after 48 h (Figure 1E). In high resource enrichments, a 24 h-lag phase preceded exponential growth within 48 h, followed by a stationary phase (Figure 1F). The maximum cell concentration of the high resource enrichment was 1.11 · 108 cells/mL from the core 1 sample, which was 9.27 times higher than that of the low resource enrichment.
Carbon- and nitrogen-based cell yields of both enrichments were calculated to evaluate nutrient uptake during growth cycles. The low resource enrichments had 12.7 times higher carbon-based cell yield than the high resource enrichment (Figure 2); the cell yield per consumed CH4-C of the low resource enrichment was 128.81 ± 78.24 · 106 cells · g-C-1 and that of the high resource enrichment was 10.12 ± 1.39 · 106 cells · g-C-1. This aligns well with the observation that a 100-fold increase in carbon supply only increased cell counts by approximately 10-fold. On the other hand, nitrogen-based cell yields of high and low resource enrichments were more comparable; the low resource enrichment had 3.68 ± 2.24 · 106 cells · g-N-1 and the high resource enrichment had 4.15 ± 0.55 · 106 cells · g-N-1.
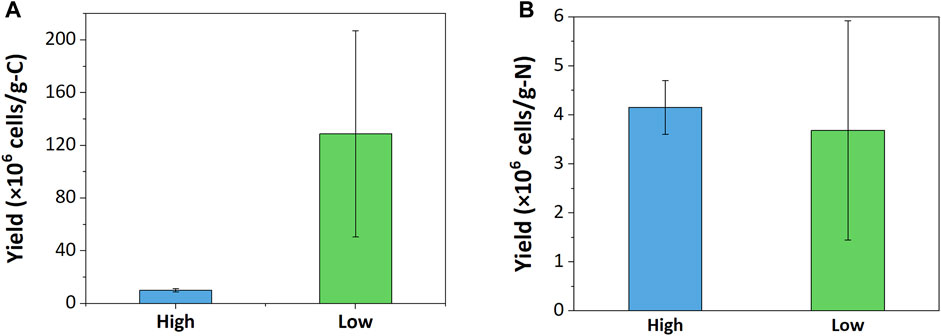
FIGURE 2. Growth yield based on (A) carbon and (B) nitrogen consumption.
Under normal incubation conditions, neither high nor low resource enrichments fully consumed all CH4, suggesting other factors were limiting. In the high resource enrichments, we hypothesized oxygen was limiting as a stoichiometric excess of CH4 was added during incubations. To test this hypothesis, pure oxygen was injected after the stationary phase (99.5 h). The provision of oxygen led to complete CH4 removal, suggesting that oxygen was the rate-limiting factor for CH4 oxidation in high resource enrichments. Furthermore, oxygen addition also increased NH4+ consumption in high resource enrichments with an additional 9.17% of the NH4+ (i.e., 0.89 mM) being consumed due to growth (Figure 3).
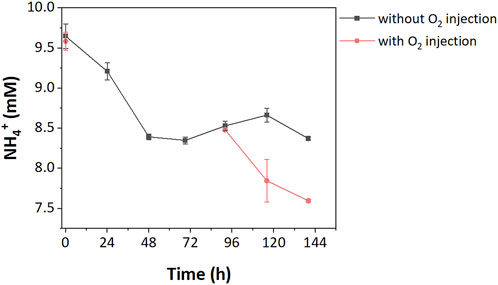
FIGURE 3. NH4+ consumption in high resource enrichment with/without O2 injection.
In the low resource enrichments, we hypothesized that NH4+ was limiting due to its complete consumption during incubations. To test this, an additional 0.1 mM of NH4+ was injected into low resource enrichments after NH4+ was depleted (67 h). While that additional nitrogen was completely consumed, albeit at a slower rate, it did not stimulate additional CH4 oxidation (Figure 4).
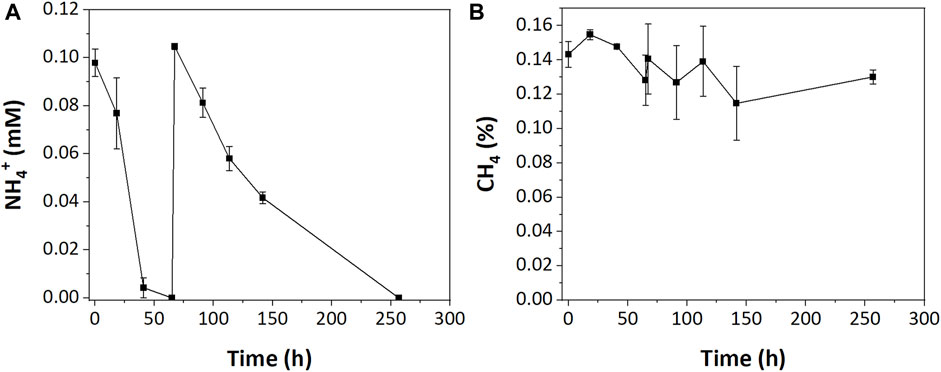
FIGURE 4. (A) NH4+ and (B) CH4 consumption in low resource enrichment after additional NH4+ injection.
The impact of resource availability on PHA-accumulation potential of the enriched methanotrophic communities was tested by running PHA-accumulation cycles and evaluating PHA content by epifluorescence microscopy. The high resource enrichments were dominated by coccoid cells with at least one but mostly two distinct PHA granules present at the poles (Figure 5A). Similar PHA granules were not observed in any of the low resource enrichments though a small fraction of cells exhibited thin bands that stained positive for PHA (Figure 5B).
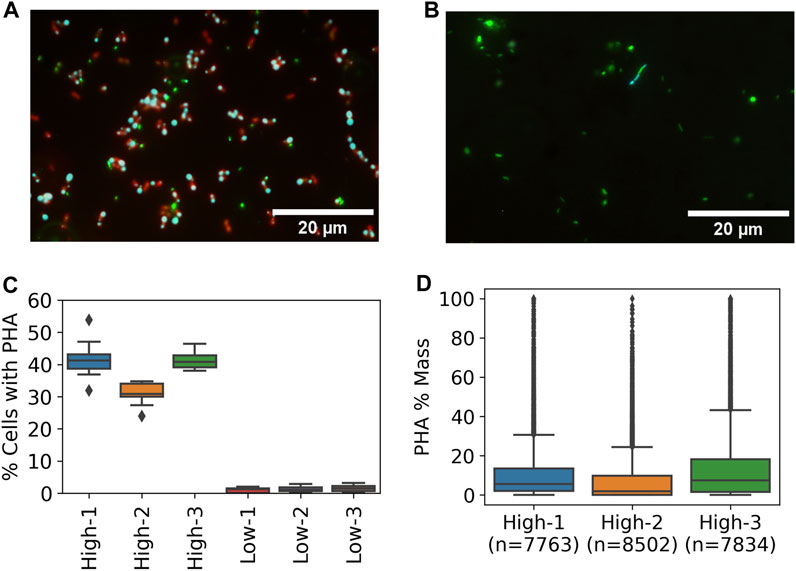
FIGURE 5. PHA accumulation at high and low resource enrichments based on Nile Blue staining and fluorescence microscopy. Representative epifluorescence images from (A) high and (B) low enrichments with DNA (green), PHA (cyan), and lipids (red) (C) Percent of cells with detectable PHA by microscopic method based on 15 images per sample (D) Distribution of single cell PHA content in high resource enrichments based on microscopic method.
Quantitative image analysis techniques were used to estimate the frequency of cells containing PHA and the per cell PHA mass fraction based on granule size. An average of 37.9% ± 5.9% of cells in the high resource enrichments contained PHA while only 1.3% ± 0.3% of cells contained PHA signal in the low resource condition (Figure 5C). Furthermore, estimation of PHA content per cell showed that the high resource enrichments accumulated 10.64%, 7.23%, and 14.19% PHA (m/m %) (Figure 5D). These estimates were in good agreement with the results from the traditional GC method which found PHA contents of 13.47%, 9.27%, and 14.95% for the same samples. In addition, each of the three metrics (i.e., percent of cells with PHA, single-cell PHA content, and GC) found the high resource core 2 enrichment to contain less PHA compared to cores 1 and 3.
Amplicon sequencing of the V4-V5 region of the 16S rRNA gene was conducted on the enrichment cultures and the original wetland soils that were used as inocula. On average, the most abundant phyla in the wetland soil were Proteobacteria (mean ± SD: 41.5% ± 2.2%), Acidobacteria (9.5% ± 1.1%), Bacteroidetes (8.1% ± 0.4%), Actinobacteria (7.9% ± 1.1%), Verrucomicrobia (5.8% ± 0.4%), Planctomycetes (5.3% ± 0.7%), and Chloroflexi (5.2% ± 1.0%) along with a substantial proportion of ZOTUs that were unclassified at the phylum level (9.5% ± 0.6%). The high resource enrichments were dominated by Proteobacteria (96.9% ± 0.4%) with minor populations of Verrucomicrobia (0.9% ± 0.3%), Bacteroidetes (0.8% ± 0.2%), Actinobacteria (0.5% ± 0.2%), while the low resource enrichments consisted of Proteobacteria (47.6% ± 8.6%), Actinobacteria (7.5% ± 4.3%), Armatimonadetes (5.6% ± 4.5%), Bacteroidetes (2.6% ± 2.3%), Acidobacteria (2.6% ± 1.0%), and a large proportion of ZOTUs that were unclassified at the phylum level (31.8% ± 10.7%) (Figure 6A).
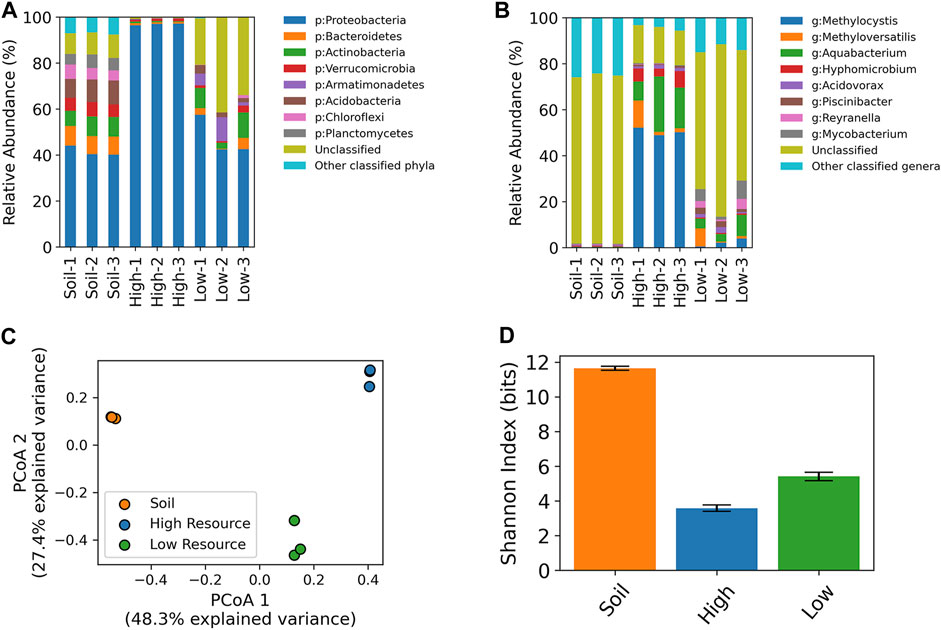
FIGURE 6. 16S rRNA taxonomic profiling of high and low resource enrichment cultures and original wetland soil cores at the phylum (A) and genus level (B). Unclassified refers to ZOTUs with a classification confidence of less than 80% at the provided taxonomic level. Principal coordinates analysis of 16S rRNA ZOTU data (C). Shannon diversity index values based on 16S ZOTU tables (D).
At the genus level, the high resource enrichments were dominated by a single Methylocystis ZOTU (47.6% ± 1.5%), while the core 1 enrichment had an additional population of Methyloversatilis (10.4%). The low resource enrichments harbored these ZOTUs at lower relative abundances with the Methylocystis at 2.1% ± 1.7% across cores, while the core 1 enrichment contained the ZOTU classified as Methyloversatilis at 7.8%. The starting wetland soil contained Methylocystis at 0.2% ± 0.03% and the Methyloversatilis ZOTU was only detected in core 1 at 0.001%. (Figure 6B).
Both high and low resource enrichments also contained significant satellite communities. The most abundant classified genus in the low resource enrichments was Aquabacterium (5.6% ± 3.1%) followed by Mycobacterium (4.8% ± 3.4%). Aquabacterium was the second most abundant genera in the high resource enrichments (16.7% ± 8.0%) followed by Hyphomicrobium (5.4% ± 2.0%). Closer inspection of the abundant unclassified ZOTUs from the low resource enrichments revealed BLAST hits to uncultured representatives of Planctomycetes (Low-1/ZOTU6), a Vermamoeba mitochondria 16S-like sequence (Low-2/ZOTU3), and an Omnitrophica bacterium (Low-3/ZOTU5).
Beta-diversity analysis (i.e., PCoA) of 16S rRNA gene ZOTU data showed a distinct clustering of the starting wetland soil, high resource enrichments, and low resource enrichments (Figure 6C) (PERMANOVA p < 0.01). Moreover, differences in community composition also altered within-community diversity (i.e., alpha diversity). Sample groups had significantly different Shannon indices (One-way ANOVA, p < 1e-7; Tukey’s pairwise HSD, p < 0.001) with the wetland soil having the highest, followed by the low resource enrichments, and the high resource enrichments were the least diverse (Figure 6D).
This study investigated the impact of resource concentration on PHA-accumulating methanotrophic enrichments from wetlands. Complete oxidation of supplied CH4 was limited in both high and low resource conditions, due to lack of oxygen in the former and presumably due to nitrogen limitation in the latter where the supplied NH4+ was completely consumed. Though transient nitrogen limitation is known to induce PHA storage, it is not desirable for the selection of communities rich in PHA accumulating organisms. This has been illustrated in acetate (Johnson et al., 2010), fermented molasses (Albuquerque et al., 2007), and CH4 (Pieja et al., 2012) fed systems, where nitrogen limitation resulted in a decreasing capacity for PHA storage over time. Such conditions select for faster specific NH4+ uptake rate and N assimilation which may require use of internal carbon stores and discourage PHA accumulation. As a result, repeated N-limitation likely played a role in the unsuccessful enrichment of PHA-accumulators in the low resource condition.
Low resource concentrations may have also contributed to the lack of PHA accumulators. It has been shown in aerobic granular sludge wastewater treatment systems that alternating conditions of high food-to-microorganisms (F/M) ratios must be applied to out-select the fast-growing heterotrophs and promote the growth of slow-growing PHB accumulating bacteria (de Kreuk et al., 2005; Winkler and Van Loosdrecht, 2022). The high F/M ratio provides PHB storage formers with the competitive edge to acquire more substrate through non-growth associated fast substrate uptake (qs, max) that is multiple times faster than substrate usage through canonical growth (µmax) without storage (Winkler et al., 2015; Chen et al., 2020). In our low resource condition, the F/M ratio may not have been high enough to select for PHA storage formers while in the high resource condition it was sufficient.
We observed a much higher carbon-based cell yield in the low resource condition, while the cell yield per N remained similar across conditions; a similar observation was made in nitrogen-limited acetate-fed cultures during the feast phase of growth (Johnson et al., 2010). The differences in yield may be attributed to C uptake and storage as PHA in the high resource condition leading to a decreased carbon use efficiency compared to the low condition where a higher proportion of available carbon was directed towards growth. Cross-feeding and resource exchange in the low resource condition could have also contributed to greater carbon use efficiency.
In line with the literature showing that repeated nitrogen limitation and low F/M ratios will not favor PHA accumulation, our results showed that the low resource enrichments harbored little PHA storage capacity compared to the high resource enrichments (1.3% and 37.9% of cells containing PHA respectively). This difference in PHA storage was comparable to the difference in the relative abundance of Methylocystis methanotrophs in the two conditions (2.1% and 47.6% in the low and high resource enrichments respectively). Microscopic imaging of the cultures after incubation in nitrogen-free media provided a clear view of the distribution of PHA-harboring microorganisms in the community and showed the location of PHA granules within the cell. Furthermore, quantitative image processing showed good agreement with the traditional GC method of PHA quantification. We extended the Nile Blue A staining method from Lazic et al. by including a SYBR Green stain for nucleic acids and used epifluorescence microscopy as opposed to confocal which requires more advanced instrumentation. Utilization of the SYBR Green stain revealed that the Nile Blue did not produce signal for the membranes of all cells especially in the low resource enrichments (Supplementary Figure S1), which could be due to differences in membrane composition of different organisms.
The PHA content of the high resource enrichments (12.6% ± 2.4%) was lower than other studies investigating methanotrophs as PHA producers, however, if normalized by the relative abundance of methanotrophs, then the PHA content is more in line with literature reports (26.4% ± 6.1%). For example, others have reported 22.2% PHA from a rice field soil enrichment (Kulkarni et al., 2022), 39% from an activated sludge enrichment (Myung et al., 2015), 43.1% from a pure culture Methylocystis hirsuta fed with biogas (López et al., 2018), and 25.9% from a pure culture of Methylocystis sp. Rockwell in nitrogen-free media (Lazic et al., 2022). The oxygen limitation experienced by our high resource enrichments could have contributed to the limited PHA production as this has been shown to negatively affect methanotroph PHA production (Zaldívar Carrillo et al., 2018).
Despite these differences in growth characteristics, the high- and low resource enrichments contained the same Methylocystis ZOTU, albeit at different abundances and surrounded by different satellite communities. Methanotrophs from the genus Methylocystis have been enriched from a variety of environments including wetlands (Wartiainen et al., 2006), rice fields (Kulkarni et al., 2022) and activated sludge (Myung et al., 2015). In addition, the Methylocystis genus has been studied extensively for the production of PHA (Pieja et al., 2011; Lazic et al., 2022), so the enrichment of a Methylocystis type methanotroph in this study was not surprising. Our high resource enrichments contained only about 47.6% methanotrophs while others have reached 65.0%–77.2% (Myung et al., 2015) and 88.92% (Kulkarni et al., 2022), which may provide additional context to the lower overall PHA content observed in this report. Interestingly, the low resource enrichments also harbored a population of Mycobacterium, a genus in which a methanotrophic organism was recently identified (van Spanning et al., 2022), though most Mycobacterium are not methanotrophic.
Low resource enrichments were significantly more diverse than high resource enrichments, which is in alignment with bioreactor systems operated at high organic carbon concentrations that are enriched with just a few major ZOTUs (Sato et al., 2016). The relationship between nutrient concentration and microbial diversity has been explored in aquatic ecosystems (Smith, 2007), soils (Bastida et al., 2021), a photosynthetic mat (Bernstein et al., 2017), and laboratory serial dilution culture systems (Erez et al., 2020) with varying results. The latter describes an effect where large nutrient additions favor a subset of “early-bird” species that undergo rapid growth to numerically dominate the system while smaller nutrient additions are analogous to a chemostat-like system where metabolic trade-offs enable an arbitrarily large number of species to coexist (Erez et al., 2020). Results from our enrichments support this idea that high nutrient concentrations allowed for the dominance of a single “early-bird” ZOTU while the low nutrient concentrations created a more diverse and even community. The increased diversity in the low resource enrichments may have also contributed to the variability in growth characteristics, particularly in cell concentrations, compared to the high resource enrichments that harbored a dominant population of methanotrophs.
This study provides a few takeaways useful for the development of CH4-fed biorefineries. First, we were unable to select for a significant population of PHA-accumulating methanotrophs under the low resource condition, which highlights the challenge of using dilute CH4 sources like landfills, cattle operations, or ventilated coal mines. Future work should address these issues, since dilute sources comprise a significant proportion of anthropogenic CH4 emissions (Saunois et al., 2020). In the case of concentrated CH4 streams, we found that enrichments consumed only a fraction of the supplied NH4+, suggesting that it may be possible to cultivate PHA-accumulating biomass at higher C/N ratios by reducing N-supply. This could reduce operational costs of the system and highlight the importance of tracking nitrogen consumption. Finally, we show that PHA-accumulating methanotrophs can be sourced from freshwater wetlands, which could serve as a promising inoculum for CH4-fed biorefineries.
The subject of microbial storage has been reviewed in the context of soil ecosystems where it is a widespread trait that aids in effective resource allocation and survival and plays a role in the soil carbon cycle (Mason-Jones et al., 2022). In wetlands, the conversion of CH4 into PHA by methanotrophs could enhance carbon storage and decrease emissions from the system. This study shows that PHA-accumulating methanotrophs can be enriched from wetland soil in high resource condition. Though we did not observe PHA in the low resource condition meant to mimic the natural system, field studies have measured gas bubbles from wetlands with CH4 concentrations in the range of 50%–80% (Chanton et al., 1989), so the high resource condition still holds some relevance to the natural system. It is possible that rapid carbon uptake and storage by methanotrophs occurs under transient exposure to CH4-rich bubbles as they leave the wetland or form on surfaces. Future studies exploring this phenomenon could further illuminate the environmental relevance of methanotrophic PHA storage in wetland soils.
Methanotrophic communities dominated by Methylocystis-associated organisms were enriched from freshwater wetland soils under high and low resource concentrations at a fixed C/N ratio. The low nutrient enrichments became nitrogen-limited and did not select for PHA accumulation but retained a higher level of diversity based on 16S rRNA amplicon sequencing. In contrast, the high nutrient enrichments became oxygen limited, contained a sizable population of PHA-accumulating organisms, and had a lower level of diversity. The Nile Blue and SYBR Green fluorescent staining method enabled visualization and quantification of PHA in the mixed communities and showed good agreement with the traditional GC method. Overall, this study highlights the importance of resource concentration as a factor on top of C/N-ratios when selecting for PHA accumulating methanotrophic communities and points to their relevance in natural wetland systems.
Raw sequencing data from this study is available in the NCBI Sequence Read Archive (SRA) under Bioproject PRJNA954053 and Biosamples SAMN34133114, SAMN34133115, SAMN34133116, SAMN34133117, SAMN34133118, SAMN34133119, SAMN34133120, SAMN34133121, and SAMN34133122. Sequencing and image analysis code can be found in a GitHub repository for this project (https://github.com/zflink/Wetland_Methanotrophs_PHA).
YK, ZF, PC, M-KW, and JM conceived the study. YK, ZF, and PC performed the soil sampling. YK and ZF performed cultivation, microscopy, and chemical analyses. ZF performed the image and DNA sequencing analysis. YK, ZF, PC, M-KW, and JM wrote and edited the manuscript. All authors contributed to the article and approved the submitted version.
This material is based upon work supported by the U.S. Department of Energy, Office of Science, Office of Biological and Environmental Research, under Award Number DE-SC0020356. This work was also supported by the National Research Foundation of Korea (NRF) grant funded by the Korean government (MSIT) (2022R1A4A3029607, 2022R1F1A1064064). Also, this research was a part of the project titled “Development of 1 tonf-class Ultrasonic Pretreatment-Pyrolysis Liquefaction Facility and Operating System for Marine Plastic Recycling,” funded by the Ministry of Oceans and Fisheries, Korea.
The authors declare that the research was conducted in the absence of any commercial or financial relationships that could be construed as a potential conflict of interest.
All claims expressed in this article are solely those of the authors and do not necessarily represent those of their affiliated organizations, or those of the publisher, the editors and the reviewers. Any product that may be evaluated in this article, or claim that may be made by its manufacturer, is not guaranteed or endorsed by the publisher.
The Supplementary Material for this article can be found online at: https://www.frontiersin.org/articles/10.3389/fbioe.2023.1210392/full#supplementary-material
Albuquerque, M., Eiroa, M., Torres, C., Nunes, B., and Reis, M. (2007). Strategies for the development of a side stream process for polyhydroxyalkanoate (PHA) production from sugar cane molasses. J. Biotechnol. 130 (4), 411–421. doi:10.1016/j.jbiotec.2007.05.011
Bastida, F., Eldridge, D. J., García, C., Kenny Png, G., Bardgett, R. D., and Delgado-Baquerizo, M. (2021). Soil microbial diversity–biomass relationships are driven by soil carbon content across global biomes. ISME J. 15 (7), 2081–2091. doi:10.1038/s41396-021-00906-0
Bernstein, H. C., Brislawn, C., Renslow, R. S., Dana, K., Morton, B., Lindemann, S. R., et al. (2017). Trade-offs between microbiome diversity and productivity in a stratified microbial mat. ISME J. 11 (2), 405–414. doi:10.1038/ismej.2016.133
Chamas, A., Moon, H., Zheng, J., Qiu, Y., Tabassum, T., Jang, J. H., et al. (2020). Degradation rates of plastics in the environment. ACS Sustain. Chem. Eng. 8 (9), 3494–3511. doi:10.1021/acssuschemeng.9b06635
Chanton, J. P., Martens, C. S., and Kelley, C. A. (1989). Gas transport from methane-saturated, tidal freshwater and wetland sediments. Limnol. Oceanogr. 34 (5), 807–819. doi:10.4319/lo.1989.34.5.0807
Chen, G.-H., van Loosdrecht, M. C., Ekama, G. A., and Brdjanovic, D. (2020). Biological wastewater treatment: Principles, modeling and design. United Kingdom: IWA publishing.
Choe, S., Kim, Y., Park, G., Lee, D. H., Park, J., Mossisa, A. T., et al. (2022). Biodegradation of 3D-printed biodegradable/non-biodegradable plastic blends. ACS Appl. Polym. Mater. 4 (7), 5077–5090. doi:10.1021/acsapm.2c00600
Chowdhury, T. R., and Dick, R. P. (2013). Ecology of aerobic methanotrophs in controlling methane fluxes from wetlands. Appl. soil Ecol. 65, 8–22. doi:10.1016/j.apsoil.2012.12.014
Cole, J. R., Wang, Q., Fish, J. A., Chai, B., McGarrell, D. M., Sun, Y., et al. (2014). Ribosomal database project: Data and tools for high throughput rRNA analysis. Nucleic acids Res. 42 (D1), D633–D642. doi:10.1093/nar/gkt1244
de Kreuk, M. K., Heijnen, J., and Van Loosdrecht, M. (2005). Simultaneous COD, nitrogen, and phosphate removal by aerobic granular sludge. Biotechnol. Bioeng. 90 (6), 761–769. doi:10.1002/bit.20470
Dunfield, P. F., Liesack, W., Henckel, T., Knowles, R., and Conrad, R. (1999). High-affinity methane oxidation by a soil enrichment culture containing a type II methanotroph. Appl. Environ. Microbiol. 65 (3), 1009–1014. doi:10.1128/aem.65.3.1009-1014.1999
Edgar, R. C. (2010). Search and clustering orders of magnitude faster than BLAST. Bioinformatics 26 (19), 2460–2461. doi:10.1093/bioinformatics/btq461
Edgar, R. C. (2016). UNOISE2: Improved error-correction for Illumina 16S and ITS amplicon sequencing. bioRxiv, 081257.
Erez, A., Lopez, J. G., Weiner, B. G., Meir, Y., and Wingreen, N. S. (2020). Nutrient levels and trade-offs control diversity in a serial dilution ecosystem. Elife 9, e57790. doi:10.7554/elife.57790
Johnson, K., Kleerebezem, R., and van Loosdrecht, M. C. (2010). Influence of the C/N ratio on the performance of polyhydroxybutyrate (PHB) producing sequencing batch reactors at short SRTs. Water Res. 44 (7), 2141–2152. doi:10.1016/j.watres.2009.12.031
Koller, M. (2018). Biodegradable and biocompatible polyhydroxy-alkanoates (PHA): Auspicious microbial macromolecules for pharmaceutical and therapeutic applications. Molecules 23 (2), 362. doi:10.3390/molecules23020362
Kulkarni, P. P., Chavan, S. B., Deshpande, M. S., Sagotra, D., Kumbhar, P. S., and Ghosalkar, A. R. (2022). Enrichment of Methylocystis dominant mixed culture from rice field for PHB production. J. Biotechnol. 343, 62–70. doi:10.1016/j.jbiotec.2021.11.007
Lazic, M., Gudneppanavar, R., Whiddon, K., Sauvageau, D., Stein, L. Y., and Konopka, M. (2022). In vivo quantification of polyhydroxybutyrate (PHB) in the alphaproteobacterial methanotroph, Methylocystis sp. Rockwell. Appl. Microbiol. Biotechnol. 106 (2), 811–819. doi:10.1007/s00253-021-11732-x
López, J. C., Arnáiz, E., Merchán, L., Lebrero, R., and Muñoz, R. (2018). Biogas-based polyhydroxyalkanoates production by Methylocystis hirsuta: A step further in anaerobic digestion biorefineries. Chem. Eng. J. 333, 529–536. doi:10.1016/j.cej.2017.09.185
MacLeod, M., Arp, H. P. H., Tekman, M. B., and Jahnke, A. (2021). The global threat from plastic pollution. Science 373 (6550), 61–65. doi:10.1126/science.abg5433
Mason-Jones, K., Robinson, S. L., Veen, G., Manzoni, S., and van der Putten, W. H. (2022). Microbial storage and its implications for soil ecology. ISME J. 16 (3), 617–629. doi:10.1038/s41396-021-01110-w
Myung, J., Galega, W. M., Van Nostrand, J. D., Yuan, T., Zhou, J., and Criddle, C. S. (2015). Long-term cultivation of a stable Methylocystis-dominated methanotrophic enrichment enabling tailored production of poly (3-hydroxybutyrate-co-3-hydroxyvalerate). Bioresour. Technol. 198, 811–818. doi:10.1016/j.biortech.2015.09.094
Nguyen, D. T. N., Lee, O. K., Nguyen, T. T., and Lee, E. Y. (2021). Type II methanotrophs: A promising microbial cell-factory platform for bioconversion of methane to chemicals. Biotechnol. Adv. 47, 107700. doi:10.1016/j.biotechadv.2021.107700
Parada, A. E., Needham, D. M., and Fuhrman, J. A. (2016). Every base matters: Assessing small subunit rRNA primers for marine microbiomes with mock communities, time series and global field samples. Environ. Microbiol. 18 (5), 1403–1414. doi:10.1111/1462-2920.13023
Pérez, R., Cantera, S., Bordel, S., García-Encina, P. A., and Muñoz, R. (2019). The effect of temperature during culture enrichment on methanotrophic polyhydroxyalkanoate production. Int. Biodeterior. Biodegrad. 140, 144–151. doi:10.1016/j.ibiod.2019.04.004
Pieja, A. J., Morse, M. C., and Cal, A. J. (2017). Methane to bioproducts: The future of the bioeconomy? Curr. Opin. Chem. Biol. 41, 123–131. doi:10.1016/j.cbpa.2017.10.024
Pieja, A. J., Rostkowski, K. H., and Criddle, C. S. (2011). Distribution and selection of poly-3-hydroxybutyrate production capacity in methanotrophic proteobacteria. Microb. Ecol. 62 (3), 564–573. doi:10.1007/s00248-011-9873-0
Pieja, A. J., Sundstrom, E. R., and Criddle, C. S. (2012). Cyclic, alternating methane and nitrogen limitation increases PHB production in a methanotrophic community. Bioresour. Technol. 107, 385–392. doi:10.1016/j.biortech.2011.12.044
Pieja, A. J., Sundstrom, E. R., and Criddle, C. S. (2011). Poly-3-hydroxybutyrate metabolism in the type II methanotroph Methylocystis parvus OBBP. Appl. Environ. Microbiol. 77 (17), 6012–6019. doi:10.1128/aem.00509-11
Rosentreter, J. A., Borges, A. V., Deemer, B. R., Holgerson, M. A., Liu, S., Song, C., et al. (2021). Half of global methane emissions come from highly variable aquatic ecosystem sources. Nat. Geosci. 14 (4), 225–230. doi:10.1038/s41561-021-00715-2
Rostkowski, K. H., Pfluger, A. R., and Criddle, C. S. (2013). Stoichiometry and kinetics of the PHB-producing Type II methanotrophs Methylosinus trichosporium OB3b and Methylocystis parvus OBBP. Bioresour. Technol. 132, 71–77. doi:10.1016/j.biortech.2012.12.129
Sato, Y., Hori, T., Navarro, R. R., Habe, H., Yanagishita, H., and Ogata, A. (2016). Fine-scale monitoring of shifts in microbial community composition after high organic loading in a pilot-scale membrane bioreactor. J. Biosci. Bioeng. 121 (5), 550–556. doi:10.1016/j.jbiosc.2015.10.003
Saunois, M., Stavert, A. R., Poulter, B., Bousquet, P., Canadell, J. G., Jackson, R. B., et al. (2020). The global methane budget 2000–2017. Earth Syst. Sci. data 12 (3), 1561–1623. doi:10.5194/essd-12-1561-2020
Schindelin, J., Arganda-Carreras, I., Frise, E., Kaynig, V., Longair, M., Pietzsch, T., et al. (2012). Fiji: An open-source platform for biological-image analysis. Nat. methods 9 (7), 676–682. doi:10.1038/nmeth.2019
Smith, V. H. (2007). Microbial diversity–productivity relationships in aquatic ecosystems. FEMS Microbiol. Ecol. 62 (2), 181–186. doi:10.1111/j.1574-6941.2007.00381.x
Strong, P., Kalyuzhnaya, M., Silverman, J., and Clarke, W. (2016). A methanotroph-based biorefinery: Potential scenarios for generating multiple products from a single fermentation. Bioresour. Technol. 215, 314–323. doi:10.1016/j.biortech.2016.04.099
Tan, G.-Y. A., Chen, C.-L., Li, L., Ge, L., Wang, L., Razaad, I. M. N., et al. (2014). Start a research on biopolymer polyhydroxyalkanoate (PHA): A review. Polymers 6 (3), 706–754. doi:10.3390/polym6030706
van Spanning, R. J., Guan, Q., Melkonian, C., Gallant, J., Polerecky, L., Flot, J.-F., et al. (2022). Methanotrophy by a Mycobacterium species that dominates a cave microbial ecosystem. Nat. Microbiol. 7, 2089–2100. doi:10.1038/s41564-022-01252-3
Wartiainen, I., Hestnes, A. G., McDonald, I. R., and Svenning, M. M. (2006). Methylocystis rosea sp. nov., a novel methanotrophic bacterium from Arctic wetland soil, Svalbard, Norway (78 N). Int. J. Syst. Evol. Microbiol. 56 (3), 541–547. doi:10.1099/ijs.0.63912-0
Winkler, M.-K., Le, Q. H., and Volcke, E. I. (2015). Influence of partial denitrification and mixotrophic growth of NOB on microbial distribution in aerobic granular sludge. Environ. Sci. Technol. 49 (18), 11003–11010. doi:10.1021/acs.est.5b01952
Winkler, M.-K., and Van Loosdrecht, M. (2022). Intensifying existing urban wastewater. Science 375 (6579), 377–378. doi:10.1126/science.abm3900
Keywords: methanotrophs, polyhydroxyalkanoate (PHA), wetlands, resource availability, enrichments, bioplastics
Citation: Kim Y, Flinkstrom Z, Candry P, Winkler M-KH and Myung J (2023) Resource availability governs polyhydroxyalkanoate (PHA) accumulation and diversity of methanotrophic enrichments from wetlands. Front. Bioeng. Biotechnol. 11:1210392. doi: 10.3389/fbioe.2023.1210392
Received: 22 April 2023; Accepted: 12 July 2023;
Published: 31 July 2023.
Edited by:
Silvio Matassa, University of Cassino, ItalyReviewed by:
Jeongdae Im, Kansas State University, United StatesCopyright © 2023 Kim, Flinkstrom, Candry, Winkler and Myung. This is an open-access article distributed under the terms of the Creative Commons Attribution License (CC BY). The use, distribution or reproduction in other forums is permitted, provided the original author(s) and the copyright owner(s) are credited and that the original publication in this journal is cited, in accordance with accepted academic practice. No use, distribution or reproduction is permitted which does not comply with these terms.
*Correspondence: Pieter Candry, cGNhbmRyeUB1dy5lZHU=; Jaewook Myung, amphaW15dW5nQGthaXN0LmFjLmty
†These authors have contributed equally to this work and share first authorship
‡Present address: Pieter Candry, Laboratory of Systems and Synthetic Biology, Wageningen University & Research, Wageningen, Netherlands
Disclaimer: All claims expressed in this article are solely those of the authors and do not necessarily represent those of their affiliated organizations, or those of the publisher, the editors and the reviewers. Any product that may be evaluated in this article or claim that may be made by its manufacturer is not guaranteed or endorsed by the publisher.
Research integrity at Frontiers
Learn more about the work of our research integrity team to safeguard the quality of each article we publish.