 Yen-Cheng Yeh
 Bernard Haasdonk
 Ulrike Schmid-Staiger
 Matthias Stier1,2
- 1Fraunhofer Institute for Interfacial Engineering and Biotechnology IGB, Stuttgart, Germany
- 2Institute of Interfacial Process Engineering and Plasma Technology, University of Stuttgart, Stuttgart, Germany
- 3Institute of Applied Analysis and Numerical Simulation, University of Stuttgart, Stuttgart, Germany
Introduction: The Bouguer-Lambert-Beer law is widely used as the fundamental equation for quantification in absorption spectroscopy. However, deviations from the Bouguer-Lambert-Beer law have also been observed, such as chemical deviation and light scattering effect. While it has been proven and shown that the Bouguer-Lambert-Beer law is valid only under very restricted limitations, there are only a few alternatives of analytical models to this law. Based on the observation in the experiments, we propose a novel model to solve the problem of chemical deviation and light scattering effect.
Methods: To test the proposed model, a systematic verification was conducted using potassium dichromate solutions and two types of microalgae suspensions with varying concentrations and path lengths.
Results: Our proposed model demonstrated excellent performance, with a correlation coefficient (
Discussion: This work provides a powerful tool for chemical analysis and especially for the quantification of microorganisms, such as the concentration of biomass or intracellular biomolecules. Not only the high accuracy but also the simplicity of the model makes it a practical alternative to the existing Bouguer-Lambert-Beer law.
1 Introduction
After R. Luthar proposed the modern form of the Bouguer-Lambert-Beer (BLB) law in 1913 (Mayerhöfer et al., 2020), it has been applied as the essential equation for concentration quantification in various fields such as analytical chemistry, atmospheric physics, microbiology, etc. (Ingle & Crouch, 1988; Perkampus, 2013; Skoog et al., 2013; Skoog et al., 2017; Kirchman & Gasol, 2018; Thomas & Burgess, 2022). Although it has been referred to as a “law,” it is known that this equation is a limited law (Perkampus, 2013) and is not compatible with Maxwell’s equations (Mayerhöfer et al., 2016; Mayerhöfer et al., 2020). Meanwhile, various deviations of the BLB law have been reported and observed in different fields (Duyens, 1956; Emile LeBlanc et al., 2011; Mayerhöfer et al., 2019; Li et al., 2014; Mäntele & Deniz, 2017; Ruddy, 1994).
In this work, we focus on the chemical deviation and light scattering effect. The chemical deviation mentioned in this work refers specifically to the apparent deviation of the BLB law due to chemical equilibria. This chemical deviation occurs when the individual concentrations of the chemical forms existing in the analyte are not linear with respect to the total concentration of the analyte and the absorption coefficients of these chemical forms are not identical at the measured wavelength (Burke et al., 1972; Burke & Mavrodineanu, 1977; Ingle & Crouch, 1988). There are other types of chemical deviations, such as deviation due to high concentration (Ingle & Crouch, 1988), which are not in the scope of this work. Additionally, the light scattering effect is another well-known cause of deviation from the BLB law. The term “light scattering effect” used in this work refers to the Mie scattering by microalgae cells, and it has been shown that the BLB law can be used only in the case of single scattering (Hulst and van de Hulst, 1981; Morel & Bricaud, 1981). In the case of multiple scattering, a deviation from the BLB law occurs (Zaccanti & Bruscaglioni, 1988; Garcia-Pichel, 1994; Yun & Park, 2001; Wind & Szymanski, 2002; Mohlenhoff et al., 2005; Geider, 2013) and the radiative transfer equation (RTE) has to be solved using approximations such as Mie theory for microalgae cells (Mueller, 1973; Kitchen & Zaneveld, 1992; Lee et al., 2013; Kandilian et al., 2016; Lehmuskero et al., 2018; Ma, 2021). Compared to the BLB law, which is a simple analytical equation, solving the RTE is time-consuming and unpractical for daily application in absorption measurements.
Due to the simplicity and usefulness of the BLB law, it is still widely used despite the observed deviations. Meanwhile, different extensive models based on the BLB law have been proposed (Fernández et al., 1997; Pottier et al., 2005; Santos-Ballardo et al., 2015; Bhatt et al., 2016; Casasanta & Garra, 2018; Bozdoğan, 2022). Among these models, the so-called modified BLB law is the most widely used in near-infrared (NIR) spectroscopy, where an intercept term was added to the classical BLB law to compensate for the deviation (Brown et al., 1982; Haaland et al., 1985; Delpy et al., 1988; Sassaroli & Fantini, 2004; Kocsis et al., 2006; Scholkmann et al., 2014). In this paper, we propose a novel analytical model for non-linear absorbance by adding two exponents to the classical BLB law:
Here
Based on two additional correction coefficients
2 Materials and methods
To test the performance of the proposed model and compare it with the BLB law, separate absorbance measurement series were performed with potassium dichromate solutions and microalgae suspensions. In addition, the absorbance measurements of pure pigments cholorophyll a and fucoxanthin were conducted for comparison with the measurements of microalgae. The potassium dichromate with a purity of greater than 99.5% was purchased from the manufacturer Merck, Germany. The two microalgae P. tricornutum SAG 1090-1b and C. vulgaris SAG 211-12 were obtained from the Culture Collection of Algae at Göttingen (SAG) and cultivated in flat-panel airlift (FPA) photobioreactors (PBR) with a volume of 6 L. Cultivations were conducted with artificial illumination by LED panels. The FPA-PBRs are equipped with Siemens PLC units to control light intensity, temperature, pH value, and substrate feeding. Phaeodactylum tricornutum was cultivated in a modified Mann and Myers medium (Meiser et al., 2004), maintaining the temperature at 20°C ± 1°C, pH value at 7.3 ± 0.1, and under sufficient illumination. Chlorella vulgaris was cultivated in a modified DSN medium (Münkel et al., 2013), keeping the temperature at 25°C ± 1°C, pH value at 6.8 ± 0.1, and under sufficient illumination. In addition, ammonium and phosphate solutions were added as nutrient sources during cultivation.
The potassium dichromate solutions and microalgae suspensions were prepared on a weight/volume basis for their concentrations. Three top-loading balances from the manufacturer Sartorius (Germany) were used for the weighings in this work, including the E2000D (readability: 1 mg), the ENTRIS224I-1S (readability: 0.1 mg), and the MSA225S-1CE-DI (readability: 0.01 mg), which are calibrated once a year. The volumetric flasks and pipettes were previously calibrated with double-distilled water (ddH2O) to ensure accuracy. All preparations were conducted at a room temperature of 20°C–22°C. The details of the preparations and spectral measurement procedures are described in the following.
2.1 Measurement setups of concentration and path length
It is important to evaluate and choose appropriate setups of concentration and path length for absorbance measurements because they will determine the dynamics of absorbance measurements. A path length of 1 cm is widely used in most of the studies for UV-Vis absorbance measurement, and the concentration range should be selected in a linear range, where the BLB law can be applied. To reexamine the validity of the BLB law and compare it with our proposed model, we chose the setups of concentration and path length within the absorbance range, that the BLB model was proven to be valid with a constant path of 1 cm. We designed systematic setups with various combinations of concentration and path length (1, 0.5, 0.2, and 0.1 cm), as shown in Tables 1, 2. For the setups of potassium dichromate (Table 1), the absorbances of the subsamples No. 1 and 5 are known to be linear with the same path length of 1 cm under various wavelengths (Burke & Mavrodineanu, 1977). Subsamples No. 1 to 4 were designed to have the same product (
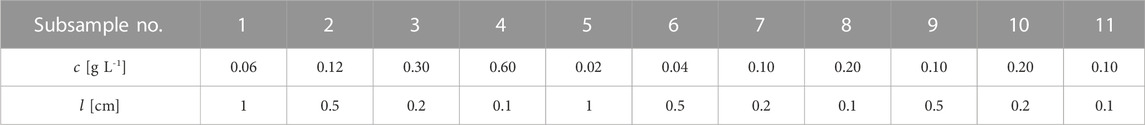
TABLE 1. The setups of concentration (
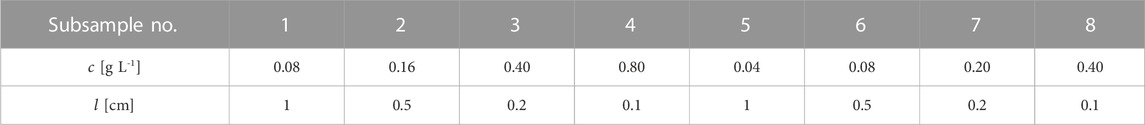
TABLE 2. The setups of concentration (
2.2 Preparation of potassium dichromate solutions
The medium used for potassium dichromate was 0.001 N perchloric acid, which was diluted from a stock solution of perchloric acid (density = 1.53 kg L-1, weight percentage = 60%, Producer: Merck, Germany) with double-distilled water in a volumetric flask. The potassium dichromate powder was weighed and dissolved in 0.001 N perchloric acid in volumetric flasks to prepare 1,000 mg L-1 and 100 mg L-1 stock solutions. These stock solutions were further diluted to prepare eleven subsamples with the designed concentrations shown in Table 1. Pipettes and falcon tubes were used for these further dilutions of stock solutions. Three sets of aforementioned stock solutions of potassium dichromate were prepared separately to repeat the absorbance measurements of the subsamples.
2.3 Preparation of microalgae suspensions
Fresh algae cultures taken from the PBRs were first dewatered by centrifugation at 4000 RPM for 10 min and then re-suspended in 0.9% NaCl solution. This process of dewatering and re-suspension was repeated three times to keep the consistency of the sample medium for absorbance measurements. The concentration of the re-suspended sample was determined by the dry weight method. First, 5 mL of the microalgae suspension was placed on a filter paper and washed twice with 5 mL of tap water. After filtering, the filter paper containing the microalgae cells was dried at 105°C (MA35, Satorius, Germany) and weighed. The re-suspended sample was further diluted with 0.9% NaCl solution to obtain subsamples with different concentrations (see Table 2). Pipettes and falcon tubes were used for these dilutions. In the preparation of the suspensions of P. tricornutum and C. vulgaris, the suspensions were prepared individually according to the above procedures.
2.4 Preparation of pigment solutions
Analytical standards of two pigments, chlorophyll a (purity ≥97%) and fucoxanthin (purity ≥95%), were purchased from Sigma-Aldrich (Germany). The pigment solutions (chlorophyll a and fucoxanthin) were prepared separately as described below. First, 1 mg of the pigment powder (pre-weighted by the company) was dissolved in 1 mL of pure ethanol in the glass vial provided by the manufacturer. Then, the pigment solution with a concentration of 1 g L-1 was diluted stepwise in falcon tubes to obtain subsamples with the designed concentrations. The experimental setups of the pigment solutions are almost the same as those of the microalgae suspensions, but with smaller proportions of the concentrations: chlorophyll a at 10% and fucoxanthin at 2.5% of the concentrations shown in Table 2.
2.5 Absorbance measurement procedure
In this work, the absorbance measurements were conducted using a HITACHI U-2900 spectrophotometer with a spectral bandpass of 1.5 nm. The spectrophotometer was calibrated every year, including wavelength accuracy, absence of stray light, baseline deviation, and photometric linearity. To ensure the accuracy and consistency of measurements, the spectrophotometer was warmed up for at least 30 min before measuring. The measurements were performed at a room temperature of 20°C–22°C. The sample cuvettes used were quartz cuvettes (100-QS, Hellma, Germany) with four different light path lengths: 1, 0.5, 0.2, and 0.1 cm.
The spectral measurements for the different materials used in this work were conducted separately. The standard procedure for a measurement run is described as follows. First, the cuvettes were cleaned with 3 M H2SO4 for at least 20 min and rinsed 5 times with double-distilled water. After cleaning, the cuvettes were kept to air dry and then filled with the medium solvent to perform a blank measurement with the setups shown in Table 3. The cuvettes were then cleaned again with 3 M H2SO4 and double-distilled water and kept to air dry. The subsamples (Table 1 or Table 2) were then loaded into the cuvettes and sealed with parafilm to prevent evaporation. Spectral measurements were then conducted using the setups described in Table 3. For each subsample, this spectral scan was repeated three times. For potassium dichromate solutions, three measurement runs were conducted as each potassium dichromate solution was repeatedly prepared three times. For microalgae suspensions and pigment solutions, one measurement run was conducted. Each run of the aforementioned experiment was conducted on the same day.
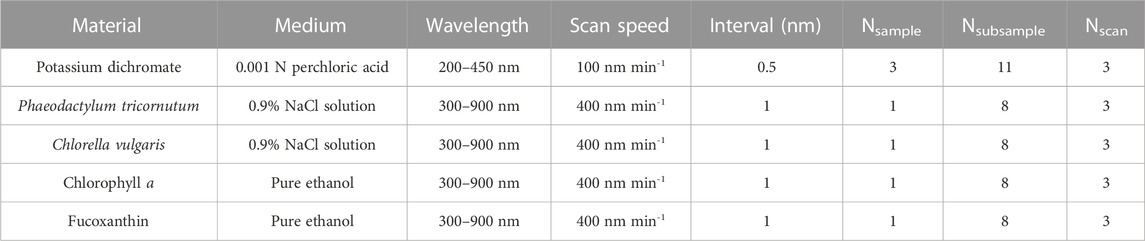
TABLE 3. Experimental setups of absorbance measurements for the potassium dichromate solutions, the microalgae suspensions and the pigment solutions. Nsample is the number of samples prepared repeatedly. Nsubsample is the number of subsamples diluted from the samples as described in Tables 1, 2. Nscan is the number of spectral scans repeated for each subsample.
2.6 Statistics and data analysis
The measured data were first pre-processed to perform a regression with the BLB law and with the proposed model. The first step of pre-processing was to subtract blank measurements to remove the absorption contributed by the medium. The second step was to average the repeated measurements to obtain a single representative spectrum for each subsample array. As mentioned earlier, three sets of potassium dichromate solutions were prepared separately, and the measurement was repeated three times for each set. Therefore, each subsample of potassium dichromate solution in Table 1 contains a total of nine absorption spectra, which were averaged for later use. For microalgae suspensions and pigment solutions, each subsample in Table 2 has three absorption spectra that were also averaged. These representative spectra were then used to fit the equations of the BLB law and the proposed model, as in Eqs. 2, 3.
Bouguer-Lambert-Beer (BLB) law:
Here
The proposed model:
Here
The software Matlab R2022a (MathWorks, Uunited States) was used to solve the regression problem in this work, which contains three-dimensional data points (output:
Here
Here
Here
3 Results and discussion
To evaluate our proposed model and compare it with the BLB law, we conducted systematic experiments with potassium dichromate solutions and two microalgae suspensions. We used the criterion
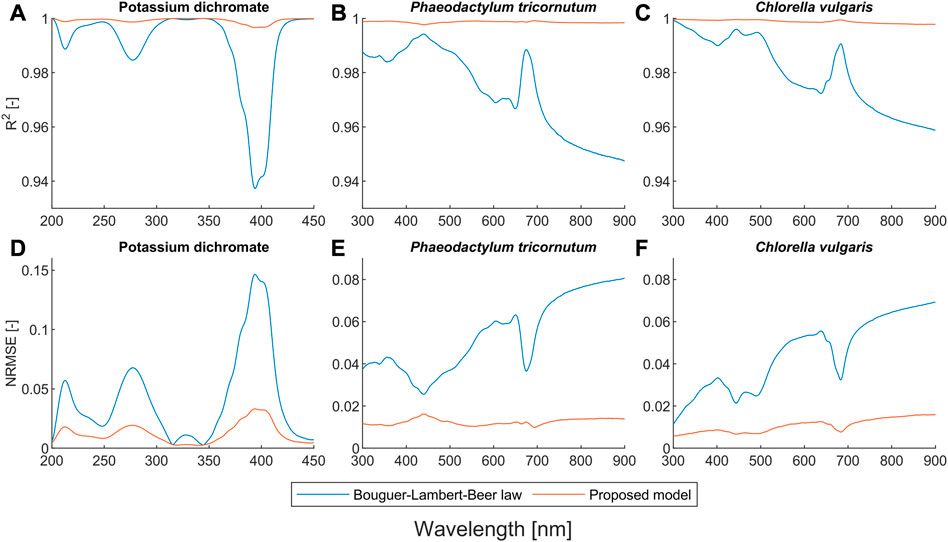
FIGURE 1. Quantitative comparison of the Bouguer-Lambert-Beer law and the proposed model in terms of
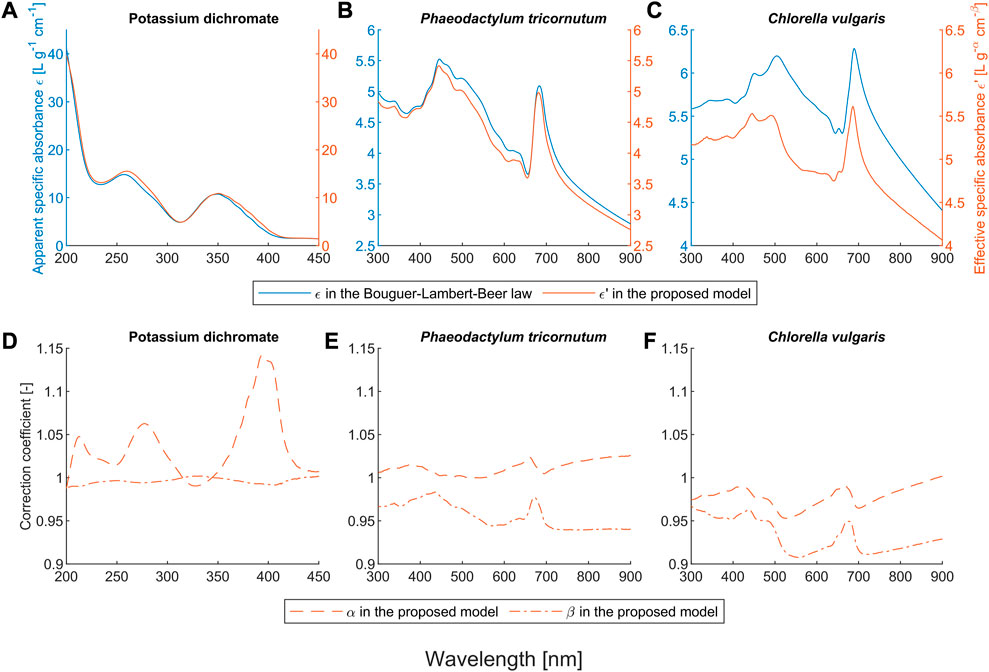
FIGURE 2. Obtained coefficients of the Bouguer-Lambert-Beer law and the proposed model for the potassium dichromate solutions and the microalgae suspensions. Here,
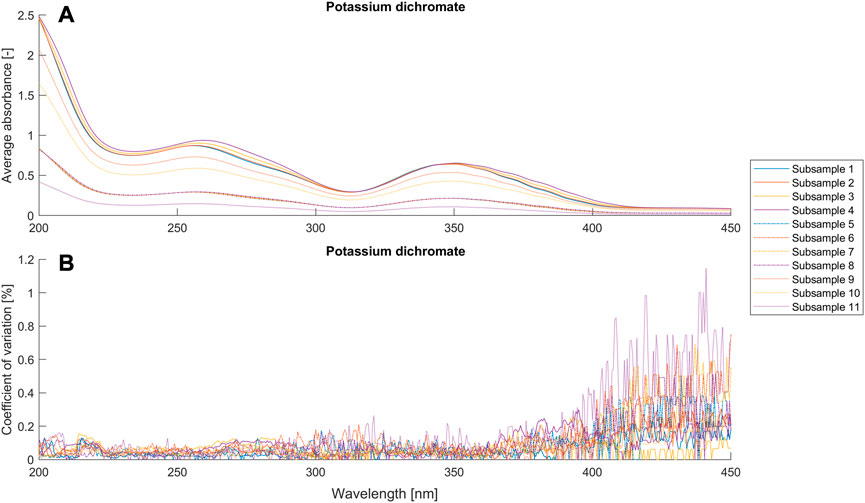
FIGURE 3. Average absorbance and coefficient of variance (n = 9) for different setups (Table 1) of the potassium dichromate solutions.
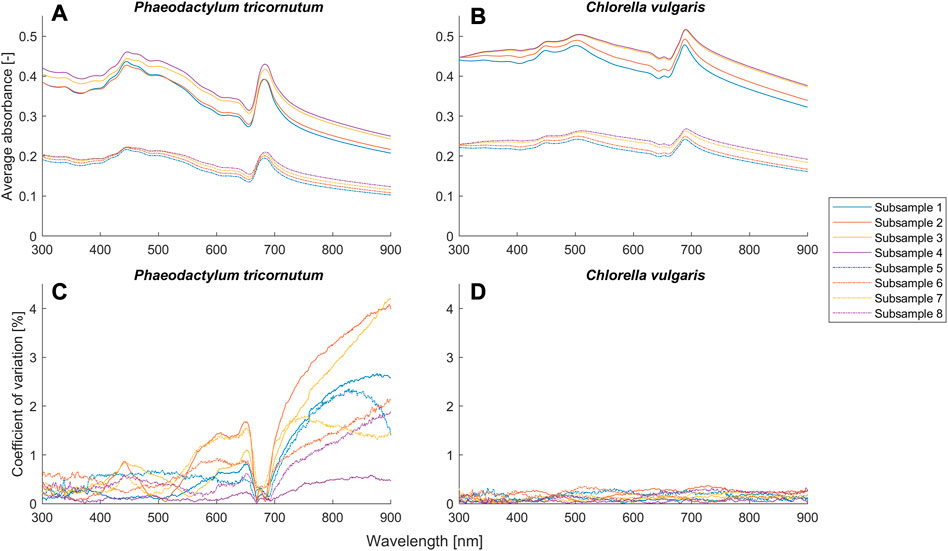
FIGURE 4. Average absorbance and coefficient of variance (n = 3) for different setups (Table 2) of the suspensions of Phaeodactylum tricornutum and Chlorella vulgaris.
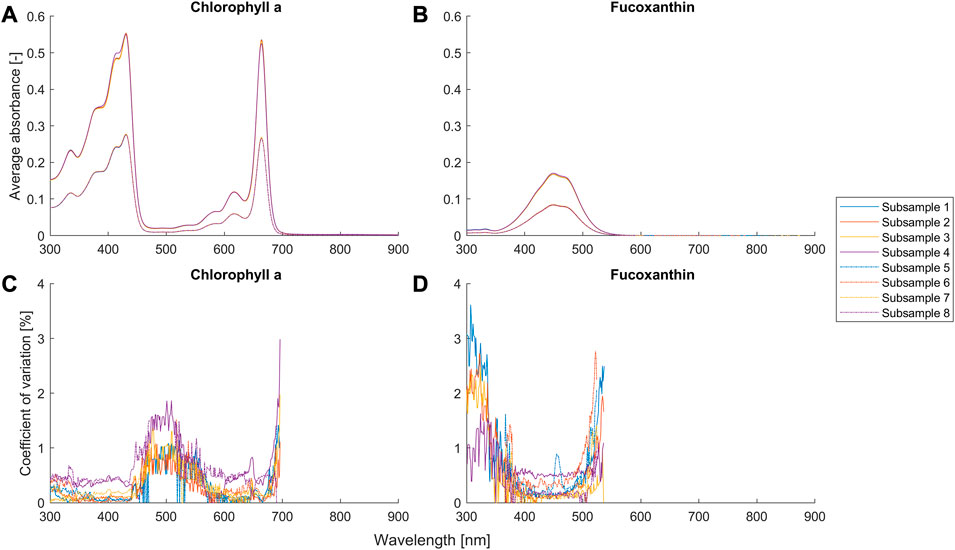
FIGURE 5. Average absorbance and coefficient of variance (n = 3) for different setups (Table 2) of the suspensions of chlorophyll a and fucoxanthin. The coefficient of variation with an average absorbance smaller than 0.01 is removed and not shown in the figures, because the signal-to-noise ratio is too small and the reflected error becomes not meaningful.
3.1 Chemical deviation
Figures 1A, D show that the proposed model outperforms the BLB law for potassium dichromate solutions with an
The equilibrium equation of the potassium dichromate solutions with weakly acidic media, as used in this work, is given in the equation below.
Here, the dimerization of the monomer,
Potassium dichromate is used as a reference standard to calibrate the linearity of UV-vis spectrophotometers (Burke & Mavrodineanu, 1977). This linearity is only valid within the linear range and the path length should be constant. Another common application of potassium dichromate is serving as an oxidizing agent in various reactions, where the change of chromium form can be determined by UV-visible spectroscopy and the concentration of the target analyte can be calculated. One example of this application is the chemical oxygen demand (COD) analysis, in which the wavelength 440 (435) nm is widely used for the detection of dichromate and 610 (600) nm for Cr3+ (Thomas et al., 2017). As shown in Figure 2D, the selection of 440 (435) is a very smart choice, because both
3.2 Light scattering effect
Our proposed model also outperforms the BLB law for scattering microalgae suspensions, as shown in Figures 1B, C, E, F. Unlike the deviation caused by chemical equilibria, the values of both α and β for microalgae suspensions mostly deviate from one (see Figures 2E, F). The deviation of the BLB law also causes the error in using linear scaling or standardization of spectra, which is commonly used for pre-processing spectral data (Craig et al., 2006; Rinnan et al., 2009; Yao & Lewis, 2010; Gholizadeh et al., 2016; Mishra et al., 2020). To demonstrate this effect, we examined the spectra of scattering microalgae suspensions and non-scattering pigment solutions, the experimental setups of which are given in Table 2. We scaled the spectra of subsamples No. 5 to 8 by a factor of 2 and plotted them together with the spectra of subsamples No. 1 to 4 in Figure 6. This is because the concentrations of subsample No. 5 to 8 are each half that of subsamples No. 1 to 4, respectively. Moreover, the product (
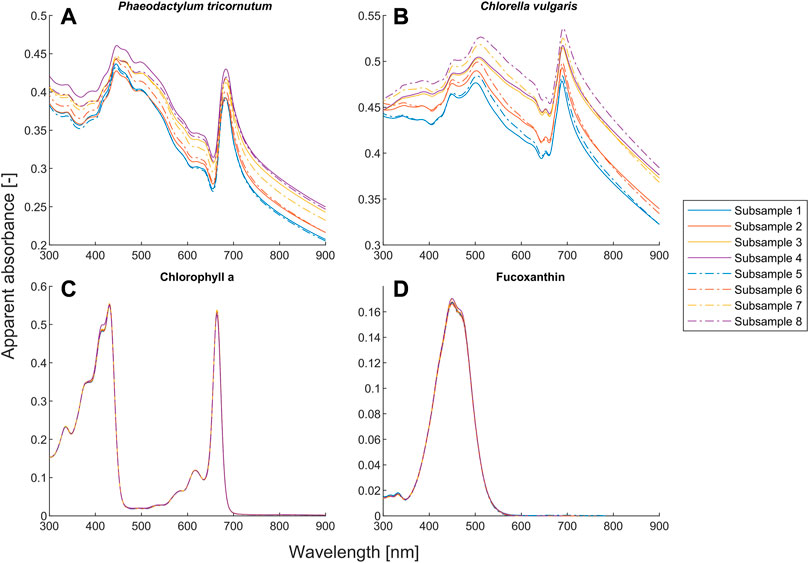
FIGURE 6. Quantitative comparison of the absorption spectra for the suspensions of Phaeodactylum tricornutum and Chlorella vulgaris and the solutions of chlorophyll a and fucoxanthin. The absorption spectra of subsamples No. 5 to 8 were scaled by a factor of 2 for comparison purpose. The spectra with the same path length are given in the same color. The setups of the subsamples are given in Table 2.
Unlike the microalgae suspensions, the results in Figures 6C, D show that the BLB law is indeed valid for pure pigment solutions because all the spectra with the same
A closer look at
It is known that the BLB law is only valid for single scattering. A common criterion for single scattering is the optical depth
4 Conclusion
In this work, we propose a powerful empirical model as an alternative to the BLB law for the quantification of absorption spectroscopy. Our results show that the proposed model is much more accurate than the BLB law in terms of
Data availability statement
The datasets presented in this study can be found in online repositories. The names of the repository/repositories and accession number(s) can be found below: https://doi.org/10.5281/zenodo.7271619.
Author contributions
Y-CY contributed to the conceptualization, methodology, analysis, validation, visualization, and first draft writing of the study. US-S contributed to the conceptualization, supervision, interpretation, and resources of the study. BH and MS contributed to the methodology and supervision of the study. GT contributed to project administration, resources, and supervision of the study. All authors contributed to the manuscript revision, read, and approved the submitted version.
Funding
During this work, Y-CY was funded by a Ph.D. scholarship (AZ 20017/498) from the German Federal Environmental Foundation (Deutsche Bundesstiftung Umwelt DBU).
Conflict of interest
The authors declare that the research was conducted in the absence of any commercial or financial relationships that could be construed as a potential conflict of interest.
Publisher’s note
All claims expressed in this article are solely those of the authors and do not necessarily represent those of their affiliated organizations, or those of the publisher, the editors and the reviewers. Any product that may be evaluated in this article, or claim that may be made by its manufacturer, is not guaranteed or endorsed by the publisher.
References
Bhatt, M., Ayyalasomayajula, K. R., and Yalavarthy, P. K. (2016). Generalized Beer–Lambert model for near-infrared light propagation in thick biological tissues. J. Biomed. Opt. 21 (7), 076012. doi:10.1117/1.JBO.21.7.076012
Bozdoğan, A. E. (2022). Polynomial equations based on bouguer–lambert and beer laws for deviations from linearity and absorption flattening. J. Anal. Chem. 77 (11), 1426–1432. doi:10.1134/S1061934822110028
Brown, C. W., Lynch, P. F., Obremski, R. J., and Lavery, D. S. (1982). Matrix representations and criteria for selecting analytical wavelengths for multicomponent spectroscopic analysis. Anal. Chem. 54 (9), 1472–1479. doi:10.1021/ac00246a007
Buijs, K., and Maurice, M. J. (1969). Some considerations on apparent deviations from Lambert-Beer’s law. Anal. Chim. Acta 47 (3), 469–474. doi:10.1016/S0003-2670(01)95647-8
Burke, R. W., Deardorff, E. R., and Menis, O. (1972). Liquid absorbance standards. J. Res. Natl. Bur. Stand A Phys. Chem. 76A (5), 469–482. doi:10.6028/jres.076A.041
Burke, R. W., and Mavrodineanu, R. (1977). Certification and use of acidic potassium dichromate solutions as an ultraviolet absorbance standard SRM 935. Maryland: U.S. Department of Commerce, National Bureau of Standards.
Casasanta, G., and Garra, R. (2018). Towards a generalized beer-lambert law. Fractal Fract. 2 (1), 8. doi:10.3390/fractalfract2010008
Craig, A., Cloarec, O., Holmes, E., Nicholson, J. K., and Lindon, J. C. (2006). Scaling and normalization effects in NMR spectroscopic metabonomic data sets. Anal. Chem. 78 (7), 2262–2267. doi:10.1021/ac0519312
Delpy, D. T., Cope, M., Zee, P., Arridge, S., Wray, S., and Wyatt, J. (1988). Estimation of optical pathlength through tissue from direct time of flight measurement. Phys. Med. Biol. 33 (12), 1433–1442. doi:10.1088/0031-9155/33/12/008
Dere, Ş., Güneş, T., and Sivaci, R. (1998). Spectrophotometric determination of chlorophyll—a, B and TotalCarotenoid contents of some algae species using different solvents. Botany 22 (1), 13–17.
Duyens, L. N. M. (1956). The flattering of the absorption spectrum of suspensions, as compared to that of solutions. Biochimica Biophysica Acta 19, 1–12. doi:10.1016/0006-3002(56)90380-8
Emile LeBlanc, S., Atanya, M., Burns, K., and Munger, R. (2011). Quantitative impact of small angle forward scatter on whole blood oximetry using a Beer–Lambert absorbance model. Analyst 136 (8), 1637–1643. doi:10.1039/C0AN00996B
Eriksen, N. T., and Iversen, J. J. L. (1995). On-line determination of pigment composition and biomass in cultures of microalgae. Biotechnol. Tech. 9 (1), 49–54. doi:10.1007/BF00153000
Fernández, F. G. A., Camacho, F. G., Pérez, J. A. S., Sevilla, J. M. F., and Grima, E. M. (1997). A model for light distribution and average solar irradiance inside outdoor tubular photobioreactors for the microalgal mass culture. Biotechnol. Bioeng. 55 (5), 701–714. doi:10.1002/(SICI)1097-0290(19970905)55:5<701::AID-BIT1>3.0.CO;2-F
Garcia-Pichel, F. (1994). A model for internal self-shading in planktonic organisms and its implications for the usefulness of ultraviolet sunscreens. Limnol. Oceanogr. 39 (7), 1704–1717. doi:10.4319/lo.1994.39.7.1704
Geider, R. (2013). Algal photosynthesis. Berlin/Heidelberg, Germany: Springer Science and Business Media.
Gholizadeh, A., Borůvka, L., Saberioon, M. M., Kozák, J., Vašát, R., and Němeček, K. (2016). Comparing different data preprocessing methods for monitoring soil heavy metals based on soil spectral features. Soil Water Res. 10 (4), 218–227. doi:10.17221/113/2015-SWR
Haaland, D. M., Easterling, R. G., and Vopicka, D. A. (1985). Multivariate least-squares methods applied to the quantitative spectral analysis of multicomponent samples. Appl. Spectrosc. 39 (1), 73–84. doi:10.1366/0003702854249376
Hulst, H. C., and van de Hulst, H. C. (1981). Light scattering by small particles. Massachusetts, United States: Courier Corporation.
Ingle, J., and Crouch, S. R. (1988). Spectrochemical analysis. Available at: https://www.osti.gov/biblio/5298199.
Jeffrey, S. W., Mantoura, R. F. C., Wright S. W., and International Council of Scientific Unions, and Unesco (Editors) (1997). Phytoplankton pigments in oceanography: Guidelines to modern methods (Paris, France: UNESCO Publishing).
Kandilian, R., Soulies, A., Pruvost, J., Rousseau, B., Legrand, J., and Pilon, L. (2016). Simple method for measuring the spectral absorption cross-section of microalgae. Chem. Eng. Sci. 146, 357–368. doi:10.1016/j.ces.2016.02.039
Kirchman, D. L., and Gasol, J. M. (2018). Microbial ecology of the oceans. New York, United States: John Wiley and Sons.
Kitchen, J. C., and Zaneveld, J. R. V. (1992). A three-layered sphere model of the optical properties of phytoplankton. Limnol. Oceanogr. 37 (8), 1680–1690. doi:10.4319/lo.1992.37.8.1680
Kocsis, L., Herman, P., and Eke, A. (2006). The modified Beer–Lambert law revisited. Phys. Med. Biol. 51 (5), N91–N98. doi:10.1088/0031-9155/51/5/N02
Lee, E., Heng, R.-L., and Pilon, L. (2013). Spectral optical properties of selected photosynthetic microalgae producing biofuels. J. Quantitative Spectrosc. Radiat. Transf. 114, 122–135. doi:10.1016/j.jqsrt.2012.08.012
Lehmuskero, A., Skogen Chauton, M., and Boström, T. (2018). Light and photosynthetic microalgae: A review of cellular- and molecular-scale optical processes. Prog. Oceanogr. 168, 43–56. doi:10.1016/j.pocean.2018.09.002
Li, S., Cheng, X., Mei, P., Lu, S., Yang, H., and Zhang, H. (2014). Multiple scattering of light transmission in a smoke layer. Optik 125 (9), 2185–2190. doi:10.1016/j.ijleo.2013.10.040
Ma, C. Y. (2021). Determination of the scaling characteristics of time-dependent optical properties of microalgae using electromagnetic scattering. J. Phys. Commun. 5 (1), 015016. doi:10.1088/2399-6528/abdb4b
Mäntele, W., and Deniz, E. (2017). UV–VIS absorption spectroscopy: Lambert-Beer reloaded. Spectrochimica Acta Part A: Mol. Biomol. Spectrosc. 173, 965–968. doi:10.1016/j.saa.2016.09.037
Mayerhöfer, G. T., Höfer, S., and Popp, J. (2019). Deviations from Beer’s law on the microscale – nonadditivity of absorption cross sections. Phys. Chem. Chem. Phys. 21 (19), 9793–9801. doi:10.1039/C9CP01987A
Mayerhöfer, T. G., Mutschke, H., and Popp, J. (2016). Employing theories far beyond their limits—the case of the (boguer-) beer–lambert law. ChemPhysChem 17 (13), 1948–1955. doi:10.1002/cphc.201600114
Mayerhöfer, T. G., Pahlow, S., and Popp, J. (2020). The bouguer-beer-lambert law: Shining light on the obscure. ChemPhysChem 21 (18), 2029–2046. doi:10.1002/cphc.202000464
Meiser, A., Schmid-Staiger, U., and Trösch, W. (2004). Optimization of eicosapentaenoic acid production by Phaeodactylum tricornutumin the flat panel airlift (FPA) reactor. J. Appl. Phycol. 16 (3), 215–225. doi:10.1023/B:JAPH.0000048507.95878.b5
Mishra, P., Biancolillo, A., Roger, J. M., Marini, F., and Rutledge, D. N. (2020). New data preprocessing trends based on ensemble of multiple preprocessing techniques. TrAC Trends Anal. Chem. 132, 116045. doi:10.1016/j.trac.2020.116045
Mohlenhoff, B., Romeo, M., Diem, M., and Wood, B. R. (2005). Mie-type scattering and non-beer-lambert absorption behavior of human cells in infrared microspectroscopy. Biophysical J. 88 (5), 3635–3640. doi:10.1529/biophysj.104.057950
Morel, A., and Bricaud, A. (1981). Theoretical results concerning light absorption in a discrete medium, and application to specific absorption of phytoplankton. Deep Sea Res. Part A. Oceanogr. Res. Pap. 28 (11), 1375–1393. doi:10.1016/0198-0149(81)90039-X
Mueller, J. L. (1973). The influence of phytoplankton on ocean color spectra. Corvallis, United States: Oregon State University.
Münkel, R., Schmid-Staiger, U., Werner, A., and Hirth, T. (2013). Optimization of outdoor cultivation in flat panel airlift reactors for lipid production by Chlorella vulgaris. Biotechnol. Bioeng. 110 (11), 2882–2893. doi:10.1002/bit.24948
Perkampus, H.-H. (2013). UV-VIS spectroscopy and its applications. Berlin/Heidelberg, Germany: Springer Science and Business Media.
Pottier, L., Pruvost, J., Deremetz, J., Cornet, J.-F., Legrand, J., and Dussap, C. g. (2005). A fully predictive model for one-dimensional light attenuation by Chlamydomonas reinhardtii in a torus photobioreactor. Biotechnol. Bioeng. 91 (5), 569–582. doi:10.1002/bit.20475
Rinnan, Å., Berg, F. van den, and Engelsen, S. B. (2009). Review of the most common pre-processing techniques for near-infrared spectra. TrAC Trends Anal. Chem. 28 (10), 1201–1222. doi:10.1016/j.trac.2009.07.007
Ruddy, V. P. (1994). Nonlinearity of absorbance with sample concentration and path length in evanescent wave spectroscopy using optical fiber sensors. Opt. Eng. 33 (12), 3891–3894. doi:10.1117/12.187023
Santos-Ballardo, D. U., Rossi, S., Hernández, V., Gómez, R. V., del Carmen Rendón-Unceta, M., Caro-Corrales, J., et al. (2015). A simple spectrophotometric method for biomass measurement of important microalgae species in aquaculture. Aquaculture 448, 87–92. doi:10.1016/j.aquaculture.2015.05.044
Sassaroli, A., and Fantini, S. (2004). Comment on the modified Beer–Lambert law for scattering media. Phys. Med. Biol. 49 (14), N255–N257. doi:10.1088/0031-9155/49/14/N07
Scholkmann, F., Kleiser, S., Metz, A. J., Zimmermann, R., Mata Pavia, J., Wolf, U., et al. (2014). A review on continuous wave functional near-infrared spectroscopy and imaging instrumentation and methodology. NeuroImage 85, 6–27. doi:10.1016/j.neuroimage.2013.05.004
Skoog, D. A., Holler, F. J., and Crouch, S. R. (2017). Principles of instrumental analysis. Massachusetts, United States: Cengage Learning.
Skoog, D. A., West, D. M., Holler, F. J., and Crouch, S. R. (2013). Fundamentals of analytical chemistry. Massachusetts, United States: Cengage Learning.
Thomas, O., and Burgess, C. (2022). UV-visible spectrophotometry of waters and soils. Amsterdam, Netherlands: Elsevier.
Thomas, O., Causse, J., and Thomas, M.-F. (2017). “Chapter 4—aggregate organic constituents,” in UV-visible spectrophotometry of water and wastewater. Editors O. Thomas, and C. Burgess Second Edition (Amsterdam, Netherlands: Elsevier), 139–162.
Wang, L.-J., Fan, Y., Parsons, R., Hu, G.-R., Zhang, P.-Y., and Li, F.-L. (2018). A rapid method for the determination of fucoxanthin in diatom. Mar. Drugs 16 (1), 33. doi:10.3390/md16010033
Wellburn, A. R. (1994). The spectral determination of chlorophylls a and b, as well as total carotenoids, using various solvents with spectrophotometers of different resolution. J. Plant Physiology 144 (3), 307–313. doi:10.1016/S0176-1617(11)81192-2
Wind, L., and Szymanski, W. W. (2002). Quantification of scattering corrections to the Beer-Lambert law for transmittance measurements in turbid media. Meas. Sci. Technol. 13 (3), 270–275. doi:10.1088/0957-0233/13/3/306
Yao, H., and Lewis, D. (2010). “Spectral preprocessing and calibration techniques,” in Hyperspectral imaging for food quality analysis and control. Editor D.-W. Sun (Massachusetts, United States: Academic Press), 45–78.
Yun, Y.-S., and Park, J. (2001). Attenuation of monochromatic and polychromatic lights in Chlorella vulgaris suspensions. Appl. Microbiol. Biotechnol. 55 (6), 765–770. doi:10.1007/s002530100639
Keywords: Bouguer-Lambert-Beer law, absorption spectroscopy, microalgae, light scattering, potassium dichromate, chemical deviation
Citation: Yeh Y-C, Haasdonk B, Schmid-Staiger U, Stier M and Tovar GEM (2023) A novel model extended from the Bouguer-Lambert-Beer law can describe the non-linear absorbance of potassium dichromate solutions and microalgae suspensions. Front. Bioeng. Biotechnol. 11:1116735. doi: 10.3389/fbioe.2023.1116735
Received: 05 December 2022; Accepted: 06 March 2023;
Published: 16 March 2023.
Edited by:
Norio Nagao, Blue Scientific Shinkamitgoto Co., Ltd., JapanReviewed by:
Carlos Eduardo De Farias Silva, Federal University of Alagoas, BrazilTomoyo Katayama, The University of Tokyo, Japan
Copyright © 2023 Yeh, Haasdonk, Schmid-Staiger, Stier and Tovar. This is an open-access article distributed under the terms of the Creative Commons Attribution License (CC BY). The use, distribution or reproduction in other forums is permitted, provided the original author(s) and the copyright owner(s) are credited and that the original publication in this journal is cited, in accordance with accepted academic practice. No use, distribution or reproduction is permitted which does not comply with these terms.
*Correspondence: Yen-Cheng Yeh, eWVuLWNoZW5nLnllaEBpZ2IuZnJhdW5ob2Zlci5kZQ==