 Yi Ai1,2
 Jiong Ma
 Yao Yu
- 1State Key Laboratory of Genetic Engineering, School of Life Sciences, Fudan University, Shanghai, China
- 2Shanghai Engineering Research Center of Industrial Microorganisms, Fudan University, Shanghai, China
- 3Key Laboratory of Micro and Nano Photonic Structures (Ministry of Education), Shanghai Engineering Research Center of Ultra-precision Optical Manufacturing, Department of Optical Science and Engineering, School of Information Science and Technology, Fudan University, Shanghai, China
K. marxianus is a promising cell factory for producing heterologous proteins. Oxidative stresses were raised during overexpression of heterologous proteins, leading to the shift of the redox state. How to measure the redox state of live K. marxianus cells without perturbing their growth remains a big challenge. Here, a fluorescence lifetime imaging (FLIM)-based method was developed in live K. marxianus cells. During the early exponential growth, K. marxianus cells exhibited an increased mean fluorescence lifetime (τ-mean) of NAD(P)H compared with Saccharomyces cerevisiae cells, which was consistent with the preference for respiration in K. marxianus cells and that for fermentation in S. cerevisiae cells. Upon oxidative stresses induced by high temperature or H2O2, K. marxianus cells exhibited an increased τ-mean in company with decreased intracellular NAD(P)H/NAD(P)+, suggesting a correlation between an increased τ-mean and a more oxidized redox state. The relationship between τ-mean and the expression level of a heterologous protein was investigated. There was no difference between the τ-means of K. marxianus strains which were not producing a heterologous protein. The τ-mean of a strain yielding a high level of a heterologous protein was higher than that of a low-yielding strain. The results suggested the potential application of FLIM in the non-invasive screen of high-yielding cells.
Introduction
K. marxianus is a promising microbial cell factory for producing heterologous proteins, bioethanol and bulk chemicals (Karim et al., 2020; Leonel et al., 2021). During the production of heterologous proteins, yeast faces various extracellular disturbances, including high temperature, high salt and abnormal pH, which imbalance the redox state of yeast cells (Qiu et al., 2019). For example, high temperature increases the production of intracellular reactive oxygen species (ROS), causing oxidative stress to the yeast (Fu et al., 2019). A high concentration of salt disturbs redox homeostasis, leading to oxidative damage (Ramos-Moreno et al., 2019). Meanwhile, oxidative stresses are invoked endogenously during the overexpression of heterologous proteins, because the increased demand for NAD(P)H is raised in different steps of protein production, including amino acid biosynthesis (Zhu et al., 2021), disulfide bond formation (Miller et al., 2018), and protein secretion (Tomàs-Gamisans et al., 2020). Therefore, measuring the redox state of live K. marxianus cells might be applied to monitor the production of heterologous proteins upon various disturbances.
Chemical and optical methods have been developed to assess the redox state of cells. Chemical methods indirectly infer the redox state of the cell mainly by measuring the concentration of redox pairs such as NAD(P)H/NAD(P)+ (Wang et al., 2017). Optical methods include fluorescent biosensors and autofluorescence methods. Fluorescent biosensors assess redox status at the single-cell level by transferring fluorescent protein-encoding genes (Liao et al., 2020). Using NAD(P)H autofluorescence to assess cellular redox status emerges as a promising method in recent years, as it enables endogenous noninvasive indication of the redox status. NAD(P)H displays a maximum autofluorescence emission wavelength at 450–535 nm when using the single-photon excitation at 340 nm (Cannon et al., 2021). Fluorescence lifetime imaging (FLIM) measures the mean fluorescence lifetime (τ-mean) of NAD(P)H. The lifetime (τ) of free NAD(P)H (τ-free) is usually fixed at about 0.4 ns The τ of bound NAD(P)H (τ-bound) varies with different combined proteins and is usually around 1–4 ns (Schaefer et al., 2019). The ratio of free NAD(P)H and bound NAD(P)H to the total intracellular NAD(P)H is defined as a1 and a2, respectively (Kolenc and Quinn, 2019). a1/a2 is correlated with NAD(P)H/NAD(P)+, which defines the redox state of cells (Sant’Anna-Silva et al., 2018). Usually, a more oxidized state increases both τ-mean and τ-bound, while reducing a1/a2 (Schaefer et al., 2017; Meleshina et al., 2018). However, there are few reports about the FILM analysis in living yeast cells, including K. marxianus cells (Kong et al., 2022).
In this study, the redox state of K. marxianus cells was assessed by FLIM of NAD(P)H. K. marxianus cells exhibited an increased τ-mean of NAD(P)H compared with S. cerevisiae cells during early exponential growth, which was consistent with different Crabtree-effect statuses of two yeasts. K. marxianus cells exhibited an increased τ-mean upon oxidative stresses induced by high temperature or H2O2, suggesting a correlation between an increased τ-mean and a more oxidized redox state. Notably, an increased τ-mean was correlated the high-level expression of a heterologous protein in K. marxianus cells, which suggested a potential application of FLIM in the non-invasive screen of high-yielding cells.
Materials and methods
Yeast strains and plasmids
The K. marxianus strain FIM-1 (Wu et al., 2020), and the S. cerevisiae strain S288C (Yu et al., 2021), were used in this study. K. marxianus strains KML and KMH were derived from KM-HPV2, which expressed IBDV-VP2 by pUKDN115 (Yang et al., 2021). Plasmid expressing IBDV-VP2 was replaced by the void pUKDN115 in KML and KMH to obtain KMLvoid and KMHvoid, respectively.
Medium and culturing
To compare the redox states of K. marxianus and S. cerevisiae cells, FIM-1 and S288C cells were grown in a YPD medium (20 g/L tryptone, 10 g/L yeast extract, 20 g/L glucose) at 30°C overnight and the culture was diluted into a fresh YPD medium to start at an OD600 of 0.1. Cells were then grown at 30°C for 3 h. To compare redox states at different temperatures, overnight culture of FIM-1 was inoculated into a fresh YPD medium to start at an OD600 of 0.1 and then grown at 30°C or 45°C for 24 h. To perform the H2O2 treatment, FIM-1 cells were grown at 30°C for 24 h and then grown in the presence of 20 mM H2O2 for 1 h. Untreated culture served as a control. To compare redox states during expressing IBDV-VP2, KML and KMH cells were grown in the YD medium (20 g/L yeast extract, 40 g/L glucose) for 3 days. Cells were collected after 1 or 3 days.
Measurement of dissolved oxygen, residual glucose and ethanol
The culture of FIM-1 and S288C was centrifuged and the supernatant was subjected to analysis. The amount of dissolved oxygen was measured by a dissolved oxygen analyzer (JPSJ-605F, Shanghai INESA Scientific Instrument, China) according to the manufacturer’s manual. Residual glucose and ethanol was measured on high-performance liquid chromatography (1260, Agilent, United States) as described before (Ai et al., 2022).
Preparation of yeast cells for fluorescence lifetime imaging
To immobilize yeast cells, 20–25 μl of ConA (10 mg/ml, C2010, Sigma-Aldrich, United States) was spread onto the bottom of a glass-bottom petri dish (801001, NEST, China) and the dish was left to dry overnight at room temperature. Yeast cells were pelleted and resuspended in sterile water to an OD600 of 5. A total of 5 μl sample was transferred to the ConA-coated dish for analysis.
Fluorescence lifetime imaging imaging and data analysis
FLIM was performed by a Leica TCS SP8 DIVE FALCON microscope (Leica, Germany) equipped with a ×63 water immersion objective (N.A. = 1.2) excited by a femtosecond pulsed laser with ∼3 mW power at 740 nm (InSight X3 Dual, Spectra-Physics, United States). The FLIM images were exported in lif format and ROIs were selected for processing in Leica Application Suite X software to obtain fluorescence lifetime data. The sizes of experimental ROIs samples ranged from 52 to 104. The data were fitted using a double exponential model as τ-mean = a1 τ-free + a2 τ-bound (Kong et al., 2022). Statistical analyses were performed by GraphPad-Prism version 8.0 software (GraphPad, United States). As to the significance test, data that did not follow a normal distribution was tested using the nonparametric Mann-Whitney test. Data that followed a normal distribution and satisfied the homogeneity of variances was tested using an unpaired t-test. Otherwise, Welch’s modified unpaired t-test was used.
Measurement of intracellular concentrations of NAD(P)+ and NAD(P)H
Concentrations of intracellular NAD+, NADH, NADP+ and NADPH were determined by a WST-8 based colorimetric assay using commercial kits (S0175 and S0179, Beyotimes, China). To collect cells grown at different temperatures and cells treated with H2O2, FIM-1 cells were cultured as described above in “Medium and culturing”. Cells of 20 OD600 were collected, washed and then suspended in 200 μl extraction buffer provided by the kit. Cells were then mixed with 200 μl acid-washed glass beads (G8772, Sigma-Aldrich, United States) and processed by a bead-beater (FastPrep-24, MP, United States) at 6 m/s for 2 min. The lysate was centrifuged at 13,200 rpm for 10 min at 4°C. A total of 20 and 50 μl supernatant was collected for NAD+/NADH and NADP+/NADPH assay, respectively. Experiments were performed in triplicates and repeated three times. Ratios of NADH/NAD+, NADPH/NADP+ and NAD(P)H/NAD(P)+ were calculated based on the concentrations.
Results
The redox states of K. Marxianus and S. cerevisiae cells could be differentiated by the τ-mean of NAD(P)H
In yeast, the metabolic flow of glucose between ethanol fermentation and aerobic respiration influences the redox state of cells. In ethanol fermentation, 1 molecule of glucose produces 2 molecules of NADH through glycolysis and NADH is subsequently oxidized by ethanol dehydrogenase to regenerate NAD+ (Figure 1A). In comparison, 10 molecules of NADH are produced in aerobic respiration and oxidized by oxidative phosphorylation, which increases the chance to produce reactive oxygen species (ROS) and biases the cell toward a more oxidized state (Scialò et al., 2017) (Figure 1A).
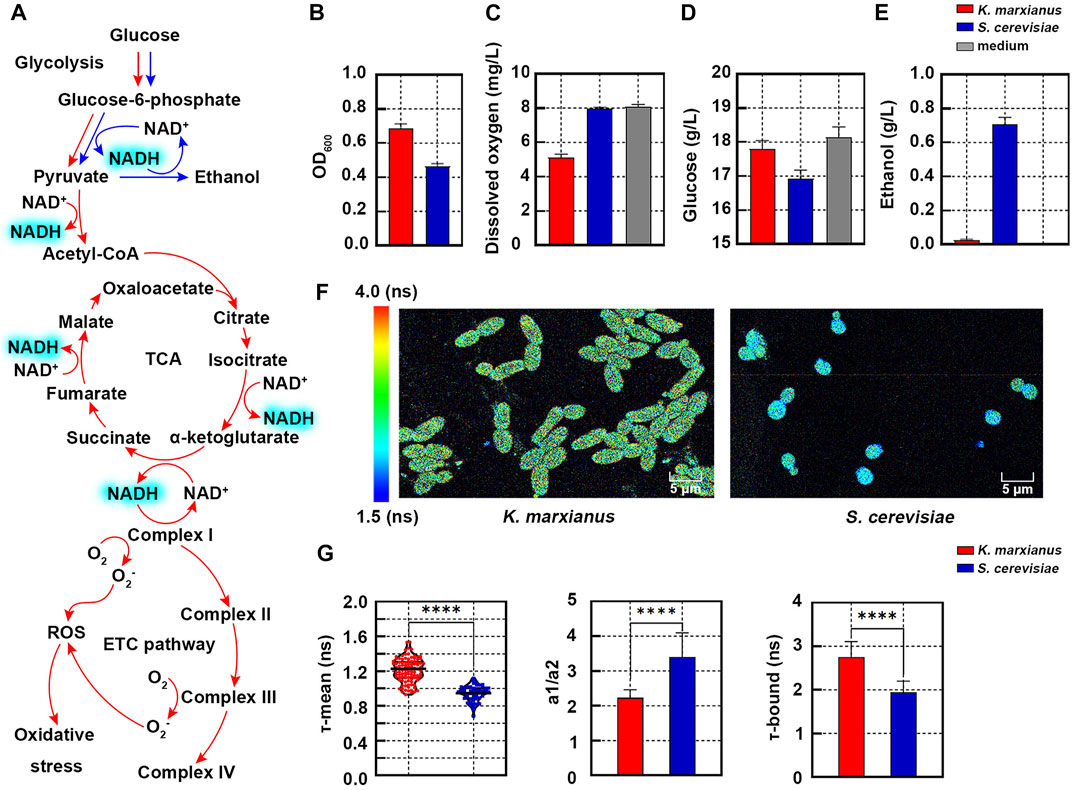
FIGURE 1. Redox states of K. marxianus and S. cerevisiae cells characterized by FLIM. (A) Aerobic respiration (red) and ethanol fermentation (blue) pathways in yeast. (B–E) OD600 (B), dissolved oxygen (C), residual glucose (D) and ethanol (E) in the culture of K. marxianus (FIM-1) and S. cerevisiae (S288C) cells after 3 h of growth. Medium without inoculation served as a control. Values represented mean ± SD (n = 3). (F) FLIM of NAD(P)H in K. marxianus and S. cerevisiae cells after 3 h of growth. Pseudocolor mapping of NAD(P)H fluorescence lifetimes was shown. The lifetime of NAD(P)H from 1.5 to 4.0 ns was assigned different colors. (G) Quantitative analysis of NAD(P)H fluorescence in cells from (F). A violin plot showed the distribution of τ-mean of cells and the mean value was indicated by a black line. Histograms showed a1/a2 and τ-bound, in which values represented mean ± SD. A total of 101 K. marxianus cells and 52 S. cerevisiae cells were counted. ****p < 0.0001.
Metabolic flows of glucose in S. cerevisiae cells (SC228C) and K. marxianus cells (FIM-1) during the early exponential growth were investigated in the first place. After 3 h of growth in the YPD medium (containing 20 g/L glucose), the OD600 of K. marxianus cells was 1.49 times that of S. cerevisiae cells (Figure 1B). Compared with the medium without inoculation, dissolved oxygen in the culture of S. cerevisiae cells decreased by 1.36%, while that of K. marxianus cells decreased by 36.5% (Figure 1C). The amount of glucose consumed by K. marxianus cells was 29% of that by S. cerevisiae cells (Figure 1D). The concentration of ethanol in the culture of S. cerevisiae cells was 0.71 g/L, while there was hardly any ethanol produced by K. marxianus cells (Figure 1E). The results suggested that S. cerevisiae cells preferred fermentation in the aerobic condition with excess glucose, which was consistent with the Crabtree-positive identity of S. cerevisiae (Dai et al., 2018). Meanwhile, results suggested that K. marxianus cells preferentially used respiration in the presence of oxygen and glucose, which was consistent with the Crabtree-negative identity of K. marxianus (Sakihama et al., 2019; Yu et al., 2021). Different ways to assimilate glucose suggested distinct redox states in S. cerevisiae and K. marxianus cells.
To compare the redox states of two yeasts, the fluorescence lifetime of NAD(P)H in cells was analyzed by FLIM. In the pseudocolor mapping of NAD(P)H lifetime, K. marxianus cells displayed yellow-green and S. cerevisiae cells displayed light blue (Figure 1F), suggesting NAD(P)H lifetime of K. marxianus cells was longer. Consistently, τ-means of NAD(P)H in K. marxianus and S. cerevisiae cells were quantified as 1.21 ± 0.27 ns and 0.94 ± 0.19 ns, respectively (Figure 1G, left). The a1/a2 of K. marxianus cells (2.23) was significantly lower than that in S. cerevisiae cells (3.40) (Figure 1G, middle), suggesting the redox state of K. marxianus cells was relatively more oxidized. The lower a1/a2 of K. marxianus cells was mainly due to significantly increased τ-bound of NAD(P)H (Figure 1G, right), as more NAD(P)H might bind with enzymes during aerobic respiration in K. marxianus cells. In general, the redox state of K. marxianus and S. cerevisiae cells could be differentiated by the τ-mean of NAD(P)H, as a longer τ-mean of K. marxianus cells suggested a more oxidized state.
K. marxianus cells exhibited an increased τ-mean of NAD(P)H upon oxidative stress induced by high temperature or H2O2 treatment
High temperature and H2O2 induced oxidative stress in K. marxianus (Arellano-Plaza et al., 2017; Fu et al., 2019). Increased consumption of free NADPH is required to alleviate oxidative stress (Figure 2A), which is expected to shift the redox state (Mara et al., 2018).
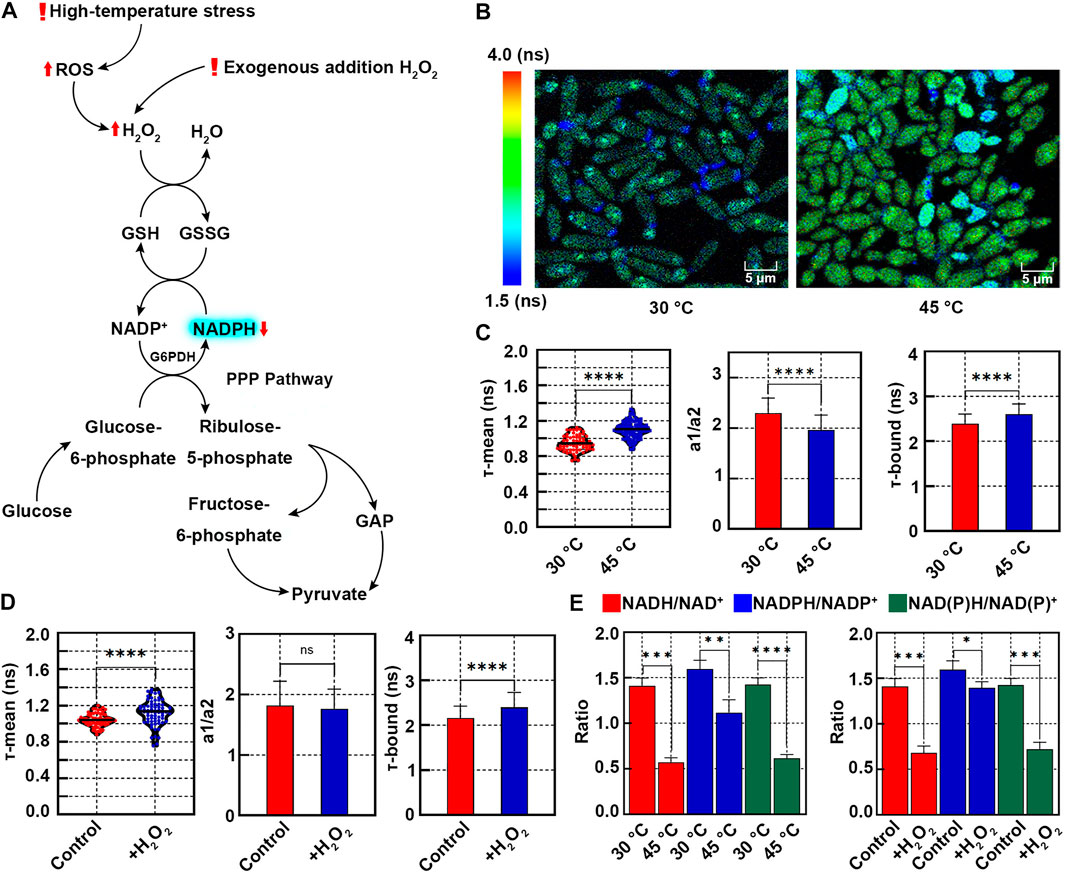
FIGURE 2. Redox states of K. marxianus cells upon oxidative stress induced by high-temperature or H2O2 treatment. (A) Oxidative stress induced by high temperature or H2O2 leads to the increased consumption of NADPH. (B) FLIM of NAD(P)H in cells grown at 30°C or 45°C. Pseudocolor mapping of NAD(P)H fluorescence lifetimes was shown. The lifetime from 1.5 to 4.0 ns was assigned different colors. (C) Quantitative analysis of NAD(P)H fluorescence lifetimes of cells in (B). A violin plot showed the distribution of τ-mean of cells and the mean value was indicated by a black line. Histograms showed a1/a2 and τ-bound, in which values represented mean ± SD. A total of 68 cells grown at 30°C and 112 cells grown at 45°C were counted. ****p < 0.0001. (D) Quantitative analysis of NAD(P)H fluorescence lifetimes of cells treated with H2O2. A total of 66 control cells and 69 cells treated with H2O2 were counted. “ns” indicated p > 0.05. (E) Ratios of NADH/NAD+, NADPH/NADP+ and NAD(P)H/NAD(P)+ of cells grown at high temperature or treated with H2O2. Concentrations of intracellular NAD+, NADH, NADP+ and NADPH were measured by a chemical assay. Ratios were calculated based on the concentrations. Values represented mean ± SD (n = 3). *p < 0.05; **p < 0.01; ***p < 0.001.
To investigate the redox state at a high temperature, K. marxianus cells (FIM-1) were grown at 30°C or 45°C for 24 h. Pseudocolor mapping of NAD(P)H lifetime of cells at 30°C showed dark blue and faint cyan, indicating a shorter lifetime (Figure 2B). Most of the cells at 45°C displayed yellow-green, indicating a longer lifetime (Figure 2B). The τ-mean of NAD(P)H of cells grown at 30°C was 0.94 ± 0.09 ns and that of cells grown at 45°C was significantly increased to 1.10 ± 0.09 ns (Figure 2C, left), suggesting a relative oxidative state of cells at high temperature. The a1/a2 of cells grown at 45°C was significantly lower than that at 30°C (Figure 2C, middle). τ-bound of cells grown at 45°C was significantly longer than that at 30°C (Figure 2C, right).
Similar to the situation of cells grown at a high temperature, the τ-mean of NAD(P)H of cells treated with 20 mM H2O2 (1.12 ± 0.13 ns) was significantly longer than that in untreated cells (1.04 ± 0.07 ns) (Figure 2D, left). τ-bound of treated cells was significantly longer than that of control cells (Figure 2D, right). However, a1/a2 of treated cells did not change significantly (Figure 2D, middle), probably due to the increased fluctuation of cell statuses upon H2O2 treatment.
To confirm the relationship between NAD(P)H content and τ-mean, concentrations of intracellular NADH, NAD+, NADPH and NADP+ were determined by a colorimetric chemical assay. As shown in Figure 2E, NADH/NAD+, NADPH/NADP+ and NAD(P)H/NAD(P)+ of cells grown at 45°C were all significantly decreased, compared with their counterparts of cells grown at 30°C. Similarly, H2O2 treatment significantly decreased NADH/NAD+, NADPH/NADP+ and NAD(P)H/NAD(P)+ of cells (Figure 2E, right). The results were consistent with increased consumption of free NADPH upon oxidative stress induced by high temperature or H2O2 (Figure 2A). Therefore, an increased τ-mean of NAD(P)H of K. marxianus cells could be applied to indicate a shift in redox state [defined by NAD(P)H/NAD(P)+] toward a more oxidative status.
K. marxianus cells with a high yield of a heterologous protein exhibited an increased τ-mean of NAD(P)H
Overexpressing heterologous proteins raised oxidative stress in yeast (Huang et al., 2017). To compare redox states of cells displaying different expression levels of a heterologous protein, two K. marxianus strains, KML and KMH were selected. In our previous study, KM-HPV2 was constructed to express infectious bursal disease virus (IBDV) capsid VP2 by an episomal vector (Yang et al., 2021). KM-HPV2 was subjected to the H2O2 mutagenesis. Among the mutated strains, KML and KMH displayed low and high-level expressions of IBDV-VP2, respectively. As controls, VP2-expressing vectors in KML and KMH strains were replaced by void vectors to obtain KMLvoid and KMHvoid, respectively.
After 1 day of growth, IBDV-VP2 could not be detected in the supernatant of KML or KMH culture in SDS-PAGE (Figure 3A), suggesting the expression of IBDV-VP2 in either strain was low. In the pseudocolor mapping of NAD(P)H lifetime, most KML and KMH cells displayed blue-green, indicating a short lifetime (Figure 3B). In the quantitative analysis (Figure 3C), there was no significant difference between the τ-mean of KMH (1.05 ± 0.13 ns) cells and that of KML (1.03 ± 0.10 ns) cells, suggesting both cells exhibited similar redox states while expressing low levels of IBDV-VP2. However, the τ-mean of KMH cells was significantly longer than that of KMHvoid cells (1.00 ± 0.16 ns) (Figure 3C, left). Consistently, a1/a2 of KMH cells was significantly lower than that of KMHvoid cells (Figure 3C, middle). It suggested the redox state of KMH cells was more oxidized than that of KMHvoid cells, which might be related to IBDV-VP2 produced in KMH cells.
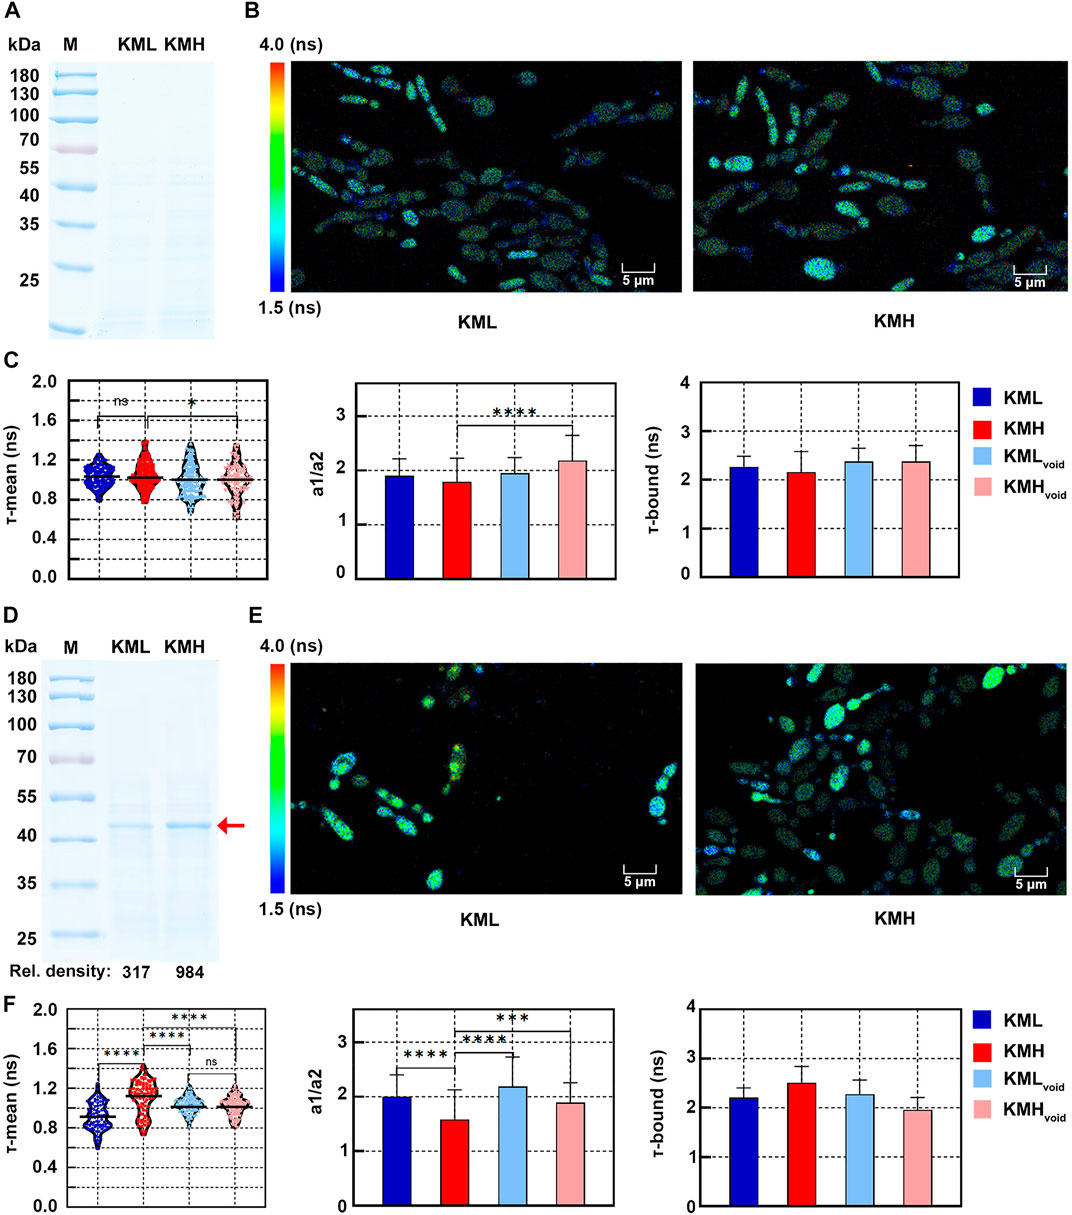
FIGURE 3. Redox states of K. marxianus cells displaying different expression levels of a heterologous protein. (A) SDS-PAGE of supernatant of KML and KMH culture after 1 day of growth. (B) FLIM of NAD(P)H in KML and KMH cells after 1 day of growth. Pseudocolor mapping of NAD(P)H fluorescence lifetimes was shown. The lifetime from 1.5 to 4.0 ns was assigned different colors. (C) Quantitative analysis of NAD(P)H fluorescence lifetimes of cells after 1 day of growth. A violin plot showed the distribution of τ-mean of cells and the mean value was indicated by a black line. Histograms showed a1/a2 and τ-bound, in which values represented mean ± SD. A total of 94 KML, 105 KMH, 104 KMLvoid and 78 KMHvoid cells were counted. “ns” indicated p > 0.05. *p < 0.05; ****p < 0.0001. (D) SDS-PAGE of supernatant of KML and KMH culture after 3 days of growth. The position of IBDV-VP2 was indicated by a red arrow and the relative densities of bands were shown below. (E) Pseudocolor mapping of NAD(P)H fluorescence lifetimes of KML and KMH cells after 3 days of growth. (F) Quantitative analysis of NAD(P)H fluorescence lifetimes of cells after 1 day of growth. A total of 91 KML, 79 KMH, 96 KMLvoid and 102 KMLvoid cells were counted. ***p < 0.001.
After 3 days of growth, bands corresponding to IBDV-VP2 were visible in the supernatant of KML and KMH culture in SDS-PAGE. The amount of IBDV-VP2 produced by KMH cells was 3 times that by KML cells, as deduced by the relative densities of bands (Figure 3D). A fraction of KML and KMH cells displayed yellow-green in the pseudocolor mapping of NAD(P)H lifetime (Figure 3E), suggesting a longer lifetime compared with that of cells after 1 day of growth. In the quantitative analysis (Figure 3F, left), the τ-mean of KMH cells (1.11 ± 0.17 ns) was significantly higher than that of KML (0.91 ± 0.13 ns), KMHvoid (1.02 ± 0.09 ns) and KMLvoid cells (1.03 ± 0.08 ns). The distribution of τ-mean of KMHvoid and KMLvoid cells was more concentrated. It suggested that, after entering the stationary phase, cells without expressing a heterologous protein exhibited a redox state with less fluctuation. Consistent with the highest τ-mean of KMH cells, a1/a2 of KMH cells was the lowest and τ-bound of KMH cells was the longest among their counterparts (Figure 3F, middle and right). The results suggested that, compared with cells with low or no expression of a heterologous protein, KMH cells with a high yield of a heterologous protein exhibited a more oxidized state, which could be indicated by an increased τ-mean of NAD(P)H.
Discussion
Since Britton Chance discovered the autofluorescence of NAD(P)H in the 1950s (Chance, 1952), methods to analyze the cellular redox state analysis based on NAD(P)H autofluorescence, such as FLIM, have been gradually developed (Tornmalm et al., 2019). FLIM is a non-invasive, label-free and in situ method, which is suitable for the long-term detection of living cells and therefore is widely applied in clinical research. For example, tumor cells tend to undergo glycolysis, the so-called Warburg effect, which leads to a low fluorescence lifetime of NAD(P)H (Kolenc and Quinn, 2019). Therefore, FLIM is used for early tumor detection (Alfonso-García et al., 2022). The redox states of stem cells change considerably during differentiation and FLIM was applied to track the metabolism changes of stem cells (Okkelman et al., 2020). Yeast is one of the most important microbial cell factories and the yielding of yeast cells was closely related to redox states (Chen et al., 2020). FLIM is well suited to measure the redox state of yeast, which might benefit strain engineering for improved yield. However, few applications of FLIM in yeast were reported so far.
In this study, FLIM was performed to assess the redox states of K. marxianus cells upon various oxidative stress. Among the current methods to analyze the redox states of cells, chemical analysis destroys cell integrity and does not allow for single-cell analysis (Kanamori et al., 2018). Although fluorescent biosensors can assess redox states at the single-cell level, they require a long preparation procedure and the introduction of exogenous genes (Liao et al., 2020). In comparison, FILM gives a more natural image of the cell state. For example, high-temperature stress resulted in some cells turning blue in the FLIM (Figure 2B), implying the presence of a large amount of short-lived NAD(P)H in these cells even τ-mean of NAD(P)H of all cells increased. Both high-temperature and H2O2 treatment led to an increase of τ-mean of NAD(P)H. But H2O2 caused more deviation of τ-mean than high temperature, suggesting more fluctuated redox states were raised among the cells treated by H2O2 (Figures 2C,D). There were also shortcomings of FLIM in assessing the redox states of cells. For example, the autofluorescence of NADH and NADPH is optically indistinguishable and therefore FLIM can not analyze individual redox pairs directly. In addition, the fluctuation of τ-mean among individual cells was considerable. Some fluctuation might be due to the genetic diversity among cells, as observed in the offspring of one mother cell (Maclean et al., 2017). Meanwhile, some fluctuation might be due to different phases in the cell cycle, different ages of cells, various epigenetic statuses and some technical issues, such as errors in detecting photorefractive rate. Therefore, synchronization of cells and a more accurate detection apparatus might help to reduce the fluctuation of τ-mean among the population.
Overproduction of heterologous proteins resulted in the reduction of NADPH and that led to an altered redox cofactor state (Tomàs-Gamisans et al., 2020). Consistent with this idea, K. marxianus cells with a high yield of a heterologous protein exhibited an increased τ-mean of NAD(P)H (Figure 3F). Therefore, τ-mean of NAD(P)H might be used as an intrinsic marker to screen high-yielding cells. Traditionally, cells expressing heterologous proteins are verified by SDS-PAGE, which was laborious and not suitable for high-throughput screens. High-throughput screen techniques, such as microfluidics, were developing rapidly in recent years, in which fluorescent markers are usually required (Napiorkowska et al., 2021). For example, fluorescent groups released after enzymatic reactions are applied to the screen of enzymes. But this strategy is not applicable for the screen of non-enzymatic proteins, including antibodies, cytokines and vaccines. Fluorescent fusion proteins, such as GFP-fused proteins, are compatible with the high-throughput screen (Baumann et al., 2018). However, fluorescent fusion proteins sometimes inhibit the natural activity of target proteins (Wick et al., 2019). Since FLIM analysis of NAD(P)H does not require the fluorescent labelling of target proteins or their products, it might be applied to the screen of cells yielding the target protein in its natural form. With the aid of machine learning algorithms and robotic platforms, automatic FLIM analysis and screen are possible (Sagar et al., 2020). If a more general relationship between high-yielding cells and an increased τ-mean of NAD(P)H is confirmed in the future, a FLIM-based screen will boost the optimization of yeast cell factories.
Data availability statement
The original contributions presented in the study are included in the article/Supplementary Material, further inquiries can be directed to the corresponding authors.
Author contributions
HL and YY designed the study and supervised the project. YA performed most of the experiments and analyzed the data. RL and JM assisted data analysis. DY assisted the experiment involving KML and KMH. YA, HL, and YY wrote the manuscript. All authors have revised the manuscript and approved the final version.
Funding
This study was supported by Shanghai Municipal Education Commission (2021-03-52), Science and Technology Research Program of Shanghai (18391901800), Science and Technology Research Program of Shanghai (19DZ2282100), the National Key Research and Development Program of China (2021YFF0502900), National Natural Science Foundation of China (62175034, 62175036) and Shanghai Natural Science Foundation (20ZR1405100).
Conflict of interest
The authors declare that the research was conducted in the absence of any commercial or financial relationships that could be construed as a potential conflict of interest.
Publisher’s note
All claims expressed in this article are solely those of the authors and do not necessarily represent those of their affiliated organizations, or those of the publisher, the editors and the reviewers. Any product that may be evaluated in this article, or claim that may be made by its manufacturer, is not guaranteed or endorsed by the publisher.
References
Ai, Y., Luo, T., Yu, Y., Zhou, J., and Lu, H. (2022). Downregulation of ammonium uptake improves the growth and tolerance of Kluyveromyces marxianus at high temperature. MicrobiologyOpen 11 (3), e1290. doi:10.1002/mbo3.1290
Alfonso-García, A., Zhou, X., Bec, J., Anbunesan, S. N., Fereidouni, F., Jin, L. W., et al. (2022). First in patient assessment of brain tumor infiltrative margins using simultaneous time-resolved measurements of 5-ALA-induced PpIX fluorescence and tissue autofluorescence. J. Biomed. Opt. 27 (2), 20501. doi:10.1117/1.Jbo.27.2.020501
Arellano-Plaza, M., Noriega-Cisneros, R., Clemente-Guerrero, M., Gonzalez-Hernandez, J. C., Robles-Herrera, P. D., Manzo-Avalos, S., et al. (2017). Fermentative capacity of Kluyveromyces marxianus and Saccharomyces cerevisiae after oxidative stress. J. Inst. Brew. 123, 519–526. doi:10.1002/jib.451
Baumann, L., Rajkumar, A. S., Morrissey, J. P., Boles, E., and Oreb, M. (2018). A yeast-based biosensor for screening of short- and medium-chain fatty acid production. ACS Synth. Biol. 7 (11), 2640–2646. doi:10.1021/acssynbio.8b00309
Cannon, T. M., Lagarto, J. L., Dyer, B. T., Garcia, E., Kelly, D. J., Peters, N. S., et al. (2021). Characterization of NADH fluorescence properties under one-photon excitation with respect to temperature, pH, and binding to lactate dehydrogenase. OSA Contin. 4 (5), 1610–1625. doi:10.1364/osac.423082
Chance, B. (1952). Spectra and reaction kinetics of respiratory pigments of homogenized and intact cells. Nature 169 (4293), 215–221. doi:10.1038/169215a0
Chen, R., Yang, S., Zhang, L., and Zhou, Y. J. (2020). Advanced strategies for production of natural products in yeast. iScience 23 (3), 100879. doi:10.1016/j.isci.2020.100879
Dai, Z., Huang, M., Chen, Y., Siewers, V., and Nielsen, J. (2018). Global rewiring of cellular metabolism renders Saccharomyces cerevisiae Crabtree negative. Nat. Commun. 9 (1), 3059. doi:10.1038/s41467-018-05409-9
Fu, X., Li, P., Zhang, L., and Li, S. (2019). Understanding the stress responses of Kluyveromyces marxianus after an arrest during high-temperature ethanol fermentation based on integration of RNA-Seq and metabolite data. Appl. Microbiol. Biotechnol. 103 (6), 2715–2729. doi:10.1007/s00253-019-09637-x
Huang, M., Bao, J., Hallström, B. M., Petranovic, D., and Nielsen, J. (2017). Efficient protein production by yeast requires global tuning of metabolism. Nat. Commun. 8 (1), 1131. doi:10.1038/s41467-017-00999-2
Kanamori, K. S., de Oliveira, G. C., Auxiliadora-Martins, M., Schoon, R. A., Reid, J. M., and Chini, E. N. (2018). Two different methods of quantification of oxidized nicotinamide adenine dinucleotide (NAD(+)) and reduced nicotinamide adenine dinucleotide (NADH) intracellular levels: Enzymatic coupled cycling assay and ultra-performance liquid chromatography (UPLC)-Mass spectrometry. Bio. Protoc. 8 (14), e2937. doi:10.21769/BioProtoc.2937
Karim, A., Gerliani, N., and Aïder, M. (2020). Kluyveromyces marxianus: An emerging yeast cell factory for applications in food and biotechnology. Int. J. Food Microbiol. 333, 108818. doi:10.1016/j.ijfoodmicro.2020.108818
Kolenc, O. I., and Quinn, K. P. (2019). Evaluating cell metabolism through autofluorescence imaging of NAD(P)H and FAD. Antioxid. Redox Signal. 30 (6), 875–889. doi:10.1089/ars.2017.7451
Kong, Y., Zhao, Y., Yu, Y., Su, W., Liu, Z., Fei, Y., et al. (2022). Single cell sorting of young yeast based on label-free fluorescence lifetime imaging microscopy. J. Biophot. 15 (4), e202100344. doi:10.1002/jbio.202100344
Leonel, L. V., Arruda, P. V., Chandel, A. K., Felipe, M. G. A., and Sene, L. (2021). Kluyveromyces marxianus: A potential biocatalyst of renewable chemicals and lignocellulosic ethanol production. Crit. Rev. Biotechnol. 41 (8), 1131–1152. doi:10.1080/07388551.2021.1917505
Liao, P. C., Yang, E. J., and Pon, L. A. (2020). Live-cell imaging of mitochondrial redox state in yeast cells. Star. Protoc. 1 (3), 100160. doi:10.1016/j.xpro.2020.100160
Maclean, C. J., Metzger, B. P. H., Yang, J. R., Ho, W. C., Moyers, B., and Zhang, J. (2017). Deciphering the genic basis of yeast fitness variation by simultaneous forward and reverse genetics. Mol. Biol. Evol. 34 (10), 2486–2502. doi:10.1093/molbev/msx151
Mara, P., Fragiadakis, G. S., Gkountromichos, F., and Alexandraki, D. (2018). The pleiotropic effects of the glutamate dehydrogenase (GDH) pathway in Saccharomyces cerevisiae. Microb. Cell. Fact. 17 (1), 170. doi:10.1186/s12934-018-1018-4
Meleshina, A. V., Rogovaya, O. S., Dudenkova, V. V., Sirotkina, M. A., Lukina, M. M., Bystrova, A. S., et al. (2018). Multimodal label-free imaging of living dermal equivalents including dermal papilla cells. Stem Cell. Res. Ther. 9 (1), 84. doi:10.1186/s13287-018-0838-9
Miller, C. G., Holmgren, A., Arnér, E. S. J., and Schmidt, E. E. (2018). NADPH-dependent and -independent disulfide reductase systems. Free Radic. Biol. Med. 127, 248–261. doi:10.1016/j.freeradbiomed.2018.03.051
Napiorkowska, M., Pestalozzi, L., Panke, S., Held, M., and Schmitt, S. (2021). High-throughput optimization of recombinant protein production in microfluidic gel beads. Small 17 (2), e2005523. doi:10.1002/smll.202005523
Okkelman, I. A., Puschhof, J., Papkovsky, D. B., and Dmitriev, R. I. (2020). Visualization of stem cell niche by fluorescence lifetime imaging microscopy. Methods Mol. Biol. 2171, 65–97. doi:10.1007/978-1-0716-0747-3_5
Qiu, X., Zhang, J., Zhou, J., Fang, Z., Zhu, Z., Li, J., et al. (2019). Stress tolerance phenotype of industrial yeast: Industrial cases, cellular changes, and improvement strategies. Appl. Microbiol. Biotechnol. 103 (16), 6449–6462. doi:10.1007/s00253-019-09993-8
Ramos-Moreno, L., Ramos, J., and Michán, C. (2019). Overlapping responses between salt and oxidative stress in Debaryomyces hansenii. World J. Microbiol. Biotechnol. 35 (11), 170. doi:10.1007/s11274-019-2753-3
Sagar, M. A. K., Cheng, K. P., Ouellette, J. N., Williams, J. C., Watters, J. J., and Eliceiri, K. W. (2020). Machine learning methods for fluorescence lifetime imaging (FLIM) based label-free detection of microglia. Front. Neurosci. 14, 931. doi:10.3389/fnins.2020.00931
Sakihama, Y., Hidese, R., Hasunuma, T., and Kondo, A. (2019). Increased flux in acetyl-CoA synthetic pathway and TCA cycle of Kluyveromyces marxianus under respiratory conditions. Sci. Rep. 9 (1), 5319. doi:10.1038/s41598-019-41863-1
Sant'Anna-Silva, A. C. B., Santos, G. C., Campos, S. P. C., Oliveira Gomes, A. M., Pérez-Valencia, J. A., and Rumjanek, F. D. (2018). Metabolic profile of oral squamous carcinoma cell lines relies on a higher demand of lipid metabolism in metastatic cells. Front. Oncol. 8, 13. doi:10.3389/fonc.2018.00013
Schaefer, P. M., Hilpert, D., Niederschweiberer, M., Neuhauser, L., Kalinina, S., Calzia, E., et al. (2017). Mitochondrial matrix pH as a decisive factor in neurometabolic imaging. Neurophotonics 4 (4), 1. doi:10.1117/1.NPh.4.4.045004
Schaefer, P. M., Kalinina, S., Rueck, A., von Arnim, C. A. F., and von Einem, B. (2019). NADH autofluorescence-A marker on its way to boost bioenergetic research. Cytom. A 95 (1), 34–46. doi:10.1002/cyto.a.23597
Scialò, F., Fernández-Ayala, D. J., and Sanz, A. (2017). Role of mitochondrial reverse electron transport in ROS signaling: Potential roles in health and disease. Front. Physiol. 8, 428. doi:10.3389/fphys.2017.00428
Tomàs-Gamisans, M., Andrade, C. C. P., Maresca, F., Monforte, S., Ferrer, P., and Albiol, J. (2020). Redox engineering by ectopic overexpression of NADH kinase in recombinant Pichia pastoris (Komagataella phaffii): Impact on cell physiology and recombinant production of secreted proteins. Appl. Environ. Microbiol. 86 (6), e02038-19. doi:10.1128/aem.02038-19
Tornmalm, J., Sandberg, E., Rabasovic, M., and Widengren, J. (2019). Local redox conditions in cells imaged via non-fluorescent transient states of NAD(P)H. Sci. Rep. 9 (1), 15070. doi:10.1038/s41598-019-51526-w
Wang, M., Chen, B., Fang, Y., and Tan, T. (2017). Cofactor engineering for more efficient production of chemicals and biofuels. Biotechnol. Adv. 35 (8), 1032–1039. doi:10.1016/j.biotechadv.2017.09.008
Wick, S., Walsh, D. I., Bobrow, J., Hamad-Schifferli, K., Kong, D. S., Thorsen, T., et al. (2019). PERSIA for direct fluorescence measurements of transcription, translation, and enzyme activity in cell-free systems. ACS Synth. Biol. 8 (5), 1010–1025. doi:10.1021/acssynbio.8b00450
Wu, L., Wang, M., Zha, G., Zhou, J., Yu, Y., and Lu, H. (2020). Improving the expression of a heterologous protein by genome shuffling in Kluyveromyces marxianus. J. Biotechnol. 320, 11–16. doi:10.1016/j.jbiotec.2020.06.007
Yang, D., Zhang, L., Duan, J., Huang, Q., Yu, Y., Zhou, J., et al. (2021). A single vaccination of IBDV subviral particles generated by Kluyveromyces marxianus efficiently protects chickens against novel variant and classical IBDV strains. Vaccines (Basel) 9 (12), 1443. doi:10.3390/vaccines9121443
Yu, Y., Mo, W., Ren, H., Yang, X., Lu, W., Luo, T., et al. (2021). Comparative genomic and transcriptomic analysis reveals specific features of gene regulation in Kluyveromyces marxianus. Front. Microbiol. 12, 598060. doi:10.3389/fmicb.2021.598060
Keywords: Kluyveromyces marxianus, oxidative stress, NAD(P)H autofluorescence, FLIM, heterologous protein
Citation: Ai Y, Luo R, Yang D, Ma J, Yu Y and Lu H (2022) Fluorescence lifetime imaging of NAD(P)H upon oxidative stress in Kluyveromyces marxianus. Front. Bioeng. Biotechnol. 10:998800. doi: 10.3389/fbioe.2022.998800
Received: 20 July 2022; Accepted: 12 August 2022;
Published: 02 September 2022.
Edited by:
Panagiotis Madesis, University of Thessaly, GreeceReviewed by:
Richa Arora, Punjab Agricultural University, IndiaHuaiwei Liu, Shandong University, China
Copyright © 2022 Ai, Luo, Yang, Ma, Yu and Lu. This is an open-access article distributed under the terms of the Creative Commons Attribution License (CC BY). The use, distribution or reproduction in other forums is permitted, provided the original author(s) and the copyright owner(s) are credited and that the original publication in this journal is cited, in accordance with accepted academic practice. No use, distribution or reproduction is permitted which does not comply with these terms.
*Correspondence: Yao Yu, eWFveXVAZnVkYW4uZWR1LmNu; Hong Lu, aG9uZ2x2QGZ1ZGFuLmVkdS5jbg==