- 1Innovation Laboratory of Terahertz Biophysics, National Innovation Institute of Defense Technology, Beijing, China
- 2School of Physics, Peking University, Beijing, China
There is growing interest in whether the myelinated nerve fiber acts as a dielectric waveguide to propagate terahertz to mid-infrared electromagnetic waves, which are presumed stable signal carrier for neurotransmission. The myelin sheath is formed as a multilamellar biomembrane structure, hence insights into the dielectric properties of the phospholipid bilayer is essential for a complete understanding of the myelinated fiber functioning. In this work, by means of atomistic molecular dynamics simulations of the dimyristoylphosphatidylcholine (DMPC) bilayer in water and numerical calculations of carefully layered molecules along with calibration of optical dielectric constants, we for the first time demonstrate the spatially resolved (in sub-nm) dielectric spectrum of the phospholipid bilayer in a remarkably wide range from terahertz to mid-infrared. More specifically, the membrane head regions exhibit both larger real and imaginary permittivities than that of the tail counterparts in the majority of the 1–100 THz band. In addition, the spatial variation of dielectric properties suggests advantageous propagation characteristics of the phospholipid bilayer in a relatively wide band of 55–85 THz, where the electromagnetic waves are well confined within the head regions.
Introduction
The electromagnetic spectrum from terahertz to mid-infrared region is vital to living organisms since the collective vibrations of most biomacromolecules (e.g., DNA and protein) fall within this frequency range, where many significant physiological phenomena and biomedical applications have been reported (Barone et al., 2005; Kitagawa et al., 2006; Rodrigo et al., 2015; Cheon et al., 2016; Turker-Kaya and Huck, 2017; Mittal et al., 2018; Zhu et al., 2021; Zhang et al., 2021; Li et al., 2021; Li et al., 2022; Sun et al., 2022). In addition, the spectra of the optical constant (refractive index and extinction coefficient), and the dielectric constant (real and imaginary parts of the permittivity) of all biomaterials contain the inherent information of their internal molecules, atoms and chemical bonds, and hence could be utilized as the functional biosignatures (Pethig and Kell, 1987; Parthasarathy et al., 2005; Davidov et al., 2021). A recent experimental study finds that the frog sciatic nerve shows distinct refractive indexes measured at different spots in the terahertz to mid-infrared band, suggesting that the myelinated nerve fiber might act as a decent dielectric waveguide (Liu et al., 2019). Although this finding is a major step forward in supporting that terahertz/mid-infrared electromagnetic waves might be information carriers for neural signal propagation, a question is still left unanswered: what is the specific frequency band for the best information propagation? Intuitively, this band should possess the following features:
1) The band should be continuous and broad. In other words, the frequencies of the electromagnetic waves for the neural signal propagation cannot be a single frequency or some isolated frequencies. This feature contributes to provide a stable and robust communication capability.
2) The refractive index, or the real part of the permittivity, of the myelin sheath should be obviously higher than that of the axon and the extracellular fluid. This feature guarantees that the electromagnetic waves cannot spread to the extracellular fluid and propagate primarily through the myelin sheath rather than the axon.
3) The extinction coefficient, or the imaginary part of the permittivity, of the myelin sheath should be small enough. This feature manifests that the electromagnetic waves can propagate through a considerable long myelin sheath without getting weaker.
In order to answer the above questions, the optical/dielectric properties of the myeline sheath and the axon in the frequency range from terahertz to mid-infrared must be investigated primarily. Researchers have attempted to directly measure the optical/dielectric properties of the myelinated nerve fiber by experiments. Antonov et al. carried out the first in vivo measurement of the refractive index of a peripheral nerve fiber of the sciatic nerve in Rana temporaria using holographic interference microscopy, and the constant refractive indexes of the myelin sheath and the axon in the visible were obtained (Antonov et al., 1983). Rahman et al. measured the frequency-dependent refractive index and extinction coefficient of the sciatic nerve of Xenopus laevis in vitro for the first time based on a spectrophotometer working in the wavelength range of 860–2,250 nm (Rahman et al., 2018). Tayebi et al. analyzed the refractive index dispersion of an individual nerve fiber in striatal medium spiny neurons using a triple-wavelength diffraction phase interferometer (473, 589 and 685 nm) (Tayebi et al., 2019). We find that the related experimental studies are extremely rare due to the limitation of the existing practical techniques and measuring instruments. Currently, to the best of our knowledge, there is no ready-to-use and abundant measured data which could reveal the optical/dielectric properties of the myeline sheath and the axon in the terahertz to mid-infrared spectrum.
It is well known that the myelin sheath and the axon mainly consist of the biomembrane and the intracellular fluid, respectively (Kolb and Whishaw, 1980; Rinholm and Bergersen, 2012; Fields, 2014). As the phospholipid bilayer and the water are respectively the major constituents of the biomembrane and the intracellular fluid, the optical/dielectric properties of the phospholipid bilayer and the water are thus reasonable indicators of those of the myeline sheath and the axon, respectively. The optical/dielectric constants of the water over a wide frequency range from direct current to ultraviolet at various temperature have been thoroughly investigated, and plenty of theoretical and experimental data can be acquired from the available literature (Hale and Querry, 1973; Segelstein 1981; Buchner et al., 1999; Praprotnik and Janežič, 2005; Heyden et al., 2010; Midi et al., 2014; Rowe et al., 2020; Krishnamoorthy et al., 2021). The studies on the biomembrane or phospholipid bilayer also have been started for long. Zhou et al. applied the linear response theory to estimate the susceptibilities across a dilauroylphosphatidylethanolamine (DLPE) bilayer (Zhou and Schulten, 1995). Stern et al. established a rigorous expression to calculate the permittivity of a dipalmitoylphosphatidylcholine (DPPC) by combining statistical mechanics and continuum electrostatics (Stern and Feller, 2003). Tanizaki et al. proposed a three-layered model with different dielectric constants as hydrocarbon, ester group and water based on the generalized Born formalism (Tanizaki and Feig, 2005). Hishida et al. focused on the hydration state of the lipid membrane with techniques of terahertz time-domain spectroscopy and small-angle X-ray scattering, and the dielectric constants of dimyristoylphosphatidylcholine (DMPC) solutions in the frequency range of 0.5–2.6 THz were measured (Hishida and Tanaka, 2011). Hielscher et al. measured the absorbance spectra of six different types of phospholipids in the far-infrared region from 600 to 50 cm−1 using Fourier transform infrared spectroscopy (Hielscher and Hellwig, 2012). Siddiquee et al. imaged dioleoylphosphatidylcholine (DOPC) and DPPC membranes based on the local absorption coefficients measured by a scanning near-field optical microscopy system with 640 nm laser beam (Siddiquee et al., 2019). In summary, although previous studies have made great contributions to the frequency-dependent optical/dielectric constants of the phospholipid bilayer, however, the dispersion profiles obtained by both theoretical and experiment methods are almost narrowband spectra. In addition, it can be found that the studies of the subnanometer resolution optical/dielectric properties of the phospholipid bilayer are only focused on the static permittivity. The broadband optical/dielectric properties of the phospholipid bilayer in the frequency range from terahertz to mid-infrared with subnanometer resolution are still unclear.
To verify whether the myelinated nerve fiber is an applicable candidate for terahertz/mid-infrared electromagnetic propagation, herein, we theoretically investigate the spatially resolved dielectric properties of the phospholipid bilayer broadly ranging from 1 to 100 THz via molecular dynamics (MD) simulations for the first time. A membrane-water system based on DMPC molecules is constructed, and the space-frequency distribution of the dielectric properties in terms of the equilibrated membrane-water system is computed. The optimal band for electromagnetic propagation through the myelinated nerve fiber is discussed, and the real and imaginary permittivities across the equilibrated membrane-water system in this band are presented.
Materials and methods
Material characteristics
For any homogeneous, linear and isotropic biomaterial, its optical constant
where
Substituting Eq. 1 and Eq. 2 into Eq. 3, we can obtain that
Eq. 4 and Eq. 5 give rigorous mathematical relations between the optical constant and the dielectric constant. The values of
where
Phospholipids, the main components in biological membranes, are a sort of important biomaterial. A phospholipid molecule is basically composed of carbon, hydrogen, oxygen, nitrogen and phosphorus, and should be divided into two parts according to the different chemical characteristics: the hydrophilic head and the hydrophobic tail. The hydrophilic head includes the polar phosphatidylcholine while the hydrophobic tail includes the non-polar aliphatic chain. For this reason, under liquid condition phospholipids exist in the form of the double layer structure with their hydrophilic heads outside and hydrophobic tails inside, which is known as the phospholipid bilayer. Related studies have confirmed that biological membranes often in the liquid crystalline state in order to maximize their functional roles (Molugu et al., 2017; Paracini et al., 2018). Most naturally occurring phospholipids (such as DMPC, DPPC, etc.) behave slight differences in the length of the hydrophobic tails (Guo et al., 2014), and thus their optical and dielectric properties should vary little. Herein, we use DMPC for our study as the mammalian membranes contain abundant amounts of this type of phospholipid (Jurczak et al., 2021). It should be noted that the DMPC membrane has a phase transition temperature about 23–24°C, meaning that the membrane is in the gel (liquid crystalline) state exhibiting immobile (fluidic) feature below (above) this temperature (Kučerka et al., 2011).
Model and MD simulation
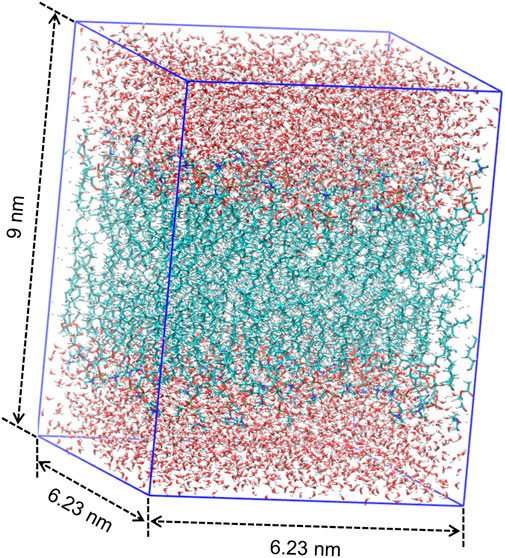
MD simulation is a powerful technique to understand the physical basis of the structure as well as the function of biomacromolecules (Karplus and McCammon, 2002). It is applicable to simulating the dynamic motions of a number of biological systems at atomic or near-atomic level of detail (Brandman et al., 2012; Zhao et al., 2013). Herein, we perform the MD simulation with GROMACS, which is one of the most widely used MD package (Abraham et al., 2015). As illustrated in Figure 1, we place a single DMPC molecule along the z direction and use it as the smallest unit. A membrane bilayer is then built by replicating this smallest unit in both x and y directions and inverting in the z direction. The completed membrane bilayer is composed of 128 DMPC molecules with 64 per leaflet, orienting parallel to the x-y plane with the normal in the z direction. The equivalent area per DMPC molecule is 0.606 nm, which is consistent with the experimental values (Wohlert and Edholm, 2006). The distance between two phosphorus atoms which are inverted relative to each other is 3.3 nm. Finally, a membrane-water system is constructed by adding 6,968 water molecules on both sides of the membrane bilayer to well hydrate it, which satisfies the actual state of biological membranes (Park et al., 2020). The dimension of the membrane-water system is approximately 6.23 nm × 6.23 nm × 9 nm.
Before conducting the MD simulation, it is worth noting that the periodic boundary condition is used to avoid edge effects owing to the finite size of the constructed membrane-water system. In addition, the all-atom CHARMM36 force field and the TIP3P water model are used to achieve high-accuracy computation, and the Particle Mesh Ewald method is used for high-efficiency computation of the long-range electrostatic interactions. We keep the simulation temperature at 310 K which is above the phase transition temperature of the DMPC membrane by applying Nosé-Hoover thermostat algorithm. After energy minimization, NVT and NPT ensembles, an equilibrium system can be established and its equilibrated data of the atoms such as charges, velocities and positions can be collected for post-processing.
The frequency range of the spectrum computed by GROMACS is determined based on the sampling theorem as
where
Subnanometer-scale dielectric spectra computation
We attempt to slice the equilibrium system along the z direction into multi-layered structures with subnanometer resolution and compute the dielectric spectra for each layer which can be treated as a homogeneous, linear and isotropic material. Based on the linear response theory (Iftimie and Tuckerman, 2005), the following relation can be derived for each layer
where
where
After the imaginary part of the frequency-dependent permittivity for each layer is computed, the real part
Optical dielectric constant estimation
We can see from Kramers–Kronig relations that it is enough to know
where
In order to determine Cauchy dispersion model of the phospholipid molecule, we need to know the values of its fit coefficients. It can be easily solved if we know three pairs of values of wavelength and refractive index. Herein, we use Vogel method and Lorentz-Lorenz equation to achieve this (Vogel 1948; Cao et al., 2009). Based on Vogel method, a molecule under investigation is divided into many chemical units (atoms, structures and groups) with known molar refractions at 468.3, 589.3 and 653.3 nm. By adding up the molar refractions of all the chemical units, the molar refractions of a molecule at these three wavelengths are obtained, and the corresponding refractive indexes are calculated using Lorentz-Lorenz equation:
where
Generally speaking, it is expected that the dielectric properties for the hydrophilic head and the hydrophobic tail of a phospholipid molecule should behave differently owing to their obvious difference in chemical constituent. Therefore, we separately calculate the optical dielectric constants of the hydrophilic head and the hydrophobic tail and use them as reference values for the optical dielectric constants of all sublayers in the hydrophilic head and the hydrophobic tail. For a DMPC molecule, the dividing line between its hydrophilic head and hydrophobic tail is demonstrated in Figure 2. The chemical units used for the hydrophilic head and the hydrophobic tail are listed in Tables 1, 2.
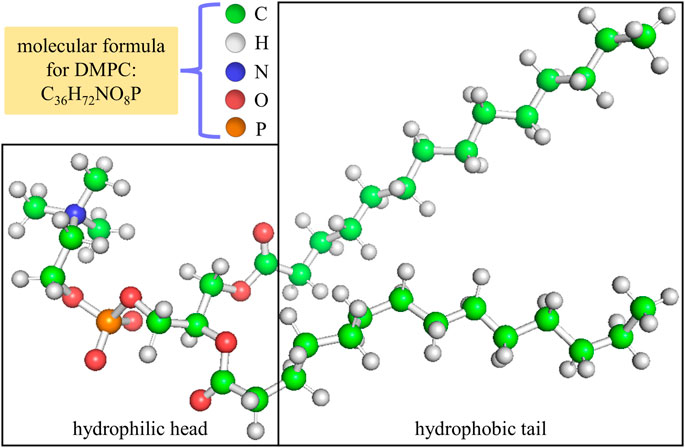
FIGURE 2. Position of the dividing line between the hydrophilic head and the hydrophobic tail in a DMPC molecule.
Results and discussion
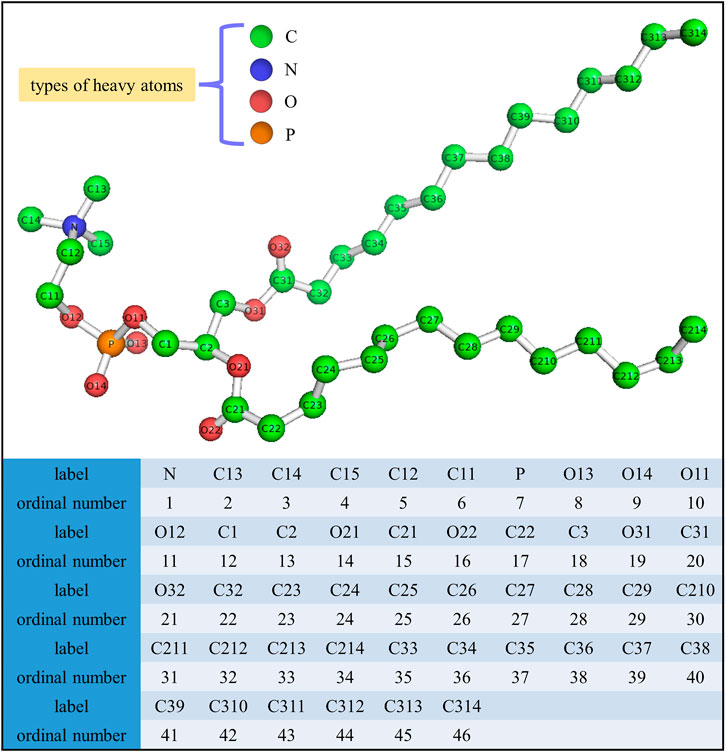
The final structure of the equilibrated membrane-water system is displayed in Figure 3, where we can find that the hydrophobic tails of all phospholipid molecules are contracted as well as disordered. Herein, the equilibrium system is layered based on the average vertical position of each heavy atom (non-hydrogen atom) in the phospholipid bilayer. In total, there are 46 heavy atoms in a DMPC molecule. We label these atoms as shown in Figure 4, and then assign each label a specific ordinal number. Figure 5 gives the result of the average vertical position versus ordinal number for each heavy atom in the equilibrated DMPC bilayer. It is noted that for the pair of heavy atoms with the same ordinal number which are respectively located at the top and bottom DMPC molecules, their average vertical positions are substantially symmetric about the plane of z = 0. The thickness of the DMPC monolayer is approximately 2 nm, with 0.8 nm for the hydrophilic head and 1.2 nm for the hydrophobic tail. In order to study the subnanometer resolution dielectric properties of the biomembrane, we use 0.2 nm thickness as spacing of layers and finally slice the phospholipid bilayer into 20 layers, as shown in Figure 6.
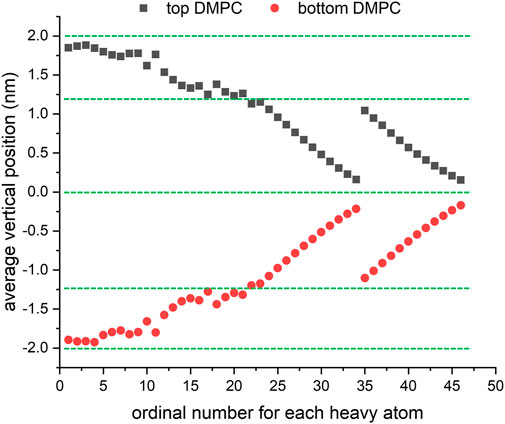
FIGURE 5. Average vertical position versus ordinal number for each heavy atom in the equilibrated DMPC bilayer.
We conduct the theoretical estimation of the refractive index
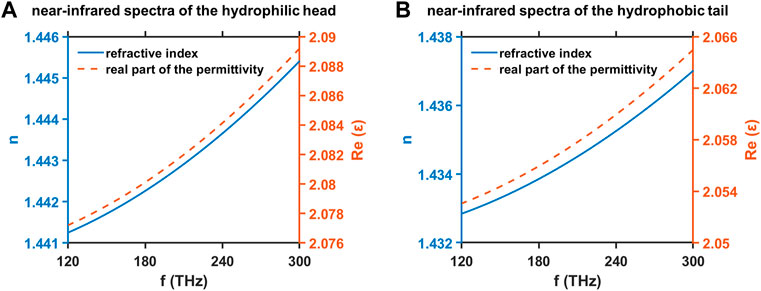
FIGURE 7. Refractive index
The dielectric spectra in the frequency range from terahertz to mid-infrared for two regions of the hydrophilic head and the hydrophobic tail in the equilibrated DMPC monolayer are studied by MD simulation, and the results are shown in Figure 8. The original data is smoothed based on the moving average window to offer the readers a clearer view of the variation trends of the dielectric spectra. The imaginary parts of the permittivity
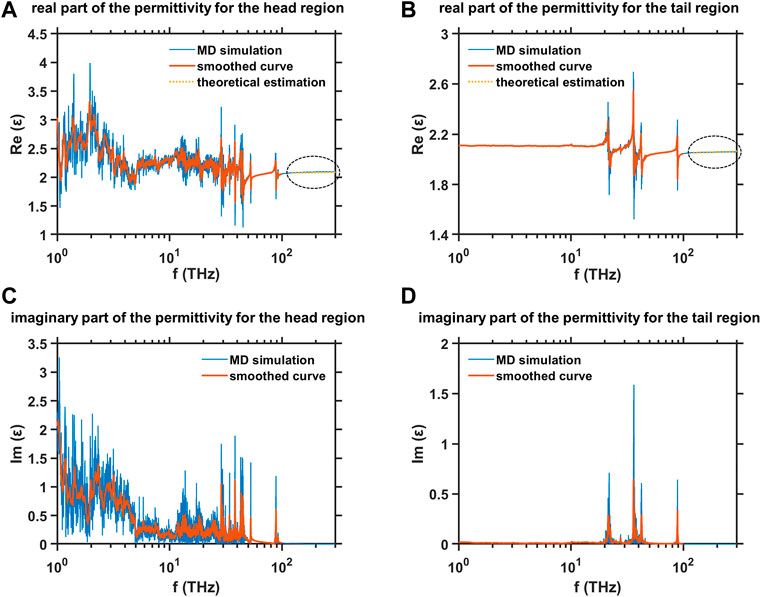
FIGURE 8. MD simulation results of the dielectric spectra in the frequency range from terahertz to mid-infrared for two regions of hydrophilic head and the hydrophobic tail in the equilibrated DMPC monolayer (A) Real part of the permittivity for the head region, (B) real part of the permittivity for the tail region, (C) imaginary part of the permittivity for the head region, and (D) imaginary part of the permittivity for the tail region.
Results of the subnanometer resolution dielectric spectra in the frequency range from terahertz to mid-infrared (1–100 THz) in terms of the equilibrated membrane-water system are shown in Figure 9. The layered data have been further interpolated to get a smooth dielectric spectrum landscape. We can obviously see that the dielectric properties of the equilibrated phospholipid bilayer are also substantially symmetric about the plane in which the vertical position of the slice is 0. In the range of 1–10 THz, the values of
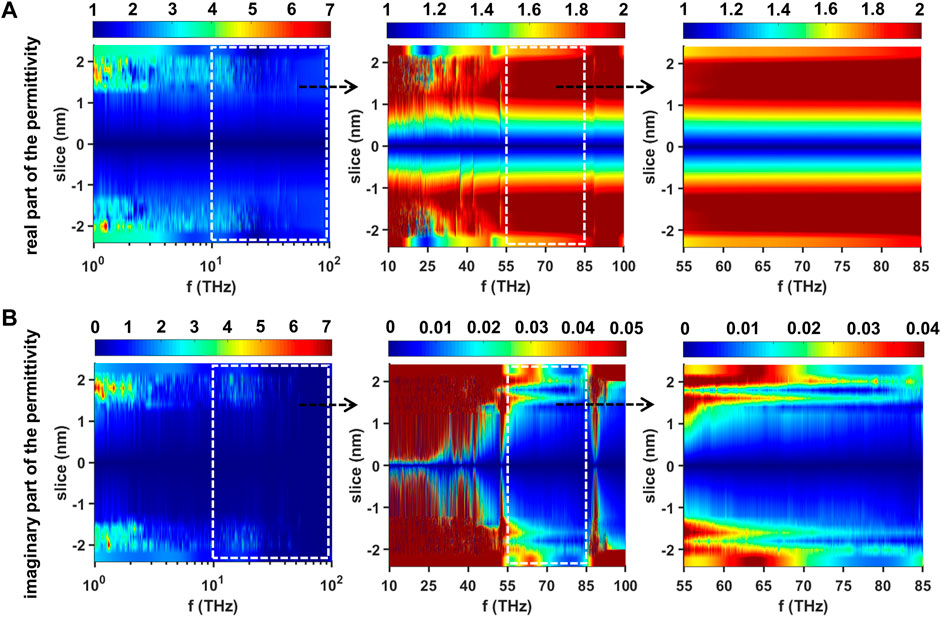
FIGURE 9. Dielectric spectra of the equilibrated membrane-water system in the range of 1–100 THz (A) Real part of the permittivity in the range of 1–100 THz (left), 10–100 THz (middle) and 55–85 THz (right) and (B) imaginary part of the permittivity in the range of 1–100 THz (left), 10–100 THz (middle) and 55–85 THz (right). The dashed rectangles are used to outline the regions we are interested. Each region is further enlarged and redrawn in its right adjacent subfigure.
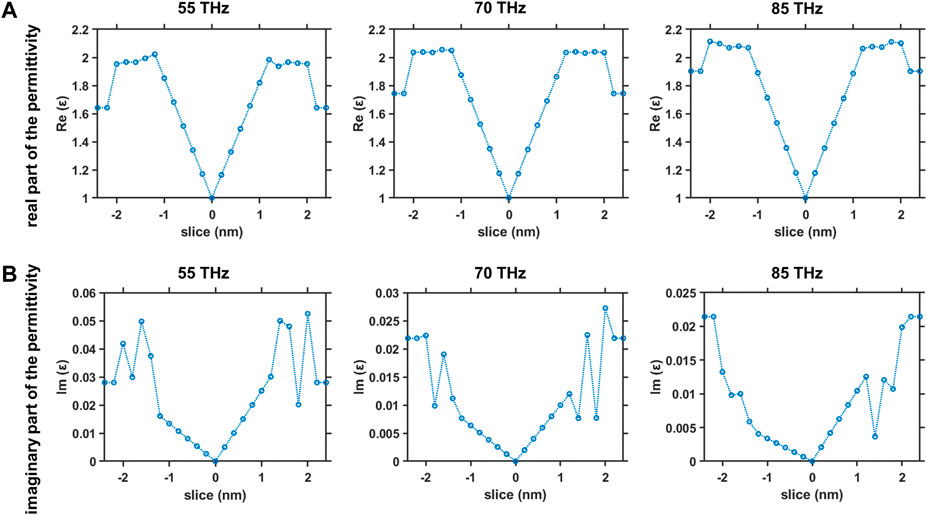
FIGURE 10. Dielectric properties across the equilibrated membrane-water system at frequencies in the range of 55–85 THz (A) Real part of the permittivity versus slice position at 55 THz (left), 70 THz (middle) and 85 THz (right) and (B) imaginary part of the permittivity versus slice position at 55 THz (left), 70 THz (middle) and 85 THz (right).
Conclusion
In this work, to explore the possibilities of the myelinated nerve fiber acting as a terahertz/mid-infrared dielectric waveguide, we for the first time construct the spatially sub-nm resolved dielectric spectrum in a frequency band widely ranging from 1 to 100 THz regarding a membrane-water system, where the phospholipid bilayer is the major constituent of the myelin sheath. According to calculations on roughly divided head and tail regions of the bilayer, we find that the head region shows higher values of
Data availability statement
The original contributions presented in the study are included in the article/Supplementary Material, further inquiries can be directed to the corresponding author.
Author contributions
CC designed the research and revised the manuscript. ZZ and YL conducted the research and wrote the manuscript. ZX, YH, and RW validated the data and helped revise the manuscript.
Funding
This work is supported by the National Natural Science Foundation of China (Grant Nos T2241002, 12174449, and 61905286).
Conflict of interest
The authors declare that the research was conducted in the absence of any commercial or financial relationships that could be construed as a potential conflict of interest.
The handling editor JL declared a past collaboration with the author CC.
Publisher’s note
All claims expressed in this article are solely those of the authors and do not necessarily represent those of their affiliated organizations, or those of the publisher, the editors and the reviewers. Any product that may be evaluated in this article, or claim that may be made by its manufacturer, is not guaranteed or endorsed by the publisher.
References
Abraham, M. J., Murtola, T., Schulz, R., Páll, S., Smith, J. C., Hess, B., et al. (2015). GROMACS: High Performance Molecular Simulations through Multi-Level Parallelism from Laptops to Supercomputers. SoftwareX 1–2, 19–25. doi:10.1016/j.softx.2015.06.001
Antonov, I. P., Goroshkov, A. V., Kalyunov, V. N., Markhvida, I. V., Rubanov, A. S., and Tanin, L. V. (1983). Measurement of the Radial Distribution of the Refractive Index of the Schwann's Sheath and the Axon of a Myelinated Nerve Fiber In Vivo. J. Appl. Spectrosc. 39, 822–824. doi:10.1007/BF00662830
Barone, P. W., Baik, S., Heller, D. A., and Strano, M. S. (2005). Near-Infrared Optical Sensors Based on Single-Walled Carbon Nanotubes. Nat. Mat. 4, 86–92. doi:10.1038/nmat1276
Bertie, J. E., and Zhang, S. L. (1992). Infrared Intensities of Liquids. IX. The Kramers-Kronig Transform, and its Approximation by the Finite Hilbert Transform via Fast Fourier Transforms. Can. J. Chem. 70 (2), 520–531. doi:10.1139/v92-074
Brandman, R., Brandman, Y., and Pande, V. S. (2012). A-site Residues Move Independently from P-Site Residues in All-Atom Molecular Dynamics Simulations of the 70S Bacterial Ribosome. PLoS One 7 (1), e29377. doi:10.1371/journal.pone.0029377
Buchner, R., Barthel, J., and Stauber, J. (1999). The Dielectric Relaxation of Water between 0°C and 35°C. Chem. Phys. Lett. 306 (1–2), 57–63. doi:10.1016/S0009-2614(99)00455-8
Cao, X., Hancock, B. C., Leyva, N., Becker, J., Yu, W., and Masterson, V. M. (2009). Estimating the Refractive Index of Pharmaceutical Solids Using Predictive Methods. Int. J. Pharm. X. 368 (1–2), 16–23. doi:10.1016/j.ijpharm.2008.09.044
Cauchy, A. L. (1830). Sur la réfraction et la réflexion de la lumière. Bull. Des. Sc. Math. 14, 6–10.
Cheon, H., Yang, H.-J., Lee, S.-H., Kim, Y. A., and Son, J.-H. (2016). Terahertz Molecular Resonance of Cancer DNA. Sci. Rep. 6, 37103. doi:10.1038/srep37103
Davidov, D., Shemesh, D., Einstein, O., and Abookasis, D. (2021). Parametric Handheld Optical Probe (HOPE) for Biological Tissue Characterization in the Near-Infrared Spectral Range. Opt. Commun. 495, 127076. doi:10.1016/j.optcom.2021.127076
Fields, R. D. (2014). Myelin--More Than Insulation. Science 344 (6168), 264–266. doi:10.1126/science.1253851
Guo, Y., Pogodin, S., and Baulin, V. A. (2014). General Model of Phospholipid Bilayers in Fluid Phase within the Single Chain Mean Field Theory. J. Chem. Phys. 140 (17), 174903. doi:10.1063/1.4873586
Hale, G. M., and Querry, M. R. (1973). Optical Constants of Water in the 200-nm to 200-μm Wavelength Region. Appl. Opt. 12 (3), 555–563. doi:10.1364/AO.12.000555
Heyden, M., Sun, J., Funkner, S., Mathias, G., Forbert, H., Havenith, M., et al. (2010). Dissecting the THz Spectrum of Liquid Water from First Principles via Correlations in Time and Space. Proc. Natl. Acad. Sci. U. S. A. 107 (27), 12068–12073. doi:10.1073/pnas.0914885107
Hielscher, R., and Hellwig, P. (2012). Specific Far Infrared Spectroscopic Properties of Phospholipids. Spectrosc. Int. J. 27 (5–6), 525–532. doi:10.1155/2012/279650
Hishida, M., and Tanaka, K. (2011). Long-Range Hydration Effect of Lipid Membrane Studied by Terahertz Time-Domain Spectroscopy. Phys. Rev. Lett. 106 (15), 158102. doi:10.1103/PhysRevLett.106.158102
Iftimie, R., and Tuckerman, M. E. (2005). Decomposing Total IR Spectra of Aqueous Systems into Solute and Solvent Contributions: A Computational Approach Using Maximally Localized Wannier Orbitals. J. Chem. Phys. 122 (21), 214508. doi:10.1063/1.1908950
Jurczak, P., Szutkowski, K., Lach, S., Jurga, S., Czaplewska, P., Szymanska, A., et al. (2021). DMPC Phospholipid Bilayer as a Potential Interface for Human Cystatin C Oligomerization: Analysis of Protein-Liposome Interactions Using NMR Spectroscopy. Membranes 11 (1), 13. doi:10.3390/membranes11010013
Karplus, M., and McCammon, J. A. (2002). Molecular Dynamics Simulations of Biomolecules. Nat. Struct. Biol. 9 (9), 646–652. doi:10.1038/nsb0902-646
Kitagawa, J., Ohkubo, T., Onuma, M., and Kadoya, Y. (2006). THz Spectroscopic Characterization of Biomolecule/Water Systems by Compact Sensor Chips. Appl. Phys. Lett. 89 (4), 041114. doi:10.1063/1.2236295
Kolb, B., and Whishaw, I. Q. (1980). Fundamentals of Human Neuropsychology. San Francisco: W.H. Freeman & Company.
Krishnamoorthy, A., Nomura, K., Baradwaj, N., Shimamura, K., Rajak, P., Mishra, A., et al. (2021). Dielectric Constant of Liquid Water Determined with Neural Network Quantum Molecular Dynamics. Phys. Rev. Lett. 126 (21), 216403. doi:10.1103/PhysRevLett.126.216403
Kučerka, N., Nieh, M.-P., and Katsaras, J. (2011). Fluid Phase Lipid Areas and Bilayer Thicknesses of Commonly Used Phosphatidylcholines as a Function of Temperature. Biochimica Biophysica Acta - Biomembr. 1808 (11), 2761–2771. doi:10.1016/j.bbamem.2011.07.022
Li, Y., Chang, C., Zhu, Z., Sun, L., and Fan, C. (2021). Terahertz Wave Enhances Permeability of the Voltage-Gated Calcium Channel. J. Am. Chem. Soc. 143 (11), 4311–4318. doi:10.1021/jacs.0c09401
Li, Y., Zhu, Z., Sun, L., Fan, C., and Chang, C. (2022). Physicochemical Insights on Terahertz Wave Diminished Side Effects of Drugs from Slow Dissociation. ACS Nano 16 (5), 8419–8426. doi:10.1021/acsnano.2c02952
Liu, G., Chang, C., Qiao, Z., Wu, K., Zhu, Z., Cui, G., et al. (2019). Myelin Sheath as a Dielectric Waveguide for Signal Propagation in the Mid-infrared to Terahertz Spectral Range. Adv. Funct. Mat. 29 (7), 1807862. doi:10.1002/adfm.201807862
Midi, N. S., Ohyama, K., Sasaki, R.-i., and Shinyashiki, N. (2014). Broadband Complex Dielectric Constants of Water and Sodium Chloride Aqueous Solutions with Different DC Conductivities. IEEJ Trans. Elec. Electron. Eng. 9 (S1), S8–S12. doi:10.1002/tee.22036
Mittal, S., Yeh, K., Leslie, L. S., Kenkel, S., Kajdacsy-Balla, A., and Bhargava, R. (2018). Simultaneous Cancer and Tumor Microenvironment Subtyping Using Confocal Infrared Microscopy for All-Digital Molecular Histopathology. Proc. Natl. Acad. Sci. U. S. A. 115 (25), E5651–E5660. doi:10.1073/pnas.1719551115
Molugu, T. R., Lee, S., and Brown, M. F. (2017). Concepts and Methods of Solid-State NMR Spectroscopy Applied to Biomembranes. Chem. Rev. 117 (19), 12087–12132. doi:10.1021/acs.chemrev.6b00619
Paracini, N., Clifton, L. A., Skoda, M. W. A., and Lakey, J. H. (2018). Liquid Crystalline Bacterial Outer Membranes Are Critical for Antibiotic Susceptibility. Proc. Natl. Acad. Sci. U. S. A. 115 (32), E7587–E7594. doi:10.1073/pnas.1803975115
Park, S. H., Wu, J., Yao, Y., Singh, C., Tian, Y., Marassi, F. M., et al. (2020). Membrane Proteins in Magnetically Aligned Phospholipid Polymer Discs for Solid-State NMR Spectroscopy. Biochimica Biophysica Acta - Biomembr. 1862 (9), 183333. doi:10.1016/j.bbamem.2020.183333
Parthasarathy, R., Globus, T., Khromova, T., Swami, N., and Woolard, D. (2005). Dielectric Properties of Biological Molecules in the Terahertz Gap. Appl. Phys. Lett. 87 (11), 113901. doi:10.1063/1.2046730
Pethig, R., and Kell, D. B. (1987). The Passive Electrical Properties of Biological Systems: Their Significance in Physiology, Biophysics and Biotechnology. Phys. Med. Biol. 32 (8), 933–970. doi:10.1088/0031-9155/32/8/001
Praprotnik, M., and Janežič, D. (2005). Molecular Dynamics Integration and Molecular Vibrational Theory. III. The Infrared Spectrum of Water. J. Chem. Phys. 122 (17), 174103. doi:10.1063/1.1884609
Rahman, E., Powner, M. B., Kyriacou, P. A., and Triantis, I. F. (2018). Assessment of the Complex Refractive Indices of Xenopus Laevis Sciatic Nerve for the Optimization of Optical (NIR) Neurostimulation. IEEE Trans. Neural Syst. Rehabil. Eng. 26 (12), 2306–2314. doi:10.1109/TNSRE.2018.2878107
Rinholm, J. E., and Bergersen, L. H. (2012). The Wrap that Feeds Neurons. Nature 487 (7408), 435–436. doi:10.1038/487435a
Rodrigo, D., Limaj, O., Janner, D., Etezadi, D., de Abajo, F. J. G., Pruneri, V., et al. (2015). Mid-Infrared Plasmonic Biosensing with Graphene. Science 349 (6244), 165–168. doi:10.1126/science.aab2051
Rowe, P. M., Fergoda, M., and Neshyba, S. (2020). Temperature-Dependent Optical Properties of Liquid Water from 240 to 298 K. J. Geophys. Res. Atmos. 125 (17), e2020JD032624. doi:10.1029/2020JD032624
Segelstein, D. J. (1981). The Complex Refractive Index of Water. Kansas City: University of Missouri-Kansas City.
Siddiquee, A. M., Hasan, I. Y., Wei, S. B., Langley, D., Balaur, E., Liu, C., et al. (2019). Visualization and Measurement of the Local Absorption Coefficients of Single Bilayer Phospholipid Membranes Using Scanning Near-Field Optical Microscopy. Biomed. Opt. Express 10 (12), 6569–6579. doi:10.1364/BOE.10.006569
Stern, H. A., and Feller, S. E. (2003). Calculation of the Dielectric Permittivity Profile for a Nonuniform System: Application to a Lipid Bilayer Simulation. J. Chem. Phys. 118 (7), 3401–3412. doi:10.1063/1.1537244
Sun, L., Li, Y., Yu, Y., Wang, P., Zhu, S., Wu, K., et al. (2022). Inhibition of Cancer Cell Migration and Glycolysis by Terahertz Wave Modulation via Altered Chromatin Accessibility. Research. 2022, 9860679. doi:10.34133/2022/9860679
Tanizaki, S., and Feig, M. (2005). A Generalized Born Formalism for Heterogeneous Dielectric Environments: Application to the Implicit Modeling of Biological Membranes. J. Chem. Phys. 122 (12), 124706. doi:10.1063/1.1865992
Tayebi, B., Kim, W., Sharif, F., Yoon, B. J., and Han, J. H. (2019). Single-Shot and Label-free Refractive Index Dispersion of Single Nerve Fiber by Triple-Wavelength Diffraction Phase Microscopy. IEEE J. Sel. Top. Quantum Electron. 25 (1), 1–8. doi:10.1109/JSTQE.2018.2814740
Turker-Kaya, S., and Huck, C. W. (2017). A Review of Mid-infrared and Near-Infrared Imaging: Principles, Concepts and Applications in Plant Tissue Analysis. Molecules 22 (1), 168. doi:10.3390/molecules22010168
Vogel, A. I. (1948). Physical Properties and Chemical Constitution. Part XXIII. Miscellaneous Compounds. Investigation of the So-Called Co-ordinate or Dative Link in Esters of Oxy-Acids and in Nitro-Paraffins by Molecular Refractivity Determinations. Atomic, Structural, and Group Parachors and Refractivities. J. Chem. Soc., 1833–1855. doi:10.1039/JR9480001833
Wohlert, J., and Edholm, O. (2006). Dynamics in Atomistic Simulations of Phospholipid Membranes: Nuclear Magnetic Resonance Relaxation Rates and Lateral Diffusion. J. Chem. Phys. 125 (20), 204703. doi:10.1063/1.2393240
Zhang, J., He, Y., Liang, S., Liao, X., Li, T., Qiao, Z., et al. (2021). Non-Invasive, Opsin-free Mid-infrared Modulation Activates Cortical Neurons and Accelerates Associative Learning. Nat. Commun. 12, 2730. doi:10.1038/s41467-021-23025-y
Zhao, G., Perilla, J. R., Yufenyuy, E. L., Meng, X., Chen, B., Ning, J., et al. (2013). Mature HIV-1 Capsid Structure by Cryo-Electron Microscopy and All-Atom Molecular Dynamics. Nature 497, 643–646. doi:10.1038/nature12162
Zhou, F., and Schulten, K. (1995). Molecular Dynamics Study of a Membrane-Water Interface. J. Phys. Chem. 99 (7), 2194–2207. doi:10.1021/j100007a059
Keywords: myelinated nerve fiber, phospholipid bilayer, terahertz/mid-infrared, optical/dielectric constants, subnanometer resolution
Citation: Zhang Z, Li Y, Xiang Z, Huang Y, Wang R and Chang C (2022) Dielectric dispersion characteristics of the phospholipid bilayer with subnanometer resolution from terahertz to mid-infrared. Front. Bioeng. Biotechnol. 10:984880. doi: 10.3389/fbioe.2022.984880
Received: 02 July 2022; Accepted: 08 August 2022;
Published: 31 August 2022.
Edited by:
Junhong Lü, Shanghai Advanced Research Institute (CAS), ChinaReviewed by:
Yubin Gong, University of Electronic Science and Technology of China, ChinaXiao-Yu Peng, Chongqing Institute of Green and Intelligent Technology (CAS), China
Copyright © 2022 Zhang, Li, Xiang, Huang, Wang and Chang. This is an open-access article distributed under the terms of the Creative Commons Attribution License (CC BY). The use, distribution or reproduction in other forums is permitted, provided the original author(s) and the copyright owner(s) are credited and that the original publication in this journal is cited, in accordance with accepted academic practice. No use, distribution or reproduction is permitted which does not comply with these terms.
*Correspondence: Chao Chang, Y2hhbmdjQHhqdHUuZWR1LmNu
†These authors have contributed equally to this work
 Ziyi Zhang
 Yangmei Li
 Zuoxian Xiang1


