 Zhende Jiang
 Qianpeng Zhang
 Lei Ren
 Zhihui Qian
94% of researchers rate our articles as excellent or good
Learn more about the work of our research integrity team to safeguard the quality of each article we publish.
Find out more
ORIGINAL RESEARCH article
Front. Bioeng. Biotechnol., 06 September 2022
Sec. Biomechanics
Volume 10 - 2022 | https://doi.org/10.3389/fbioe.2022.961462
This article is part of the Research TopicMethods In Biomechanics and BionicsView all 18 articles
Flatfoot is a common foot deformity that seriously affects the quality of life. The aim of this study is to develop an accurate and noninvasive method for the diagnosis of flatfoot based on B-mode ultrasound. In this study, 51 patients (the flatfoot group) and 43 healthy subjects (the control group) were included. The plantar fascia angle, a new measurement for use in the diagnosis of flatfoot is proposed, as determined using B-mode ultrasound. For comparison, the calcaneal pitch angle and medial cuneiform height were also measured using lateral X-radiography, based on traditional diagnostic methods. The intraclass correlation values of the plantar fascia angle, the calcaneal pitch angle, and the medial cuneiform height were all more than 0.95, and there is a moderate correlation (r = 0.51) between the medial cuneiform height and the calcaneal pitch angle, and an excellent correlation (r = 0.85) between the plantar fascia angle and the calcaneal pitch angle. The optimal cutoff value, sensitivity, and specificity for medial cuneiform height in flatfoot diagnosis were 12.8 mm, 93.0%, and 54.9%, respectively. The optimal cutoff value, sensitivity, and specificity for plantar fascia angle in flatfoot diagnosis were 9.8°, 97.7%, and 94.1%, respectively. The proposed plantar fascia angle has good sensitivity and specificity in diagnosing flatfoot, therefore supplying a new approach for the noninvasive diagnosis of flatfoot.
The human foot is a complex system comprising 26 bones, 33 joints, and more than 100 muscles, tendons, and ligaments. It plays an important role in human weight-bearing and propulsion (Oleksy et al., 2010). Flatfoot is a common type of foot deformity, in which the foot has little or no arch (Sung, 2016). It has been confirmed that flatfoot is a complex deformity, that is, highly related to abnormal changes in the medial longitudinal arch (Pehlivan et al., 2009; Shibuya et al., 2010; Abousayed et al., 2017). Though a study showed that the quality of life seemed not to be influenced by the height of foot arch (Lopez-Lopez et al., 2018), many studies demonstrated that the lower foot arch of flatfoot can lead to abnormal gait and lower-limb alignment, affect the function of shock absorption, and lead to plantar fasciitis (PF), medial tibial stress syndrome, patellar tendon disease, and other problems, and seriously affect the quality of life (Kohls-Gatzoulis et al., 2004; Wearing et al., 2006; Levinger et al., 2010; Van der Worp et al., 2011; Hamstra-Wright et al., 2015).
Diagnostic methods of flatfoot mainly include physical examination and imaging examination (Abousayed et al., 2017). Physical examination is mainly carried out through visual examination, palpation, and mobility measurement. Visual examination mainly involves observing the shape and alignment of the foot; the most commonly used rating tools are the foot posture index (FPI-6) and footprints. FPI-6 allows the foot to be evaluated on three planes; it is composed of six separate evaluation parts, and summarizes the results to reflect the posture of the foot (Oleksy et al., 2010). Palpation is mainly carried out along the posterior tibial tendon to determine whether there is posterior tibial tendonitis or posterior tibial tendon rupture (Abousayed et al., 2017). Mobility measurement is mainly conducted to evaluate muscle strength and movement; for example, the dorsal flexion test is used to judge the tension of the gastrocnemius–soleus muscle complex and the heel lifting test is used to judge the function of the posterior tibial tendon (Abousayed et al., 2017). However, the results of physical examination will be affected by the subjective judgment of podiatrists, and it is troublesome to obtain and measure accurate footprints, so imaging diagnosis is necessary to further clarify the diagnosis and severity of the disease (Bock P, 2018).
The evaluation of X-radiographs of the weight-bearing foot and ankle is still the gold standard for the diagnosis of flatfoot and pes cavus (Abousayed et al., 2017). Anteroposterior X-radiography of the weight-bearing foot can show abduction of the forefoot and the uncovered talus. Many parameters are used to evaluate the uncovered talus, including the talus coverage angle, the percentage of uncovered talus, and the lateral discordant angle (Deland, 2008; Chan et al., 2015). The calcaneal pitch angle and medial cuneiform height of the talus can be measured using lateral X-radiographs of the weight-bearing foot (Younger et al., 2005; Bock et al., 2018). Magnetic resonance imaging and ultrasonography are mainly used for preoperative evaluation of the posterior tibial tendon, spring ligament, and plantar fascia, in order to optimize operation plans (Harish et al., 2008; Arnoldner et al., 2015; Abousayed et al., 2017). A great contribution of the ultrasound is that it opens the opportunity to measure parameters such as the size, shape, angle and biomechanical properties of the muscle, tendon, ligament and fascia (Romero-Morales et al., 2019; Schillizzi et al., 2020; Romero-Morales et al., 2021), of which the angle of the plantar fascia based on ultrasound was the specifically we are looking at in relation to flatfoot.
X-radiography is important in flatfoot diagnosis (Abousayed et al., 2017). However, X-radiation has potential radiological hazard (Prasarn, 2014). Therefore, the study of rapid, non-radiological, quantifiable and convenient methods for the diagnosis of flatfoot has important clinical significance and social value. As is known, the plantar fascia, as the main structure connecting the calcaneus and the proximal phalanges, maintains the shape and function of the longitudinal arch of the foot (Orchard, 2012; McKeon et al., 2015). When the medial longitudinal arch changes, the characteristics of the plantar fascia will change accordingly. At present, there are many reports on the characteristics of plantar fascia in flatfoot (Wang et al., 2019; Qian et al., 2021). However, to the authors’ knowledge, the characteristics of the plantar fascia angle (the angle between the plantar fascia and horizontal line) in flatfoot have not been reported to date.
Previous studies have shown that the calcaneal pitch angle and the medial cuneiform height are effective diagnostic methods for flatfoot (Bock et al., 2018; Flores et al., 2019). Therefore, this study takes the calcaneal pitch angle measured from X-radiographs of the lateral weight-bearing foot as the diagnostic gold standard; the plantar fascia angle in patients with flatfoot was measured to explore the relationship between the plantar fascia angle and the diagnosis of flatfoot. The value of the plantar fascia angle in diagnosing flatfoot was evaluated by comparing it with the medial cuneiform height. It is hypothesized that the plantar fascia angle would be influenced by the height of the arch, and the plantar fascia angle would be an effective method for the diagnosis of flatfoot. The purpose of this study is to propose a non-invasive method for flatfoot diagnosis based on ultrasound.
This study was based on the principles outlined in the Declaration of Helsinki, and was approved by the Ethics Committee of the Second Hospital of Jilin University (No.2020085). All volunteers who participated in the study signed a written informed consent agreement.
This is a prospective study. The sample size calculated by G-Power (Kang, 2021) was 22 when α = 0.05, power = 0.95, based on pre-experiments. The inclusion criteria of the experimental group were: ①patients treated in the outpatient center of the Second Hospital of Jilin University from April 2021 to December 2021; ② ages of the patients ≥ 18 years old; ③ the calcaneal pitch angle of the patients were less than 20°. Healthy adults with similar age, sex, height, and weight were selected as the control group. The exclusion criteria were: ①a history of foot trauma or surgery; ②a diagnosis of systemic disease, such as rheumatoid arthritis, diabetes, or gout; ③a diagnosis of local disease, such as plantar fibromatosis.
A Wisonic ultrasonic scanner (Navis, Wisonic) was used in B mode to measure the plantar fascia angle. The linear transducer frequency was 10–2 MHz. During measurement, each subject lay prone on the examination bed, with the lower limbs straight and the feet hanging over the edge of the examination bed in a neutral position (Haen et al., 2017) (Figure 1). The upper body and legs were relaxed.
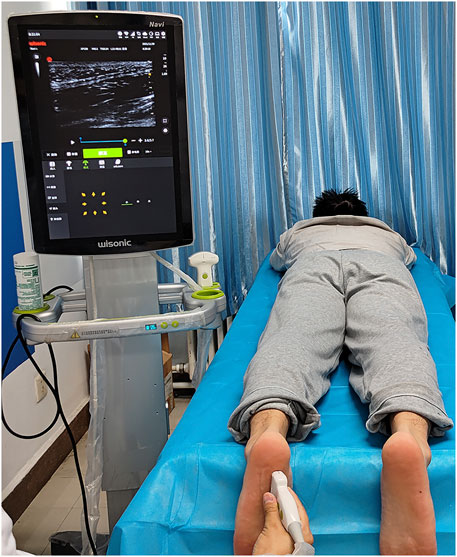
FIGURE 1. Position for ultrasound measurement of plantar fascia angle.
The probe was placed under the navicular and medial cuneiform along the long axis of the plantar fascia, and the mark point of the probe was towards to the calcaneus, so that the proximal end of plantar fascia could be presented on the left side of the ultrasound image. In this study, the sampling depth was 3 cm, and the mechanical index was 0.7. The probe was gently placed on the plantar surface and two-dimensional ultrasound images were taken.
After ultrasonic examination, X-radiography of the weight-bearing foot was performed by an experienced radiologist. The calcaneal pitch angle and medial cuneiform height were measured from the lateral X-radiograph (Figure 2A) by an experienced radiologist. The calcaneal pitch angle is the angle between a line drawn along the most inferior part of the calcaneus and the supporting surface. (Abousayed et al., 2017) The medial cuneiform height is the distance from the lowest point of medial cuneiform to the line that connect the lowest point of calcaneus and the lowest point of the sesamoids of the first metatarsal (Bock P, 2018). The plantar fascia angle (Figure 2B) is defined as the angle between the plantar fascia and the horizontal line (the line parallel to the probe and skin), which was measured by an experienced ultrasonographer, who was unknown to the results of X-Ray. The plantar fascia angle, calcaneal pitch angle, and medial cuneiform height were measured three times each, to ensure reproducibility.
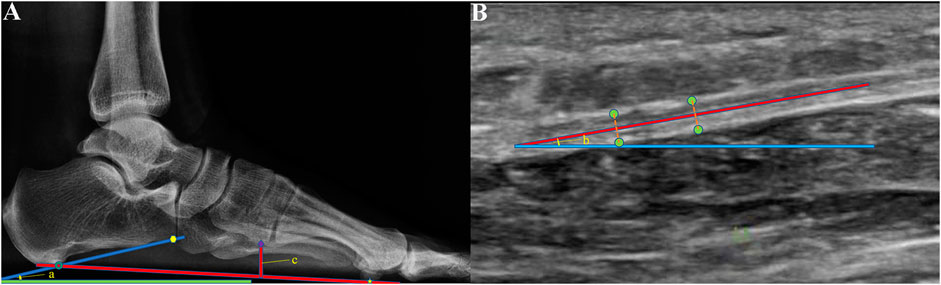
FIGURE 2. (A) Calcaneal pitch angle (angle a) and medial cuneiform height (c) were measured from X-radiographs of the weight-bearing foot. Calcaneal pitch angle is the angle between the supporting surface (green line) and the line (dark blue line) connected the lowest point of calcaneus (dark green circle) and the lowest point of the anterior edge of the calcaneus (yellow point). Medial cuneiform height is the distance from the lowest point of the medical cuneiform (the purple rhombic point) to the line that connected the lowest point of calcaneus (dark green circle) and the lowest point of the sesamoid under the first metatarsal (yellow five-point star). (B) Plantar fascia angle (angle b) was measured using B-mode ultrasound. It was defined as the angle between the middle line (red line) of the plantar fascia and the horizontal line (the blue line parallel to the probe and skin). The green points were the edge of the plantar fascia.
The data were analyzed using IBM Statistical Package for the Social Sciences (SPSS) version 26.0 (SPSS Inc., IL). Continuous variables (age, height, weight, calcaneal pitch angle, plantar fascia angle, and medial cuneiform height) were expressed as mean ± standard deviation. The χ2 test was used to analyze differences between the sexes in the flatfoot and control groups. Firstly, intraclass correlation (ICC) analysis of plantar fascia angle, calcaneal pitch angle, and medial cuneiform height was conducted, and the 95% confidence intervals (95% CIs) and ICC values were calculated. Secondly, Pearson correlation analysis was conducted between the calcaneal pitch angle, plantar fascia angle, and medial cuneiform height. The absolute value of the Pearson correlation coefficient (r) was classified as poor (0.00 ± 0.20), fair (0.21 ± 0.40), moderate (0.41 ± 0.60), good (0.61 ± 0.80), or excellent (0.81 ± 1.00) (Landis JR, 1977). Thirdly, receiver operating characteristic (ROC) curves for all parameters were obtained to calculate sensitivity, specificity, area under the curve (AUC), and optimal cutoff value. The AUCs were compared using the Z test. Finally, sex, age, side (left or right) and PF (With or Without) were set as classification parameters to compare their influences on plantar fascia angle and medial cuneiform height. Statistical significance was considered for p < 0.05.
51 patients with flatfoot and 43 healthy subjects were included in the study. Firstly, the basic characteristics of the two groups were compared and analyzed; the results are shown in Table 1. The χ2 test was used for sex comparison, and the independent sample t test was used for comparisons of age, height, and weight. Values of p are all greater than 0.05. That is, there was no statistical difference in sex, age, height, and weight between the flatfoot group and the control group.

TABLE 1. Basic characteristics of flatfoot and control groups.
Intraclass correlation analysis of plantar fascia angle, calcaneal pitch angle, and medial cuneiform height was conducted; the results are shown in Table 2. The ICC values of the three parameters are all greater than 0.9; this indicates that the three parameters had good intra-observer reproducibility.

TABLE 2. Intraclass correlation (ICC) values and 95% confidence intervals (95% CIs) of the measured parameters.
Figure 3A is a scatter plot of medial cuneiform height with respect to calcaneal pitch angle for all subjects; Figure 3B is a scatter plot of plantar fascia angle with respect to calcaneal pitch angle for all subjects. There is a moderate correlation (r = 0.51, p < 0.001) between medial cuneiform height and calcaneal pitch angle; the correlation between plantar fascia angle and calcaneal pitch angle is excellent (r = 0.85, p < 0.001).
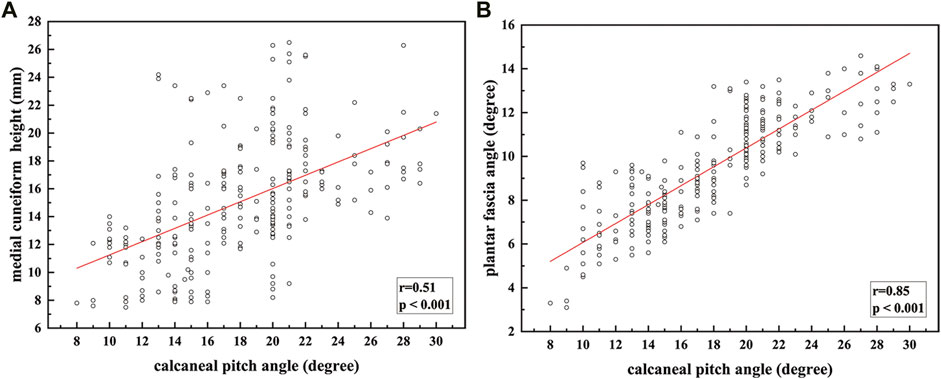
FIGURE 3. Fitting relationship between calcaneal pitch angle and: (A) medial cuneiform height; (B) plantar fascia angle.
The ROC curves for the medial cuneiform height and the plantar fascia angle are shown in Figure 4. The AUC for the medial cuneiform height is 0.775 (0.679–0.871); that for the plantar fascia angle is 0.973 (0.935–1.000). The optimal cutoff value, sensitivity, and specificity for the medial cuneiform height in flatfoot diagnosis are 12.8 mm, 93.0%, and 54.9%, respectively; the optimal cutoff value, sensitivity, and specificity for the plantar fascia angle in flatfoot diagnosis are 9.8°, 97.7%, and 94.1%, respectively. The results for the AUC were compared using the Z test. The AUC for the plantar fascia angle is more significant than that for the medial cuneiform height (Z = 2.55, p = 0.0108); this suggests that the plantar fascia angle has better diagnostic efficiency in the diagnosis of flatfoot. The AUC for the plantar fascia angle is not more statistically significant than that for the calcaneal pitch angle (Z = 1.42, p = 0.1556); this suggests that the plantar fascia angle has the same diagnostic efficiency as calcaneal pitch angle in the diagnosis of flatfoot.
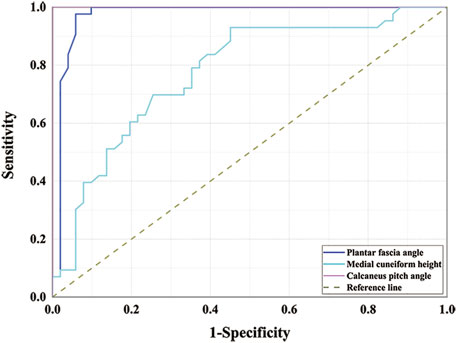
FIGURE 4. Receiver operating characteristic curves for medial cuneiform height and plantar fascia angle.
The influences of sex, age, and side (left or right) on plantar fascia angle and medial cuneiform height are shown in Table 3. There was no difference in sex and side (p > 0.05), while statistical differences were found between groups of different ages in plantar fascia angle. Between subjects younger and older than 40 years, the value of p was 0.023. Between subjects younger and older than 50 years, the value of p was 0.001. These results show that the plantar fascia angle is decreased for subjects older than 40 years.
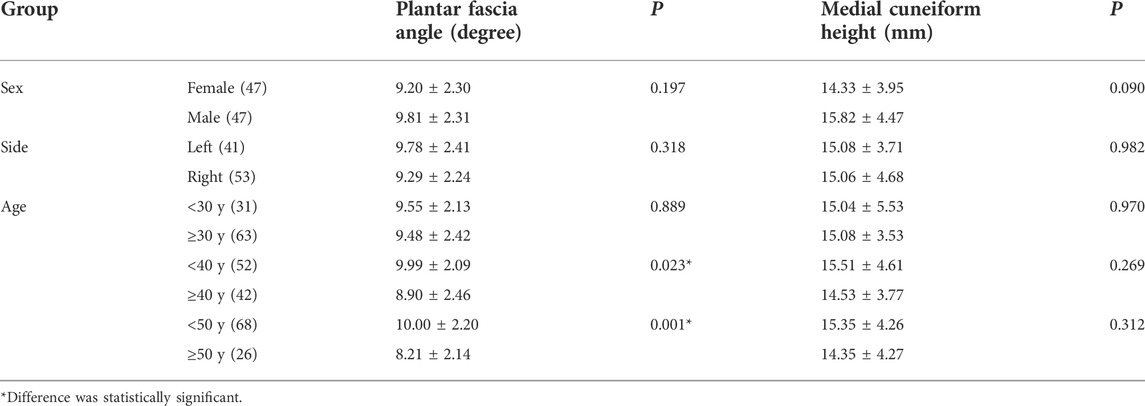
TABLE 3. The influences of sex, age, side (left or right) on plantar fascia angle and medial cuneiform height.
The influence of PF was shown in Table 4. The results showed that the plantar fascia angle would not be influenced by PF both in the flatfoot group and the healthy control group.
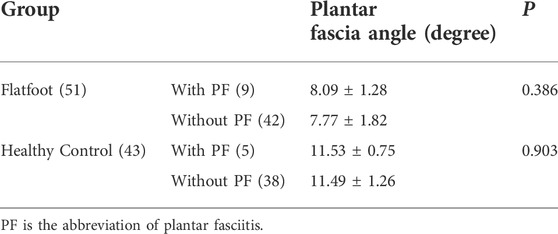
TABLE 4. The influences of plantar fasciitis on plantar fascia angle.
Flatfoot is a common foot disease, which can seriously affect the quality of life (Kohls-Gatzoulis et al., 2004; Wearing et al., 2006; Levinger et al., 2010; Van der Worp et al., 2011; Hamstra-Wright et al., 2015). At present, X-radiography of the weight-bearing foot is still the gold standard for the diagnosis of flatfoot (Abousayed et al., 2017). However, radiological diagnosis has led to a 600% increase in medical radiation exposure of the United States population (Linet et al., 2012). X-radiation is a known carcinogen that can cause malignancy (Prasarn, 2014), which can be accumulated (Giordano et al., 2009; Giordano et al., 2011; Taher et al., 2013). Thus, exploration of a nonionizing examination method is of great significance in the clinical field. In this study, ultrasound was used to measure the angle of the plantar fascia for the diagnosis of flatfoot. The calcaneal pitch angle measured from a lateral X-radiograph of the weight-bearing foot was used as a gold standard, and the diagnostic effect of the plantar fascia angle was studied and compared with the diagnostic efficiency of medial cuneiform height.
According to the results, there is no statistical difference in the basic characteristics between the flatfoot group and the control group (p > 0.05). Analysis of the measured results showed that the ICC values are all greater than 0.95, indicating that the values of the three parameters have good intra-observer reproducibility. Studies have also shown that the calcaneal pitch angle and the medial cuneiform height have a high degree of reliability between observers (Bock et al., 2018). Pearson correlation analysis was conducted between the medial cuneiform height, plantar fascia angle, and calcaneal pitch angle; the results show an excellent correlation between plantar fascia angle and calcaneal pitch angle (r = 0.85), better than that between medial cuneiform height and calcaneal pitch angle (r = 0.51).
In addition, the area under the ROC curve was used to test the diagnostic efficiency. The AUCs for the medial cuneiform height and plantar fascia angle are 0.775 and 0.973, respectively. Both of these measures have good diagnostic effect. The AUC for the plantar fascia angle is more significant than that for the medial cuneiform height (Z = 2.55, p = 0.0108); this suggests that the plantar fascia angle has better diagnostic efficiency in the diagnosis of flatfoot. The AUC for the plantar fascia angle is not more statistically significant than that for the calcaneal pitch angle (Z = 1.42, p = 0.1556); this suggests that the plantar fascia angle has the same diagnostic efficiency as calcaneal pitch angle in the diagnosis of flatfoot.
The sensitivity and specificity of the two methods for the diagnosis of flatfoot were calculated using the Youden index. The results show that the optimal cutoff value of plantar fascia angle to diagnose flatfoot is 9.8°; that is, when the measured plantar fascia angle is less than 9.8°, a diagnosis of flatfoot is indicated. The sensitivity and specificity of using this value to diagnose flatfoot are 97.7 and 94.1%, respectively. The optimal cutoff value of medial cuneiform height to diagnose flatfoot is 12.8 mm; that is, when the measured medial cuneiform height is less than 12.8 mm, flatfoot can be diagnosed. The sensitivity and specificity of using this value to diagnose flatfoot are 93.0 and 54.9%, respectively. The specificity of the plantar fascia angle is greater than that of medial cuneiform height. The specificity of the medial cuneiform height might be low because the medial cuneiform height is likely to be influenced by the varus and valgus of the foot.
The subject’s sex and the side of the affected foot did not influence the results for plantar fascia and medial cuneiform height (p > 0.05). However, the plantar fascia angle was affected in subjects older than 40 years. The results show statistical differences in plantar fascia angle between groups of different ages. Between subjects younger and older than 40 years, the value of p was 0.023. Between subjects younger and older than 50 years, the value of p was 0.001. Tas and Cetin (Tas and Cetin, 2019) also report that age is a potential parameter that might affect the morphologies and mechanical properties of plantar muscles. Changes in morphology and mechanical properties of plantar muscles would influence the medial longitudinal arch, leading to a change in the plantar fascia angle. In addition, the results of the study showed that the plantar fascia angle was not affected by plantar fasciitis. It may be for the reason that the plantar fasciitis was always happened at the insertion portion of plantar fascia (Orchard, 2012), while the plantar fascia angle was measured at the portion of the plantar fascia under the navicular and medial cuneiform, so plantar fascia angle would not be influenced by plantar fasciitis.
Ultrasound is a good tool in disease diagnosis; it is convenient, low-cost, and nonionizing. In the diagnosis of flatfoot, the plantar fascia angle measured using B-mode ultrasound has good sensitivity and specificity, as well as good intra-observer reproducibility. At the same time, it is portable and noninvasive; thus, it is more applicable in the diagnosis of flatfoot for disabled patients and children.
There are limitations in this study. Firstly, the flatfoot in this study was not graded according to severity. The role of plantar fascia angle in diagnosing the severity of flatfoot needs further study. Secondly, flatfoot can present different clinical manifestations, such as with or without hindfoot valgus, forefoot abduction, etc. (Hillstrom et al., 2013). These different clinical manifestations may influence the test results; this is to be considered in future work. Thirdly, the different conditions of the ankle/foot in X-ray (weight-bearing) and ultrasound (non-weight-bearing) would be a limitation for this study. However, even under the condition of non-weight-bearing, the plantar fascia angle still showed significant statistical difference between flatfoot (7.83 + 1.74°) and the healthy control (11.49 + 1.21°), p < 0.001; In addition, the plantar fascia angle showed an excellent correlation with calcaneal pitch angle and the sensitivity and specificity in diagnosing flatfoot is also excellent.
Plantar fascia angle has an excellent sensitivity and specificity in diagnosing flatfoot, and there is good intra-observer reproducibility within this study, thus, it could seem to be an effective method to diagnose flatfoot, especially when it was used for flatfoot screening. However, further studies in larger populations with different flatfoot grades and different clinical manifestations are warranted to confirm these promising results.
The original contributions presented in the study are included in the article/supplementary material, further inquiries can be directed to the corresponding authors.
The studies involving human participants were reviewed and approved by the Ethics Committee of the Second Hospital of Jilin University. The patients/participants provided their written informed consent to participate in this study.
ZJ was responsible for the experiments and manuscript preparation. QZ participated in measurement of data. LR and ZQ worked as supervisors for all procedures.
This research was supported by the project of National Natural Science Foundation of China (No. 52175270, 52005209), the Project of Scientific and Technological Development Plan of Jilin Province (No.20220508130RC), the Key Project of the National Natural Science Foundation of China (No.91848204), and the Interdisciplinary Research Funding Program for Doctoral Students of Jilin University (No. 101832020DJX049).
The authors declare that the research was conducted in the absence of any commercial or financial relationships that could be construed as a potential conflict of interest.
All claims expressed in this article are solely those of the authors and do not necessarily represent those of their affiliated organizations, or those of the publisher, the editors and the reviewers. Any product that may be evaluated in this article, or claim that may be made by its manufacturer, is not guaranteed or endorsed by the publisher.
PF, plantar fasciitis; FPI-6, foot posture index; ICC, intraclass correlation; 95% CIs, 95% confidence intervals; ROC, receiver operating characteristic; AUC, area under the curve.
Abousayed, M. M., Alley, M. C., Shakked, R., and Rosenbaum, A. J. (2017). Adult-Acquired flatfoot deformity. JBJS Rev. 5, e7. doi:10.2106/jbjs.Rvw.16.00116
Arnoldner, M. A., Gruber, M., Syre, S., Kristen, K. H., Trnka, H. J., Kainberger, F., et al. (2015). Imaging of posterior tibial tendon dysfunction--Comparison of high-resolution ultrasound and 3T MRI. Eur. J. Radiol. 84, 1777–1781. doi:10.1016/j.ejrad.2015.05.021
Bock, P., Pittermann, M., Chraim, M., and Rois, S. (2018). The inter- and intraobserver reliability for the radiological parameters of flatfoot, before and after surgery. Bone Jt. J. 100, 596–602. doi:10.1302/0301-620x.100b5.bjj-2017-1279
Chan, J. Y., Greenfield, S. T., Soukup, D. S., Do, H. T., Deland, J. T., and Ellis, S. J. (2015). Contribution of lateral column lengthening to correction of forefoot abduction in stage IIb adult acquired flatfoot deformity reconstruction. Foot Ankle Int. 36, 1400–1411. doi:10.1177/1071100715596607
Deland, J. T. (2008). Adult-acquired flatfoot deformity. J. Am. Acad. Orthop. Surg. 16, 399–406. doi:10.5435/00124635-200807000-00005
Flores, D. V., Mejia Gomez, C., Fernandez Hernando, M., Davis, M. A., and Pathria, M. N. (2019). Adult acquired flatfoot deformity: Anatomy, biomechanics, staging, and imaging findings. Radiographics 39, 1437–1460. doi:10.1148/rg.2019190046
Giordano, B. D., Rechtine, G. R., 2nd, , and Morgan, T. L. (2009). Minimally invasive surgery and radiation exposure. J. Neurosurg. Spine 11, 375–376. doi:10.3171/2009.2.spine0918l
Giordano, B. D., Grauer, J. N., Miller, C. P., Morgan, T. L., Rechtine, G. R., and 2nd, (2011). Radiation exposure issues in orthopaedics. J. Bone Jt. Surg. 93, e69–10. doi:10.2106/JBJS.J.01328
Haen, T. X., Roux, A., Soubeyrand, M., and Laporte, S. (2017). Shear waves elastography for assessment of human achilles tendon’s biomechanical properties: An experimental study. J. Mech. Behav. Biomed. Mater. 69, 178–184. doi:10.1016/j.jmbbm.2017.01.007
Hamstra-Wright, K. L., Bliven, K. C., and Bay, C. (2015). Risk factors for medial tibial stress syndrome in physically active individuals such as runners and military personnel: A systematic review and meta-analysis. Br. J. Sports Med. 49, 362–369. doi:10.1136/bjsports-2014-093462
Harish, S., Kumbhare, D., O'neill, J., and Popowich, T. (2008). Comparison of sonography and magnetic resonance imaging for spring ligament abnormalities: Preliminary study. J. Ultrasound Med. 27, 1145–1152. doi:10.7863/jum.2008.27.8.1145
Hillstrom, H. J., Song, J., Kraszewski, A. P., Hafer, J. F., Mootanah, R., Dufour, A. B., et al. (2013). Foot type biomechanics part 1: Structure and function of the asymptomatic foot. Gait Posture 37, 445–451. doi:10.1016/j.gaitpost.2012.09.007
Kang, H. (2021). Sample size determination and power analysis using the G*Power software. J. Educ. Eval. Health Prof. 18, 17. doi:10.3352/jeehp.2021.18.17
Kohls-Gatzoulis, J., Angel, J. C., Singh, D., Haddad, F., Livingstone, J., and Berry, G. (2004). Tibialis posterior dysfunction: A common and treatable cause of adult acquired flatfoot. BMJ 329, 1328–1333. doi:10.1136/bmj.329.7478.1328
Landis, K. G., and Koch, G. G. (1977). The measurement of observer agreement for categorical data. Biometrics 33, 159–174. doi:10.2307/2529310
Levinger, P., Murley, G. S., Barton, C. J., Cotchett, M. P., Mcsweeney, S. R., and Menz, H. B. (2010). A comparison of foot kinematics in people with normal- and flat-arched feet using the Oxford Foot Model. Gait Posture 32, 519–523. doi:10.1016/j.gaitpost.2010.07.013
Linet, M. S., Slovis, T. L., Miller, D. L., Kleinerman, R., Lee, C., Rajaraman, P., et al. (2012). Cancer risks associated with external radiation from diagnostic imaging procedures. CA A Cancer J. Clin. 62, 75–100. doi:10.3322/caac.21132
Lopez-Lopez, D., Vilar-Fernandez, J. M., Barros-Garcia, G., Losa-Iglesias, M. E., Palomo-Lopez, P., Becerro-De-Bengoa-Vallejo, R., et al. (2018). Foot arch height and quality of life in adults: A strobe observational study. Int. J. Environ. Res. Public Health 15, 1555. doi:10.3390/ijerph15071555
Mckeon, P. O., Hertel, J., Bramble, D., and Davis, I. (2015). The foot core system: A new paradigm for understanding intrinsic foot muscle function. Br. J. Sports Med. 49, 290. doi:10.1136/bjsports-2013-092690
Oleksy, Ł., Mika, A., Łukomska-Górny, A., and Marchewka, A. (2010). Intrarater reliability of the Foot Posture Index (FPI-6) applied as a tool in foot assessment in children and adolescents. Med. Rehabil. 14, 18–28.
Pehlivan, O., Cilli, F., Mahirogullari, M., Karabudak, O., and Koksal, O. (2009). Radiographic correlation of symptomatic and asymptomatic flexible flatfoot in young male adults. Int. Orthop. 33, 447–450. doi:10.1007/s00264-007-0508-5
Prasarn, M. L. (2014). Commentary on: Intraoperative fluoroscopy, portable X-ray, and CT: Patient and operating room personnel radiation exposure in spinal surgery. Spine J. 14, 2992–2994. doi:10.1016/j.spinee.2014.07.006
Qian, Z., Jiang, Z., Wu, J., Chang, F., Liu, J., Ren, L., et al. (2021). Morphology and mechanical properties of plantar fascia in flexible flatfoot: A noninvasive in vivo study. Front. Bioeng. Biotechnol. 9, 727940. doi:10.3389/fbioe.2021.727940
Romero-Morales, C., Martin-Llantino, P. J., Calvo-Lobo, C., Palomo-Lopez, P., Lopez-Lopez, D., Pareja-Galeano, H., et al. (2019). Comparison of the sonographic features of the achilles tendon complex in patients with and without achilles tendinopathy: A case-control study. Phys. Ther. Sport 35, 122–126. doi:10.1016/j.ptsp.2018.12.003
Romero-Morales, C., Bravo-Aguilar, M., Ruiz-Ruiz, B., Almazan-Polo, J., Lopez-Lopez, D., Blanco-Morales, M., et al. (2021). Current advances and research in ultrasound imaging to the assessment and management of musculoskeletal disorders. Dis. Mon. 67, 101050. doi:10.1016/j.disamonth.2020.101050
Schillizzi, G., Alviti, F., D'ercole, C., Elia, D., Agostini, F., Mangone, M., et al. (2020). Evaluation of plantar fasciopathy shear wave elastography: A comparison between patients and healthy subjects. J. Ultrasound 24, 417–422. doi:10.1007/s40477-020-00474-7
Shibuya, N., Jupiter, D. C., Ciliberti, L. J., Vanburen, V., and La Fontaine, J. (2010). Characteristics of adult flatfoot in the United States. J. Foot Ankle Surg. 49, 363–368. doi:10.1053/j.jfas.2010.04.001
Sung, P. S. (2016). The ground reaction force thresholds for detecting postural stability in participants with and without flat foot. J. Biomech. 49, 60–65. doi:10.1016/j.jbiomech.2015.11.004
Taher, F., Hughes, A. P., Sama, A. A., Zeldin, R., Schneider, R., Holodny, E. I., et al. (2013). 2013 young investigator award winner: How safe is lateral lumbar interbody fusion for the surgeon? A prospective in vivo radiation exposure study. Spine 38, 1386–1392. doi:10.1097/BRS.0b013e31828705ad
Tas, S., and Cetin, A. (2019). An investigation of the relationship between plantar pressure distribution and the morphologic and mechanic properties of the intrinsic foot muscles and plantar fascia. Gait Posture 72, 217–221. doi:10.1016/j.gaitpost.2019.06.021
Van Der Worp, H., Van Ark, M., Roerink, S., Pepping, G. J., Van Den Akker-Scheek, I., and Zwerver, J. (2011). Risk factors for patellar tendinopathy: A systematic review of the literature. Br. J. Sports Med. 45, 446–452. doi:10.1136/bjsm.2011.084079
Wang, K., Liu, J., Wu, J., Qian, Z., Ren, L., and Ren, L. (2019). Noninvasive in vivo study of the morphology and mechanical properties of plantar fascia based on ultrasound. IEEE Access 7, 53641–53649. doi:10.1109/access.2019.2909409
Wearing, S. C., Smeathers, J. E., Urry, S. R., Hennig, E. M., and Hills, A. P. (2006). The pathomechanics of plantar fasciitis. Sports Med. 36, 585–611. doi:10.2165/00007256-200636070-00004
Keywords: flatfoot, plantar fascia angle, calcaneal pitch angle, medial cuneiform height, diagnosis
Citation: Jiang Z, Zhang Q, Ren L and Qian Z (2022) Non-invasive and quantitive analysis of flatfoot based on ultrasound. Front. Bioeng. Biotechnol. 10:961462. doi: 10.3389/fbioe.2022.961462
Received: 04 June 2022; Accepted: 09 August 2022;
Published: 06 September 2022.
Edited by:
Suvash C. Saha, University of Technology Sydney, AustraliaReviewed by:
Daniel López-López, Universidade da Coruña, SpainCopyright © 2022 Jiang, Zhang, Ren and Qian. This is an open-access article distributed under the terms of the Creative Commons Attribution License (CC BY). The use, distribution or reproduction in other forums is permitted, provided the original author(s) and the copyright owner(s) are credited and that the original publication in this journal is cited, in accordance with accepted academic practice. No use, distribution or reproduction is permitted which does not comply with these terms.
*Correspondence: Zhihui Qian, emhxaWFuQGpsdS5lZHUuY24=; Lei Ren, bGVpLnJlbkBtYW5jaGVzdGVyLmFjLnVr
Disclaimer: All claims expressed in this article are solely those of the authors and do not necessarily represent those of their affiliated organizations, or those of the publisher, the editors and the reviewers. Any product that may be evaluated in this article or claim that may be made by its manufacturer is not guaranteed or endorsed by the publisher.
Research integrity at Frontiers
Learn more about the work of our research integrity team to safeguard the quality of each article we publish.